
Chapter 3: Comparison of key findings by program type
Official title: Evaluation of the Labour Market Development Agreements
This section provides an overview of the key findings from the incremental impact analysis for Skills Development, Targeted Wage Subsidies, Job Creation Partnerships and Employment Assistance Services for both active and former EI claimant participants who started participation in the 2002-2005 period.
Overall, incremental impacts demonstrate that LMDA programs and services are improving the labour market attachment of participants, including youth and older workers. As well, social benefits of participation exceeded the cost of investments for most interventions over time. Finally, providing Employment Assistance Services interventions earlier during an EI claim (first four weeks) produced larger impacts on earnings and employment and facilitated earlier return to work. This demonstrates the importance of targeting early participation of EI active claimants.
Program participants have a higher probability of being employed than comparison group members
As shown in figure 11, active EI claimants who participated in Skills Development, Targeted Wage Subsidies, Job Creation Partnerships and Employment Assistance Services had higher probability of being employed (in other words, increased their incidence of employment) compared to similar non-participants. As well, former EI claimants who participated in Skills Development, Targeted Wage Subsidies and Job Creation Partnerships had higher probability of being employed compared to former EI claimants who received low intensity interventions under Employment Assistance Services.
It is noted that Employment Assistance Services are relatively modest activities such as counselling, job search assistance and case management. By themselves, they are not expected to lead to substantial effects on labour market outcomes. However, as demonstrated in the report, providing Employment Assistance Services earlier during the EI claim (first 4 weeks) generates significantly greater returns (see Figure 10 in sub-section 2.7.4).
Figure 11 illustrates the probability of being employed (in percentage points) for active and former employment insurance claimants relative to non-participants by program type.
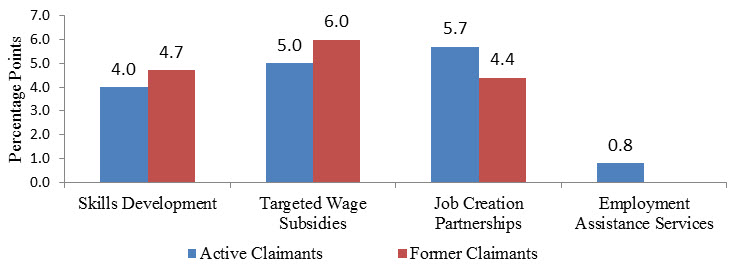
Figure 11 -Text description
| Percentage points | Skills Development | Targeted Wage Subsidies | Job Creation Partnership | Employment Assistance Services |
|---|---|---|---|---|
| Active claimants | 4 | 5 | 5.7 | 0.8 |
| Former claimants | 4.7 | 6 | 4.4 | n/a |
The incidence of employment reported in Figure 11 were estimated using separate models aimed to produce an annual average. These estimates do not represent an arithmetic average of the annual incidence of employment estimates reported in the annexes.
Increased earnings for participants compared to comparison group members
As shown in figure 12, active EI claimants who participated in Skills Development, Targeted Wage Subsidies and Job Creation Partnerships increased their employment earnings compared to similar non-participants. As well, former EI claimants who participated in Skills Development, Targeted Wage Subsidies and Job Creation Partnerships increased their employment earnings compared to former EI claimants who received Employment Assistance Services exclusively.
As already noted, Employment Assistance Services are relatively modest activities and, by themselves, are not expected to lead to substantial effects on labour market outcomes. In other words, EAS aims to support the return to work of unemployed participants and not necessarily to secure a better paying job than pre-participation. However, as demonstrated in the report, providing Employment Assistance Services earlier during the EI claim (first 4 weeks) generates significantly greater returns.
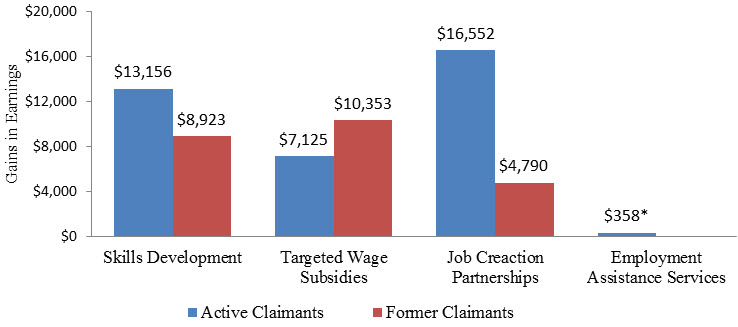
Figure 12 -Text description
| Gains in earnings | Skills Development | Targeted Wage Subsidies | Job Creation Partnership | Employment Assistance Services |
|---|---|---|---|---|
| Active claimants | $13,156 | $7,125 | $16,552 | $358* |
| Former claimants | $8,923 | $10,353 | $4,790 | n/a |
* The incremental impact on earnings for Employment Assistance Services participants is not statistically significant at the 95% level.
LMDA are also improving the probability of employment and the earnings of youth and older worker participants
Incremental impacts demonstrate that active and former EI claimants who were youth and older workers, and who participated in Skills Development, Targeted Wage Subsidies, Job Creation Partnerships and Employment Assistance Services increased the probability of employment compared to comparison group members. Older worker participants experienced consistently higher impact on the incidence of employment than youth participants.
With the exception of former EI claimant who were older workers and who participated in Job Creation Partnerships, incremental impacts also demonstrate that active and former EI claimants who were youth and older workers, and who participated in Skills Development, Targeted Wage Subsidies, Job Creation Partnerships and Employment Assistance Services increased their employment earnings compared to comparison group members (see Figures 13 and 14). Among active claimants, youth who participated in Job Creation Partnerships and older workers who participated in Skills Development had the largest cumulative gain in earnings. This suggests that providing work experience to youth and training to older workers yield strongest results.
Figure 13 illustrates the incremental cumulative gains in employment earnings for active and former employment insurance claimants who were youth by program type.
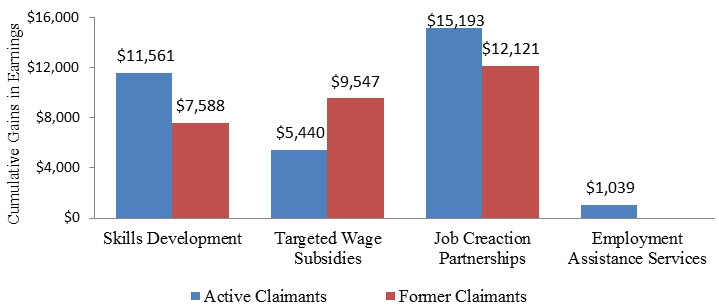
Figure 13 -Text description
| Cumulative gains in earnings | Skills Development | Targeted Wage Subsidies | Job Creation Partnership | Employment Assistance Services |
|---|---|---|---|---|
| Active claimants | $11,561 | $5,440 | $15,193 | $1,039 |
| Former claimants | $7,588 | $9,547 | $12,121 | n/a |
Figure 14 presents the incremental cumulative gains in employment earnings for active and former employment insurance claimants who were older workers by program type.
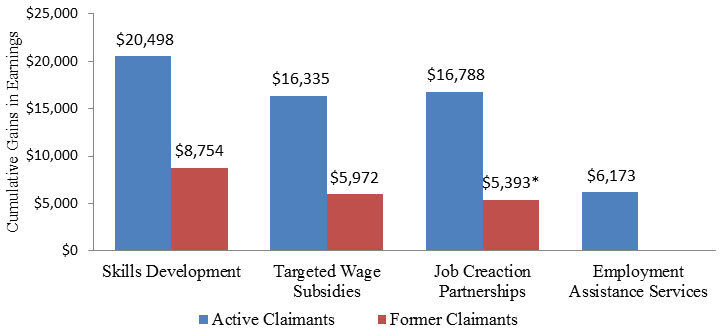
Figure 14 -Text description
| Cumulative gains in earnings | Skills Development | Targeted Wage Subsidies | Job Creation Partnership | Employment Assistance Services |
|---|---|---|---|---|
| Active claimants | $20,498 | $16,335 | $16,788 | $6,173 |
| Former claimants | $8,754 | $5,972 | $5,393* | n/a |
* The incremental impact on earnings for former claimants who participated in Job Creation Partnerships is not statistically significant at the 95% level.
The use of EI is reduced for most active claimants. While EI use increased for former claimants, it can be argued that this reflects an increase in labour market attachment since the incremental impacts on employment earnings and incidence of employment are positive and given the decrease in the use of social assistance.
As shown in figure 15, active EI claimants who participated in Skills Development, Job Creation Partnerships and Employment Assistance Services decreased their use of EI compared to similar non-participants. It is not surprizing to observe an increase in EI use for active claimants who participated in Targeted Wage Subsidies since participants build entitlement to EI while working. Active claimants decreased their use of social assistance benefits with the exception of participants in Employment Assistance Services. However, as previously stated, the relatively modest activities provided under Employment Assistance Services are not expected to lead to substantial effects on participants’ labour market outcomes.
Figure 15 presents the incremental impacts on the cumulative use of employment insurance and social assistance for active employment insurance claimants by program type.
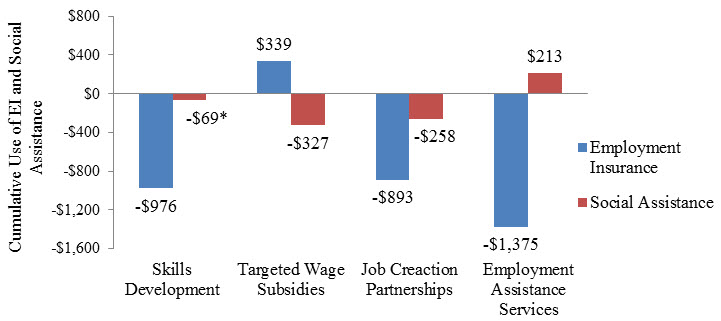
Figure 15 -Text description
| Cumulative use of EI and Social Assistance | Skills Development | Targeted Wage Subsidies | Job Creation Partnership | Employment Assistance Services |
|---|---|---|---|---|
| Employment Insurance | -$976 | $339 | -$893 | -$1,375 |
| Social Assistance | -$69* | -$327 | -$258 | $213 |
* The incremental impact on Social Assistance use for active claimants who participated in Skills Development is not statistically significant at the 95% level.
As shown in Figure 16, former claimants who participated in the program between 2002 and 2005 increased their use of EI following participation. This indicates the inability of some former claimants to maintain the employment secured in the short-term. It can also be argued that the increase in EI use is an indication of increase labour market attachment for this client group since they did experience increases in employment earnings and incidence of employment as well as a decrease in the use of social assistance. As a reminder, former claimants are participants for whom the EI benefit period ended up to three years pre-participation.
Figure 16 presents the incremental impacts on the cumulative use of employment insurance and social assistance for former employment insurance claimants by program type.
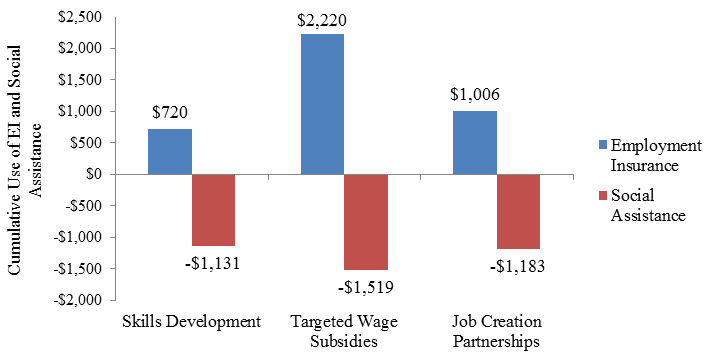
Figure 16 -Text description
| Cumulative use of EI and Social Assistance | Skills Development | Targeted Wage Subsidies | Job Creation Partnership |
|---|---|---|---|
| Employment Insurance | $720 | $2,220 | $1,006 |
| Social Assistance | -$1,131 | -$1,519 | -$1,183 |
Social benefits of participation exceeded costs of investments for most interventions
As shown in Table 4, social benefits to participation exceeded investment costs in a period ranging between the 2nd year of program participation to about 10 years after participation. This excludes former claimants who participated in Job Creation Partnerships for whom the investment costs are not likely to be recouped before 25 years. However, this group represented only 0.3% of new EBSM interventions in 2014-2015.
| Skills Development | Targeted Wage Subsidies | Job Creation Partnership | Employment Assistance Services | |
|---|---|---|---|---|
| Active claimants | 7.4 | 5.9 | 5.9 | 10.9 |
| Former claimants | 8.6 | 2nd participation year | Over 25 years | n/a |