
Evaluation of the Old Age Security Program: Phase 1
Official title: Evaluation of the Old Age Security Program: Phase 1, January 2018
On this page
- List of abbreviations
- Executive summary
- Management response
- 1. Introduction
- 2. Background
- 3. Labour market participation of OAS beneficiaries
- 4. GIS top-up and the income of seniors
- 5. OAS administrative costs
- 6. Readiness of the department to assess OAS service delivery quality
- 7. Conclusions and recommendations
- Appendix 1: Evaluation questions
- Appendix 2: Summary of studies conducted in support of the evaluation
- Appendix 3: References
Alternate formats

Evaluation of the Old Age Security Program: Phase 1 [PDF - 723 KB]
Large print, braille, MP3 (audio), e-text and DAISY formats are available on demand by ordering online or calling 1 800 O-Canada (1-800-622-6232). If you use a teletypewriter (TTY), call 1-800-926-9105.
List of abbreviations
ALW: Allowances
CPP: Canada Pension Plan
EI: Employment Insurance
ESDC: Employment and Social Development Canada
GIS: Guaranteed Income Supplement
OAS: Old Age Security
QPP: Quebec Pension Plan
Executive summary
This evaluation report examines themes pertaining to the Old Age Security (OAS) program, specifically the factors that have influenced the labour market participation of seniors, including the impact of increasing the earnings exemption on recipients of the Allowances, the contribution of the Guaranteed Income Supplement (GIS) top-up to the income of seniors, the administrative costs of the OAS program from fiscal year 2007 to 2008 to fiscal year 2016 to 2017, and the readiness of the Department to assess changes in the quality of service.
The OAS program includes the OAS pension, the GIS and the Allowances. The OAS pension is a basic pension to which most seniors aged 65 years and older are entitled. The OAS program provides additional support through the income-tested GIS to low-income seniors with little or no other income. In addition, the Allowance and the Allowance for the Survivor are paid to low-income individuals aged 60 to 64 who are the spouses or common-law partners of GIS recipients or who are widows or widowers.
This report is the first of 2 phased reports on the Evaluation of the OAS Program. The second report is scheduled to be completed in the fall of 2018 and will examine the Allowances and the deferral of the OAS pension. These 2 evaluation reports build on previous evaluations that examined other themes, such as the program’s main outcomes: contributing to the income of seniors and poverty reduction. Also, an evaluation of the GIS take-up is currently underway and will examine the barriers to take-up among different groups of seniors, including lack of awareness. In this context the GIS take-up evaluation will examine the effectiveness of actions taken by the Department to reach seniors, recognizing that many barriers are at play, for example, language and literacy barriers, limited understanding of the benefit and of the application process, and other difficulties when applying for the benefit.
Main findings
Labour market participation of OAS beneficiaries
What factors may explain the changes in the labour market participation of seniors in general and more specifically with regards to OAS and GIS recipients?
In January 2017, the OAS pension provided benefits to 5.9 million seniors. In 2014, there were 1.1 million seniors (65+) working and 1.3 million near-seniors (60 to 64) who were working. Employment rates of OAS pension recipients increased from 12% in 2002 to 18% in 2014.Footnote 1 While GIS recipients had lower employment rates during this period, their employment rates nevertheless increased from 5% in 2002 to 7% of GIS recipients in 2014. Finally, the employment rate of Allowances recipients also increased significantly during this period, from 15% in 2002 to 24% in 2014. Overall, employment rates of men were higher than those of women, with both increasing throughout the period.
Due to data limitations, the evaluation did not examine if OAS beneficiaries worked part-time or full-time. Instead average employment income was examined. Despite this analysis, the understanding of the extent of changes in employment effort is limited in this report.
The recent increase in the labour market participation of older workers in Canada can be explained by many factors that are well documented in recent literature. However, this literature examines older workers in general and does not specifically discuss OAS recipients. Factors mentioned include more rapid employment growth in the service sector providing opportunities that are more accessible to older workers. Also, work has become less physically demanding due to technological advances in many sectors, providing greater opportunities for longer working careers. Gradually improved health levels have helped more people want to stay active as they see an increased lifespan and length of retirement. Knowledge-based work that is more interesting and satisfying and flexible working arrangements have helped to encourage longer careers. The literature also identifies trends of rising education levels and diminishing pension plan coverage of older workers as contributing to the increases in labour force participation, as workers with more education or without a pension plan tend to retire at a later age.Footnote 2
In addition, the rules of the OAS program can potentially influence the labour force participation of program beneficiaries. For example, the reduction rates on GIS and Allowances benefits that are necessary to ensure benefits are targeted to those with the most need also diminish the net gains of employment, as benefits are reduced for every dollar of other income. However, policies such as the $3,500 GIS earnings exemption for GIS and Allowances recipients and the voluntary deferral of the OAS pension have the potential to positively influence labour force participation. The voluntary deferral provision will be examined in the second phase of the evaluation.
With reference to the earnings exemption, empirical results showed that the increase in the earnings exemption in 2008 had a positive impact on the employment rate of recipients of the Allowances, with an increase of 1 percentage point on employment rates. Results also showed an increase of about 15% in real average employment income among working recipients of the GIS (aged 65+) and of the Allowances (aged 60 to 64).Footnote 3
Guaranteed Income Supplement (GIS) top-up
What was the effect of the introduction of the GIS top-up on the income of seniors? How were different vulnerable groups of seniors affected (for example, seniors living in urban centers)?
The GIS top-up was introduced in Budget 2011 and therefore was not examined in the previous OAS evaluation. The top-up provides additional income to the lowest-income recipients of the GIS and the Allowances. The average top-up received in 2014 was $430 per year, with almost two thirds of top-up recipients receiving over $400. There are almost 700,000 recipients of the GIS top-up each year, representing a third of GIS and Allowance recipients.
Top-up recipients have access to limited financial resources, most of which comes from OAS benefits. Over half of top-up recipients had less than $3,000 in income other than OAS benefits and almost 40% had between $3,000 and $9,000 in other sources of income.
As the top-up is income-tested, by design it reaches the most vulnerable seniors. About 12% of seniors received the GIS top-up in 2014. This incidence was higher among single seniors, women, older seniors (85+) and seniors living in the largest urban centers of Canada (Vancouver, Calgary, Edmonton, Toronto, Ottawa and Montreal). For the average top-up recipients of these sub-groups, the top-up was equivalent to 11% to 15% of their other sources of income (in other words, other than OAS benefits).
Service delivery
What are the Department’s administrative expenditures and how have they changed over time, in particular, in light of service delivery changes?
The aggregate amount of OAS program benefits paid has increased from $33 billion in fiscal year 2007 to 2008 to $50 billion in fiscal year 2016 to 2017, a 51% increase. Population aging has brought an increase in the number of OAS beneficiaries and, consequently, an increase in the volume of transactions over time. During the same period, administrative costs of the OAS program (excluding costs for internal servicesFootnote 4) have increased from $118 million in fiscal year 2007 to 2008 to $177 million in fiscal year 2016 to 2017, a 50% increase (or an average of 4.6% per year), thus having a similar growth rate to that of the aggregate amount of OAS benefits paid.
To provide context, it is important to note that the quality of the administrative cost data has increased in the last decade with enhancements made to the costing methodology, including the implementation of a new financial system in fiscal year 2014 to 2015. These changes over time are making some year-to-year comparisons sometimes difficult to interpret. An important finding in this evaluation is that the financial data available limits a comprehensive understanding of the relationship between service delivery changes and costs.
How ready is the Department to assess changes in the quality of service since 2005 (for example, accessibility, accuracy and timeliness), in light of service delivery changes?
Some of the most relevant indicators of service delivery quality are monitored by ESDC, notably, access to Service Canada officers, the timeliness of benefit receipt, take-up, and payment accuracy. The main challenge resides in indicators of client satisfaction, for which the last survey was conducted in 2010.
Recent enhancements to service delivery include the introduction of automatic enrolment for the OAS pension, efforts to broaden services available online,Footnote 5 as well as changes to the interactive voice response system for specialized call centers. For instance, in fiscal year 2016 to 2017, approximately 45% of new OAS pension beneficiaries did not need to apply to receive their pension because of automatic enrolment. However, it is not known to what extent this change relates to client satisfaction.
The main service delivery quality indicators indicate that in fiscal year 2016 to 2017: 81% of Service Canada in-person clients were served within 25 minutes, 82% of specialized calls were answered by a Canada Pension Plan (CPP)/OAS agent within 10 minutes (among those accessing the queue to wait for an agent), 69% of calls that tried to reach an agent were able to access a queue to wait for an agent in CPP/OAS specialized call centers, 87% of OAS pension benefits were paid within the first month of entitlement and OAS benefits had a 99% accuracy rate.
The current set of service delivery quality indicators, while relevant to the quality of service, reflects mainly a provider’s perspective on the quality of service delivery. Therefore, complementary qualitative and quantitative approaches should be used to assess seniors’ experiences and satisfaction with OAS service delivery. For example, client satisfaction surveys were conducted on behalf of Service Canada in 2006, 2008 and 2010. However, the discontinuation of the survey in 2010 has led to an important knowledge gap since then.
Recommendation
- Consider regularly monitoring client satisfaction with OAS service delivery, including monitoring client satisfaction of the various service delivery channels.
Management response
Recommendation:
- Consider regularly monitoring client satisfaction with OAS service delivery, including monitoring client satisfaction of the various service delivery channels.
Management Response (MR):
The Department agrees with the recommendation to consider regularly monitoring client satisfaction with OAS service delivery, including monitoring client satisfaction of the various service delivery channels.
In recognition that the Department had not undertaken client satisfaction surveys recently, the decision to launch a Client Experience Survey was approved in June 2016. The resulting survey was designed to collect baseline data on client experience for multiple service channels and programs including EI, CPP, CPP-D, OAS, GIS and SIN. The objectives were to produce reliable, representative data on the service experience for performance reporting; provide broad diagnostic insights on the current and potential state of service delivery; and provide a data source for the Evaluation on Providing Information and Services to Canadians. The survey was conducted in fall 2017 with the analysis and findings expected to be completed in early 2018.
The Department also recognizes the importance of consulting with clients and stakeholders to inform improvements to OAS service delivery. For example, under the OAS Service Improvement Strategy (OAS SIS), a multi-year project which is modernizing the delivery of the OAS program, the Department is consulting with OAS clients and stakeholders on a variety of topics including redesigned application forms, various communication products, and with GIS clients on barriers to applying for the benefit. In addition, as part of the review and updating of service standards for the delivery of the OAS program, clients are being consulted to ensure their views and expectations are reflected in any updated service standards for the program.
1. Introduction
The Old Age Security (OAS) program is the first pillar of Canada’s 3 pillar retirement income system, providing a basic pension to nearly all seniors (via the OAS pension), a supplement to low-income seniors (via the Guaranteed Income Supplement (GIS)) and benefits to low-income near-seniors who are widows, widowers or spouses of GIS recipients (via the Allowances). The OAS program provides a modest base upon which individuals may add income from the 2 other pillars of the retirement income system, namely the Canada or Quebec Pension Plan (C/QPP) and privately-administered employer pension plans and personal savings such as Registered Retirement Savings Plans (RRSPs).
The evaluation of the OAS program is scheduled in 2 phases from 2015 to 2018, with 2 reports presented to senior management. The current report is Phase 1 of the evaluation which focuses on the labour market participation of OAS beneficiaries, the GIS top-up and service delivery. It examines the following evaluation questions:
- What factors may explain the changes in the labour market participation of seniors in general and more specifically with regards to OAS and GIS recipients?
- What was the effect of the introduction of the GIS top-up on the income of seniors? How were different vulnerable groups of seniors affected (for example, seniors living in urban centers)?
- What are the Department’s administrative expenditures and how have they changed over time, in particular, in light of service delivery changes?
- How ready is the Department to assess changes in the quality of service since 2005 (for example, accessibility, accuracy and timeliness), in light of service delivery changes?
Phase 2 of the evaluation, scheduled to be completed in 2018, will focus on the Allowances and the voluntary deferral of the OAS pension, and therefore will not revisit themes discussed in Phase 1. The extent to which the Allowances are meeting the needs of Canadians has not been evaluated in the last 20 years, and the composition of beneficiaries may have changed significantly since then. In addition, the deferral of the OAS pension has not been evaluated since it was introduced in 2013. The second phase of the evaluation will examine the following evaluation questions:
- Do the Allowances continue to address a demonstrable need? Who are the beneficiaries of the Allowances and how has their profile changed over time?
- To what extent is Employment and Social Development (ESDC) prepared to monitor and assess the characteristics and patterns of seniors deferring their OAS pension?
Previous evaluations of the OAS program have examined several other issues related to the program. In particular, the 2012 OAS evaluation outlined the contribution of the program to the income of seniors and poverty reduction.Footnote 6 Also, an evaluation of GIS take-up is currently underway with summary reports scheduled to be completed in September 2018 and March 2019. The GIS take-up evaluation will examine how GIS take-up has changed since the last evaluation in 2010, including among vulnerable groups (for example, immigrants, Indigenous people, those living in remote communities, etc.), identify barriers to take-up among different groups of seniors, including lack of awareness. In this context, the GIS take-up evaluation will examine the effectiveness of actions taken by the Department to reach these groups, recognizing that many barriers are at play, for example, language and literacy barriers, limited understanding of the benefit and of the application process, and other difficulties when applying for the benefit.
1.1 Methodology and limitations
An Evaluability Assessment report for the evaluation of the OAS program was developed and defines the scope of the overall evaluation. A methodology document was also developed and provides details of the evaluation questions and the lines of evidence used to address them (see Appendix 1).
The current evaluation report includes results from a document review that examined service delivery indicators of the OAS program since 2005 (Section 6) and 2 separate data analysis studies using T1 income tax data from the Canada Revenue Agency and survey data from Statistics Canada’s National Household Survey (see Appendix 2). Results from the data analyses (which examine the GIS top-up and the labour market participation of seniors) are presented in Sections 3 and 4.
There are 3 main limitations to this evaluation report:
- The OAS administrative cost data used in the evaluation are not detailed enough to examine precisely the effect of specific service delivery changes on administrative costsFootnote 7 and do not include administrative costs related to internal services (for example, accommodation and information technology costs).Footnote 8 Therefore, only a partially completed answer can be provided.
- Data on individual amounts of the GIS top-up received had to be estimated using GIS amounts received and income variables. Even though many sources of data indicate amounts of GIS received, none indicate amounts of the GIS top-up received. Thus, results pertaining to the GIS top-up should be interpreted with this caveat in mind. Moreover, the analysis could not take into account the increase in the GIS top-up for single recipients that took effect in July 2016, as the data used for this study does not include data from 2016.
- The intensity of labour market participation was examined based on employment earnings. Ideally, the number of hours worked would be examined as well, to differentiate between part-time from full-time work. However, this information was not available in the Canada Revenue Agency data used for this study. Further research using Census data could examine hours of work as well.
2. Background
This section presents a general description of the OAS program. The program includes the OAS pension, the GIS and the Allowances. The OAS pension is a basic pension to which most seniors aged 65 years and older are entitled. The OAS program provides additional support through the income-tested GIS to low-income seniors with little or no other income. In addition, the Allowance and the Allowance for the Survivor are paid to low-income individuals aged 60 to 64 who are the spouses or common-law partners of GIS recipients or who are widows or widowers.
2.1 OAS pension
The OAS pension is paid to Canada’s seniors in recognition of the contribution they have made to Canadian society, the economy, and their community. In January 2017, the OAS pension provided benefits to 5.9 million seniors with the full basic pension amounting to $578.53 per month (or about $6,900 per year). All benefits under the OAS program are indexed quarterly.
Eligibility for the OAS pension is based on years of residence in Canada. In order to qualify, a person living in Canada at the time of application must be 65 years or older and have resided in Canada for at least 10 years after the age of 18.Footnote 9 The full basic OAS pension is payable to seniors who have resided in Canada for at least 40 years after age 18. A partial pension is paid to seniors who have lived in Canada for at least 10 years after age 18, and their benefits are prorated at the rate of one fortieth of the full pension for each complete year of residence.Footnote 10
The OAS Recovery Tax, which is part of the Income Tax Act, requires all higher-income pensioners to repay part, or all, of their OAS pension if their individual income exceeds a threshold. For the 2016 tax year, seniors must repay $0.15 for every dollar of income exceeding $73,756. Benefits are completely repaid when income reaches $119,615. The OAS Recovery Tax can be deducted at the source, but the final amount is determined when a pensioner files their income tax return each year.
2.2 Guaranteed Income Supplement
When seniors have little or no other income, the GIS can complement the OAS pension. In January 2017, GIS benefits were paid to 1.9 million low-income seniors and the GIS could reach $864.09 per month for single seniors and $520.17 per month for seniors who were married or in a common-law relationship (or up to about $10,400 or $6,200 per year respectively).Footnote 11 Adding the OAS pension and GIS, benefits can reach $17,300 and $13,200 per year respectively. Table 1 provides a breakdown of the maximum amounts of OAS benefits that one can receive as of January 2017.
| OAS benefits | Low-income seniors | Other seniors | Allowances recipients | |||
|---|---|---|---|---|---|---|
| Single | Couple | Single | Couple | Single (ALWS)* | Couple (ALW)** | |
| OAS pension | 578.53 | 1,157.06 | 578.53 | 1,157.06 | 0 | 578.53 |
| GIS top-up | 133.83 | 75.88 | 0 | 0 | 0 | 37.94 |
| Total GIS | 864.09 | 1,040.34 | 0 | 0 | 0 | 520.17 |
| Top-up on Allowances | 0 | 0 | 0 | 0 | 133.83 | 37.94 |
| Total Allowances | 0 | 0 | 0 | 0 | 1,309.67 | 1,098.70 |
| Total benefits | 1,442.62 | 2,197.40 | 578.53 | 1,157.06 | 1,309.67 | 2,197.40 |
- Source: Quarterly report of CPP and OAS monthly amounts and related figures - January to March 2017 (website accessed on March 8, 2017) and ESDC (2016d). Total benefits are calculations of the Evaluation Directorate.
- * Note that ALWS indicates recipients of the Allowance for the Survivor.
- ** ALW indicates recipients of the Allowance.
In order to be eligible for the GIS, a person must receive the OAS pension, be a legal resident of Canada and have income, or combined income for couples, below the maximum annual thresholds.Footnote 12 GIS benefits are reduced by $0.50 for every dollar of other income, other than the OAS pensionFootnote 13, until other income reaches $2,048 for single seniors and $4,096 for couples, then by $0.75 for every dollar of other income between $2,048 and $8,432 for single seniors and $4,096 and $7,648 for couples. When other income exceeds these amounts, GIS benefits are then reduced by $0.50 for every dollar of other income.Footnote 14 This means that single seniors qualified for the GIS with incomes up to $17,544 per year and up to $23,184 for senior couples in January 2017.Footnote 15
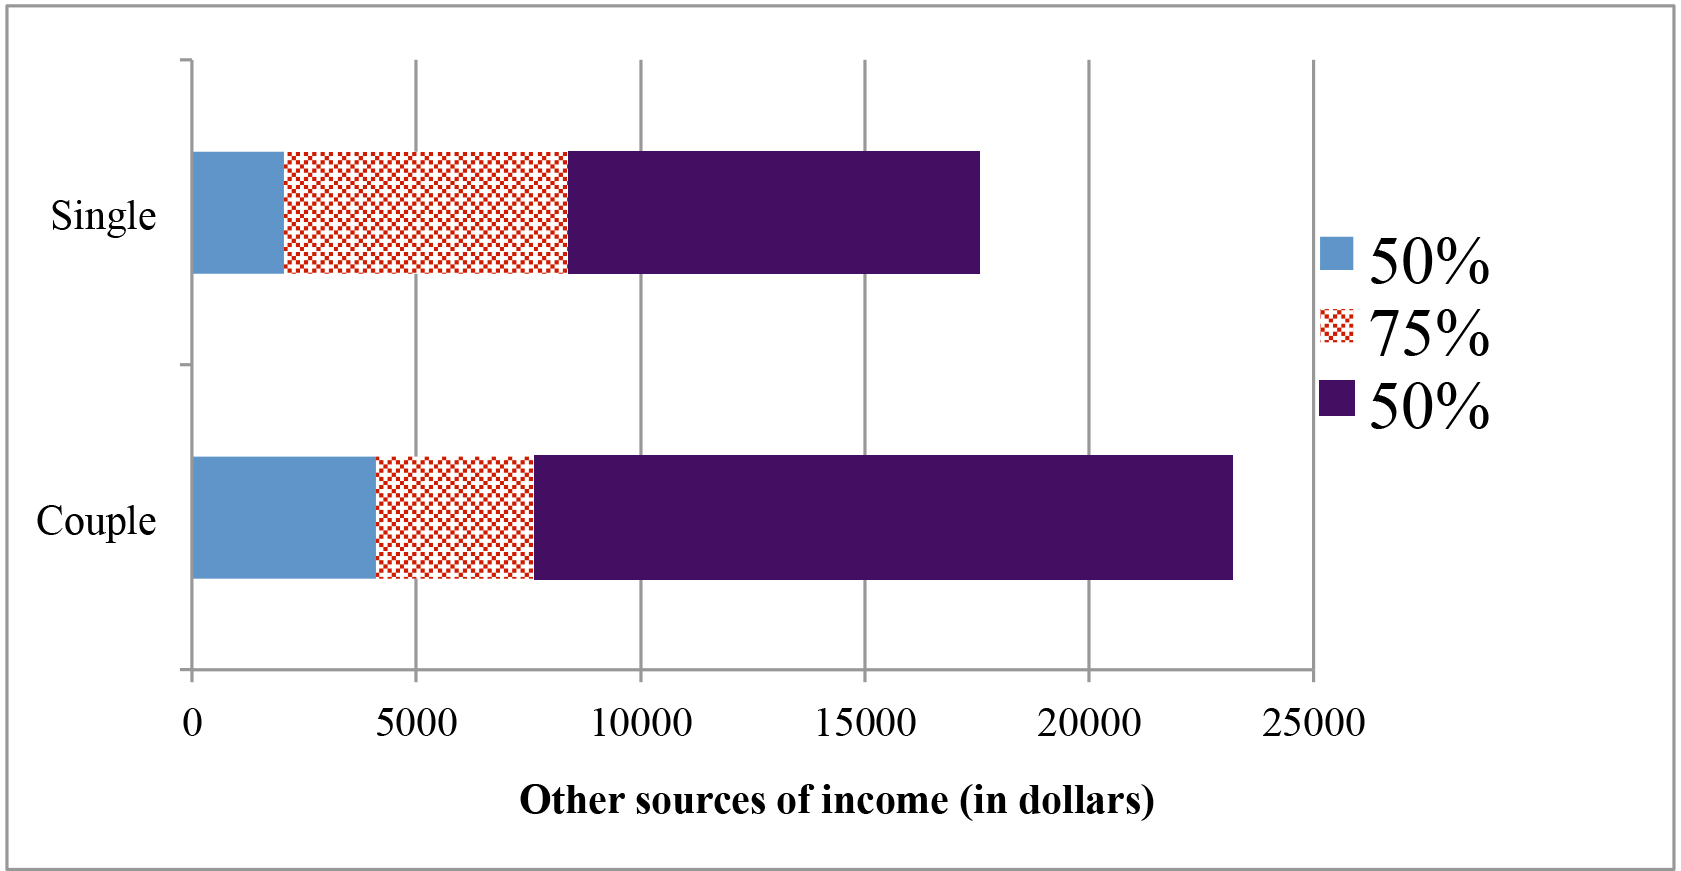
Figure 1 - Text version
| Reduction rates | Other sources of income ($) Single |
Other sources of income ($) Couple |
|---|---|---|
| 50% | 0 to 2048 | 0 to 4096 |
| 75% | 2048 to 8432 | 4096 to 7648 |
| 50% | 8432 to 17544 | 7648 to 23184 |
2.3 Allowances
The Allowances are designed to recognize the difficult circumstances faced by many low-income couples living on only one pension until the other spouse reaches age 65 and qualifies for his or her OAS pension, as well as by 60 to 64 year old low-income widows or widowers. In January 2017, the Allowance was paid to about 51,000 people and the Allowance for the Survivor to about 23,000 people. Allowances benefits can reach $1,098.70 per month for the Allowance and $1,309.67 per month for the Allowance for the Survivor (or about $13,200 and $15,700 per year respectively, based on January 2017 rates).
In order to qualify for the Allowances, a person must be 60 to 64 years old, be a legal resident of Canada and have resided in Canada for at least 10 years after the age of 18.Footnote 16 In addition, a person must be a low-income widow or widower to qualify for the Allowance for the Survivor, or the spouse or common-law partner of a recipient of the GIS to qualify for the Allowance.
Eligibility for the Allowances is also based on income, or combined income for couples. As indicated in Table 1, the Allowances provide a maximum benefit that is similar to the combined value of the OAS pension and GIS. Beneficiaries of the Allowances also see their benefits reduced for every dollar of other income, other than OAS benefits. Benefits are reduced by $0.50 to $1.00 for every dollar of other income. The reduction rate varies with the level of income, as with GIS benefits.
3. Labour market participation of OAS beneficiaries
This section examines the employment rates of seniors (65+), near-seniors (60 to 64) and OAS beneficiaries. More precisely, it examines recent trends in employment rates and factors that influenced these trends, to answer the following evaluation question:
- What factors may explain the changes in the labour market participation of seniors in general and more specifically with regards to OAS and GIS recipients?
Both seniors and near-seniors provide a significant contribution to the labour market in Canada. In 2014, there were 1.1 million seniors (65+) working and 1.3 million near-seniors (60 to 64) who were working. Average work income was $31,000 among seniors who worked and $47,000 among near-seniors who worked. OAS pension recipients who chose to work had average work income of $25,000 in 2014, while GIS and Allowances recipients who chose to work had average work incomes of $7,000 and $11,000 respectively.Footnote 17 The data used could not distinguish between full-time and part-time work, and determine to what extent differences in these averages are due to differences in hourly wages or in the number of hours of work.
Note that this section examines employment rates rather than labour market participation rates, in other words, this section examines the percentage that are working rather than the percentage that are working or looking for work, as individuals looking for work are not identified in the data used. Nevertheless, unemployed individuals looking for work represent a small percentage of this age group.Footnote 18
3.1 Recent trends in employment rates
Before presenting trends, Figure 2 shows how employment rates decrease with age. Employment rates are at their highest when people are in their thirties and forties, and they start decreasing significantly when people reach their sixties.
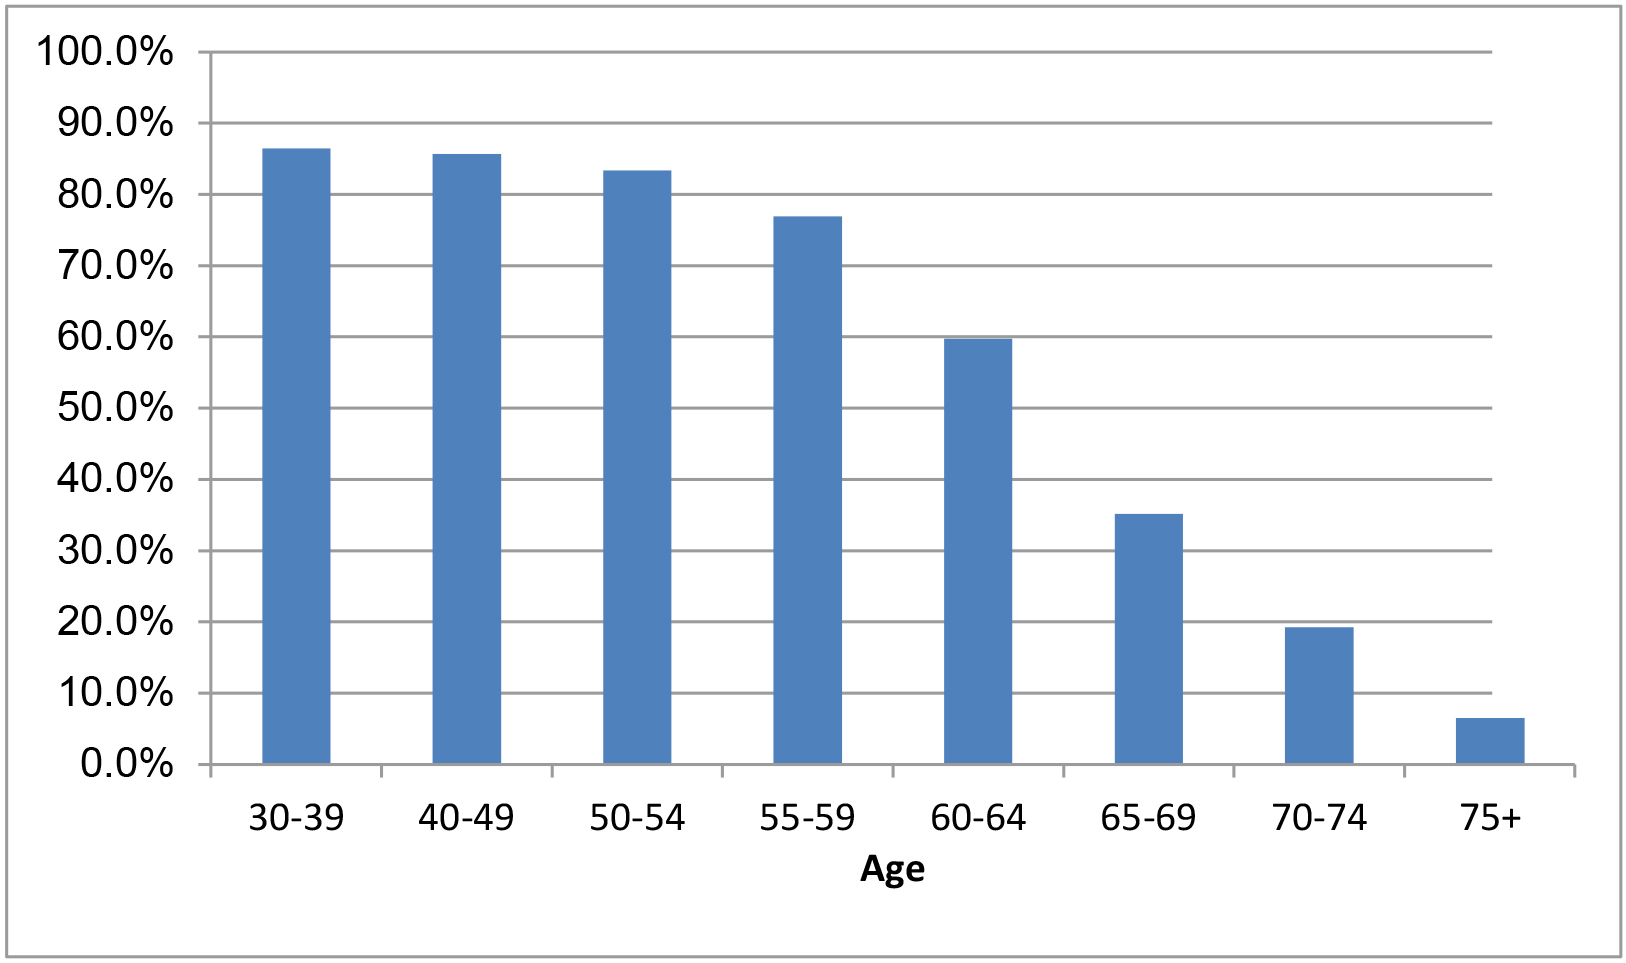
Figure 2 - Text version
| Age group | Employment rates |
|---|---|
| 30 to 39 | 86.5% |
| 40 to 49 | 85.7% |
| 50 to 54 | 83.4% |
| 55 to 59 | 76.9% |
| 60 to 64 | 59.7% |
| 65 to 69 | 35.2% |
| 70 to 74 | 19.3% |
| 75+ | 6.7% |
- Source: 10% sample of T1 file from the Canada Revenue Agency (33,956,913 observations).
This section presents recent trends in seniors’ and near-seniors’ employment rates, in other words, the percentage of people with employment income or self-employment revenue in the year. The employment rate of seniors (65+) has increased by over 50% since 2002, increasing from 12% of seniors in 2002 to 19% in 2014 (Figure 3), an increase of 7 percentage points. For near-seniors, aged 60 to 64 years old, there is also an increasing trend. In 2002, 50% of near-seniors were working, and this proportion reached 60% in 2014, an increase of 10 percentage points.Footnote 19
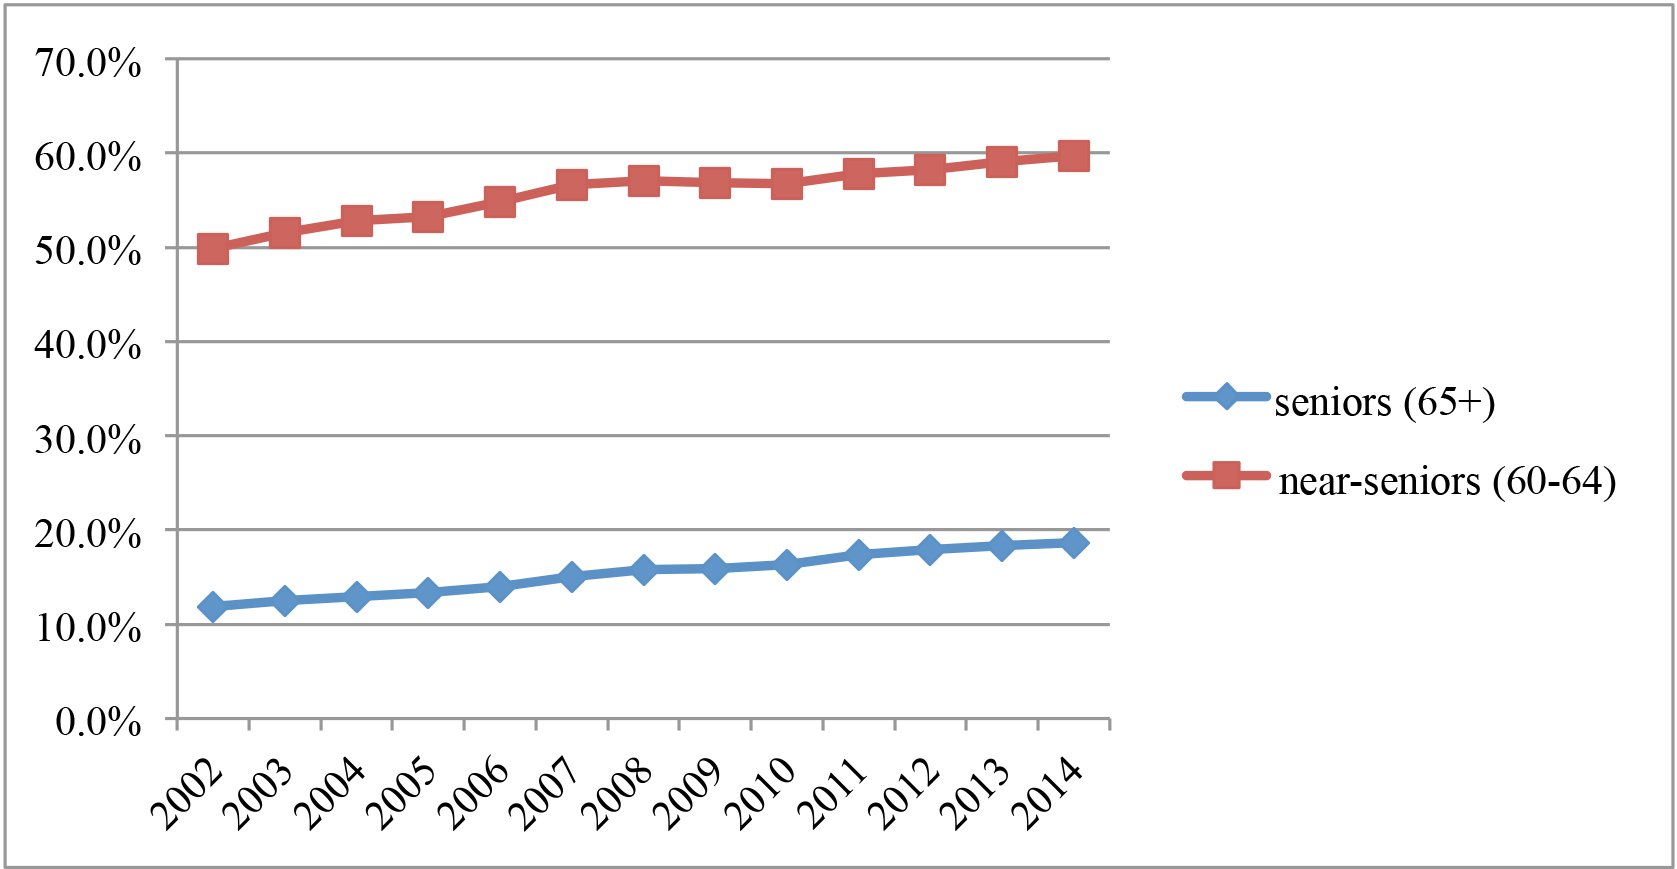
Figure 3 - Text version
| Year | Seniors (65+) | Near-seniors (60 to 64) |
|---|---|---|
| 2002 | 11.9% | 49.9% |
| 2003 | 12.5% | 51.6% |
| 2004 | 12.9% | 52.9% |
| 2005 | 13.3% | 53.2% |
| 2006 | 14.0% | 54.8% |
| 2007 | 15.0% | 56.6% |
| 2008 | 15.8% | 57.1% |
| 2009 | 15.9% | 56.9% |
| 2010 | 16.3% | 56.7% |
| 2011 | 17.4% | 57.9% |
| 2012 | 18.0% | 58.2% |
| 2013 | 18.4% | 59.1% |
| 2014 | 18.7% | 59.7% |
- Source: 10% sample of T1 file from the Canada Revenue Agency (8,434,625 observations of people aged 60+).
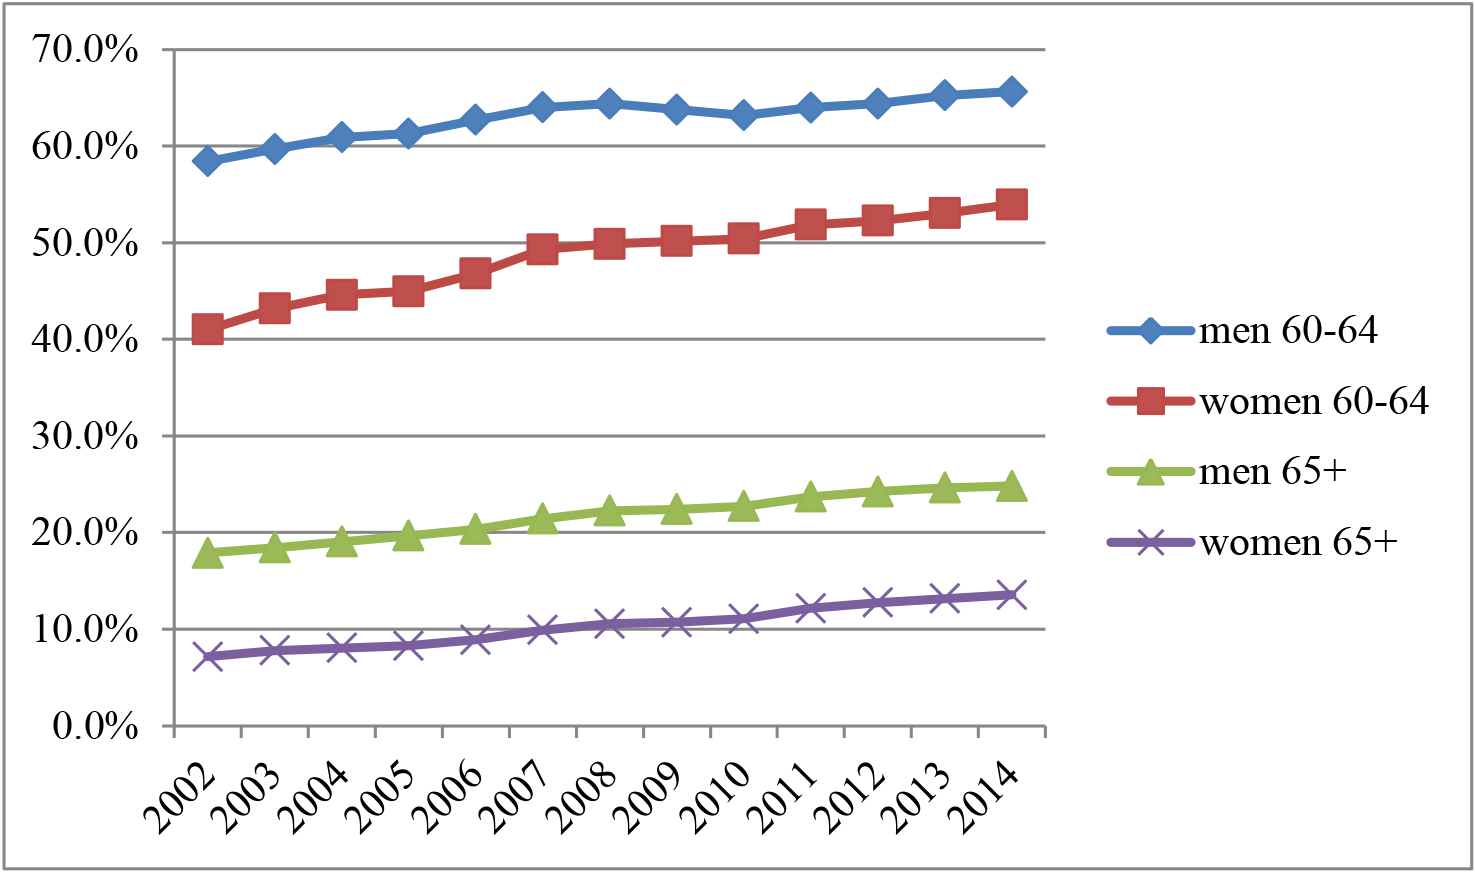
Figure 4 - Text version
| Year | Men 60 to 64 | Women 60 to 64 | Men 65+ | Women 65+ |
|---|---|---|---|---|
| 2002 | 58.4% | 41.0% | 17.9% | 7.2% |
| 2003 | 59.7% | 43.2% | 18.4% | 7.8% |
| 2004 | 60.9% | 44.6% | 19.1% | 8.1% |
| 2005 | 61.3% | 45.0% | 19.7% | 8.3% |
| 2006 | 62.7% | 46.8% | 20.4% | 8.9% |
| 2007 | 64.0% | 49.3% | 21.4% | 9.9% |
| 2008 | 64.4% | 49.9% | 22.2% | 10.5% |
| 2009 | 63.8% | 50.2% | 22.4% | 10.7% |
| 2010 | 63.2% | 50.4% | 22.7% | 11.1% |
| 2011 | 64.0% | 51.9% | 23.7% | 12.2% |
| 2012 | 64.4% | 52.3% | 24.2% | 12.8% |
| 2013 | 65.3% | 53.1% | 24.6% | 13.2% |
| 2014 | 65.6% | 54.0% | 24.8% | 13.6% |
- Source: 10% sample of T1 file from the Canada Revenue Agency (8,434,625 observations of people aged 60+).
The employment rates of women and men have followed similar increasing trends throughout this period, even though employment rates were higher for men than for women (Figure 4). In 2014, the employment rate of men was about 11 percentage points higher than for women, both among seniors and near-seniors.
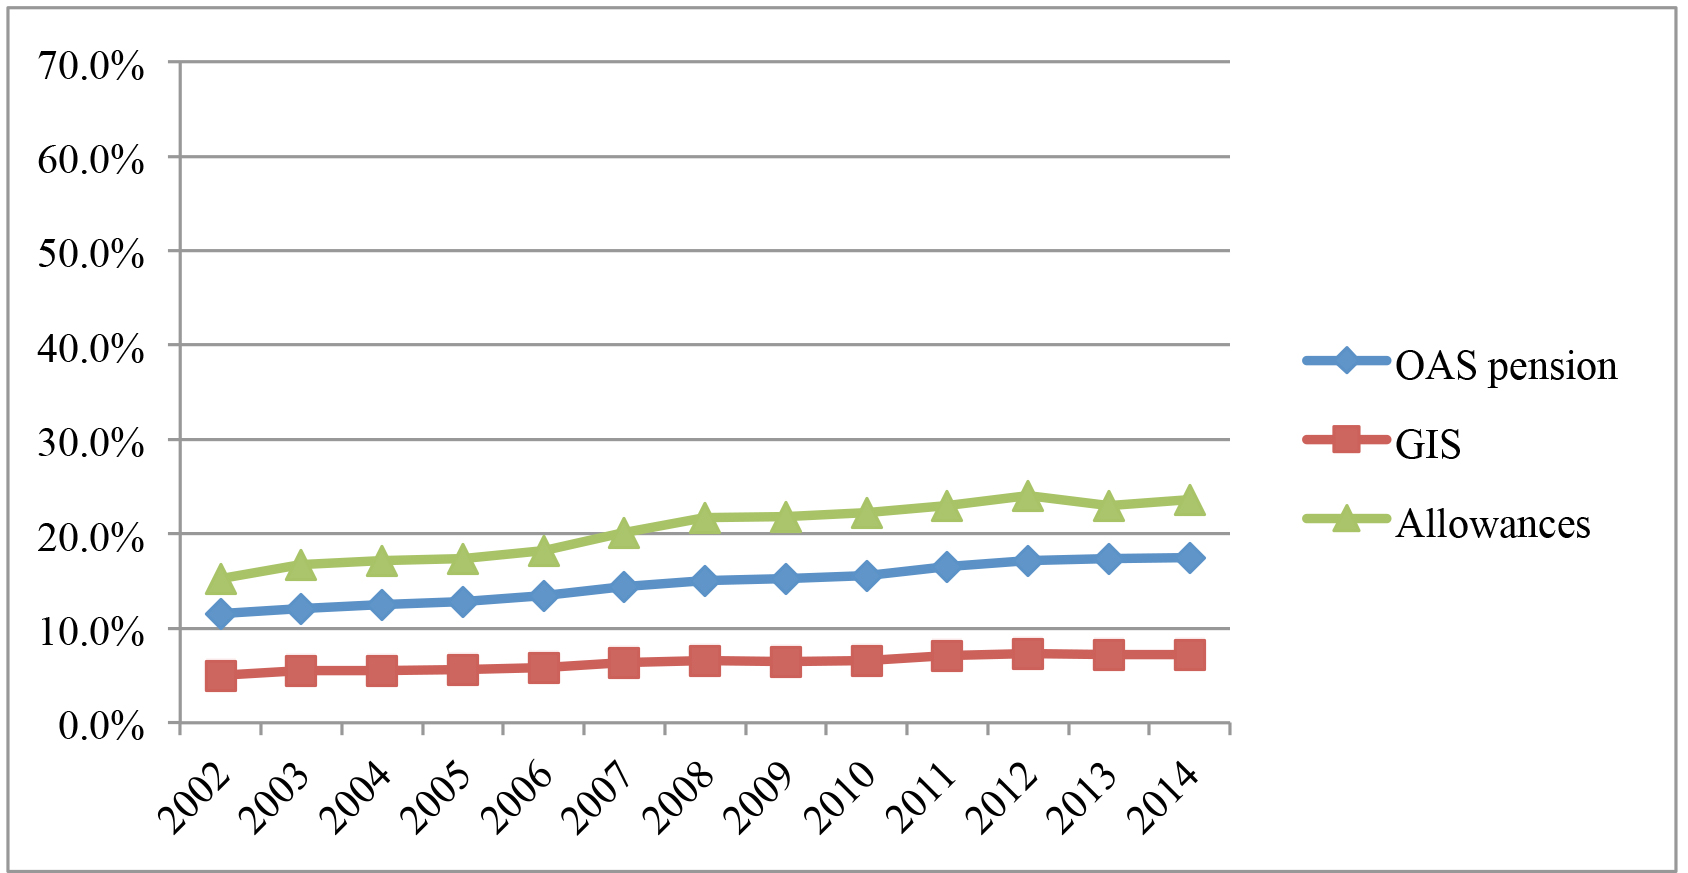
Figure 5 - Text version
| Year | OAS pension | GIS | Allowances |
|---|---|---|---|
| 2002 | 11.5% | 5.0% | 15.2% |
| 2003 | 12.1% | 5.5% | 16.7% |
| 2004 | 12.5% | 5.6% | 17.2% |
| 2005 | 12.9% | 5.7% | 17.4% |
| 2006 | 13.5% | 5.8% | 18.3% |
| 2007 | 14.4% | 6.4% | 20.2% |
| 2008 | 15.1% | 6.5% | 21.7% |
| 2009 | 15.2% | 6.5% | 21.8% |
| 2010 | 15.6% | 6.5% | 22.3% |
| 2011 | 16.6% | 7.1% | 23.0% |
| 2012 | 17.1% | 7.3% | 24.0% |
| 2013 | 17.4% | 7.2% | 23.0% |
| 2014 | 17.5% | 7.2% | 23.6% |
- Source: 10% sample of T1 file from the Canada Revenue Agency (8,434,625 observations of people aged 60+).
OAS pension recipients had employment rates that are very similar to rates of seniors in general (65+) as they accounted for about 96% of seniors. Employment rates of OAS pension recipients increased from 12% in 2002 to 18% in 2014 (Figure 5). GIS recipients had much lower employment rates. Employment rates nevertheless increased from 5% in 2002 to 7% of GIS recipients in 2014. Interestingly, married (or common-law) OAS pension recipients and GIS recipients were almost twice as likely to work as single recipients.
Labour force participation is more relevant for OAS pensioners, given the limited participation of GIS recipients. This is the case given employment rates presented above, but also given the significantly higher average work income of OAS pensioners who chose to work compared to GIS recipients who chose to work (results presented at the beginning of section 3).
The employment rates of recipients of the Allowances also increased significantly during this period. Employment rates increased from 15% of recipients in 2002 to 24% in 2014 (23% for women and 31% for men in 2014), increasing by over 50% throughout this period. Recipients of the Allowances had a lower attachment to the labour market than near-seniors in general whose employment rate reached 54% for women and 66% for men in 2014.
The employment rates of OAS pension recipients have increased for all age groups, with significant increases for those aged 65 to 69, 70 to 74 and 75 to 79 years old during this period (Figure 6). Employment rates were significantly higher for OAS pension recipients not in receipt of the GIS than for those receiving the GIS (23% vs. 7% in 2014). Differences are particularly important for younger age groups. For example, among those aged 65 to 69 in 2014, the employment rate was 16% for GIS recipients and 39% for those not receiving the GIS. Among those aged 70 to 74 in 2014, it was 9% for GIS recipients and 24% for those not receiving the GIS. Significant differences in employment rates of GIS recipients and those not receiving the GIS were observed throughout the period. More research could be done to examine reasons behind those differences, notably differences in working histories and health status of the 2 groups.
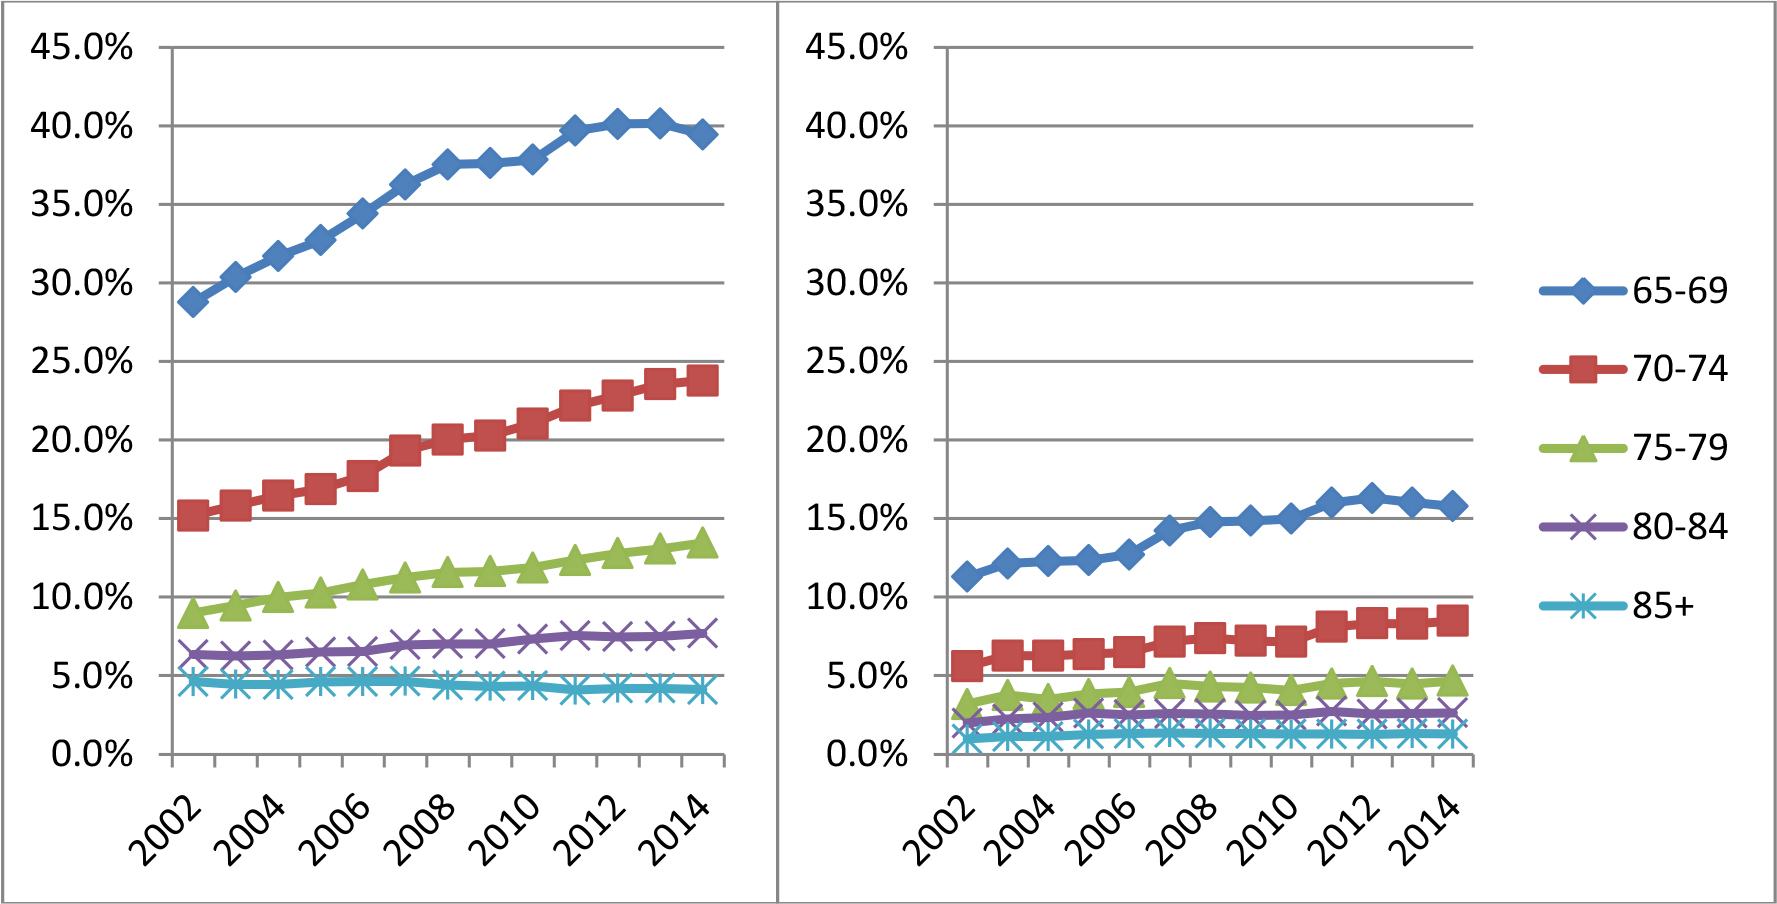
Figure 6 - Text version
| Year | 65 to 69 | 70 to 74 | 75 to 79 | 80 to 84 | 85+ |
|---|---|---|---|---|---|
| 2002 | 28.8% | 15.2% | 9.0% | 6.3% | 4.6% |
| 2003 | 30.4% | 15.8% | 9.5% | 6.3% | 4.5% |
| 2004 | 31.7% | 16.4% | 10.0% | 6.3% | 4.4% |
| 2005 | 32.7% | 16.9% | 10.3% | 6.5% | 4.6% |
| 2006 | 34.4% | 17.7% | 10.8% | 6.5% | 4.6% |
| 2007 | 36.3% | 19.3% | 11.2% | 7.0% | 4.6% |
| 2008 | 37.5% | 20.0% | 11.6% | 7.0% | 4.4% |
| 2009 | 37.6% | 20.3% | 11.6% | 7.0% | 4.3% |
| 2010 | 37.8% | 21.0% | 11.9% | 7.3% | 4.4% |
| 2011 | 39.7% | 22.2% | 12.4% | 7.5% | 4.1% |
| 2012 | 40.1% | 22.8% | 12.8% | 7.5% | 4.2% |
| 2013 | 40.1% | 23.5% | 13.1% | 7.5% | 4.2% |
| 2014 | 39.4% | 23.8% | 13.5% | 7.7% | 4.1% |
- Source: 10% sample of T1 file from the Canada Revenue Agency (5,923,580 observations of OAS pension recipients).
3.2 Factors explaining changes in the labour market participation
The literature has identified many factors that have influenced the changes in the labour market participation of older workers, including seniors.Footnote 20 This section describes some of these factors and relates them to changes in the labour market participation of older workers (55+ years of age).
3.2.1 Factors common to all older workers
This section examines older workers in general, not specifically OAS recipients. In the last 2 decades, employment rates of people aged 55+ have varied substantially. Carrière and Galarneau (2011) show that employment rates of people aged 55+ increased continually from a low of 22% in 1997 and reached 34% in 2010.
Many factors can help explain the recent increasing trend in labour market participation of older workers. More rapid employment growth in the service sector (compared to the primary and manufacturing sectors) provides opportunities that are more accessible to older workers. Work has also become less physically demanding due to technological advances in many sectors, providing greater opportunities for longer working careers. Gradually improved health levels has helped more people want to stay active as they see increasing prospects about longevity and the length of retirement. Knowledge-based work that is more interesting and satisfying and flexible working arrangements have helped to encourage longer careers.Footnote 21
The trend of rising education levels and incidence of self-employment among older workers is associated with increased labour force participation, as workers with more education and self-employed workers tend to retire at a later age. The declining trend in pension plan coverage of workers is also associated with increased labour market participation, as individuals with private pension assets have been found to retire significantly earlier on average than those without pension plans.Footnote 22
Finally, it has been shown by previous research that the increased labour force participation of older women has increased the labour participation of their spouses, as couples tend to prefer to retire together and, in particular, men are more likely to work if their spouse does as well.Footnote 23
3.2.2 Factors specific to the OAS program
The rules of the OAS program can potentially influence the labour force participation of seniors and near-seniors. For example, the reduction rate on GIS and Allowances benefits that is necessary to ensure benefits are targeted to those with the most need also diminishes the net gains of employment, as benefits are reduced for every dollar of income above the $3,500 GIS earnings exemption (as presented in Section 2). Also, the GIS earnings exemption and the option to voluntarily defer the start of the OAS pension can both positively influence the labour participation of program participants. However, in order for these rules to influence behaviour, the program needs to be well understood by participants.
Labour force participation is more relevant for OAS pensioners, given the limited participation of GIS recipients. Nevertheless, rules of the OAS program have the potential to influence recipients of the OAS pension, the GIS or the Allowances, even though OAS pensioners and recipients of the Allowances are the groups with the most significant contributions to the labour market.
Reduction rates on the GIS and the Allowances
In 2011, the government introduced the GIS top-up that provides additional income to the lowest income seniors and near-seniors relying almost exclusively on the OAS program. To target this benefit increase to those most in need, the program needed to increase the reduction rate in a certain range of income. Before 2011, the reduction rate on the GIS reduced benefits by $0.50 for every dollar of income. Since 2011, the reduction rate varies according to income, reducing benefits usually by $0.50 for every dollar of income, but reducing benefits by $0.75 for every dollar of income in a certain income range (see Section 2 for a description of the income ranges and associated reduction rates). For recipients of the Allowances, the reduction rate of benefits for single recipients and couples reaches $1 for every dollar of income in a small income range, even though it varies from $0.50 to $0.75 for every dollar of income over most of the income range. These higher reduction rates could influence some seniors to reduce their labour market participation. However, it is not clear to what extent these higher reduction rates are known by the senior population, as the information is not readily available on the ESDC website.
GIS earnings exemption
In 2008, the government increased the GIS earnings exemption to fully exempt the first $3,500 of work income so a “GIS recipient will be able to keep more of her or his hard-earned money without any reduction in GIS benefits, encouraging labour market participation and providing support for low-income seniors.”Footnote 24 Before 2008, only 20% of employment income up to $2,500 was exempt (providing a maximum earnings exemption of $500). These earnings exemptions also apply to the Allowances but do not apply to self-employment income.
Research for this evaluation (ESDC, 2017a) showed the positive impact of the increase in the earnings exemption on labour market participation of recipients of the Allowances. Using a treatment and a control group in a difference-in-difference regression frameworkFootnote 25, it was estimated that this policy change increased average employment income by 15% among recipients of the Allowances who are employed and increased the employment rate of recipients of the Allowances by 1 percentage point. These results are significant given the relatively small policy change involved.
It was not possible to use the same methodology to examine the impact of the increase in the earnings exemption on GIS recipients, as no suitable control group was found. Nevertheless, descriptive statistics show that average employment income was higher after the increase in the GIS earnings exemption among GIS recipients who were working. More precisely, real average employment income increased by 14% after 2007 among GIS recipients who worked, while real average employment income decreased among other OAS pensioners, providing some evidence of the positive influence of this policy change for GIS recipients. However, no conclusive evidence was found concerning the impact of the policy change on employment rates of GIS recipients.
Given the positive results of the increase in the GIS earnings exemption outlined above, further research to examine the policy implications of enhancing the exemption could be warranted.
Awareness of the GIS earnings exemption among GIS recipients could also be the subject of further research. If awareness is an issue, it would also reduce the policy’s efficiency to encourage GIS recipients to work if they wish to. In 2014, 4% of GIS recipients worked for an employerFootnote 26 and only 2% of recipients worked enough to take advantage of the full amount of the exemption ($3,500). Average employment income was $9,000 among those who worked for an employer. All these figures have increased only slightly since 2008. Among recipients of the Allowances, 18% worked for an employer and 13% of recipients used the full amount of the earnings exemption. Average employment income was $13,000 among recipients of the Allowances who worked for an employer.
OAS pension recipients and voluntary OAS deferral
The option to voluntarily defer the start of the OAS pension is a policy that was introduced in July 2013. It enables seniors to defer the start of their pension by up to 5 years in exchange for a higher monthly payment. By offering this possibility to seniors, it creates an incentive to continue working while postponing the receipt of their pension. The voluntary deferral of the OAS pension will be examined in the second phase of this evaluation, scheduled to be completed in 2018. In addition, the evaluation will attempt to examine its possible incidence on the labour market participation of OAS pensioners.Footnote 27
The employment rate of OAS pension recipients was already significant in 2014, at 18%. In addition, average employment income among OAS pension recipients who chose to work was $25,000, providing a significant contribution to the labour market.
The employment rate of OAS recipients increases with the level of their income from sources other than employment or OAS benefits (Table 2), except for the lowest income group which has an employment rate near the average. By deferring their OAS pension, some seniors may be able to postpone the payment of the OAS Recovery Tax to future years when they might not work and have lower income, or avoid it completely if their income falls enough to be below the OAS Recovery Tax income threshold ($71,592 in 2014).Footnote 28 Thus, some increases in employment rates may be observed in the coming years, following the introduction of the option to defer the OAS pension.
| Income from sources other than employment or OAS benefits | Employment rate (%) |
|---|---|
| Less than $25,000 | 17.2 |
| $25,000 to $49,999 | 15.7 |
| $50,000 to $69,999 | 16.2 |
| $70,000 to $99,999 | 16.5 |
| $100,000 to $119,999 | 22.4 |
| $120,000 to $150,000 | 22.7 |
| More than $150,000 | 29.3 |
| All | 17.5 |
- Source: 10% sample of T1 file from the Canada Revenue Agency (540,839 observations of OAS pension recipients). Income from sources other than employment or OAS benefits includes pension income, CPP, QPP, investment income, withdrawals from Registered Retirement Savings Plans and Registered Retirement Income Funds, etc.
4. GIS top-up and the income of seniors
In Budget 2011, the Government of Canada increased the GIS and the Allowances for recipients with the lowest income. This targeted increase is also known as the GIS top-up. This section examines the GIS top-up and answers the following evaluation questions:
- What was the effect of the introduction of the GIS top-up on the income of seniors? How were different vulnerable groups of seniors affected (for example, seniors living in urban centers)?
4.1 Description of the GIS top-up
The top-up provides additional income to the lowest-income seniors and near-seniors that rely almost exclusively on the OAS program as a source of income. The top-up has been added to the GIS and the Allowances since July 2011. In 2015, the top-up could reach up to $636 per year for single people and $445 per year for each member of a couple. The top-up is also indexed quarterly, as are all OAS benefits.
As with GIS and Allowance benefits, the amount of the GIS top-up is calculated based on income (or combined income for couples) other than OAS benefits, and also excludes the first $3,500 in individual employment earnings. Apart from these exclusions, single beneficiaries can earn up to $2,000 before the GIS top-up starts being gradually reduced, while couples can earn up to $4,000 before it begins to be reduced. In 2015, the top-up was paid to single people with other net income below $4,592 and couples with other net income below $7,648.Footnote 30
In Budget 2016, the government announced an increase to the top-up for single seniors and near-seniors of up to $947 per year. This increase took effect in July 2016 and increased substantially the income threshold below which single seniors receive the top-up ($8,432 in January 2017). The analysis of the top-up in this report uses the most recent tax data available and therefore does not take the 2016 increase into account.
4.2 Top-up recipients and income
There were almost 700,000 recipients of the GIS top-up in 2014, representing a third of GIS and Allowance recipients. GIS recipients represented most of the top-up recipients, with recipients of the Allowances representing only 3% of top-up recipients. Two-thirds of top-up recipients were single and two-thirds of recipients were women.
In 2014, the average top-up received was $430, with almost two-thirds of top-up recipients receiving over $400. Single recipients received a top-up of $480 on average, while each member of a couple received an average of $330 (in other words, $660 per couple).
Top-up recipients have access to limited financial resources, the bulk of which came from OAS benefits. Average family income for top-up recipients was $21,000 in 2014, of which OAS benefits amounted to $17,000 on average. Of the average $4,000 in other sources of income that top-up recipients had, almost half came from CPP benefits. Over half of top-up recipients had less than $3,000 in income from sources other than OAS benefits, almost 40% had between $3,000 and $9,000, and less than 10% had more than $9,000 in income from sources other than OAS benefits.
In this context, the top-up contributed significantly to the income of recipients, as did OAS benefits overall. For the average recipient in 2014, the top-up was equivalent to 10% of their other sources of income and represented 4% of OAS benefits.
4.3 Sub-groups of top-up recipients
As the top-up is income-tested, by design it reaches the most vulnerable seniors. About 12% of all seniors in Canada received the GIS top-up in 2014 (Table 3). This incidence was higher among single seniors, women, older seniors (85+) and seniors living in the largest urban centers of Canada (Vancouver, Calgary, Edmonton, Toronto, Ottawa and Montreal). The highest incidence was among single seniors (19%).Footnote 31
Among top-up recipients, these sub-groups also had the lowest financial resources outside OAS benefits. The proportion of top-up recipients with less than $3,000 in family income from sources other than OAS benefits was higher among these sub-groups, reaching over 60% for single recipients, older seniors (85+) and recipients living in the largest urban centers.
At the same time, top-up payments were also slightly higher for these sub-groups, reaching an average of $480 for single recipients in 2014. For the average top-up recipient of these sub-groups, the top-up was equivalent to 11% to 15% of their other sources of income.
The difference in incidences of receipt of the GIS top-up between large urban centers and other parts of Canada raises some interesting research questions regarding poverty in large urban centers. Further research on this issue would be relevant.
| Top-up payments | All | Marital status | Gender | Age | Largest cities** | |||||
|---|---|---|---|---|---|---|---|---|---|---|
| Single | Married* | Women | Men | 60 to 64 | 65 to 84 | 85+ | yes | no | ||
| Average top-up ($) | 430 | 481 | 332 | 446 | 399 | 348 | 426 | 462 | 462 | 407 |
- Source: 10% sample of T1 file from the Canada Revenue Agency (69,329 top-up recipients in 2014).
- *Married includes common-law relationships.
- **Largest cities include Vancouver, Calgary, Edmonton, Toronto, Ottawa and Montreal.
| Recipients | All | Marital status | Gender | Age | Largest cities** | |||||
|---|---|---|---|---|---|---|---|---|---|---|
| Single | Married* | Women | Men | 60 to 64 | 65 to 84 | 85+ | yes | no | ||
| % of 65+ pop. that are top-up recipients | 11.9 | 19.2 | 6.7 | 13.9 | 9.4 | n/a | 11.4 | 14.8 | 16.7 | 9.9 |
| % of top-up recipients | 100.0 | 65.5 | 34.5 | 64.8 | 35.2 | 3.4 | 79.7 | 16.9 | 41.0 | 59.0 |
- Source: 10% sample of T1 file from the Canada Revenue Agency (69,329 top-up recipients in 2014).
- *Married includes common-law relationships.
- **Largest cities include Vancouver, Calgary, Edmonton, Toronto, Ottawa and Montreal.
| Top-up amounts | All | Marital status | Gender | Age | Largest cities** | |||||
|---|---|---|---|---|---|---|---|---|---|---|
| Single | Married* | Women | Men | 60 to 64 | 65 to 84 | 85+ | yes | no | ||
| $0 to 200 | 17.3 | 14.6 | 22.5 | 16.3 | 19.3 | 21.6 | 17.4 | 16.2 | 11.4 | 21.4 |
| $201 to 400 | 17.9 | 16.3 | 21.2 | 16.9 | 19.9 | 25.2 | 18.4 | 14.2 | 13.9 | 20.8 |
| $401+ | 64.7 | 69.1 | 56.4 | 66.8 | 60.9 | 53.2 | 64.2 | 69.6 | 74.7 | 57.8 |
- Source: 10% sample of T1 file from the Canada Revenue Agency (69,329 top-up recipients in 2014).
- *Married includes common-law relationships.
- **Largest cities include Vancouver, Calgary, Edmonton, Toronto, Ottawa and Montreal.
| Type of income | All | Marital status | Gender | Age | Largest cities** | |||||
|---|---|---|---|---|---|---|---|---|---|---|
| Single | Married* | Women | Men | 60 to 64 | 65 to 84 | 85+ | yes | no | ||
| OAS benefits | 17,076 | 14,174 | 22,585 | 16,459 | 18,211 | 19,086 | 17,273 | 15,746 | 17,933 | 16,483 |
| Other income | 4,211 | 3,281 | 5,977 | 3,917 | 4,753 | 6,692 | 4,306 | 3,269 | 3,447 | 4,737 |
| Total | 21,287 | 17,454 | 28,563 | 20,376 | 22,963 | 25,778 | 21,579 | 19,015 | 21,380 | 21,220 |
- Source: 10% sample of T1 file from the Canada Revenue Agency (69,329 top-up recipients in 2014).
- *Married includes common-law relationships.
- **Largest cities include Vancouver, Calgary, Edmonton, Toronto, Ottawa and Montreal.
| Other family income | All | Marital status | Gender | Age | Largest cities** | |||||
|---|---|---|---|---|---|---|---|---|---|---|
| Single | Married* | Women | Men | 60 to 64 | 65 to 84 | 85+ | yes | no | ||
| $0 to 2,999 | 54.2 | 61.8 | 39.7 | 57.3 | 48.6 | 38.3 | 53.2 | 62.0 | 63.9 | 47.5 |
| $3,000 to 5,999 | 27.0 | 27.3 | 26.5 | 26.3 | 28.4 | 26.4 | 27.3 | 26.1 | 21.8 | 30.7 |
| $6,000 to 8,999 | 10.6 | 5.3 | 20.5 | 9.1 | 13.3 | 17.2 | 11.1 | 6.6 | 7.8 | 12.5 |
| $9,000+ | 8.2 | 5.5 | 13.4 | 7.4 | 9.7 | 18.1 | 8.4 | 5.4 | 6.5 | 9.3 |
- Source: 10% sample of T1 file from the Canada Revenue Agency (69,329 top-up recipients in 2014).
- *Married includes common-law relationships.
- **Largest cities include Vancouver, Calgary, Edmonton, Toronto, Ottawa and Montreal.
5. OAS administrative costs
This section presents OAS administrative costs for fiscal years 2007 to 2008 to fiscal year 2016 to 2017. In particular, it examines the following evaluation question:
- What are the Department’s administrative expenditures and how have they changed over time, in particular, in light of service delivery changes?
5.1 OAS program expenditures and administrative costs
The aggregate amount of OAS program benefits paid per year has increased from $33 billion in fiscal year 2007 to 2008 to $50 billion in fiscal year 2016 to 2017, a 51% increase.Footnote 32 Population aging has brought an increase in the number of OAS beneficiaries and, consequently, an increase in the volume of transactions over time.Footnote 33 During the same period, administrative costs of the OAS program (excluding costs for internal services) have increased from $118 million in fiscal year 2007 to 2008 to $177 million in fiscal year 2016 to 2017, a 50% increase (see Tables 4a and 4b), thus having a similar growth rate to that of the aggregate amount of OAS benefits paid.Footnote 34 On an annual basis, administrative costs have grown on average by 4.6% per year during this period.
Internal services excluded from administrative cost estimates include activities and resources administered by the Department to support programs and corporate functions in the organization. These include: finance; Information Technology; human resources; communications; legal services; research, audit and evaluation; and accommodation. OAS administrative costs for internal services were about $76M in fiscal year 2016 to 2017.Footnote 35
| Fiscal year | OAS benefits paid ($ millions) | OAS files processed (transactions)* | Administrative costs excluding internal services ($ millions) | # of OAS beneficiaries |
|---|---|---|---|---|
| 2007 to 2008 | 32,900 | N/A | 118 | 4,483,946 |
| 2008 to 2009 | 34,300 | N/A | 120 | 4,601,217 |
| 2009 to 2010 | 35,600 | N/A | 121 | 4,725,315 |
| 2010 to 2011 | 36,700 | N/A | N/A | 4,856,807 |
| 2011 to 2012 | 39,200 | 6,004,054 | 135 | 5,014,360 |
| 2012 to 2013 | 41,500 | 6,296,282 | 130 | 5,213,719 |
| 2013 to 2014 | 43,200 | 6,721,353 | 130 | 5,389,861 |
- Sources: Administrative cost data excluding internal services (as defined in the program inventory; see previous page) are from ESDC. Data on the number of OAS files processed (transactions) are from OAS administrative data (OAS Reporting database). Data on the number of OAS beneficiaries are monthly averages from ESDC (2016d and 2017e).
- *Files processed (transactions) include all applications, annual renewal of benefits and revised benefits (including automated transactions).
In the last decade, the quality of the administrative cost data has increased over time with enhancements made to the costing methodology. These changes over time are making some year-to-year comparisons difficult to interpret. In fiscal year 2014 to 2015, ESDC implemented a new financial system (SAP) which provided additional functionalities that improved the accuracy of the cost data by program. For example, the financial coding structure was modified to report costs for each program captured in ESDC’s program inventory (Program Activity Architecture sub-program). This was made possible mainly by 2 SAP features: a salary cost assignment tool and a timesheet functionality for employees involved in activities related to many programs. These 2 functionalities allowed the tracking of cost data to be performed at a more in-depth level with increased accuracy.
In addition, comparisons of administrative costs in the last 3 years should take into account investments made in the transformation of the service delivery of the OAS program, including the OAS Service Improvement Strategy. These investments were the following: $14 million in fiscal year 2016 to 2017, $6 million in fiscal year 2015 to 2016 and $1 million in fiscal year 2014 to 2015.Footnote 36 The OAS Service Improvement Strategy aims to modernize the way services are delivered. For example, in fiscal year 2016 to 2017, 45% of new OAS beneficiaries were enrolled through automatic enrollment, meaning that the processing was fully automated.
| Fiscal year | OAS benefits paid ($ millions) | OAS files processed (transactions) | Administrative costs excluding internal services ($ millions) | # of OAS beneficiaries |
|---|---|---|---|---|
| 2014 to 2015 | 45,600 | 7,070,117 | 156 | 5,557,384 |
| 2015 to 2016 | 47,000 | 6,961,221 | 160 | 5,711,948 |
| 2016 to 2017 | 49,700 | 7,078,663 | 177 | 5,876,307 |
- Sources: see notes above.
- *ESDC implemented a new financial system in fiscal year 2014 to 2015 which improved the accuracy of the cost data by program.
For context, Tables 4a and 4b above show the increase in the number of OAS beneficiaries throughout the period, and the increase in the number of OAS files processed (transactions), which include applications, annual renewals of benefits and revised benefits. Administrative costs represented 0.35% of all program expenditures in fiscal year 2016 to 2017, or about $30 per beneficiary.
In a context of population aging the year-to-year variation of administrative costs provides a global perspective. At the same time, this context makes it difficult to isolate the precise relationship between service delivery changes and costs. The demand created by increasing beneficiaries (and related transactions, which can be multiple) is a significant contributing factor to the resources needed to serve these clients. To address this increased workload, the Department has been able to provide additional funding through reallocations and additional annual funding was received to support the increased OAS workload: $5.7 million in fiscal year 2012 to 2013, $7.4 million in fiscal year 2013 to 2014, $9.3 million in fiscal year 2014 to 2015 and $18.7 million in fiscal year 2015 to 2016. This additional funding has supported increased processing activities.
Overall, in an operation setting numerous factors are implicated when analyzing costs. Among these factors 2 are key: (1) functional (direct and indirect) and (2) fluctuating (in other words fixed and variable). An important finding in this evaluation is the limited financial data available in this dynamic environment (for example, fluctuating volumes, new initiatives, etc.) to provide a comprehensive understanding of relationship between service delivery changes and costs. A future evaluation of the OAS Service Improvement Strategy, including automatic enrollment, will examine this initiative in further depth.
5.2 Administrative cost comparison to other programs
Another way to assess administrative costs is to compare them to those of similar programs. Direct comparisons of administrative costs between programs should be taken with caution, as programs have different inherent characteristics, leading to different labour intensity, as well as different levels of benefit amounts. For instance, the OAS program issues payments to eligible seniors once a month.
A natural comparison is the Canada Pension Plan (CPP), another pension program that is managed by ESDC and delivered to Canadians through Service Canada. The latest evaluation of the CPP indicated that ESDC’s share of administrative costs amounted to $66 per beneficiary in fiscal year 2014 to 2015.Footnote 37 This is higher than for the OAS program, however the complexity of the 2 programs are different and OAS administrative costs do not include internal services.Footnote 38 Moreover, when examining administrative costs per $100 of benefits paid, OAS administrative costs are also lower.Footnote 39
6. Readiness of the department to assess OAS service delivery quality
This section examines the readiness of the Department to assess changes in the quality of service delivery of the OAS program. The following evaluation question is examined:
- How ready is the Department to assess changes in the quality of service since 2005 (for example, accessibility, accuracy and timeliness), in light of service delivery changes?
After presenting the different indicators of the quality of service delivery of the OAS program, this section outlines the strengths and weaknesses of the indicators used, offering suggestions to enhance indicators, where relevant.
6.1 The different aspects of service delivery of the OAS program
Service Canada, a part of Employment and Social Development Canada (ESDC) launched in September 2005, is responsible for the delivery of many programs of the Department, including the OAS program. More specifically, OAS program information and services can be accessed via 3 main service delivery channels including;
- In-person Service Canada points of service;
- General information telephone service (1 800 O-Canada) and the Specialized Call Centre with service specific to the Canada Pension Plan (CPP) and OAS (1 800-277-9914 and 1-800-277-9915); and
- The Government of Canada website including My Service Canada Account.Footnote 40
OAS program services delivered by Service Canada are broad and range from providing general information to processing applications, processing payments and revising benefits through Service Canada processing centers. Elements of service quality therefore include accessibility, timeliness, accuracy and client satisfaction.
Accessibility examines whether Canadians obtained the services they needed and whether these were easy to obtain. Accuracy relates to the correctness of personal information, amounts of benefits, periods, or other factors which are calculated using government processes and systems. Timeliness assesses whether the service was delivered in a timely fashion, including the time required to process an application and make a payment. Finally, client satisfaction pertains to Canadians’ experiences when obtaining services they needed and whether their needs and expectations were met.
6.2 Indicators of OAS service delivery quality
In recent years, Service Canada has introduced a number of changes to the way OAS benefits and services are delivered. Most notably, these include the introduction of automatic enrolment for the OAS pension for eligible seniorsFootnote 41, changes to the Interactive Voice Response system for the CPP and OAS specialized call centres, as well as efforts to broaden services available online and simplify the navigation on the Service Canada website.
Further, since 2006, the range of service delivery quality indicators tracked and monitored by Service Canada has expanded and allowed for a comparison between actual results and planned service targets. These indicators mainly focus on services delivered in-person or by telephone, as well as on processing and payment procedures.
The main service delivery quality indicators for fiscal year 2016 to 2017 show that: 81% of Service Canada in-person clients for all programs were served within 25 minutes (including OAS clients), 82% of specialized calls were answered by a CPP/OAS agent within 10 minutes (among those accessing the queue to wait for an agent), and 87% of OAS pension benefits were paid within the first month of entitlement. However, only 69% of calls that tried to reach an agent were able to access the queue to wait for an agent in CPP/OAS specialized call centers (see Figure 7). Further, although OAS benefits had a 99% accuracy rate, only 68% of OAS applications processed followed all policies and procedures. Payment accuracy examines if the amount of the benefit was correct while processing accuracy examines if all policies and procedures were strictly adhered to.Footnote 42
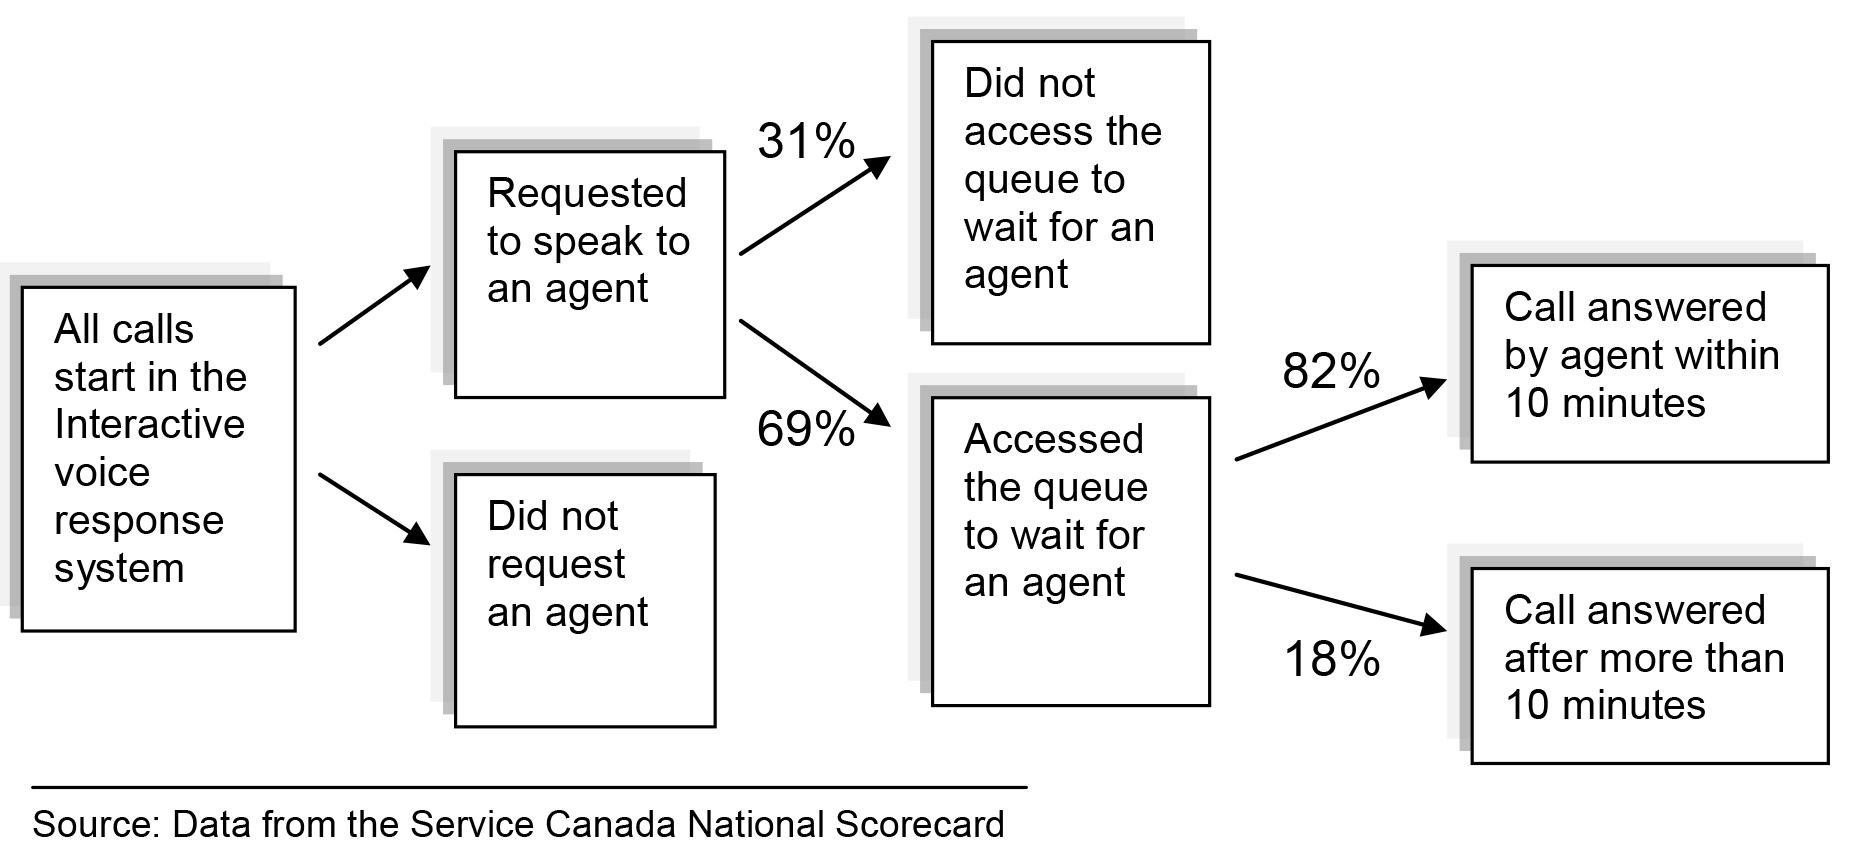
Figure 7 – Text version
Figure 7 presents the mapping of calls to the CPP/OAS Specialized Call Center. All calls start in the Interactive Voice Response System, some people request to speak to an agent and some did not request an agent. Of the people who requested to talk to an agent, 69% accessed the queue to wait for an agent and 31% did not access the queue to wait for an agent. Of those accessing the queue for an agent, 82% of calls were answered within 10 minutes and 18% of calls were answered after more than 10 mins.
- Source: Data from the Service Canada National Scorecard
Table 5 presents the list of indicators and sources of service delivery quality that are relevant to the OAS program. Note that in 2010, a survey of client satisfaction found that 79% of OAS clients were satisfied with the service. However, no surveys of client satisfaction of OAS clients have been conducted since, indicating a gap in this area.
Table 5: Service delivery quality indicators for the OAS program (fiscal year 2016 to 2017 unless indicated otherwise)
Indicators specific to OAS program (Information and assistance)
- Access: 69% of calls that tried to reach an agent were able to access the queue to wait for agent in CPP/OAS specialized call centers
- Timeliness: 82% of specialized calls answered within 10 minutes in CPP/OAS specialized call centers (among those accessing the queue to wait for an agent) and 89% of specialized calls received by agents in CPP/OAS specialized call centres were successfully resolved at first point of contact
- Client satisfaction: 79% of OAS clients were satisfied with service in 2010 (the most recent year in which survey was conducted)
Indicators specific to OAS program (Applications and payments)
- Access: 45% of new OAS pension beneficiaries were automatically enrolled
- Timeliness:87% of new OAS pension beneficiaries paid within first month of entitlement or of application* (61% for GIS applicants) and OAS pension applications received 6 months before entitlement date on average (GIS applications received 1 month after entitlement date on average)
- Accuracy: 99% payment accuracy rate for OAS benefits (99% for OAS pension, 96% for GIS, 93% for Allowances) in fiscal year 2015 to 2016 and 68% of OAS applications processed accurately (following all policies and procedures)**
- Reach: 98% take-up of OAS pension among eligible population (85% take-up for GIS, 74% for Allowances)***
Indicators regarding all programs delivered by Service Canada (incl. OAS)
- Access: 96% of Canadians live within 50km of a Service Canada point of service
- Timeliness: 81% of in-person clients served within 25 minutes (for all Service Canada delivered programs including OAS) and 82% of calls answered by an agent within 18 seconds for 1-800-O-Canada (for all Service Canada delivered programs including OAS)
- *For this indicator, in cases of late applications, payment is to be processed within one month of application receipt to be on time.
- **Indicator is a 12 month moving average of files reviewed between from February 2016 and January 2017.
- ***OAS pension and GIS take-up is among tax-filers in 2013. Take-up for Allowances is for 2010.
- Sources: Service Canada National Scorecard for data on Canadians living within 50 km of Service Canada point of contact and on in-person clients served within 25 minutes, on calls answered by an agent within 18 seconds for 1-800-O-Canada, on specialized calls answered by an agent within 10 minutes, on specialized calls that access the queue, and on automatic-enrolment. 2015/16 Payment Accuracy Review for data on payment accuracy. Transformation and Integrated Service Management Branch 2016 to 2017 Performance Scorecard for data on specialized calls resolved at first point of contact. Monthly EI, OAS, and CPP Payment Accuracy Review and Processing Accuracy Review Results March 2017: for data on processing accuracy. OAS administrative cube data for data on timing of OAS applications and on % paid within first month of entitlement. Phoenix (2011a) survey results for data on client satisfaction. Longitudinal Administrative Databank for data on take-up of the OAS pension and GIS, from ESDC (2016e). National Household Survey for data on take-up of the Allowances, from ESDC (2016b).
It is also important to note that the average monthly number of OAS recipients increased from 4.2 million in fiscal year 2004 to 2005 to 5.9 million in fiscal year 2016 to 2017, likely leading to increased demand for OAS service delivery services. In the future, the volume of OAS service delivery demanded will continue to increase as a result of population aging and increasingly more OAS beneficiaries.
In addition to the above service delivery quality indicators, there are also indicators of the volume of services delivered for the OAS program:
- 700,000 in-person requests in fiscal year 2014 to 2015 relating to OAS and lasting an average of 17 minutes (22% requested additional information, 33% requested application assistance and 45% requested follow-up assistance);Footnote 43
- 300,000 CPP/OAS telephone enquiries to 1-800-O-Canada in fiscal year 2014 to 2015;Footnote 44
- In fiscal year 2016 to 2017, 2.8 million calls to the CPP/OAS Specialized Call Centres answered by an agent, and 3.0 million calls resolved by the interactive voice response system;Footnote 45
- 1.5 to 1.6 million unique OAS web pages views in fiscal year 2015 to 2016;Footnote 46
- 800 000 OAS applications processed in fiscal year 2016 to 2017;Footnote 47
- most of the 6 million OAS clients are re-processed each year to update payment amounts;Footnote 48
- 71 million payments made to clientsFootnote 49 in fiscal year 2016 to 2017 (for a total of $50 billion in paymentsFootnote 50).
Finally, Service Canada receives and reviews client feedback about the quality of service through its Office for Client Satisfaction.Footnote 51 This office publishes a bi-annual report analysing feedback received from clients and includes suggestions from clients to enhance service delivery.Footnote 52
6.3 Strengths and weakness of service delivery quality indicators
Many relevant indicators of service delivery quality are monitored by ESDC, notably access to Service Canada agents, the timeliness of benefit receipt, payment accuracy and take up. The main challenge resides in indicators of client satisfaction, for which the last survey was conducted in 2010.
Recent enhancements to service delivery include the introduction of automatic enrolment for the OAS pension, efforts to broaden services available online,Footnote 53 as well as changes to the interactive voice response system for specialized call centers. For instance, in fiscal year 2016 to 2017, approximately 45% of new OAS pension beneficiaries did not need to apply to receive their pension because of automatic enrolment. However, it is not known to what extent this has increased client satisfaction.Footnote 54
The fact that the existing set of service delivery quality indicators does not point to clear improvements in service delivery also suggests that it may not fully capture the impact associated with the types of changes that were recently made to OAS service delivery. For instance, the percentage of OAS pension benefits paid within the first month of entitlement remained unchanged at around 90% between fiscal year 2005 to 2006 and fiscal year 2016 to 2017 with or without automatic enrolment. However, with automatic enrolment the 90% threshold was achieved with less effort from clients (less paperwork).
Moreover, the current set of service delivery quality indicators, while relevant to the quality of service, reflects a provider’s perspective on the quality of service delivery. Therefore, complementary qualitative and quantitative approaches should continue to be used to assess seniors’ experiences and satisfaction with OAS service delivery. For example, a client satisfaction survey was conducted on behalf of Service Canada in 2006, 2008 and 2010, asking clients about their satisfaction with Service Canada in general and specifically regarding OAS/GIS service delivery. However, the survey has been discontinued since 2010.
More information on clients’ satisfaction and experiences could help target service delivery efforts to be more in line with the preferences and needs of specific segments of the Canadian population, keeping in mind those who may have particular challenges in accessing OAS program services (such as immigrants, Aboriginals or homeless and near-homeless seniors). This mirrors a recent recommendation on service delivery of another major program from the EI Service Quality Review Panel, namely it was “recommend[ed] that Service Canada adopt a citizen-centric approach to its service delivery, one that includes effective citizen feedback strategies to understand the needs and priorities of citizens for continuous service improvement, and measuring and setting targets for client satisfaction as a means to evaluate success.”Footnote 55
Lastly, the current set of indicators of service delivery could be strengthened in other ways. It was observed that for indicators that provide results broken down by benefit type (OAS pension, GIS, Allowances) results consistently point to lower levels of performance for the GIS and Allowances. This suggests that indicators would gain from reporting results broken down by benefit type. In addition, despite the ‘breadth’ of the information collected to inform these indicators, most indicators take the form of a single summary statistic. For instance, data collected to inform the percentage of specialized calls answered by a CPP/OAS agent within 10 minutes could also be used to develop complementary indicators, such as the distribution of calls answered within different time ranges (for example, number/share of calls answered within 3 minutes, 5 minutes, 10 minutes and more than 10 minutes).Footnote 56 Finally, indicators that combine CPP and OAS programs could be broken down by program.Footnote 57
Even though many relevant indicators of service delivery quality are monitored by ESDC, complementary indicators informed by collected data could enable a more meaningful assessment of the recent changes in service delivery (for example, client satisfaction over the different channels). The analysis above offered some suggestions and insights on ways to enhance the list of indicators of OAS service delivery that are monitored by Department.
7. Conclusions and recommendations
Overall, many factors contributed to the increase in the employment rate of seniors and near-seniors, including among OAS beneficiaries, notably growth in the service sector, technological advances and improved health levels. Among the many factors contributing to this trend, empirical results suggested that the increase in the GIS earnings exemption in 2008 had slightly increased employment rates among recipients of the Allowances and increased average employment income among working GIS and Allowances recipients.
The GIS top-up reached many groups of vulnerable seniors, as did other OAS benefits. For the average top-up recipient, the top-up was equivalent to 10% of their other sources of income and represented 4% of OAS benefits.
With population aging and increases in the number of OAS beneficiaries, total administrative costs of the OAS program have increased from $118 million in fiscal year 2007 to 2008 to $177 million in fiscal year 2016 to 2017. Administrative costs represented about 0.4% of program costs throughout this period.
Finally, some of the most relevant indicators of service delivery quality are monitored closely by ESDC, notably, access to Service Canada agents, timeliness of benefit receipt, take-up and payment accuracy. However, the client satisfaction survey conducted on behalf of Service Canada was discontinued in 2010, leading to an important knowledge gap since then.
7.1 Recommendations
- Consider regularly monitoring client satisfaction with OAS service delivery, including monitoring client satisfaction of the various service delivery channels.
Appendix 1: Evaluation questions
OAS Evaluation phase 1 (current report)
Question 1: What factors may explain the changes in the labour market participation of seniors in general and more specifically with regards to OAS and GIS recipients?
Section of this report: 3
Source document: CRA1*
Question 2: What was the effect of the introduction of the GIS top-up on the income of seniors? How were different vulnerable groups of seniors affected (e.g. seniors living in urban centers)?
Section of this report: 4
Source document: CRA1*
Question 3: What are the Department’s administrative expenditures and how have they changed over time, in particular, in light of service delivery changes?
Section of this report: 5
Source document: Internal tables from ESDC*
Question 4: How ready is the Department to assess changes in the quality of service since 2005 (e.g. accessibility, accuracy and timeliness), in light of service delivery changes?
Section of this report: 6
Source document: DR*
OAS Evaluation Phase 2 (future report)
Question 5: Do the Allowances continue to address a demonstrable need? Who are the beneficiaries of the Allowances and how has their profile changed over time?
Section of this report: n/a
Source document: NHS, CRA2*
Question 6: To what extent is ESDC prepared to monitor and assess the characteristics and patterns of seniors deferring their OAS pension?
Section of this report: n/a
Source document: AD*
- *Source Documents (Technical Reports):
- AD=OAS administrative data analysis (scheduled for fiscal year 2017 to 2018)
- CRA1=Canada Revenue Agency T1 data analysis 1 (Seniors’ labour market participation, income and GIS top-up)
- CRA2= Canada Revenue Agency T1 data analysis 2 (Allowances, scheduled for 2017 to 2018)
- DR=Service delivery document review
- NHS= National Household Survey analysis
Appendix 2: Summary of studies conducted in support of the evaluation
ESDC (2017a), “Seniors’ Labour Force Participation, Income and the GIS top-up”
This report uses T1 data from the Canada Revenue Agency. The purpose of this study was to examine changes in the labour market participation of seniors and OAS program participants and examine how the introduction of the GIS top-up affected different groups of vulnerable seniors. This report also used a difference-in-difference regression framework to analyse the effect of the increase in the GIS earnings exemption in 2008.
ESDC (2016a), “Document Review of Service Delivery of Old Age Security Program”
The purpose of the document review was to examine how ready the Department is to assess changes in the quality of service since 2005 (for example, accessibility, accuracy and timeliness), in light of service delivery changes. To that end, the study first provides a summary of recent reviews/audits of the services delivered by Service Canada with a focus on the OAS program. It then provides an overview of the main changes implemented by Service Canada in the wake of those reviews/audits and identifies key service delivery performance indicators with a focus on recent trends.
ESDC (2016b), “Participation in the Old Age Security Program – National Household Survey”
This report uses data from the National Household Survey to examine participation in the OAS program, take-up rates among different sub-groups of the population, and presents a financial profile of beneficiaries of the Allowances. These findings provide context for the evaluation of the OAS program and provide some findings examining how the Allowances continue to address a need and describing the beneficiaries of the Allowances. In addition, some of the findings of this study will also contribute to the GIS take-up evaluation, in particular, findings on the take-up of the OAS pension and the GIS. With respect to take-up, the main contribution of this paper is to present differences in take-up rates among sub-groups of the population eligible for OAS benefits.
Appendix 3: References
Beach, Charles M. (2008), “Canada’s Aging Workforce: Participation, Productivity, and Living Standards”, A festschrift in Honour of David Dodge, Bank of Canada, p. 197 to 218.
Bélanger, A., Y. Carrière and P. Sabourin (2016), “Understanding Employment Participation of Older Workers: the Canadian Perspective”, Canadian Public Policy, p. 94 to 109.
Canada Revenue Agency (2015), “Final Statistics 2015 edition (for the 2013 tax year)”, (accessed on March 7, 2017)
Carrière, Yves and Diane Galarneau (2011), “Delayed Retirement: a New Trend?”, Perspectives on Labour and Income, Winter, p 3 to 16.
Cross, Philip (2015), “The Recession’s Impact on Canada’s Labour Market” , University of Calgary School of Public Policy Research Papers, (accessed on April 20, 2017)
EKOS Research Associates Inc. (2008), “Service Canada Service Standards Renewal”, (accessed on March 7, 2017).
ESDC (2017a), “Seniors’ Labour Force Participation, Income and the GIS top-up”.
ESDC (2017b), “Summative Evaluation of the Canada Pension Plan Retirement Pension and Survivor Benefits”, (accessed on September 12, 2017).
ESDC (2017c), “Employment Insurance Service Quality Review: Making Citizens Central”, (accessed on March 7, 2017).
ESDC (2017d), “Quarterly report of Canada Pension Plan and Old Age Security monthly amounts and related figures - January to March 2017”, (accessed on March 8, 2017).
ESDC (2017e), “The CPP & OAS Stats Book 2017”, draft.
ESDC (2016a), “Document Review of Service Delivery of Old Age Security Program”.
ESDC (2016b), “Participation in the Old Age Security Program – National Household Survey”.
ESDC (2016c), “Key Informant Interviews with Service Canada Officials – in support of the Summative Evaluation of the CPP Retirement Pension and Survivor Benefits”.
ESDC (2016d), “The CPP & OAS Stats Book 2016”.
ESDC (2016e), “ESDC Departmental Performance Report for fiscal year 2015 to 2016”.
ESDC (2016f), “Service Canada National Performance Dashboard”, March.
ESDC (2016g), “Service Canada National Scorecard”, March.
ESDC (2016h), “Processing and Payment Services Performance Scorecard in fiscal year 2015 to 2016”.
ESDC (2015a), “The CPP & OAS Stats Book 2015”.
ESDC (2015b), “ESDC Departmental Performance Report for fiscal year 2014 to 2015”.
ESDC (2015c), “Analysis of the Canada Pension Plan Administrative Expenses”, technical report prepared for the Summative Evaluation of the CPP Retirement Pension and Survivor Benefits.
ESDC (2015d), “Business Case: Old Age Security Service Improvement Strategy”.
ESDC (2014), “ESDC Departmental Performance Report for fiscal year 2013 to 2014”.
ESDC (2013), “ESDC Departmental Performance Report for fiscal year 2012 to 2013”.
ESDC (2012a), “Summative Evaluation of the Old Age Security Program”, (accessed on March 7, 2017).
ESDC (2012b), “Audit of Old Age Security Program Eligibility”.
ESDC (2012c), “Audit of Management of Call Centre Operations”.
ESDC (2012d), “Audit of the Tier 1 Service Delivery Channels”.
ESDC (2010), “Evaluation of the Guaranteed Income Supplement Take-up Measures and Outreach”.
Finance Canada (2008), “The Budget Plan 2008”.
Gilbert, Sabrina, Zechuan B. Deng, Sebastian Yeung and Gail Fawcett (2015), “Income and Employment of Adults with Disabilities: Findings from the 2012 Canadian Survey on Disability”, ESDC.
HRSDC (2006), “Departmental Performance Report for fiscal year 2005 to 2006”.
HRSDC (2005), “Departmental Performance Report for fiscal year 2004 to 2005”.
Horner, Keith (2011), “The Labour Supply of Older Workers: Review of Trends and Analysis”, report prepared for HRSDC, 59 p.
Institute for Citizen-Centred Service (2012a), “Self-Service Report – Anywhere, Anytime, Any Device: Innovations in Public Sector Self-Service Delivery”.
Institute for Citizen-Centred Service (2012b), “Citizen First 6”.
Kline, Patrick and Melissa Tatari (2016), “Bounding the Labour Supply Responses to a Randomized Welfare Experiment: A Revealed Preference Approach”, American Economic Review, 106(4), p. 9721014.
Office of the Auditor General of Canada (2010), “Report of the Auditor General of Canada to the House of Commons”, Chapter 3: Service Delivery.
Office of the Auditor General of Canada (2006), “Report of the Auditor General of Canada to the House of Commons”, Chapter 6 – Old Age Security, Human Resources and Social Development Canada and Service Canada.
Office of the Auditor General of Canada (2000), “Report of the Auditor general of Canada – April 2000”.
Office of the Chief Actuary (2017), “Actuarial Report (14th) on the Old Age Security Program”, Office of the Superintendent of Financial Institutions Canada, (accessed on August 30, 2017).
Office of the Chief Actuary (2016), “Actuarial Report (13th) Supplementing the Actuarial Report on the Old Age Security Program”, Office of the Superintendent of Financial Institutions Canada.
Office of the Chief Actuary (2014), “Actuarial Report (12th) on the Old Age Security Program”, Office of the Superintendent of Financial Institutions Canada, (accessed on March 7, 2017).
Office of the Chief Actuary (2011), “Actuarial Report (9th) on the OAS Program”, Office of the Superintendent of Financial Institutions Canada, (accessed on March 7, 2017).
Phoenix (2011a), “2010 Service Canada Client Satisfaction Survey”.
Phoenix (2011b), “Service Canada Client Satisfaction Survey Presentation of Results”.
Pilieci, Paul J. (2014), “Statistical Profile of Employment among GIS and Allowances Recipients and the Earnings Exemption”, PIMA Pension Research Series, no. 2014-01, ESDC, 11 p.
Schirle, Tammy (2008), “Why Have Labor Force Participation Rates of Older Men Increased since the Mid-1990s?”, Journal of Labor Economics, vol. 26 (4), p. 549 to 594.
Service Canada (2015a), “Information Sheet: Statement of Income for the GIS, the Allowance and the Allowance for the Survivor”, SC ISP-3026A (2015-01-27) E.
Service Canada (2015b), “Office for Client Satisfaction Biannual Report”, April 2015 – September 2015.
Service Canada (2014), “Citizen Service Branch’s Quarterly Newsletter”, volume 2, number 2, December 2014.
Service Canada (2008), “Mystery Shopper Pilot Project Report – In-Person Channel”.
Varian, Hal. R. (1995), “Analyse microéconomique”, De Boeck, Bruxelles.