
Evaluation of the Workplace Equity Program, 2026
On this page
- Executive summary
- Management response and action plan
- Program background
- Key findings
- Appendix A: Logic model - Workplace Equity Program
- Appendix B: Evaluation questions
- Appendix C: Lines of evidence
- Appendix D: Program stakeholders
- Appendix E: Supplementary tables and figures
- Appendix F: References
Alternate formats

Evaluation of the Workplace Equity Program, 2026 [PDF - 9.7 MB]
Large print, braille, MP3 (audio), e-text and DAISY formats are available on demand by ordering online or calling 1 800 O-Canada (1-800-622-6232). If you use a teletypewriter (TTY), call 1-800-926-9105.
List of figures
- Figure 1: Average representation rate of women in LEEP employment groups from 2017 to 2023
- Figure 2: Representation of women in different sectors from 2017 to 2023
- Figure 3: Average representation rate of members of visible minorities in LEEP employment groups from 2017 to 2023
- Figure 4: Representation of members of visible minorities in different sectors from 2017 to 2023
- Figure 5: Average representation rate of Indigenous peoples in LEEP employment groups from 2017 to 2023
- Figure 6: Representation of Indigenous peoples in different sectors from 2017 to 2023
- Figure 7: Average representation rate for persons with disabilities in LEEP employment groups from 2017 to 2023
- Figure 8: Representation of persons with disabilities in different sectors from 2017 to 2023
- Figure 9: LEEP regional variance - Intersectional analysis of women's representation, 2022 (labour market availability attainment rates in private-sector workplaces covered by the EEA)
- Figure 10: Median hourly pay gaps for each designated group and sector under LEEP from 2021 to 2023
- Figure 11: Growth in the number of employers falling under the FCP, by province and census metropolitan area, comparing the periods from 2017 to 2019 and 2021 to 2023
- Figure 12: Representation rate of women for FCP employers from 2017 to 2023
- Figure 13: FCP representation of women by occupational group from 2017 to 2023
- Figure 14: FCP representation of members of visible minorities from 2017 to 2023
- Figure 15: Representation of visible minorities across all occupational groups from 2017 to 2023
- Figure 16: Representation rate of Indigenous peoples for FCP employers from 2017 to 2023
- Figure 17: FCP representation of Indigenous peoples by occupational group from 2017 to 2023
- Figure 18: FCP representation of persons with disabilities from 2017 to 2023
- Figure 19: Representation of persons with disabilities across different occupational groups from 2017 to 2023
- Figure 20: Trends in hiring, promotions, and terminations among FCP employers for full-time employees of each designated group from 2017 to 2023
- Figure 21: Logic model for the Workplace Equity Program
- Figure 22: LEEP representation of women by occupational group from 2017 to 2023
- Figure 23: LEEP representation of members of visible minorities by occupational group from 2017 to 2023
- Figure 24: LEEP representation of Indigenous peoples by occupational group from 2017 to 2023
- Figure 25: LEEP representation of persons with disabilities by occupational group from 2017 to 2023
- Figure 26: LEEP regional variance - Representation in Western region and Thunder Bay, 2022
- Figure 27: LEEP regional variance - Representation in Ontario region (excluding Ottawa), 2022
- Figure 28: Representation rates among LEEP employers in the Quebec and Atlantic regions for 3 designated groups by Census Metropolitan Area, 2022
List of tables
- Table 1: Management action plan for recommendation 1
- Table 2: Management action plan for recommendation 2
- Table 3: Management action plan for recommendation 3
- Table 4: Expenditures for the Program increased steadily between FY 2017 to 18 and 2023 to 24 (millions of dollars)
- Table 5: WORBE funding accelerated beginning in FY 2021 to 22, with a significant increase in contributions and grants through 2022 to 23 and 2023 to 24 (millions of dollars)
- Table 6: Distribution of key informant interviews by stakeholder group
- Table 7: 2022 Regression results for the attainment rates of 3 designated groups
- Table 8: 2022 Regression results of the pay gap of 3 designated groups
List of abbreviations
- CER
- Comprehensive Expenditure Review
- CHRC
- Canadian Human Rights Commission
- CMA
- Census Metropolitan Area
- CSD
- Canadian Survey on Disability
- CSGC
- Common System for Grants and Contributions
- DEP
- Departmental Evaluation Plan
- EEA
- Employment Equity Act
- ESDC
- Employment and Social Development Canada
- FCP
- Federal Contractors Program
- FY
- Fiscal Year
- GLS
- Generalized Least Squares
- LEEP
- Legislated Employment Equity Program
- LMA
- Labour Market Availability
- NAICS
- North American Industry Classification System
- PIP
- Performance Information Profile
- SSPB
- Strategic and Service Policy Branch
- VIF
- Variance Inflation Factor
- WEIMS
- Workplace Equity Information Management System
- WEP
- Workplace Equity Program
- WORBE
- Workplace Opportunities: Removing Barriers to Equity
Executive summary
This report presents the findings from the evaluation of the Workplace Equity Program, hereinafter referred to as 'the Program', administered by the Labour Program within Employment and Social Development Canada (ESDC). The evaluation assesses the relevance and performance (achievement of expected outcomes) of the Program over the period from April 2017 to March 2023. It was completed in compliance with the Policy and Directives on Results and fulfills a Departmental priority.
Program overview
The Workplace Equity Program consists of 3 employment equity programs, each contributing to equitable employment outcomes and fostering equality of opportunities for members of the 4 designated groups, identified in the Employment Equity Act (EEA) as women, Indigenous peoplesFootnote 1, persons with disabilities, and members of visible minorities: (1) the Legislated Employment Equity Program (LEEP); (2) the Federal Contractors Program (FCP); and (3) a grants and contributions program called Workplace Opportunities: Removing Barriers to Equity (WORBE). The logic model for the Program can be found in Appendix A.
The LEEP aims to promote, support, and enhance employment equity outcomes for the 4 designated groups. It applies to federally regulated private-sector workplaces, Crown corporations, and other federal organizations that have 100 or more employees. The goal is to achieve workplace equity by eliminating barriers and correcting conditions of disadvantage for the designated groups with workforce representation measured against their availability in the Canadian labour force.
The FCP requires that provincially regulated private-sector employers with at least 100 employees who enter into contract with the federal government for over $1 million must also implement employment equity.Footnote 2
The Labour Program is responsible for the Employment Equity Act and administers the LEEP and FCP on behalf of the Minister of Jobs and Families, undertaking LEEP report validation, FCP compliance assessments, and follow-up activities to ensure reporting requirements are met within prescribed timelines.
Finally, WORBE is a small, targeted grants and contributions program that supports employers' efforts to improve designated group representation in areas of low representation through partnerships and industry-tailored strategies. Projects funded through WORBE seek to raise awareness, identify barriers and effective practices to remove them, or develop new inclusion tools and guides tailored to industry specific needs. Since its launch in 2014, the WORBE program has funded 29Footnote 3 different projects as of the writing of this report.
Evaluation scope and objectives
This is the fifth program evaluation conducted for the Workplace Equity Program. The previous evaluation was completed in 2018 and covered the period between fiscal year 2011 to 2012 and 2015 to 2016. It examined the relevance and performance of the LEEP, FCP, and WORBEFootnote 4. The main observations of the previous evaluation were:
- the need to re-examine the definitions of designated groups
- the need for greater capacity and resources
- the need to enhance performance measurement and access to information with the Canadian Human Rights Commission (CHRC)
Building on these previous findings, this evaluation focuses on progress since 2017 and program outcomes and their measurement to support future policy and program development in line with departmental priorities. It covers a 6-year period from April 2017 to March 2023Footnote 5. It examines the 3 main employment equity programs (LEEP, FCP, and WORBE).
The Employment Equity Achievement Awards initiative was excluded from the scope of this evaluation due to its small size and inactivity during the COVID-19 Pandemic.
The Program's work in validating LEEP and FCP employer-submitted reports and FCP compliance assessments was also excluded from the evaluation, except in reference to the Program's work in supporting employers in meeting their reporting obligations. While this work makes up a significant portion of the Workplace Equity Division's activities, it fell outside the planned evaluation scope.
Evaluation questions are outlined in Appendix B. A description of the evaluation's methodology, limitations, and mitigation strategies can be found in Appendix C.
Key findings
The evaluation drew on several lines of evidence, which together point to the following key findings. Section 2 provides the evidence underpinning each of the key findings.
1: The Program remains relevant and it continues to provide a structured framework to support federally regulated employers.
2: The Program provides a useful range of tools and training to support employer compliance with the Employment Equity Act. However, systems-related issues and volume pressures during the annual peak reporting period reduce their effectiveness.
3: While WORBE is a small program with a limited number of funded projects, it helped participating employers and eligible organizations build awareness and capacity to advance the Program's objectives. However, evidence suggests that collaboration among funding recipients and efforts to broaden reach were limited in their duration, as there are no requirements to continue activities after funding ends.
4: Consistent with previous reporting trends, federally regulated employers (LEEP) showed progress for visible minorities, while reported outcomes for women, Indigenous peoples, and persons with disabilities remain below labour market availability benchmarks and point to the presence of pay gaps.
5: Provincially regulated employers under the FCP saw modest equity gains, but it is unclear to what extent the Program is contributing to progress.
6: Since the last evaluation, the program has strengthened its performance measurement and data collection methods with regulated employers. However, for WORBE-funded projects, more could be done to improve the Program's ability to track progress and demonstrate results.
Observation and Recommendations
Based on these key findings the evaluation put forward 1 observation and 3 recommendations. Each recommendation is mapped to the corresponding key findings to ensure transparency and traceability of the evidence.
Observation: The Program has been exploring complementary approaches to engage with employers and foster awareness of employment equity practices related to the four designated groups. These practices provide opportunities to further strengthen engagement and increase support to employers.
Recommendation 1: It is recommended that the Program leverage its administrative data to support employers in addressing representation and pay gaps in a targeted manner by developing and implementing sector, region, and occupation-specific resources and activities, tailoring supports for smaller employers.
- Alignment of Findings to Recommendation 1: Program administrative data reveals that members of designated groups working in LEEP and FCP employers continue to face representation and pay gaps (Key findings 4.1, 4.3, 5.1, and 5.2). These gaps may be more or less severe depending on the sector, region, occupation group, and intersections across designated group status (Key findings 4.1 and 4.2). The program currently collects employee data that can be disaggregated on several axes, and, for LEEP, these data are reported to Parliament in the annual EEA report and made publicly transparent via Equi'Vision (Key findings 1.3, 1.4, and 6.1). However, except for specific WORBE projects (Key finding 3.2) that target a particular sector, the Program use of the data to develop interventions and supports was limited during the evaluation period. It should be possible for the Program to utilize its data to target the specific areas in federally regulated workplaces where designated groups are the most disadvantaged and develop specific resources, tailored supports, and interventions to strengthen the promotion of equity within those environments (Key findings 4.4 and 6.2).
Recommendation 2: It is recommended that the Program continue to invest in optimizing the reporting process and enhancing user experience, especially for small- to medium-sized employers. This may involve modernizing or replacing the Workplace Equity Information Management System to simplify the reporting process and a continued effort to develop tools and resources to enhance employers' internal reporting capabilities.
- Alignment of Findings to Recommendation 2: The Program has taken a number of actions to improve its performance measurement since the last evaluation (Key finding 6.1). Additionally, the Program has developed tools and resources which have served to facilitate employers in their reporting (Key finding 2.1) and introduced flexibilities where required (Key finding 1.5). However, limited resources (Key finding 2.2) and an aging Workplace Equity Information Management System (WEIMS) infrastructure (Key finding 6.2) has reduced efficiency, and some employers and program staff report administrative challenges, especially for smaller employers, and potential capacity vulnerabilities (Key findings 6.2 and 2.2, respectively).
Recommendation 3: It is recommended that the Program strengthen the reach and measurement framework of WORBE projects by encouraging cross-pollination among funding recipients and standardizing reporting via common performance indicators across funded projects.
- Alignment of Findings to Recommendation 3: WORBE projects produced valuable outputs (such as toolkits and training materials) that align with program objectives and enhance employer capacity to address sector-specific challenges (Key finding 3.1). However, while the majority of WORBE projects show concrete evidence of dissemination to employers, funding recipients suggest that greater opportunities to collaborate with other funding recipients may enhance the dissemination of knowledge and tools (Key finding 3.2). Furthermore, WORBE project reach may have been limited by short project timelines not allowing for sufficient development of partnerships and little consideration being given to the accessibility and sustainability of project outputs (Key finding 3.3). Finally, inconsistent reporting and lack of common indicators across projects make it difficult to assess the WORBE program's larger system-level impacts (Key finding 6.3). Thus, encouraging greater collaboration among funding recipients and creating a common set of clear outcomes for projects may enable WORBE projects to more demonstrably effect long-term systemic changes in advancement of the program's objectives.
Management response and action plan
Overall management response
The Labour Program welcomes the findings of the Evaluation of the Workplace Equity Program (WEP) and appreciates the comprehensive analysis of its relevance, performance, and areas for improvement. The evaluation confirms that the Program remains relevant, has strengthened the availability and transparency of employment equity data of covered workplaces for designated groups, and continues to support employers in meeting their obligations under the Employment Equity Act (the Act).
Covering the period from April 2017 to March 2023, the evaluation reflects a time of significant transformation for the WEP. Throughout this period, the Program implemented legislative and regulatory changes, including the introduction of pay transparency and pay gap reporting under the Act, the launch of the Government of Canada's public facing website for employment equity data - Equi'Vision, and the introduction of many operational efficiency improvements (for example, implemented new employer onboarding process and resource guide; established a standard sequence for notification of employer reporting obligation emailsFootnote 6, and assigned dedicated Program Officers to support all active employers in meeting their employment equity obligationsFootnote 7). In parallel, the COVID‑19 pandemic created unprecedented challenges that required rapid adaptation to emerging scientific information, new legal considerations, and revised operational procedures to support employers facing workforce challenges during that period (for example accommodating extensions to the June 1, 2020, reporting deadline for LEEP employers).
Management agrees with the recommendations and views them as aligned with ongoing program improvement and strengthening efforts implemented during the evaluation period (2017 to 2023) and more recently, including data-driven policy development, digital transformation, and enhanced employer engagement. Actions outlined below build on existing initiatives and are intended to be implemented within current authorities and available resources, subject to future funding and government priorities.
The recommendations of this evaluation support the Program's ongoing commitment to continuous improvement. They will inform efforts to strengthen service delivery, improve compliance, and further enhance the tools, data, procedures, and communications that underpin the effective implementation of the Act.
The Labour Program will carefully consider the operational impacts of proposed changes, ensuring that any enhancements improve program effectiveness while minimizing unnecessary burden on workplaces. It will be important to acknowledge that as part of this work, the Program will also examine opportunities to align its approaches with international best practices in employment equity, supporting a modern and forward‑looking regulatory framework.
In addition, the Government of Canada's Comprehensive Expenditure Review (CER) may influence the prioritization and sequencing of future actions. The CER process also presents opportunities to streamline activities, strengthen internal efficiencies, and ensure the Program continues to deliver value for Canadians.
Through these efforts, the Labour Program will refine and modernize its approaches, ensuring that the WEP meets its objectives and supports safe, fair and healthy workplaces for all federally regulated employees.
Recommendation 1
It is recommended that the Program leverage its administrative data to support employers in addressing representation and pay gaps in a targeted manner by developing and implementing sector, region, and occupation-specific resources and activities, tailoring supports for smaller employers.
Management response
The Labour Program agrees with this recommendation.
Administrative data is critical to understanding where representation and pay gaps persist and to ensuring that program interventions are evidence‑based, targeted, and effective. By leveraging detailed administrative data, the Program can move beyond broad, one‑size‑fits‑all approaches and identify sector‑, region‑, and occupation‑specific disparities, as well as the distinct challenges faced by smaller employers.
The Program notes that it has already begun leveraging its administrative data to support more proactive compliance and strategic enforcement approaches, including the identification of trends and risk areas related to reporting quality and timing. This work is ongoing and will continue to be strengthened over time through the integration of additional data elements, enhanced analytical capacity, and the targeted use of evidence to inform program activities.
Building on this foundation, the Program will further enhance its use of data to support targeted guidance and interventions, with particular attention to employers with limited internal capacity and smaller employers.
| Management action plan | Planned completion date | Action statusFootnote 8 | Accountable lead(s) |
|---|---|---|---|
| 1.1 Use existing LEEP and FCP administrative data and Equi'Vision insights to support proactive compliance and strategic enforcement approaches, including the identification of priority sectors, regions, and occupational groups experience persistent representation and pay gaps Activity lead: Workplace Equity Division, Labour Program Target: FY 2026 to 2027 |
2027 March |
In progress | Lead: Director General, Federal Programs, Compliance, Operations and Program Development, Labour Program Support: Director General, Compliance, Canadian Human Rights Commission |
| 1.2 Develop and disseminate targeted guidance products (for example, sector- or occupational specific briefs, case examples, webinars) tailored to the needs of small- and medium sized employers Activity lead: Workplace Equity Division, Labour Program Target: FY 2027 to 2028 |
2027 September |
Yet to commence | Lead: Director General, Federal Programs, Compliance, Operations and Program Development, Labour Program Support: Director General, Compliance, Canadian Human Rights Commission |
| 1.3 Integrate findings from data analyses into WORBE funding priorities and employer outreach activities, where appropriate Activity lead: Workplace Equity Division, Labour Program Target: 2029 to 2030 |
2029 October |
Yet to commence | Director General, Federal Programs, Compliance, Operations and Program Development, Labour Program |
Recommendation 2
It is recommended that the Program continue to invest in optimizing the reporting process and enhancing user experience, especially for small- to medium-sized employers. This may involve modernizing or replacing the Workplace Equity Information Management System to simplify the reporting process and a continued effort to develop tools and resources to enhance employers' internal reporting capabilities.
Management response
The Labour Program agrees with this recommendation.
The Program acknowledges that system limitations and reporting complexity can create administrative burden for employers and internal pressures during peak reporting periods. The Program will continue to explore options to modernize reporting tools, improve user experience, and strengthen complementary guidance materials.
Management action plan |
Planned completion date |
Action status |
Accountable lead(s) |
2.1 Assess and advance options for the replacement of WEIMS with a modern, user-centred digital reporting system, including alignment with ESDC digital standards and enterprise platforms, and identify risks, dependencies, and resource implications Activity lead: Workplace Equity Division, Labour Program Target: FY 2026 to 2027 |
2026 September |
In progress |
Director General, Federal Programs, Compliance, Operations and Program Development, Labour Program Support: Innovation, Information and Technology Branch, ESDC |
2.2 Implement incremental improvements to the current reporting process (for example, clearer guidance, job aids, webinars, and peak-period communications) to reduce burden while longer-term systems options are explored Activity lead: Workplace Equity Division, Labour Program Target: FY 2027 to 2028 |
2027 December |
In progress |
Director General, Federal Programs, Compliance, Operations and Program Development, Labour Program |
2.3 Strengthen employer self-service resources to enhance internal reporting capacity, with emphasis on smaller employers Activity lead: Workplace Equity Division, Labour Program Target: FY 2027 to 2028 |
2027 June |
Yet to commence |
Director General, Federal Programs, Compliance, Operations and Program Development, Labour Program |
Recommendation 3
It is recommended that the Program strengthen the reach and measurement framework of WORBE projects by encouraging cross-pollination among funding recipients and standardizing reporting via common performance indicators across funded projects.
Management response
The Labour Program agrees with this recommendation.
The Program recognizes the value of collaboration among WORBE recipients and the need for more consistent performance measurement to better assess outcomes and system-level impacts. The Program notes that work is already underway through an existing pilot with Impact Canada.
While the WORBE program supports activities that can catalyze sustained impact, its capacity is shaped by a limited annual budget and maximum project durations. Within these parameters, the Program is positioned to enable the early stages of broader change but cannot fully fund multi‑phase or long‑horizon initiatives from end to end.
Going forward, the Program will continue to encourage applicants to articulate both near‑term results achievable within the funding period and the expected longer‑term outcomes that may occur through ongoing efforts beyond program support. Management will also explore opportunities, within existing authorities and resources, to further clarify expectations related to achievable outcomes, ensuring alignment between program capacity, project scope, and anticipated results.
Management action plan |
Planned completion date |
Action status |
Accountable lead(s) |
3.1 Leverage the ongoing pilot project with Impact Canada to test and refine approaches for encouraging knowledge sharing, and strengthening collaboration among WORBE funding recipients Activity lead: Workplace Equity Division, Labour Program Target: FY 2026 to 2027 |
2027 March |
In progress |
Director General, Federal Programs, Compliance, Operations and Program Development, Labour Program Support: Impact Canada, Privy Council Office Program Operations Branch, ESDC |
3.2 Use lessons learned from Impact Canada pilot to inform the development of common performance indicators and clearer outcome measurement expectations for future WORBE calls for proposals Activity lead: Workplace Equity Division, Labour Program Target: Ongoing |
2027 September |
Yet to commence |
Director General, Federal Programs, Compliance, Operations and Program Development, Labour Program |
Program background
Introduced in 1986, the Employment Equity Act (EEA) aims to achieve equality in the workplace so that no person is denied employment opportunities or benefits for reasons unrelated to ability and, in the fulfilment of that goal, to correct the conditions of disadvantage in employment experienced by 4 designated groups working in federally regulated workplaces: women, Indigenous peoplesFootnote 9, persons with disabilities, and members of visible minorities. To that end, the EEA encourages the establishment of working conditions that are free from barriers; seeks to correct conditions of disadvantage in employment and promotes the principle that it requires special measures to accommodate differences for the 4 designated groups in Canada.
The Workplace Equity Program comprises 3 programs: (1) the Legislated Employment Equity Program (LEEP); (2) the Federal Contractors Program (FCP); and (3) a grants and contributions program called Workplace Opportunities: Removing Barriers to Equity (WORBE).
The Labour Program is responsible for delivering the Workplace Equity Program and ensures that the following employers understand the Act and its requirements so they can meet their obligations:
- federally regulated employers, covered under LEEP
- provincially regulated employers, covered under the FCP
Under LEEP, the Labour Program validates the employment equity reports of federally regulated private-sector employers with at least 100 employees and reports on aggregate progress annually to Parliament (LEEP). Under the FCP, it ensures that provincially regulated private‑sector employers with at least 100 employees holding federal contracts $1 million or more fulfill their employment equity obligations by conducting compliance assessments on a scheduled basis. Given WORBE's small and targeted nature, the Program provides policy leadership and data analysis to identify areas of focus and parameters for project funding opportunities.
The Labour Program also provides support to employers in meeting their obligations through client service channels (for example, by developing and maintaining tools, electronic reporting systems, and guides or by providing responses to email and telephone enquiries). In addition, it:
- conducts research on employment equity in support of policy and program development
- undertakes engagement initiatives to promote the importance of employment equity
- develops and leverages tools and utilizes communication channels to support awareness of those tools and promotional initiatives
- supports the Minister by providing advice and developing policies, programs, and recommendations regarding the implementation of equity in the federally regulated private sector and among federal contractors
Program expenditures
Table 4 illustrates the overall program annual budget for the Labour Program's Workplace Equity Division between fiscal years 2017 to 2018 and 2023 to 2024. The figures are inclusive of both voted and statutory (Employee Benefit Plan) budgeted and actual expenditures. Note that the Vote 5 budgeting for fiscal years 2022 to 2023 and 2023 to 2024 are included as they are rolled up in the reporting for total actual voted expenditures.
| Fiscal Year | 2017 to 2018 | 2018 to 2019 | 2019 to 2020 | 2020 to 2021 | 2021 to 2022 | 2022 to 2023 | 2023 to 2024 |
|---|---|---|---|---|---|---|---|
| Budgeted total (planned) | 1.56 | 1.62 | 3.72 | 2.23 | 2.25 | 5.00* | 4.76* |
| Total expenditures (actual) | 1.20 | 1.38 | 2.07 | 2.74 | 3.95 | 4.59** | 4.21** |
- Source: InfoBase and ESDC Chief Financial Officer Branch
- *Includes $2.5 million in Vote 5 (grants and contributions) funding designated for WORBE.
- **Includes expenditures related to the $2.5 million budgeted grants and contribution funding as well as the regular program expenditures.
The WORBE grants and contributions projects are funded separately, through the Labour Funding Program. The Fall Economic Statement 2020 expanded the WORBE program in November of 2020. Starting in fiscal year 2021 to 2022, WORBE grants and contributions funding was raised from $500,000 annually to $2 million, followed by an annual allocation of $3 million starting in fiscal year 2022 to 2023.
During the evaluation period, WORBE funded 27 projects, 11 of which were launched in 2022 to 2023. The amount of funding received per project varied. At the upper limit, certain large projects received just under $1.5 million, while some smaller projects were funded under $100,000. Project durations range from less than a year for several smaller projects, to 2 to 3 years for some larger projects. In general, the earlier projects received smaller contribution amounts, whereas the most recent call for proposals had several multi-year projects funded for $1 million or more.
The specific budgeted and actual expenditures for the WORBE grants and contributions can be found in Table 5. Note that transfers are considered when reporting budgeted numbers.
| Fiscal Year | 2017 to 2018 | 2018 to 2019 | 2019 to 2020 | 2020 to 2021 | 2021 to 2022 | 2022 to 2023 | 2023 to 2024 |
|---|---|---|---|---|---|---|---|
| Budgeted total (planned) | 0.50 | 0.50 | 0.50 | 0.50 | 2.00 | 3.00 | 3.00 |
| Total expenditures (actual) | 0.48 | 0.37 | 0.45* | 0.40 | 1.81 | 1.05** | 3.24*** |
- Source: Program data
- Notes:
- *Includes a roughly $28,000 transfer from WORBE contributions to Grants for Labour
- **Includes a transfer of $500,000 to the WORBE grants, a $1.1M transfer to the Social Development Partnerships Program - Disability grant, and an approximately $79,000 transfer to Labour's International program.
- ***Funds transferred to WORBE contributions for Fiscal Years 2023 to 2024 and 2024 to 2025 due to delays in FY2022 to 2023 agreements.
Since the 5-year average expenditures of this program's grants and contributions component are less than $5 million per year, the Financial Administration Act's mandatory 5-year evaluation cycle does not apply, as detailed in the Policy on Results. It nevertheless continues to be a Departmental priority to evaluate the Workplace Equity Program periodically.
Program stakeholders
The Workplace Equity Program operates within a complex network of stakeholders (organizations and parties), each playing a distinct role in advancing equity in federally and provincially regulated workplaces (for more details please refer to Appendix D).
- Parliament of Canada provides the legal foundation for the Program, the Employment Equity Act, which embeds employment equity principles within federal labour policy.
- Employment and Social Development Canada (ESDC), through the Labour Program, is responsible for developing Regulations in support of the Act, monitoring compliance under the LEEP/FCP, and administrating WORBE projects.
- Canadian Human Rights Commission conducts audits and ensures adherence to equity standards.
- Public Services and Procurement Canada and other federal contracting authorities communicate contract information to the Workplace Equity Program for the purpose of administering the FCP.
- Provincial programs and policies may complement these federal efforts, though they are administered separately and distinctly under provincial jurisdiction.
The Program's stakeholders also include a broad range of parties who influence policy and implementation by representing workers' interests and supporting equity initiatives:
- Labour Organizations (for example, unions) advocate for fair employment practices and monitor compliance.
- Industry and Employer Associations provide input on operational realities and best practices.
Note that the latter 2 stakeholder groups may or may not have an ongoing relationship with the Program but have been involved in consultations and are active in the employment equity space.
Key findings
Key finding 1
The Program remains relevant and continues to provide a structured framework to support federally regulated employers.
1.1 The Program addresses a continuing need for more inclusive workplaces within the federally regulated sector
The Employment Equity Act (EEA) requires federally regulated employers to correct disadvantages experienced by the 4 designated groups and implement reasonable accommodations and special measures to promote equal opportunity and fair treatment.
The need for the EEA is evidenced by persistent disparities in labour market outcomes between designated and non‑designated groups. LEEP administrative data show that, despite incremental improvements over time, members of designated groups continue to experience uneven progress compared to non‑designated groups, resulting in persistent representation gaps and ongoing labour market inequities. For example, women continue to face barriers to equitable participation with a representation rate that remained stable over the evaluation period at approximately 40%, which is below their LMA of 48% in the labour market. The data also indicate persistent under‑representation of Persons with disabilities, and Indigenous peoples relative to their labour market availability, with continued gaps in recruitment, retention, and advancement.
Document review confirms that through the administration of the EEA, the Program has helped promote equitable outcomes by requiring employers to report on workforce representation, and supporting them in identify representation gaps, and implementing measures to improve the representativity of designated groups.
Most of the key informant interview participants (21 out of 24), including employers, program staff, and representatives of various stakeholder organizations, expressed clear recognition of the Program's necessity. They cited its role in supporting inclusive workplaces and encouraging employers to recruit more widely. These participants noted that the Program is valuable and advocated for its expansion beyond the designated groups to reflect demographic and social changes.
For example, all LEEP employers interviewed (9 out of 9) reported that the Program provided a standardized approach to managing data on employment equity among federally regulated private-sector employers and encourages transparency and accountability.
While the results were mixed for FCP, most of the FCP employers interviewed (3 out of 5) indicated that the program remains relevant, particularly in helping to address systemic employment barriers and supporting more inclusive and representative workplaces.
All WORBE funding recipients interviewed (4 out of 4) also felt that the Program is relevant because there continue to be disadvantages and systemic barriers in the employment environment that need correcting.
The sole Labour Organization representative interviewed viewed federal employment equity programs as a moral obligation for Canada to ensure equity in the Canadian employment landscape in line with its international commitments.
Employer Association representatives interviewed (2 out of 4) also acknowledged that the Workplace Equity Program remains a valuable framework by providing guidance, structure, and accountability for employers seeking to create more inclusive workplaces. They emphasized its continued importance, particularly in advancing equity for persons with disabilities and Indigenous peoples. However, 1 representative from an Industry association noted that many of the objectives pursued by the Program are already being achieved by industry and society, suggesting that its overall relevance may be diminishing as broader practices evolve.
The majority (3 out of 4: 1 of 2 LEEP and 2 of 2 FCP) of the case study participants also believed that federal employment equity programs remain useful in ensuring fairness in Canadian workplaces. This is consistent with the 2023 Government of Canada Task Force review of the Act, which, among other things, recommended broadening the designated group categories to ensure that employment equity legislation reflects the diversity of the Canadian labour market.
1.2 The Program is consistent with the federal government's jurisdiction over federally regulated workplaces
The EEA is generally consistent with the federal government's constitutional role in labour relations, as it applies to federally regulated employers and the federal public service, as well as federal contractors (as per federal government authority over its own procurement and spending).To that end, the EEA requires federally regulated employers as well as federal contractors to identify and remove systemic barriers and take proactive measures to ensure equitable representation of designated groups. LEEP aims to promote, support and enhance employment equity outcomes for the 4 designated groups. The goal is to achieve workplace equity by eliminating barriers and correcting conditions of disadvantage for the designated groups with workforce representation measured against their availability in the Canadian labour force. Similarly, FCP which applies to provincially regulated employers who enter into contracts with the federal government, requires them to implement employment equity.
The EEA also supports employer compliance by assigning the Canadian Human Rights Commission (CHRC) the responsibility to conduct audits that verify adherence to the Act, when employers do not meet their obligations under the EEA. This is also consistent with the federal government's constitutional role.
1.3 The Program aligns with federal priorities
The EEA continues to serve as one of the main federal instruments for advancing employment equity and reducing systemic barriers in Canadian workplaces. It operates in complement with other legislative and policy measures, including the Pay Equity Act, the Accessible Canada Act, and broader Government of Canada commitments aimed at reducing education and employment gaps for Indigenous peoples. Consistent with the federal priorities, most program representatives interviewed (5 out of 6) expressed strong confidence that the Program is well aligned with government priorities, emphasizing its role in fostering a fair labour market, promoting employment equity more broadly, and contributing to more positive and culturally inclusive workplaces.
Finally, the Program's design ensures consistent reporting of equity data in Canada. Key informants emphasized that the Program's design is central to its continued relevance.
All LEEP and FCP key informants (13 total) indicated reported that the Program's standardized and uniform approach to reporting managing equity data provides employers with a consistent framework for meeting obligations under the Employment Equity Act. This design feature was seen as ensuring comparability of employer practices across sectors and reinforcing accountability. Most Program representatives (5 out of 6) also confirmed the necessity of this design, noting that the structured reporting system and regulatory updates align with the Program's mandate to create a fair labour market for the program's targeted areas.
By supporting employers' efforts to improve designated group representation in areas of low representation through partnerships and industry-tailored strategies, WORBE's design also aligns with the Program priorities in relation to employment equity.
WORBE administrative data analysis shows that most projects (18 out of 22) produced expected outputs, often in the form of toolkits, webinars, sector guides, training materials, and reports. These outputs explicitly aligned with WORBE's objectives: raising awareness, improving employer understanding of equity barriers, and promoting inclusive practices. This alignment suggests that WORBE-funded projects are positioned to help inform employer awareness and inclusive practices.
1.4 The Program evolved to stay relevant within the changing Canadian contexts and in alignment with international commitments
Canada's employment equity framework has evolved in response to significant labour market transformations over the past decade. It also aligns with the Canadian Human Rights Framework and international commitments.
Shifts in demographics, work structures, and workforce diversity have created new realities that require equity policies to reflect the dynamic nature of the labour market. This is consistent with Canada's international commitments to human rights and inclusion. As noted in the Labour Program Internal Review of the Employment Equity Act & Regulations, Canada demonstrates leadership internationally in advancing employment equity:
“Internationally, Canada is recognised as a world leader in supporting diversity and inclusion for women, Indigenous peoples, persons with disabilities and visible minorities in the nation’s social and economic life. At the federal level, Canada has opted for legislation that addresses employment discrimination and ensures a proactive approach to employment equity for four designated groups.” (Labour Program -Environmental Scan: International Overview (Dec 2016)
Document review shows that the 2018 Budget introduced new obligations for employers in the federally regulated private sector, including the implementation of the Pay Equity Act and expanded reporting on pay gaps for all 4 designated groups. This strengthened legislative framework positioned Canada, in 2024, as the first country to publicly release detailed employer level data on workforce representation and pay disparities.
Some interviewed LEEP and FCP employers (6 out of 14) appreciated the transparency embedded in the Program's design. A majority of FCP key informants (3 out of 5), however, found the inclusion of the additional reporting fields on pay gaps in Workplace Equity Information Management System (WEIMS) to be confusingFootnote 10 and called for clearer guidance.
The review of program documents also shows that the Program commissions research to strengthen the evidence base for employment equity. For example, in 2022, the Workplace Equity Division funded the Behavioural Insights Team Canada to produce How to Improve Workplace Equity. This research summarized proven workplace equity practices and identified gaps where evidence was weak. The document was published online for public access and features in the Program onboarding materials for LEEP and FCP employers.
Furthermore, a 2023 research study commissioned by the Program examined underreporting among designated groups (which it found can be up to 23% for members of designated groups in the study). It found, among other things, that more inclusive survey language improves self‑identification rates. Using this research, the Program developed and published a new suite of resourcesFootnote 11 for employers to provide evidence-backed approaches to addressing underreporting.
As required by the EEA, the Program also submits an annual report on equity data to Parliament, keeping government and Canadians informed of LEEP employers' progress in implementing employment equity.
1.5 The Program adapted to employer realities during the COVID-19 Pandemic
The review of program documents revealed that, during the COVID-19 Pandemic, the Program demonstrated flexibility in adapting to employer needs. This included extending reporting deadlines and allowing unsigned submissions when restrictions made it difficult to obtain signatures.
According to the document review, during the Pandemic, the Program also extended reporting deadlines for data submission, provided guidance relating to the extended call-backs for temporary layoffs (aligned with temporary amendments made to the Canada Labour Standards Regulations), and suspended the annual achievement awards to reduce burden on employers.
Of the employers interviewed, 1 (out of 8) LEEP employer and 1 (out of 5) FCP employer noted that the data submission deadline extensions were helpful in alleviating the increased pressures they faced due to the COVID-19 Pandemic.
These COVID-19 adjustments reinforced the Program's capacity to adapt and balance federal accountability requirements with the unprecedented operational realities faced by employers during this period.
Key finding 2
The Program provides a useful range of tools and training to support employer compliance with the Employment Equity Act. However, systems-related issues and volume pressures during the annual peak reporting period reduce their effectiveness.
2.1 LEEP and FCP tailored supports combine standardized guidance with evolving tools
A review of Program documents revealed that, under the Employment Equity Act, federally regulated employers in the Legislated Employment Equity Program (LEEP) are obligated to submit annual employment equity reports, including workforce representation and pay gapFootnote 12 data for designated groups and narrative reports of activities to the Program by June 1 each year. These data and narratives explain the actions taken, corresponding results, and consultations with employees to advance equity in the workplace.
Similarly, contractors under the Federal Contractors Program are required to report on their workforce representation as well as hiring, promotion, and termination data to the Program 1 year after contract award date and every 3 years thereafter, as well as a workforce analysis and achievement report demonstrating progress towards equity targets.
The Program offers an array of supports to employers to assist with their submissions, including guidance, tools, and reporting systems. These supports help employers subject to the LEEP and FCP, as well as WORBE participants access accurate equity data, adopt best practices, and comply with their employment equity obligations.
Document reviews and key informant interviews revealed that the Program supports LEEP employers by providing onboarding guides, templates, webinars, proactive email reminders, and direct advice from Program Advisors. Most interviewed LEEP employers (7 out of 9) reported being highly satisfied with these supports, noting they enabled them to meet their obligations more efficiently.
A review of program documents revealed that the FCP, in addition to some shared tools with LEEP, has dedicated tools for compliance and monitoring. For example, FCP developed standard tracking documents and assessment tools to ensure compliance assessments are consistent and timely. Most FCP key informants (4 out of 5) valued this support, citing the role of Advisors in clarifying obligations under the FCP. Evidence from FCP administrative data shows that 75% of compliance assessments were completed within 6 months, though employers emphasized that further simplification of templates could reduce burden.
The document and WORBE administrative data reviews found that some WORBE projects developed training materials to be used by employers to increase awareness and provide direct support in their efforts to achieve employment equity. For instance, one WORBE project developed new sector-specific human resources tools based on consultations with employers to facilitate data reporting given the unique data challenges faced in the transportation sector.
2.2 The Program's employer support model is primarily delivered through one-on-one guidance by Program Advisors, which can be resource intensive
Some Program representatives interviewed (2 out of 6) noted that the current case management ratio is approximately 200 files per Advisor, with approximately 55% of the files representing LEEP employers and the rest FCP per fiscal year. LEEP employers must report annually by June 1, whereas FCP reporting occurs at varying times throughout the year for each employer, starting 1 year after the contract award date and then on a 3-year cycle thereafter. According to those informants, this could create a capacity vulnerability, particularly during the peak of the LEEP reporting cycle (late May to early June).
A majority of Program officials interviewed (4 out of 6) noted that enhancing Program Advisor capacity and offering awareness and information workshops or seminars for employers could reduce employers' reliance on Program Advisors for guidance. At least 4 workshops or webinars were held over the evaluation period, and Program officials interviewed suggested that increasing the frequency and number of these learning opportunities could strengthen employer capacity and further reduce employers' dependence on Advisors. During the evaluation period, the Program strengthened partnerships with external stakeholders, including the Canadian Human Rights Commission, Statistics Canada, and Employer Associations (such as the Canadian Bankers Association and the Canadian Trucking Alliance) by hosting or participating in collaborative meetings and discussions related to employment equity planning and program delivery. However, these collaborations were only observed by a few (3 out of 14) interviewed representatives from LEEP and FCP employers.
Key finding 3
While WORBE is a small program with a limited number of funding projects, it helped participating employers and eligible organizations build awareness and capacity to advance the Program's objectives. However, evidence suggests that collaboration among funding recipients and efforts to broaden reach were limited in their duration, as there are no requirements to continue activities after funding ends.
3.1 Some WORBE projects led to the development of tailored training tools to support employers. Most applicants reported a smooth application process, but some experienced challenges with clarity and consistency
Document and administrative data review revealed that some WORBE projects developed training materials to be used by employers to increase awareness and provide support to employers in their efforts to achieve employment equity.
For example: a WORBE funding recipient, in addition to hosting awareness workshops and a business forum, created training materials for disability awareness and a tool kit which were used by some employers in the transportation industry in British Columbia to encourage the advancement of persons with disabilities within the industry.
Similarly, as one of its project objectives, another WORBE project developed a 4-page digital tool kit providing information on representation statistics for black Canadians and how employers can promote further representation; upward mobility, and approaches that can be taken to advance one’s career as a Black Canadian; and a financial literacy toolkit for Black Canadians. The project also engaged 25 employers on barriers and issues faced by Black Canadians in the financial sector.
Most of the WORBE funding recipient key informants (3 out of 4) also agreed that the Program contributes to reducing barriers to employment by enhancing representation. Most also (3 out of 4) perceived the requirements in the Program calls for proposals to be appropriate.
WORBE's Client Experience survey found that 73% of applicants (both funding recipients and non-funded applicants) reported the application process as easy, and 77% found it smooth to move through the application steps.
While the majority of applicants reported a positive experience, the survey also revealed that 14% of applicants experienced problems with the call for proposal process. Some of the issues they experienced included the time required for ESDC to make a decision, difficulty updating applications after initial submission, and a lack of clarity.
These survey responses are in line with the perception of some WORBE key informants (3 out of 4) regarding the appropriateness of the requirements in the calls for proposals. In response to this feedback, the Program has already been making changes such as updating the general distribution mailbox to provide automatic replies to queries and creating a new webpage template with increased clarity on the process.
3.2 Proactive dissemination strategies showed some evidence of reaching beyond funding recipients to influence workplace practices
As part of the review of WORBE administrative data, the evaluation made targeted online searches to verify the public availability and accessibility of WORBE project funded outputs, identify additional dissemination channels, and detect evidence of third-party engagement. Digital footprint scans confirmed that a majority of the WORBE-funded projects reviewed (14 out of 22) had publicly available outputs and employer-related events.
All WORBE funding recipients interviewed (4 in total) stated their projects raised awareness and provided sector-tailored tools. The document review mostly confirmed this, as the majority of the WORBE-funded projects (16 out of 22) documented employer engagement, such as event participation or requests for follow-up or additional resources. In some cases, employers incorporated project tools into human resources processes or diversity training. Digital scans also showed reposting of project materials by third parties, with the potential of expanding the reach of their developed materials to employers outside the immediate project network.
Nevertheless, most WORBE funding recipients interviewed (3 out of 4) suggested the Program could benefit from additional channels to coordinate efforts and disseminate findings, especially with other funding recipients to foster project momentum and extend reach to more stakeholders. This could potentially occur through facilitated sessions or a community of practice, which the Program initiated in 2023. Reinstating this practice could further project outcomes by creating more opportunities to share information, disseminate project findings, and foster networking among recipients and employers.
3.3 Uneven output accessibility may have limited sector-wide uptake while short project cycles lacking follow-up mechanisms reduced potential for long-term impact
According to the WORBE administrative data and document reviews, while the majority of the funded projects (12 out of 22) produced public, open-access resources, others had no or limited online presence. Further, while not required under the project funding agreement, only a few projects (2 out of 22) included bilingual materials, screen-readable formats, or plain-language summaries, which are items that have been noted from a federal lens as good practices that support government prioritiesFootnote 13.
Funding cycles ranged from 18 months to 3 years. While falling into a normal range for ESDC grants and contributions, half of WORBE funding recipients interviewed (2 out of 4) viewed the duration of their project as too short to establish lasting partnerships or embed changes in employer practice.
Half of WORBE funding recipients interviewed (2 out of 4) raised concerns about the continuity of their project activities after the end of the project. The review of WORBE projects revealed that, at the moment, there is no requirement for funding recipients to establish strategies for projects to continue after funding ends.
Key finding 4
Consistent with previous reported trends, federally regulated employers (LEEP) showed progress for visible minorities, while reported outcomes for women, Indigenous peoples, and persons with disabilities remain below labour market availability benchmarks and point to the presence of pay gaps.
Evidence for Key finding 4 is primarily drawn from data uploaded by employers via WEIMS, for LEEP (including representation and pay gap information) and FCP (focusing on representation). The benchmark for labour market availability for women, Indigenous people and visible minorities is based on the 2016 Census. For individuals with disabilities, the benchmark for labour market availability is based on population survey data gathered from the 2017 Canadian Survey on Disability.
The following data offer an overview of workforce representation and pay disparities for the 4 designated groups (women, visible minorities, Indigenous peoples, and persons with disabilities. It illustrates the representation and wage gaps among LEEP employers across various economic sectors, occupations, and geographic regions (including Census Metropolitan Areas). This data has also been used to run regression analyses to inform the factors influencing variations in representation and pay. The program has several indicators related to these which they monitor.
It should be acknowledged that numerous factors beyond employers' internal practices influence representation and pay outcomes, and therefore, the results cannot be solely attributed to the Program. Several external factors impact workforce representation and wage gaps. They include changes in the level of workforce turnover (affecting the extent of hiring and promotions), educational and occupational choices made by individuals, availability of qualified candidates, factors affecting employers' operations and competing with equity goals (such as downsizing) as well as complementary federal or provincial programs and policies with equity objectives.
The Program also has a limited enforcement role, with the Canadian Human Rights Commission being responsible for compliance audits of LEEP employers. Thus, while the Program may be influencing employer equity practices, observed changes in employment outcomes over time cannot be attributed to the Act or Program activity.
4.1 Progress in representation rates was uneven, with visible minorities showing steady gains while other groups continue to experience pay gaps
The Program uses representation rates for the 4 designated groups as a proxy indicator to infer the extent to which it fosters a work environment that promotes equality of opportunities.
Some interviewed LEEP employers (4 out of 9) reported a tangible effectFootnote 14 stemming from the Program, citing observable changes in diversity and accountability. The majority of LEEP key informants (5 out of 9), however, reported limitedFootnote 15 to zero effectFootnote 16, noting their organizations were already committed to equity and/or driven by business needs.
According to the LEEP administrative data review, large, long-tenured employers were more likely to report progress, which is consistent with regression results (consult section 4.4 for additional details). For example, regression results suggests that employer operational tenure with more than 100 employees and size are associated with stronger outcomes for Indigenous peoplesFootnote 17 and members of visible minorities. Appendix E contains detailed regression results and coefficient tables.
More broadly, the analysis of administrative data shows mixed progress during the evaluation period towards advancing equity for the 4 designated groups among LEEP employers.
Representation rate refers to the percentage of employees in a workforce (or a defined segment of that workforce) who self-identify as members of the designated group. The labour market attainment rate, defined as the proportion of individuals from an employment equity group within an employer's workforce compared to the proportion of that group in the relevant labour market. Labour market availabilityFootnote 18 indicates whether a designated group is under‑represented, equitably represented, or over‑represented relative to its availability in the workforce.
The following list outlines the definitions of the key concepts used in the following section.
1) Employer's workforce representation: The proportion of an employer's workforce that belongs to a designated group (federal-jurisdiction employees only)
2) Labour market availability: The proportion of that group in the relevant labour market (for the Canadian labour force under both provincial and federal jurisdictions)
3) Attainment rate: The ratio of the workforce representation (1) and labour market availability (2)
The trends of workforce representation are presented in this section by designated group.
Women
The representation rates for women remained stable at about 40%, below the overall labour market availability (LMA) of 48%. Figure 1 illustrates the change in women's representation over time.
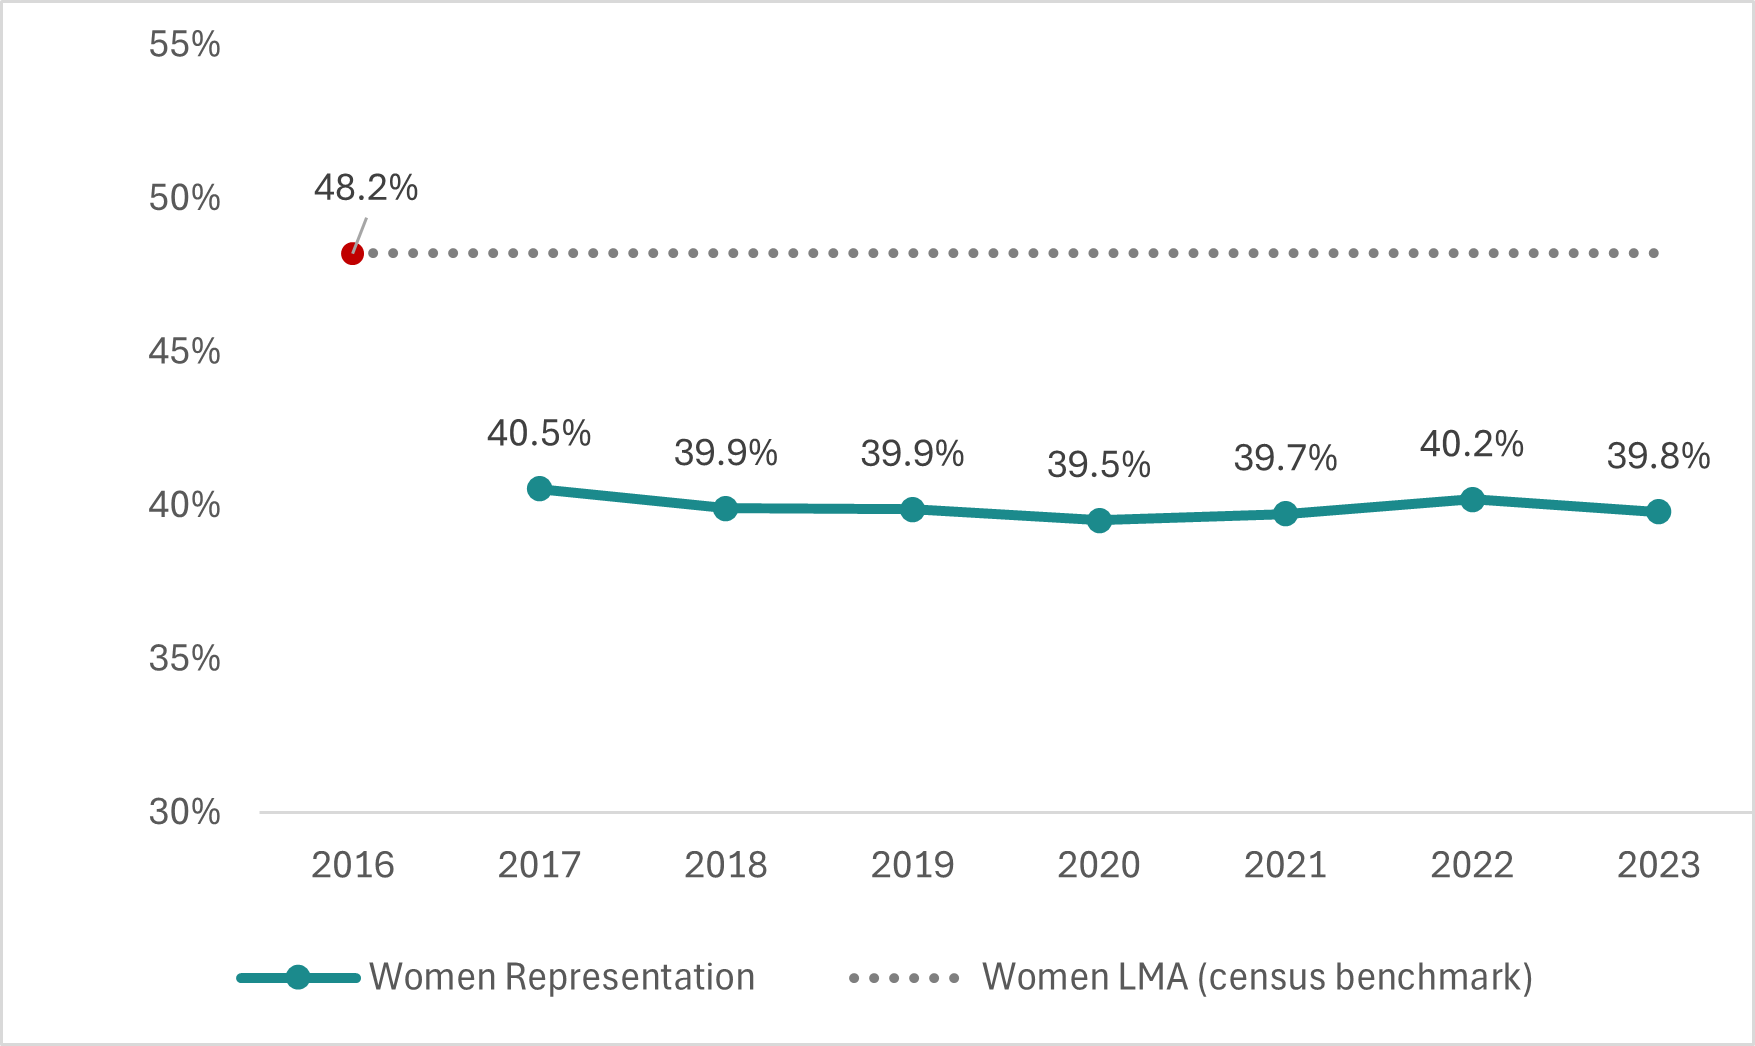
Figure 1: Text description
| Year | 2016 Census benchmark (LMA) | 2017 | 2018 | 2019 | 2020 | 2021 | 2022 | 2023 |
|---|---|---|---|---|---|---|---|---|
| Women' representation | 48.2% | 40.5% | 39.9% | 39.9% | 39.5% | 39.7% | 40.2% | 39.8% |
- Source: LEEP administrative data; Census 2016
Analysis of women's representation rates across sectors and occupations shows differences in workforce representativity outcomes (Figure 2). Banking and Financial services is the only sector which has an LMA where women make up more than half of the workforce, at 58.9%. This is also the only sector that has declining representation for women. Communications, Transportation and 'Other' sectorsFootnote 19 remain relatively stable over the years.
In all sectors, women are underrepresented among federally regulated employees compared to the LMA for those sectors (which reflects workers under both provincial and federal jurisdiction), except for the Transportation sector, where women's representation consistently exceed their LMA.

Figure 2: Text description
| Sector | 2017 | 2018 | 2019 | 2020 | 2021 | 2022 | 2023 | LMA |
|---|---|---|---|---|---|---|---|---|
| Banking & Financial Services | 57.9% | 56.8% | 56.2% | 55.5% | 54.8% | 54.3% | 54.0% | 58.9% |
| Communications | 35.0% | 34.7% | 34.8% | 35.7% | 36.0% | 35.6% | 34.8% | 44.1% |
| Transportation | 33.1% | 33.0% | 33.1% | 31.0% | 31.8% | 34.1% | 33.9% | 25.3% |
| 'Other' | 27.8% | 27.6% | 28.1% | 27.9% | 28.1% | 28.4% | 27.8% | 34.5% |
- Source: LEEP data; Census 2016
Women's representation rates among federally regulated employees vary across different occupational groups. For example, during the evaluation period, women gained representation among Senior Managers and lost representation in Administrative & Senior Clerical Personnel, Skilled Sales and Service Personnel, and Clerical Personnel. Still, women's representation among federally regulated employees exceeded labour market availability in Senior Managers, Middle & Other Managers, Supervisors, Skilled Sales & Service Personnel, and Skilled Crafts & Trades Workers occupations (consult Figure 22 in Appendix E).
Among federally regulated employees subject to the LEEP, representation gaps for women vary from one census metropolitan area (CMA) to another. However, most CMAs have attainment rates around 70 to 80% of local labour market availabilities, with only a few falling below 60% attainment (such as Barrie, Québec, and Peterborough). These findings indicate that attainment rates vary geographically, suggesting that region-specific factors may be influencing observed outcomes (for more detail, please refer to Figures 26 through 28 in Appendix E).
Members of visible minorities
Consistent with recent trends, representation of members of visible minorities among federally regulated employees has generally kept pace or exceeded labour market availability (about 21% as per Census 2016) over the evaluation period. Across occupational groups, representation has continued to increase and exceeded LMA across nearly all occupations. The only exception is Other Sales & Service Personnel and Other Manual Workers, which, while representation improved, continued to remain under the LMA (consult Figure 23 in Appendix E).
Figure 3 illustrates the increase in representation for members of visible minorities groups among federally regulated employees. Note that Statistics Canada releases Census data every 5 years, and employers' LMAs benchmarks are updated when these become available. During the evaluation period, employers used 2016 Census data to calculate LMAs. When the 2021 Census data are used as a benchmark instead, the surplus in labour market attainment for visible minorities is smaller. However, representation remains broadly aligned with the labour market availability (27.5% based on Census 2021).

Figure 3: Text description
| Year | 2016 Census benchmark (LMA) | 2017 | 2018 | 2019 | 2020 | 2021 | 2022 | 2023 |
|---|---|---|---|---|---|---|---|---|
| Visible minorities' representation | 21.3% | 23.1% | 24.1% | 24.7% | 26.4% | 27.8% | 29.2% | 30.5% |
- Source: LEEP data; Census 2016
Workforce representation data and LMAs by sector provides further insight. Overall, the representation of visible minorities has trended upward across all sectors, particularly in Banking and Financial Services. However, representation in the Transportation sector has consistently remained below the corresponding sector LMA (Figure 4).
Currently, the Act and associated reporting requirements do not require employers to report disaggregated data within visible minority groups. Consequently, Program analyses rely on the reported aggregate 'visible minorities' data, which limits the ability to identify barriers or tailor interventions for specific groups. Variations between different ethnic groups may be obscured by the use of aggregate data.

Figure 4: Text description
| Sector | 2017 | 2018 | 2019 | 2020 | 2021 | 2022 | 2023 | LMA |
|---|---|---|---|---|---|---|---|---|
| Banking & Financial Services | 31.6% | 33.7% | 34.4% | 38.7% | 39.8% | 41.9% | 43.4% | 31.2% |
| Communications | 23.9% | 24.2% | 24.3% | 25.1% | 26.4% | 26.8% | 27.7% | 24.8% |
| Transportation | 18.4% | 19.7% | 20.4% | 19.7% | 21.6% | 23.0% | 24.3% | 25.1% |
| 'Other' | 15.2% | 15.3% | 15.8% | 16.5% | 17.0% | 18.5% | 19.7% | 16.0% |
- Source: LEEP data; Census 2016
When examining attainment rates of visible minorities across CMAs, substantial geographic variation is observed. In general, more demographically diverse cities have lower attainment rates (for example, Toronto and Vancouver are both below 10%), whereas less diverse CMAs have high over-representation rates (for example, Sudbury is at 175%). This pattern reflects, in part, the higher labour market availability benchmarks in more diverse CMAs, which make achieving parity in representation (attainment rate of 100%) more difficult to achieve (consult figures 26 through 28 in Appendix E).
Indigenous peoples
Representation of Indigenous peoples among federally regulated employees rose slightly over the evaluation period, from 2.25% to 2.4%, but remained below their labour market availability of 4% in the Canadian labour force.

Figure 5: Text description
| Year | 2016 Census benchmark (LMA) | 2017 | 2018 | 2019 | 2020 | 2021 | 2022 | 2023 |
|---|---|---|---|---|---|---|---|---|
| Indigenous peoples' representation | 4.0% | 2.2% | 2.2% | 2.2% | 2.3% | 2.4% | 2.4% | 2.4% |
- Source: LEEP data; Census 2016
All 4 sectors show that the Indigenous peoples’ representation is lower than the corresponding sector LMA (Figure 6).

Figure 6: Text description
| Sector | 2017 | 2018 | 2019 | 2020 | 2021 | 2022 | 2023 | LMA |
|---|---|---|---|---|---|---|---|---|
| Banking & Financial Services | 1.2% | 1.2% | 1.2% | 1.4% | 1.5% | 1.4% | 1.4% | 1.7% |
| Communications | 2.1% | 2.1% | 2.0% | 2.1% | 2.1% | 2.1% | 2.1% | 2.5% |
| Transportation | 2.6% | 2.7% | 2.7% | 2.8% | 2.9% | 3.0% | 3.0% | 3.9% |
| 'Other' | 3.5% | 3.2% | 3.3% | 3.4% | 3.5% | 3.5% | 3.5% | 4.6% |
- Source: LEEP data; Census 2016
Across occupational groups, notable gaps are observed between the representation of Indigenous people among federally regulated employees and their corresponding LMAs. These gaps are more pronounced among Senior Managers, Middle & Other Managers, Professionals, Semi-professionals & Technicians, Administrative & Senior Clerical Personnel, Skilled Sales & Service Personnel, Clerical Personnel, and Intermediate Sales & Service Personnel. In contrast, representation increased over time among Supervisors: Crafts & Trades, Skilled Crafts & Trade Workers, and Other Sales & Service Personnel (consult Figure 24 in Appendix E).
When examined by CMAs, attainment rates for Indigenous peoples also vary across cities, though to a lesser extent than for members of visible minorities. Some CMAs, such as Saguenay (39%) and Kingston (47%), have lower attainment rates, which may be influenced by higher Indigenous labour market availability in these areas. Conversely, CMAs such as Toronto (150%) and Montréal (114%) have attainment rates that exceed the local labour market availability benchmarks for Indigenous peoples (consult figures 26 through 28 in Appendix E).
Persons with disabilities
Representation of persons with disabilities among federally regulated employers increased from 3.3% to 5.3% but remained below their labour market availability of 9% in the Canadian labour force.

Figure 7: Text description
| Year | 2016 Census benchmark (LMA) | 2017 | 2018 | 2019 | 2020 | 2021 | 2022 | 2023 |
|---|---|---|---|---|---|---|---|---|
| Persons with disabilities representation | 9.1% | 3.3% | 3.4% | 3.5% | 3.9% | 4.4% | 5.0% | 5.2% |
- Source: LEEP data; CSD 2017
Over the evaluation period, persons with disabilities among federally regulated employees gained representation in the Banking and Financial Services sector along with the Communication sector, while the Transportation and ‘Other’ sectors shown gains in the later years. In all sectors, representation remain below their corresponding sector LMA, with the smallest gap observed in the Banking and Financial Services sector (2.1 percentage points), and the largest in the Transportation sector (4.4 percentage points).

Figure 8: Text description
| Sector | 2017 | 2018 | 2019 | 2020 | 2021 | 2022 | 2023 | LMA |
|---|---|---|---|---|---|---|---|---|
| Banking & Financial Services | 4.6% | 5.0% | 5.0% | 6.0% | 6.0% | 7.0% | 7.1% | 9.2% |
| Communications | 3.4% | 3.4% | 3.6% | 4.4% | 5.0% | 5.3% | 5.9% | 11.0% |
| Transportation | 2.4% | 2.4% | 2.5% | 2.5% | 3.5% | 4.0% | 4.4% | 9.8% |
| 'Other' | 2.6% | 2.4% | 2.4% | 2.4% | 2.7% | 2.8% | 3.0% | 8.3% |
- Source: LEEP data; CSD 2017
Across occupational groups, persons with disabilities among federally regulated employees gained representation over the evaluation period in all occupations except for Semi-skilled Manual Workers, Other Sales and Service Personnel, and Other Manual Workers. For most occupations, representation remain below their corresponding LMA, with the largest gap observed for Supervisors (19.5 percentage points in 2023). Notably, for Senior Managers and Middle & Other Managers groups the representation of persons with disabilities exceed their corresponding LMAs in recent years (consult Figure 25 in Appendix E).
Note that for persons with disabilities, labour market availability is based on population level survey data from the Canadian Survey on Disability, which uses standardized screening questions. Workforce representation, by contrast, is derived from voluntary employee self-identification. Differences in identification methods may affect the comparability of these measures and partially influence observed representation gaps. For these reasons, it was also not possible to assess the variation in representation by CMA for persons with disabilities as with the other designated groups.
4.2 When using an intersectional lens, there is uneven regional variation in the workforce representation of women across designated groups
The review of program documents found that the Employment Equity Act: Annual Reports include tables showing disparities in representation rates for each designated group at the provincial and CMA levels. However, the 4 designated groups are not mutually exclusive, as women may belong to 1 or more of the other designated groups. Further analysis of program data therefore allows for the exploration of intersectional interactions between designated groups. This intersectional analysis reveals variations in observed outcomes, which are not apparent when groups are assessed independently.
While there are regional patterns in representation among federally regulated employers, an examination of intersecting identities indicates that regional representation patterns do not translate into uniform attainment outcomes across all groups.
For example, in Nunavut, women overall are achieving a labour market attainment rate of 48%, which is below the national average of 81.7%. This indicates that women's representation among LEEP employers in the territory is about 48% of their availability in the territorial labour force according to Census data. However, women who are members of visible minorities are over-represented (153.5%) in Nunavut, while Indigenous women have among the lowest labour market attainment rates nationally (10%).

Figure 9: Text description
| Province or territory | Women attainment rate | Indigenous women attainment rate | Women with a disability attainment rate | Visible minority women attainment rate |
|---|---|---|---|---|
| Ontario | 84.8% | 56.8% | 26.0% | 108.2% |
| Quebec | 77.8% | 47.7% | 22.7% | 117.6% |
| Nova Scotia | 82.0% | 53.1% | 27.4% | 139.8% |
| New Brunswick | 91.8% | 51.3% | 29.7% | 262.1% |
| Manitoba | 65.9% | 44.1% | 17.1% | 76.8% |
| British Columbia | 75.9% | 49.4% | 19.2% | 75.7% |
| Prince Edward Island | 60.5% | 32.1% | 17.1% | 53.0% |
| Saskatchewan | 77.6% | 35.8% | 23.4% | 90.3% |
| Alberta | 83.8% | 52.9% | 24.7% | 90.8% |
| Newfoundland and Labrador | 83.2% | 55.0% | 49.4% | 149.6% |
| Yukon | 79.4% | 31.2% | 32.4% | 154.0% |
| Northwest Territories | 53.1% | 31.7% | 8.3% | 92.7% |
| Nunavut | 48.0% | 30.0% | 10.0% | 153.5% |
- Source: LEEP data; Census 2016
4.3 Pay gaps exist across designated groups, with only limited exceptions
Pay gaps began to be incorporated into the Employment Equity Act: Annual Reports to Parliament starting in 2022 as a key outcome indicator along with representation indicators.Footnote 20 The Program also publishes pay gap data by employer, sector, and location on the online Equi'Vision data visualization tool.
As with representation rates, pay gaps reflect and are influenced by many factors such as educational and occupational mix, tenure, sector and regional differences as well as federal/provincial programming and legislative frameworks. Therefore, the reported results should not be interpreted as the direct effect of the EEA or related the program-level transparency measures.
LEEP administrative data reveals that among federally regulated employees, non-designated group employees consistently earn more than members of designated groups across most sectors and years. The pay gaps for each of the designated groups by sector from calendar years 2021 to 2023 can be found in Figure 10.
Note that private-sector employers subject to the EEA report on an annual basis their hourly wage gap, bonus pay gaps, overtime pay gaps and overtime hours gaps for the 4 designated groups. An hourly wage represents pay for 1 hour of work. Calculating hourly wage gaps allows for wage comparison between employees. The hourly wage calculation excludes bonus pay and overtime pay. Hourly wages are used rather than weekly or annual earnings so that the results reflect salary differences that are not due to the different numbers of hours worked.
Figure 10 shows the median hourly pay gaps for the designated groups by economic sector for LEEP employers from 2021 to 2023. Some key takeaways include the following:
From 2021 to 2023, the average hourly rate of pay earned by Indigenous peoples and persons with disabilities in the Transportation and 'Other' sectors was higher than their counterparts working in the same sector. Furthermore, the hourly rates of pay earned by persons with disabilities in the Banking and Financial Services sector was consistently higher than their counterparts for all 3 years.
From 2021 to 2023, women generally earned less than men in most sectors. Amongst companies that reported under LEEP in 2022 and 2023, women working in the Banking and Financial Services Sector typically experienced a median wage gap of 1%, and women's median wage in the Transportation and 'Other' sectors was about 4% lower than men's median wage.

Figure 10: Text description
| Sector | 2021 | 2022 | 2023 |
|---|---|---|---|
| Banking & Financial Services | -0.2% | 1.0% | 1.0% |
| Communications | 2.5% | 3.0% | 1.4% |
| Transportation | 0.6% | 3.8% | 3.7% |
| 'Other' | -0.5% | 3.4% | 4.3% |
| Sector | 2021 | 2022 | 2023 |
|---|---|---|---|
| Banking & Financial Services | 2.8% | 2.5% | 3.1% |
| Communications | 1.1% | 1.0% | 1.1% |
| Transportation | 2.2% | 0.5% | 2.7% |
| 'Other' | -2.9% | -5.9% | 0.9% |
| Sector | 2021 | 2022 | 2023 |
|---|---|---|---|
| Banking & Financial Services | -0.9% | -1.3% | -1.8% |
| Communications | 1.0% | -0.1% | 0.9% |
| Transportation | -5.5% | -0.9% | -0.7% |
| 'Other' | -5.9% | -2.5% | -2.0% |
| Sector | 2021 | 2022 | 2023 |
|---|---|---|---|
| Banking & Financial Services | -4.1% | -4.0% | -2.3% |
| Communications | 0.5% | 0.8% | 1.2% |
| Transportation | -27.3% | -8.0% | -1.0% |
| 'Other' | -6.5% | -2.0% | -3.2% |
- Source: LEEP data
4.4 There are statistically significant correlations between attainment rates and hourly wage gaps with specific employment types, employer sizes, and occupations
Using an exploratory regression analysis based on the Census and LEEP administrative data for 3Footnote 21 of the designated groups' representation and hourly wage gaps, it was possible to observe statistically significant correlations based on individual characteristics (consult Table 7 and Table 8 in Appendix E). Similar regression analysis could not be conducted for persons with disabilities because of data limitations associated with the Canada Disability Survey.
Women
For women's representation, medium sized employers along with part-time and temporary employment show a positive relationship with the attainment ratio, suggesting that women are better represented in these employment contexts compared to women employed by employers with 100 to 500 employees and in full time employment, respectively. Semi-professional & Technicians, Semi-skilled Manual Workers, and Other Manual Workers demonstrate a negative association with attainment, which suggests that women are under‑represented in these occupational groups.
In terms of the pay gap, regression results indicate that temporary employment is associated with lower hourly wage gaps for women, relative to men, compared with full-time employment. Occupational representation also affects the hourly wage gap, with women working as Senior Managers, Semi-professionals & Technicians, Skilled Crafts & Trades Workers, and Intermediate Sales & Service Personnel experiencing larger hourly wage gaps compared to those in the Clerical Personnel occupation group. Differences in the hourly wage gaps are also found across economic sectors, with women working in the Transportation sector experiencing relatively larger hourly wage gaps, relative to men, compared with the 'Other' sector category.
Visible minorities
The analysis found several factors associated with differences in attainment rates among visible minorities. Larger employers (over 10,000 employees) had higher representation rates than smaller firms (100 to 500 employees). The Banking and Financial Services sector had relatively higher representation compared to the 'Other' sector, while the Communications and Transportation sectors had lower representation. Differences in representation rates were observed across occupations, and provinces. Compared to Ontario, all provinces except British Columbia had higher attainment rates.
In contrast, factors influencing pay gaps differed from those influencing representation rates. Part-time employment was associated with smaller pay gaps compared to full-time work. Employers with over 40,000 employees had smaller hourly wage gaps relative to small employers (between 100 and 500 employees). The regression results show no statistically significant association between sector and wage gaps. In contrast, relative to Clerical Personnel, visible minorities in Senior Manager occupations had larger wage gaps, whereas those in Supervisor occupations had smaller wage gaps. Geographically, Quebec, Nova Scotia, New Brunswick, Manitoba, Prince Edward Island, and the Territories showed larger hourly wage gaps relative to Ontario.
Indigenous peoples
The analysis found higher Indigenous peoples' attainment rates among larger and long-tenured employers. Almost all provinces were associated with lower Indigenous peoples' attainment rates relative to Ontario.
Hourly wage gaps for Indigenous peoples are influenced by both provincial and occupational factors. Relative to Ontario, several provinces, including Quebec, Nova Scotia, British Columbia, and Alberta, are associated with lower hourly wage gaps. Relative to Clerical Personnel, Indigenous peoples in Skilled Sales & Service occupations had larger hourly wage gaps, while those in Other Sales & Service occupations were associated with smaller wage gaps. The regression results show no statistically significant association between other occupation groups and hourly wage gaps for Indigenous peoples.
Summary of Key finding 4
Overall, the analysis indicates that various factors affect workforce representation and pay disparities across the 4 designated groups. While improvements were observed in several economic sectors, occupations, and regions, these results cannot be directly attributed to the EEA or its associated program activities. However, the evidence suggests that program instruments, such as annual employer reporting, monitoring mechanisms, and increased transparency of equity data, have likely contributed to the developments observed over the evaluation period.
Key finding 5
Provincially regulated employers under the FCP saw modest equity gains, but it is unclear to what extent the Program is contributing to progress.
The FCP has continued to expand and mature over the evaluation period as additional provincially regulated employers with a workforce of at least 100 employees entered the program after meeting the minimum federal contracting threshold of $1 million.Footnote 22 As shown in Figure 11, growth in the number of employers falling under the FCP was most notable among Census Metropolitan Areas in Ontario, Quebec, and British Columbia over the evaluation period.

Figure 11: Text description
| Census Metropolitan Area | Growth in number of FCP employers |
|---|---|
| Barrie | 0 |
| Calgary | 3 |
| Cape Breton | -1 |
| Charlottetown | 1 |
| Edmonton | 5 |
| Fredericton | 1 |
| Greater Sudbury Grand Sudbury | 0 |
| Guelph | 1 |
| Halifax | 3 |
| Hamilton | 0 |
| Kingston | 1 |
| Kitchener - Cambridge - Waterloo | 2 |
| London | 1 |
| Moncton | -1 |
| Montréal | 13 |
| Oshawa | 1 |
| Ottawa - Gatineau (Ontario part partie de l'Ontario) | 7 |
| Québec | 1 |
| Regina | 1 |
| Rimouski | 0 |
| Saint John | 1 |
| Saint-Georges | 1 |
| Saint-Hyacinthe | 0 |
| Saskatoon | -1 |
| Sherbrooke | 3 |
| St. John's | 0 |
| Toronto | 46 |
| Vancouver | 10 |
| Victoria | 3 |
| Windsor | -1 |
| Winnipeg | 5 |
| Not in a CMA | 8 |
- Source: FCP data
Under the FCP, these employers are required to implement employment equity practices aimed at fostering a work environment that promotes equality of opportunities for members of the 4 designated groups. These practices are intended to support progress towards more equitable employment outcomes, including representativity of the employers' workforces.
5.1 Representation rates improved for visible minorities and persons with disabilities but remained weak for women and Indigenous peoples
The Program's Performance Information Profile uses contractor progress towards short term representation goals for the 4 designated groups as an indicator of program efforts to foster a work environment that promotes equality of opportunities for these groups. This indicator acts as a proxy to infer the Program's contribution to employers' employment equity practices, which cannot be directly measured.
As with LEEP employers, the representation rates among FCP employers are influenced by numerous factors beyond employers' internal practices and therefore the results cannot be solely attributed to the Federal Contractors Program. External factors may include changes in the level of workforce turnover (affecting the extent of hiring and promotions), educational and occupational choices made by individuals, availability of qualified candidates, nature of federal contracts, factors affecting employers' operations and competing with equity goals (such as downsizing) as well as complementary federal or provincial programs and policies with equity objectives. Likewise, there is no formal auditing structure for the FCP, meaning the Program is limited in its ability to enforce compliance beyond maintaining the FCP Limited Eligibility to Bid list.
The trends of workforce representation are presented in this section for each designated group. Note that because FCP employers report every 3 years after their first compliance assessment, some of the fluctuations in the year-to-year representation among FCP employers may be due to differences among cohorts reporting in a given year. Unlike for LEEP, it was not possible to calculate an overall labour market availability benchmark for FCP employers due to the lack of geographic location data. For the occupational-level data, the LEEP LMAs are included in the figures as a reference, but they cannot be used for direct comparison or benchmarking.
The FCP administrative data review found that overall, women's representation among provincially regulated employees subject to the FCP increased from 2017 to 2023. Women's representation fluctuated over the evaluation period, increasing sharply in 2018, declining over the following 2 years, and rising again in 2021, where it remained stable over the subsequent 3-year period.

Figure 12: Text description
| Year | 2017 | 2018 | 2019 | 2020 | 2021 | 2022 | 2023 |
|---|---|---|---|---|---|---|---|
| Women's representation | 33.6% | 43.8% | 39.5% | 37.0% | 41.5% | 42.9% | 41.4% |
- Source: FCP data
Women’s representation among provincially regulated employees subject to the FCP varies across occupational groups. For instance, women’s representation in the Professionals, Semi-Professionals & Technicians, and Intermediate Sales & Service Personnel occupations remained below their occupational LMAs throughout the evaluation period.

Figure 13: Text description
| Occupational group | 2017 | 2018 | 2019 | 2020 | 2021 | 2022 | 2023 | LMA |
|---|---|---|---|---|---|---|---|---|
| Senior Managers | 22.6% | 27.9% | 26.6% | 27.0% | 28.5% | 36.4% | 30.9% | 27.6% |
| Middle and Other Managers | 35.6% | 40.6% | 35.7% | 37.6% | 40.4% | 41.7% | 41.9% | 39.4% |
| Professionals | 33.7% | 41.6% | 40.9% | 38.3% | 39.7% | 43.7% | 41.3% | 55.0% |
| Semi-Professionals and Technicians | 33.1% | 26.7% | 23.2% | 31.1% | 28.3% | 30.5% | 36.2% | 53.5% |
| Supervisors | 59.8% | 59.3% | 39.1% | 60.8% | 51.1% | 59.1% | 55.0% | 55.5% |
| Supervisors: Crafts and Trades | 11.0% | 15.3% | 8.6% | 9.8% | 13.4% | 10.1% | 17.9% | 10.8% |
| Administrative & Senior Clerical Personnel | 78.1% | 81.6% | 71.5% | 79.2% | 72.6% | 77.6% | 77.5% | 82.4% |
| Skilled Sales and Service Personnel | 28.6% | 36.9% | 53.3% | 32.0% | 45.2% | 30.5% | 29.1% | 49.7% |
| Skilled Crafts and Trades Workers | 5.1% | 4.2% | 5.1% | 4.7% | 2.0% | 6.2% | 5.2% | 4.0% |
| Clerical Personnel | 63.6% | 70.1% | 65.9% | 64.8% | 62.6% | 70.0% | 58.4% | 68.7% |
| Intermediate Sales and Service Personnel | 53.4% | 51.4% | 27.7% | 46.6% | 39.3% | 41.6% | 49.3% | 68.4% |
| Semi-Skilled Manual Workers | 20.5% | 18.3% | 14.5% | 23.1% | 17.3% | 17.1% | 25.9% | 17.1% |
| Other Sales and Service Personnel | 65.3% | 54.6% | 52.3% | 38.9% | 55.3% | 36.1% | 60.6% | 56.3% |
| Other Manual Workers | 28.2% | 15.2% | 22.7% | 25.9% | 24.2% | 17.5% | 25.7% | 22.1% |
- Source: FCP data; Census 2016
The representation rates for members of visible minorities among provincially regulated employees subject to the FCP remained mostly stable over the evaluation period, except for a noticeable decrease in 2019 and significant increase in 2023.

Figure 14: Text description
| Year | 2017 | 2018 | 2019 | 2020 | 2021 | 2022 | 2023 |
|---|---|---|---|---|---|---|---|
| Visible minorities' representation | 19.1% | 21.6% | 14.3% | 21.6% | 21.2% | 20.8% | 29.1% |
- Source: FCP data
Members of visible minorities experienced increased representation across most occupations, and by 2023 they met or exceeded their labour market availability for all occupational groups except for Skilled Sales & Service Personnel.

Figure 15: Text description
| Occupational group | 2017 | 2018 | 2019 | 2020 | 2021 | 2022 | 2023 | LMA |
|---|---|---|---|---|---|---|---|---|
| Senior Managers | 7.7% | 10.8% | 7.4% | 11.5% | 12.5% | 13.4% | 20.0% | 11.5% |
| Middle and Other Managers | 15.9% | 18.2% | 10.9% | 18.2% | 19.0% | 18.9% | 26.6% | 17.6% |
| Professionals | 23.4% | 22.8% | 15.2% | 24.9% | 22.0% | 22.4% | 33.0% | 23.2% |
| Semi-Professionals and Technicians | 25.4% | 21.1% | 15.7% | 23.0% | 19.7% | 18.9% | 30.2% | 19.1% |
| Supervisors | 19.8% | 27.0% | 13.9% | 18.1% | 22.2% | 19.7% | 24.8% | 24.0% |
| Supervisors: Crafts and Trades | 15.9% | 8.5% | 6.8% | 20.2% | 9.2% | 12.1% | 28.1% | 11.0% |
| Administrative & Senior Clerical Personnel | 20.7% | 15.7% | 13.2% | 18.6% | 15.7% | 22.5% | 28.9% | 16.4% |
| Skilled Sales and Service Personnel | 16.0% | 20.4% | 12.8% | 20.3% | 16.1% | 23.4% | 22.5% | 27.7% |
| Skilled Crafts and Trades Workers | 9.7% | 6.3% | 9.1% | 11.4% | 8.2% | 10.6% | 15.8% | 12.0% |
| Clerical Personnel | 18.2% | 20.0% | 13.2% | 22.0% | 19.3% | 23.3% | 28.1% | 21.9% |
| Intermediate Sales and Service Personnel | 18.6% | 22.4% | 21.1% | 18.7% | 26.4% | 22.7% | 26.5% | 25.4% |
| Semi-Skilled Manual Workers | 13.1% | 8.8% | 10.1% | 19.6% | 13.5% | 17.3% | 24.3% | 22.4% |
| Other Sales and Service Personnel | 8.8% | 31.4% | 18.0% | 30.7% | 31.3% | 20.7% | 29.8% | 26.5% |
| Other Manual Workers | 25.9% | 12.2% | 15.5% | 25.7% | 27.0% | 21.3% | 27.3% | 21.0% |
- Source: FCP data; Census 2016
The data also shows that among provincially regulated employees subject to the FCP, Indigenous peoples’ representation rate fluctuated over the evaluation period, increasing in 2018 to a representation rate of 2.79%, declining over the following 2 years down to 1.37% in 2020. There was a slight decrease between 2022 and 2023, from about 1.99% to 1.29%.

Figure 16: Text description
| Year | 2017 | 2018 | 2019 | 2020 | 2021 | 2022 | 2023 |
|---|---|---|---|---|---|---|---|
| Indigenous peoples' representation | 1.2% | 2.8% | 1.9% | 1.4% | 1.8% | 2.0% | 1.3% |
- Source: FCP data
In 2023, Indigenous peoples’ representation in every occupational group was below the labour market availability (LMA). Many of the occupational groups show considerable year-to-year variation, which may partially be explained by the relatively small number of Indigenous employees in those occupations, such that changes involving only a few individuals can result in large shifts in representation rates.

Figure 17: Text description
| Occupational group | 2017 | 2018 | 2019 | 2020 | 2021 | 2022 | 2023 | LMA |
|---|---|---|---|---|---|---|---|---|
| Senior Managers | 0.4% | 0.7% | 1.0% | 0.3% | 0.7% | 0.7% | 0.5% | 3.2% |
| Middle and Other Managers | 0.7% | 1.4% | 0.7% | 0.9% | 0.9% | 1.2% | 1.1% | 2.7% |
| Professionals | 0.7% | 0.9% | 0.9% | 0.8% | 0.7% | 1.4% | 0.9% | 2.4% |
| Semi-Professionals and Technicians | 0.8% | 2.3% | 1.2% | 1.3% | 1.3% | 1.4% | 1.2% | 4.2% |
| Supervisors | 1.0% | 4.2% | 2.5% | 1.0% | 2.9% | 2.6% | 1.6% | 3.9% |
| Supervisors: Crafts and Trades | 1.4% | 2.7% | 2.4% | 1.6% | 2.5% | 2.2% | 1.2% | 4.3% |
| Administrative & Senior Clerical Personnel | 1.0% | 2.2% | 0.9% | 1.6% | 0.9% | 1.8% | 1.4% | 3.5% |
| Skilled Sales and Service Personnel | 0.7% | 3.3% | 1.0% | 1.0% | 1.4% | 1.0% | 1.6% | 3.7% |
| Skilled Crafts and Trades Workers | 1.7% | 3.6% | 2.4% | 2.4% | 2.4% | 1.3% | 2.1% | 5.2% |
| Clerical Personnel | 1.5% | 2.8% | 1.0% | 1.7% | 1.6% | 1.9% | 1.4% | 4.2% |
| Intermediate Sales and Service Personnel | 1.3% | 4.3% | 6.7% | 2.7% | 2.6% | 4.5% | 3.1% | 4.5% |
| Semi-Skilled Manual Workers | 2.4% | 2.8% | 1.2% | 2.4% | 2.5% | 1.4% | 1.9% | 4.8% |
| Other Sales and Service Personnel | 4.8% | 4.8% | 10.8% | 3.8% | 3.7% | 8.5% | 3.4% | 5.8% |
| Other Manual Workers | 1.7% | 3.9% | 0.5% | 2.5% | 3.6% | 3.8% | 2.6% | 6.8% |
- Source: FCP data; Census 2016
Finally, persons with disabilities’ representation increased gradually among provincially regulated employees subject to the FCP. The overall representation rate has almost doubled from about 2% in 2017 to nearly 4% in 2023.

Figure 18: Text description
| Year | 2017 | 2018 | 2019 | 2020 | 2021 | 2022 | 2023 |
|---|---|---|---|---|---|---|---|
| Persons with disabilities' representation | 2.0% | 3.2% | 2.3% | 2.5% | 2.6% | 3.9% | 3.9% |
- Source: FCP data
At the occupation level, most occupations had representation rates well below their LMAs. Senior Managers were the only group in which representation consistently met or exceeded their LMA.

Figure 19: Text description
| Occupational group | 2017 | 2018 | 2019 | 2020 | 2021 | 2022 | 2023 | LMA |
|---|---|---|---|---|---|---|---|---|
| Senior Managers | 13.1% | 9.1% | 13.6% | 11.2% | 9.7% | 23.9% | 12.8% | 5.0% |
| Middle and Other Managers | 1.4% | 2.2% | 1.7% | 1.7% | 1.6% | 3.3% | 3.1% | 5.0% |
| Professionals | 1.5% | 1.8% | 2.1% | 2.2% | 1.3% | 3.7% | 3.6% | 8.9% |
| Semi-Professionals and Technicians | 1.4% | 2.9% | 1.9% | 2.6% | 1.8% | 3.5% | 3.5% | 7.6% |
| Supervisors | 2.4% | 3.8% | 2.5% | 2.4% | 3.5% | 3.4% | 2.6% | 27.5% |
| Supervisors: Crafts and Trades | 3.1% | 2.4% | 1.1% | 2.1% | 1.4% | 1.4% | 1.9% | 10.1% |
| Administrative & Senior Clerical Personnel | 1.7% | 3.3% | 1.7% | 3.6% | 1.7% | 4.9% | 7.5% | 10.0% |
| Skilled Sales and Service Personnel | 1.4% | 2.4% | 1.2% | 2.1% | 1.3% | 1.5% | 1.8% | 8.0% |
| Skilled Crafts and Trades Workers | 2.5% | 3.9% | 2.4% | 2.6% | 1.7% | 1.9% | 2.7% | 7.8% |
| Clerical Personnel | 2.5% | 3.6% | 2.0% | 2.9% | 2.3% | 4.0% | 4.9% | 9.3% |
| Intermediate Sales and Service Personnel | 1.1% | 3.4% | 3.9% | 3.0% | 4.6% | 4.5% | 4.2% | 10.8% |
| Semi-Skilled Manual Workers | 2.7% | 4.6% | 1.4% | 2.6% | 3.3% | 1.7% | 2.1% | 10.3% |
| Other Sales and Service Personnel | 6.1% | 4.0% | 3.9% | 4.0% | 3.8% | 3.1% | 4.6% | 10.7% |
| Other Manual Workers | 1.7% | 3.6% | 2.6% | 2.8% | 3.4% | 1.9% | 2.5% | 6.8% |
- Source: FCP data; CSD 2017
5.2 Hiring and promotion actions favored visible minorities and persons with disabilities, while women experienced a decrease and Indigenous peoples remained stable
The short-term representation goals mentioned in the Program's PIP may involve employers adopting or adjusting hiring, promotion, and termination practices. Such efforts would be communicated to the Program through employers' submitted achievement reports.
As with representation rates, there may be other influences on these outcomes beyond the Program's sphere of influence.
The majority of FCP key informants (3 out of 5) suggested that inclusion and retention indicators also be tracked, not only representation.
According to FCP administrative data, between 2017 and 2023, hiring and promotion of visible minorities and persons with disabilities increased, while women's opportunities in these areas declined. Actions involving Indigenous peoples remained largely stable, with a noticeable spike in terminations in 2020, which may have been related to the COVID-19 Pandemic.

Figure 20: Text description
| Year | Hired | Promoted | Terminated |
|---|---|---|---|
| 2017 | 40.8% | 44.0% | 41.9% |
| 2018 | 36.5% | 39.7% | 35.8% |
| 2019 | 35.1% | 38.4% | 36.4% |
| 2020 | 38.0% | 41.2% | 35.4% |
| 2021 | 38.1% | 42.8% | 37.0% |
| 2022 | 39.0% | 38.8% | 37.0% |
| 2023 | 37.5% | 43.0% | 36.7% |
| Year | Hired | Promoted | Terminated |
|---|---|---|---|
| 2017 | 21.5% | 20.0% | 18.8% |
| 2018 | 20.3% | 15.6% | 16.4% |
| 2019 | 19.9% | 15.7% | 15.7% |
| 2020 | 23.0% | 20.6% | 18.8% |
| 2021 | 23.9% | 19.0% | 19.7% |
| 2022 | 24.0% | 19.0% | 17.3% |
| 2023 | 27.8% | 23.2% | 21.9% |
| Year | Hired | Promoted | Terminated |
|---|---|---|---|
| 2017 | 1.4% | 1.3% | 1.1% |
| 2018 | 2.3% | 1.6% | 2.0% |
| 2019 | 2.3% | 2.7% | 1.9% |
| 2020 | 1.6% | 1.4% | 4.2% |
| 2021 | 1.7% | 1.4% | 1.8% |
| 2022 | 2.4% | 1.8% | 2.3% |
| 2023 | 1.8% | 1.6% | 1.6% |
| Year | Hired | Promoted | Terminated |
|---|---|---|---|
| 2017 | 1.3% | 1.8% | 1.9% |
| 2018 | 1.8% | 2.7% | 2.3% |
| 2019 | 2.4% | 3.1% | 2.6% |
| 2020 | 2.6% | 2.4% | 2.4% |
| 2021 | 2.2% | 3.0% | 2.4% |
| 2022 | 2.0% | 3.1% | 2.7% |
| 2023 | 2.7% | 2.5% | 2.2% |
- Source: FCP data
Figure 20 shows that hiring exceeds terminations for visible minorities, which suggests that representation is improving for these groups. For indigenous peoples, hiring and termination follow the same trend between 2021 and 2023, suggesting that representation remains steady.
5.3 FCP participation produced mixed results according to employers
The majority (3 out of 5) of the FCP key informants were of the view that the program helps create an inclusive and representative workplace environment. One of the ways that the key informants suggested the Program does this are by signalling to employees and potential employees (one employer advertises their participation in the FCP on their job postings) that their organization is committed to employment equity, which can help build a culture of inclusion.
A few (2 out of 5) stated the Program did not really contribute to fostering equality of employment opportunities for designated groups. Rather, they perceived FCP as a Program that supports the philosophy behind improving employment equity without much tangible effect. This was particularly the case with employers who saw themselves as having attained a level of employment equity beyond the goals of the FCP, such as by broadening their equity practices to additional groups, adopting intersectional approaches, or having strong organizational cultures of inclusion. Reasons given for not viewing the Program to be effective include an emphasis on numeric diversity over holistic inclusion, outdated equity-seeking group definitions, and the lack of public transparency for FCP employers' representation data.
Summary of Key finding 5
In summary, observed trends in representation and employment outcomes among FCP employers are influenced, in part, by employer practices and broader contextual factors. In addition, because the population of employers subject to the FCP changes over time and the employers report tri-annually following their initial post-contract award reporting period, year-to-year variability in representation rates may also reflect cohort effects rather than changes in employer practices. As a result, it is difficult to infer the Program's influence on workforce representativity based on aggregate trends alone.
Key finding 6
Since the last evaluation, the program has strengthened its performance measurement and data collection methods with regulated employers. However, for WORBE-funded projects, more could be done to improve the Program's ability to track progress and demonstrate results.
6.1 The Program has strengthened its performance measurement strategy and data collection practices with employers since the previous evaluation, providing a more comprehensive picture of workforce equity
One of the observations made in the previous evaluation was the need to "enhance performance measurement in the next program cycle". The review of program documents revealed that the Program took several actions related to performance measurement since this observation was made.
The new PIP included updated performance indicators, benchmarks, and targets, as well as a new logic model for the Program. Additionally, a second logic model was jointly created in collaboration with the Canadian Human Rights Commission highlighting their dual responsibilities in the administration of the Program.
Starting in 2021, LEEP employers were required to begin reporting their pay gap data in addition to representation data for the 4 designated groups. Pay gap data is now reported annually in the Employment Equity Act Annual Reports to Parliament, starting from 2022. To accommodate the new data collected relating to pay gap reporting, the Program updated data definitions, developed new forms and integrated them into WEIMS, and published detailed technical guidance materials such as the Workplace Equity - Interpretations, policies and guidelines as well as "How to" guides on reporting/interpreting pay gap data. The Program has also taken steps to clarify the distinction between LEEP's annual transparency‑focused pay gap reporting and the Pay Equity Act proactive requirements to identify and correct pay gaps, by providing access to guidance materials for LEEP pay gap reporting and directing employers to the Canadian Human Rights Commission for issues related to the Pay Equity Act regime.
Given that employers are required to report representation and pay gap data to fulfill their employment equity obligations, the program's role in enabling clear, straightforward, and accurate reporting remains of continued relevance.
Additionally, disaggregated pay gap and representation data were made publicly available on the Equi'Vision website starting in 2024. The availability of transparent public data seeks to strengthen accountability mechanisms by documenting progress, supporting organizational self‑assessment, and enabling individuals to assess whether employers are taking meaningful steps to implement employment equity requirements.
Finally, the LEEP collects and reports a wide set of equity indicators, covering representation, occupational distribution, compensation gaps, and employment flows, for each designated group. These indicators, which are synthesized in the Employment Equity Act: Annual Report to Parliament, provide a structured picture of workforce equity in federally regulated workplaces and help identify where barriers persist across hiring, advancement, pay, and overall representation.
For example, the representation rate measures the proportion of a designated group within an organization's total workforce, and the attainment rate compares workplace representation to each group's labour market availability. The occupational distribution indicators help reveal whether groups are clustered in certain types of jobs, often lower‑paid or lower‑status roles, or whether they have equitable access to higher‑skilled or leadership positions. The compensation and Pay Equity Indicators provide insight into compensation‑related disparities through a series of pay gap indicators such as salary ranges, hourly pay gaps, bonus pay gaps, overtime pay gaps and overtime hours gaps.
6.2 While the Program has made some data-related improvements, there are areas where LEEP and FCP performance measurement and data collection could be further improved to better capture the Program influence on employer practices and address data reporting challenges
Since the new PIP was adopted in 2018, the Program has begun collecting pay gap data. The theory of change behind the new reporting is not currently reflected in the Program's logic model. The addition of pay gap reporting into the logic model and development of associated indicators would help the program assess the extent to which these new efforts are serving to advance program objectives. Furthermore, the Program does not currently systematically collect data related to barrier removal or correction of underrepresentation at the occupational level.
In addition, workforce representation and pay gap indicators are outcome-based, not process-based. As a result, they do not directly capture the influence the Program may have on employer practices and workplace culture, inclusion, or fairness in decision-making. To demonstrate interim progress, the Program could complement outcome indicators with process, and experience indicators that may be more likely to change in the near-term.
When it comes to the data itself, a continued challenge with LEEP and FCP is that representation data are dependent on voluntary employee self-reporting to employers. This presents a risk that the data could under-represent (or potentially over-represent) the true representation rates of the designated groups. The document review indicates that the Program commissioned research to better understand self‑reporting patterns and limitations, as well as how these factors may be addressed. The research concluded with practical insights and approaches into strengthening how voluntary reported data is collected in the workplace. The Program then developed a suite of self-identification tools for employers and made them available at the end of 2025 through a proactive communications campaign.
Given the FCP's design and the provincial jurisdiction of covered employers, the program's data collection approach does not mirror the LEEP's employer-level reporting for federally regulated employers. For instance, employers under FCP are not required to report information annually, nor does the Program collect data on pay gaps, capture employee information by geographic location or sector. Moreover, FCP employer-level data are not publicly released. These factors limit the ability to assess contractors' trends over time, including geographically and across industries, and constrain opportunities for transparency and broader stakeholder dialogue. Taken together, this reflects the need for the FCP's data collection strategy to be calibrated to the Program's objectives, levers, and accountability over provincially regulated employers.
From a reporting perspective, some employers interviewed from LEEP (4 out of 9) and FCP (2 out of 5) expressed concern about WEIMS. They noted technical issues (for example, system outages during reporting peak times, lack of training on WEIMS) and administrative challenges with data submission, including data processing issues (for example, problems aligning the NAICS codeFootnote 23 with the one assigned by the Program to ensure data compatibility, and complexities associated with reporting after mergers and acquisitionsFootnote 24).
Likewise, a few program officials (2 out of 6) also reported that the volume of transactions has increased significantly, but the functionality of the WEIMS software that handles this data has not evolved accordingly. Thus, while still seeing WEIMS as a great tool, they suggest that it needs to be updated or replaced to keep pace with the expanding employer base (LEEP and FCP) to keep up with system volume and data demands.
6.3 WORBE data monitoring and reporting could be standardized and improved to consistently track program-specific outcomes
The WORBE administrative data and document reviews reveal that, unlike the LEEP and FCP, WORBE is a small grants and contributions program that uses the Common System for Grants and Contributions (CSGC) rather than WEIMS to administer funded projects. Project recipients report their progress in text-based templates provided by the Department.
It is unclear whether the CSGC includes built‑in functionality to support the simultaneous tracking and comparison of multiple projects (such as consolidated reporting or dashboards). As a result, the Program relies on internal trackers and worksheets to monitor and compare project performance.
The systematic tracking of WORBE's contribution to its stated objective of improving representation of designated groups in private-sector workplaces remains limited, reducing the evaluation's capacity to inform potential longer-term equity impacts. Current reporting focuses on immediate outputs and lacks standardized indicators across projects, which makes comparability difficult and limits evidence of achieved outcomes. For instance, the reporting templates tend to prioritize documenting project activities and outputs rather than outcomes or impacts on employers and members of designated groups. Additionally, project visibility and the uptake of tools and resources are generally not considered project outcomes, and there is not always a distinction between employer-level and sector-level outcomes.
Moreover, the project reporting approach does not facilitate the use of common performance measures, such as employer reach, the adoption of equity tools, and reported practice changes, which limit consistency across initiatives and prevent clearer assessments of contribution pathways.
Follow-up after project completion is minimal, leading to uncertainty about whether promising tools and practices continue to be used. There is limited systematic post-project tracking, such as light-touch employer surveys, periodic digital scans, or exploratory administrative linkages, which affects the ability to capture longer-term impacts and identify opportunities for scaling successful approaches.
Appendix A: Logic model - Workplace Equity Program

Figure 21: Text description
Government of Canada outcome
- A fair and secure marketplace
Labour strategic outcome
- Safe, fair, and productive workplaces and cooperative workplace relations
Ultimate outcome (program administration stream)
- Equitable employment outcomes for members of the four designated groups
Intermediate outcomes (program administration stream)
- Federally regulated employers and federal contractors are fostering a work environment that promotes equality of opportunities for members of the four designated groups
Immediate outcomes (program administration stream)
- The Minister of Labour meets mandated reporting, promotion, and recognition responsibilities under the Employment Equity Act
- Employers and contractors meet their employment equity obligations
Outputs (program administration stream)
- Report validation (LEEP)
- Compliance assessments (FCP)
- Employment Equity Act Annual Report
- Annual planned deliverables (such as policy papers, e-scans, and research)
- Completed Ministerial and departmental requests (such as policy and program initiatives)
- Employer tools and resources (advice, guidance)
- Employer engagement initiatives
- Initiatives that support improved employment equity outcomes for members of the four designated groups
Activities (program administration stream)
- Administer and ensure compliance with the Employment Equity Act (LEEP and FCP)
- Collect data and conduct research on employment equity
- Provide advice and develop policy proposals or recommendations regarding employment equity
- Promote the Act and assist employers and contractors in meeting their employment equity obligations
- Collaborate with partners and stakeholders to improve employment equity outcomes for designated groups
Ultimate outcome (grant and contribution stream)
- Projects contribute to fostering equality of opportunities for members of the four designated groups
Intermediate outcomes (grant and contribution stream)
- Employers and stakeholders have access to information concerning employment equity, diversity, and inclusion in Canadian workplaces
Immediate outcomes (grant and contribution stream)
- Employers and stakeholders are able to engage in dialogue and exchanges regarding employment equity, diversity, and inclusion
- Project tools and resources developed contribute to building capacity
Outputs (grant and contribution stream)
- Funding agreements
Activities (grant and contribution stream)
- Solicit and support initiatives to develop dialogue, knowledge, and awareness of employment equity
Appendix B: Evaluation questions
The evaluation of Workplace Equity program addresses tree evaluation questions and their related sub-questions, as aligned with the program logic model and identified in collaboration with the Program.
- 1. To what extent has the Program filled a need in the Canadian employment equity landscape?
- 1.1 To what extent has the Program evolved to stay relevant within the changing Canadian and International context?
- 1.2 Are funded WORBE projects aligned with Program priorities?
- 2. To what extent does the Program support employers in advancing equity for designated groups?
- 2.1 To what extent does the LEEP provide support for federally regulated employers?
- 2.2 To what extent does the FCP provide support to provincially regulated employers?
- 2.3 To what extent do WORBE grants and contributions provide support to federally regulated employers and eligible organizations?
- 3. To what extent does the Program contribute to fostering equality of opportunities for members of the four designated groups?
- 3.1 To what extent are federally regulated employers under the Program fostering an environment of employment equity?
- 3.2 To what extent are provincially regulated employers under FCP fostering an environment of employment equity?
- 3.3 To what extent have WORBE projects contributed to advancing the Program's objectives?
- 3.4 To what extent and how has the Program enhanced its performance measurement strategy and data collection since the last evaluation?
Appendix C: Lines of evidence
Document review
The Document review sought to inform the extent to which the Program continues to be relevant and support employers in advancing employment equity for the 4 designated groups. Additionally, it explored program activities, operation, and structure.
Document types and selection criteria
The review was based on various government publications and reports as well as other documentation related to the Program. It focused on documents produced from April 2017 to March 2023, except where particularly relevant to the evaluation questions. Over 60 documents were assessed, including program documentsFootnote 25, external documentsFootnote 26, and previous evaluation studies, to gain insights into processes and systematic changes that may have influenced the Program during the current evaluation frame. Most documents were provided by the Program in the early stages of the evaluation based on their knowledge of and access to key documents. Evaluation also collected additional online documentation falling within the scope of this reviewFootnote 27. The full list of documents consulted is included in the technical report.
Data assessment
Evaluation did not encounter any significant limitations in accessing the documents and conducting the review. As is usual for this type of evidence, it was not possible to discern much about Program outcomes from documents alone. Nevertheless, the collected evidence was relevant and enabled the evaluation questions associated with this line of evidence to be addressed.
Literature review
The Literature review helps address the extent to which the Program has evolved to stay relevant within the changing Canadian and international contexts. Evaluation conducted a targeted review of academic and grey literature (published after 2016, where possible) related to program outcomes, the Canadian employment equity environment, and the international employment equity ecosystem.
Limitations and mitigation strategy
The primary risk associated with the literature review was accessing recent academic sources and publications. To mitigate this risk, Evaluation drew on a broad range of sources from both Canadian and international contexts to strengthen the evidentiary base and provide relevant background and rationale.
Data assessment
Findings from the literature review provide meaningful evidence on how Canada's efforts compare with G7 countries and how the Program evolved over the evaluation period to adapt to the changing Canadian context.
Administrative data review
The Administrative data review focused on measuring the extent to which the Program has assisted employers in achieving employment equity for designated groups. The primary analytical approach used was outcome trend analysis by sector and occupation. In addition, regression analysis was incorporated to provide more insight about the relationship between different employer characteristics and employment equity outcomes.
- LEEP data profile: 683 unique employers reported to the Program at least once between 2017 and 2023. The Banking & Financial Services and Communications sectors make up roughly 9% of the employment groups each. Transportation is about 23% and the rest fall under the 'Other' sector category. 77% of all employment groups are full time employment, 22% are part time and 2% are temporary.
- FCP data profile: 310 unique employers reported to the Program over the evaluation period. In 2019, the number of employers reporting under FCP decreased to 33 but rose to 52 in 2020 (during the Pandemic) and stayed steady in 2021.
Methodology
The unit of analysis for the administrative data analysis is employment groups, following the approach used in Jain, et al. (2010). For this review, employment groups are defined as a collection of people who are classified under the same occupation while working for the same employer in the same province in a given year.
- Outcome trend analysis: The study produced descriptive statistics of employment groups to better understand how employment equity is related to different factors. An analysis was conducted on the profile and characteristics of the LEEP and FCP employers. In addition, detailed outcome trend analyses for representation rates by sectors and occupations were examined for all designated groups.
- Regression analysis (exploration): The analysis also used Generalized Least Squares to provide insights into the effectiveness of the program and determine the factors that are associated with employment equity among federally regulated employers.Footnote 28.
2 regression analyses were performed on the 2022 and 2017 cohorts, with the relative representation rate as the dependent variable in one and the mean pay gap between designated and non-designated groups as the dependent variable in the other. The 2022 cohort was chosen as it is the most recent data that can be compared to the most recently published Employment Equity Act: Annual Report. The 2017 cohort was chosen as a validation to ensure that the patterns are not year-specific and are applicable over time.
Limitations and mitigation strategies
A comparison or control group could not be established for this evaluation. Participation in the program is mandatory for all eligible employers. Consequently, the analysis relies on descriptive statistics and trend analysis to examine changes in representation rates and pay gaps over the reference period.
Data limitations prevented from incorporating key interaction terms (for example, province, employment type, or sector) into the regression analysis, limiting the ability of Evaluation to fully understand how these factors jointly influence outcomes. Although all available variables were included, important unmeasured factors such as education, language proficiency, and work experience likely affect employment equity results.
The LEEP dataset lacks several important explanatory variables, such as education, work experience, and age, which limits the ability to control for individual‑level factors affecting representation and pay outcomes. It also does not capture employers' characteristics prior to mandatory reporting, preventing the establishment of baseline conditions and constraining analysis of changes over time. Finally, external contextual factors, including economic conditions and societal trends, are not measured in the dataset and therefore limiting causal interpretation of the results.
Due to limitations with Canadian Survey on Disability (CSD) data, a regression analysis for Persons with disabilities could not be conducted.
WORBE analysis
The analysis of WORBE administrative data, visibility, and reach sought to measure the extent to which WORBE projects are contributing to advancing the Program's goals and expected outcomes.
The 3 methods employed in the study were:
1. Visibility Scorecard: Each project falling under the evaluation timelines was assessed against 5 standardized criteria: Volume and Strategic Alignment of Public-Facing Outputs, Quality and Outcome Orientation of Dissemination Strategy, Evidence of Uptake or Engagement, Public Accessibility of Outputs, and Accessibility and Inclusivity of Outputs.
2. Text Mining of Key Informant Interviews: Interview transcripts were analyzed to extract recurring patterns, thematic signals, and direct stakeholder feedback on output use, relevance, and observed impacts.
3. Digital Footprint Scan: Targeted online searches were conducted to verify the public availability and accessibility of WORBE project outputs, identify additional dissemination channels, and detect evidence of third-party engagement.
Limitations and mitigation strategies
The key limitation for assessing the WORBE program was the absence of standardized outcome data. Additionally, given that there have only been a relatively small number of total projects funded, not all of which were completed at the time of the evaluation, meant that the results could be overrepresenting the perspectives of funding recipients from early calls for proposals. Also, only 4 key informants were able to speak to the WORBE program.
To address these key challenges, the 3-pronged methodology was used to determine a plausible contribution of the Program, rather than attribution of results. All eligible projects were included to maximize the amount of available information from the small total number of projects.
Key informant interviews
Key informant interviews sought to address all evaluation questions and were used to assess the extent to which the Program remains relevant, provides effective support to employers, and contributes to improved employment equity outcomes in federally regulated workplaces. A total of 28 key informant interviews were conducted with 7 stakeholder groups (consult Table 6).
| Key informant groups | Sample | Interviewed |
|---|---|---|
| Legislated Employment Equity Program (LEEP) employers (federally regulated) | 13 | 9 |
| Federal Contractors Program (FCP) employers (provincially regulated) | 10 | 5 |
| WORBE funding recipients | 6 | 4 |
| Program representatives | 14 | 6 |
| Industry Associations | 3 | 2 |
| Employer Associations | 1 | 1 |
| Labour Organizations | 1 | 1 |
| Overall | 48 | 28 |
Limitations and mitigation strategies
This line of evidence faced challenges engaging with certain key informant groups. Evaluation worked with the Program to secure interviews with key stakeholders and extended timelines to ensure an acceptable response rate.
The evaluation faced a limitation related to the quality of some key informant interview responses. In several instances, responses were generic or minimal, reflecting limited corporate memory. To mitigate this limitation, the evaluation employed triangulation by integrating evidence from multiple data sources to strengthen the robustness of the analysis.
Case studies
The case studies sought to address all evaluation questions and were designed to support an in-depth qualitative assessment of the Program.
4 case studies were purposefully selected in consultation with the Program. The sample included 2 employers subject to the LEEP and 2 employers drawn from the FCP List of Certified Employers.
Case selection was guided by the following criteria:
- employer size
- affiliation with an international parent organization
- recency of obligations under the Act
- geographic location
- industry classification
Limitations and mitigation strategies
The evaluation encountered a limitation related to limited depth and specificity of responses being provided by some interview participants.
To mitigate this limitation, the interview evidence was supplemented with a targeted review of case-specific documentsFootnote 29 included an analysis of narrative reports submitted by LEEP employers and achievement reports submitted by FCP employers.
Appendix D: Program stakeholders
LEEP at a glance
Whom it applies to:
- private-sector employers under federal regulation with 100 or more employees
- federally regulated Crown corporations with 100 or more employees
- other Federal Organizations also meeting that employee threshold
What are LEEP employers required to do?
- submit an annual employment equity report by June 1 each year via the WEIMS system, covering the workforce composition, hiring, promotions, salary information, and actions taken to implement employment equity
- conduct an Employment Systems Review to identify organizational barriers affecting the 4 designated groups, and develop a plan to correct them
- comply with audits conducted by the Canadian Human Rights Commission
- submit the data using WEIMS, maintain workforce records securely for at least 2 years, and adhere to privacy provisions.
FCP at a glance
Whom it applies to:
- private-sector employers that have federal contracts valued at $1 million or more (before taxes) that have 100 or more employees in Canada
What are FCP employers required to do?
- agree to employment equity as a condition of bidding for and obtaining federal contracts
- collect workforce data on designated groups and compare their representation to LMA
- develop and implement an employment equity plan, which must:
- identify gaps in representation
- set goals and timetables for improvement
- outline measures to remove barriers in recruitment, training, promotions, and workplace systems
- undergo compliance assessments by ESDC's Labour Program to ensure they are making reasonable efforts toward employment equity
- submit progress reports to ESDC upon request to demonstrate their progress in meeting goals
WORBE at a glance
Whom it applies to:
- all Canadian employers and employees, regardless of sector or size
- employer associations and labour organizations interested in workplace equity
- researchers, policymakers, and the general public who use WORBE-related information product
How are employers impacted?
Since WORBE is a grant and contribution program, it is mostly an information and awareness building opportunity for employers. It is not a reporting, data collection, or compliance obligation like LEEP and FCP. Instead, they can:
- participate in WORBE funded initiatives with funding recipients
- access WORBE resources (guides, fact sheets, reports, online tools) as part of their employment equity journey
Appendix E: Supplementary tables and figures
Regression results from the exploratory study
Table 7 displays the results of the regressionFootnote 30 analysis for the attainment rates for the 2022 data. The direction of the coefficient tells us whether a control variable is associated with a higher or lower relative attainment rates, compared to the reference group. A positive coefficient corresponds to increased representation being correlated to the given variable, whereas a negative coefficient corresponds to decreased representation.
| Variable name | Women | Visible minorities | Indigenous peoples |
|---|---|---|---|
| Average duration (in years) in the program | 0.00148 | -0.00361 | 0.0121*** |
| Binary (year 1997) | -0.0342 | -0.0883 | 0.0746 |
| Employment type | n/a | n/a | n/a |
| Full Time Employment (reference) | (reference) | (reference) | (reference) |
| Part Time Employment | 0.0480** | 0.0555 | 0.0241 |
| Temporary Employment | 0.158*** | -0.0845 | -0.11 |
| Main sectors | n/a | n/a | n/a |
| Banking and Financial Services | -0.0685* | 0.206** | 0.0494 |
| Communications | 0.0184 | -0.275*** | 0.211** |
| Transportation | 0.049 | -0.144* | -0.0642 |
| 'Other' (reference) | (reference) | (reference) | (reference) |
| Occupation groups | n/a | n/a | n/a |
| Senior Managers | 0.158*** | -0.164 | -0.117 |
| Middle and other Mangers | 0.0164 | -0.0991 | 0.203** |
| Professionals | 0.108*** | -0.184*** | 0.197** |
| Semi-Professionals and Technicians | -0.0729** | 0.130* | 0.0251 |
| Supervisor | 0.181*** | -0.237*** | 0.0631 |
| Supervisors: Crafts and Trades | 0.233** | 0.257* | -0.0225 |
| Administrative and Senior Clerical Personnel | 0.0705*** | 0.332*** | 0.0475 |
| Skilled Sales and Service Personnel | 0.0264 | -0.164* | -0.0382 |
| Skilled Crafts and Trades Workers | 0.116 | 0.529*** | -0.0202 |
| Clerical Personnel (reference) | (reference) | (reference) | (reference) |
| Intermediate Sales and Service Personnel | 0.190*** | -0.281*** | 0.278*** |
| Semi-Skilled Manual Workers | -0.162*** | 0.00737 | 0.114* |
| Other Sales and Service Personnel | -0.0493 | -0.219** | 0.171 |
| Other Manual Workers | -0.429*** | -0.270*** | -0.126* |
| Provinces | n/a | n/a | n/a |
| Ontario (reference) | (reference) | (reference) | (reference) |
| Quebec | -0.0353 | 0.138*** | -0.304*** |
| Nova Scotia | 0.0234 | 1.227*** | -0.319*** |
| New Brunswick | 0.0545 | 2.068*** | -0.501*** |
| Manitoba | -0.058 | 0.596*** | -0.341*** |
| British Columbia | -0.0511* | -0.0303 | -0.227*** |
| Prince Edward Island | -0.127 | 1.312 | -0.636*** |
| Saskatchewan | 0.0667 | 0.870*** | -0.300*** |
| Alberta | -0.0824*** | 0.219*** | -0.309*** |
| Newfoundland and Labrador | -0.107** | 0.779*** | -0.00517 |
| Territories | 0.0757 | 3.802*** | -0.588*** |
| Employer size (number of employees) | n/a | n/a | n/a |
| 100 to 500 (reference) | (reference) | (reference) | (reference) |
| 500 to 2,500 | 0.0294 | 0.0744 | 0.00318 |
| 2,500 to 10,000 | 0.105** | 0.0579 | 0.0876 |
| 10,000 to 40,000 | -0.0266 | 0.461*** | 0.0174 |
| Over 40,000 | 0.0794 | 0.677*** | 0.224** |
| Constant | 0.876*** | 0.0744 | 0.521*** |
| Observations | 10,480 | 10,204 | 10,289 |
| R-squared | 0.0234 | 0.0709 | 0.0164 |
- Source: LEEP data; Census 2016
Table 8 displays the results of the pay gap regression analysis for each designated group. The dependent variable is the mean pay gap (in percentages). A positive coefficient means the variable is associated with a higher pay gap compared to the reference group, and a negative coefficient means the variable is associated with a lower pay gap compared to the reference group.
| Variable name | Women | Visible minorities | Indigenous peoples |
|---|---|---|---|
| Average duration (in years) in the program | -0.118 | -0.0319 | -0.0762 |
| Binary (year 1997) | -6.373 | -5.582 | -2.586 |
| Employment type | n/a | n/a | n/a |
| Ful time employment (reference) | (reference) | (reference) | (reference) |
| Part Time Employment | -14.58 | -4.025** | -0.949 |
| Temporary Employment | -6.206** | 2.303 | 1.499 |
| Main sectors | n/a | n/a | n/a |
| Banking and Financial Services | 8.092 | 13.85 | 0.398 |
| Communications | 6.342 | 6.852 | 2.445 |
| Transportation | 9.427* | 9.776 | 1.514 |
| 'Other' (reference) | (reference) | (reference) | (reference) |
| Occupation groups | n/a | n/a | n/a |
| Senior Managers | 7.403** | 5.120** | -1.503 |
| Middle and other Mangers | 2.573 | -18.24 | 2.4 |
| Professionals | -0.764 | -0.564 | 2.025 |
| Semi-Professionals and Technicians | 7.239*** | 1.546 | -1.917 |
| Supervisor | -0.414 | -2.346* | 1.483 |
| Supervisors: Crafts and Trades | 2.683 | -0.114 | 0.558 |
| Administrative and Senior Clerical Personnel | -14.18 | -1.505 | 1.026 |
| Skilled Sales and Service Personnel | 3.323 | 0.267 | 3.428* |
| Skilled Crafts and Trades Workers | 7.747*** | -6.948 | 2.185 |
| Clerical Personnel (reference) | (reference) | (reference) | (reference) |
| Intermediate Sales and Service Personnel | 3.610* | -0.945 | -1.288 |
| Semi-Skilled Manual Workers | 1.843 | -2.251 | -0.435 |
| Other Sales and Service Personnel | 3.367 | 2.188 | -19.03* |
| Other Manual Workers | 1.535 | 1.365 | -1.246 |
| Provinces | n/a | n/a | n/a |
| Ontario (reference) | (reference) | (reference) | (reference) |
| Quebec | 1.88 | 9.852* | -6.319*** |
| Nova Scotia | -1.297 | 10.52* | -2.630* |
| New Brunswick | 1.129 | 13.55** | 2.234 |
| Manitoba | 1.855 | 15.37** | -2.318 |
| British Columbia | 1.57 | 9.519 | -2.242* |
| Prince Edward Island | -1.37 | 10.37** | 0.22 |
| Saskatchewan | 1.059 | 7.686 | 0.53 |
| Alberta | -13.67 | 8.789 | -4.840* |
| Newfoundland and Labrador | -2.003 | 6.855 | -0.98 |
| Territories | 2.926 | 19.15** | 0.201 |
| Employer size (number of employees) | n/a | n/a | n/a |
| 100 to 500 (reference) | (reference) | (reference) | (reference) |
| 500 to 2,500 | -6.645 | -12.33 | 2.069 |
| 2,500 to 10,000 | -3.239 | -5.815 | 0.792 |
| 10,000 to 40,000 | -0.439 | -3.352 | 1.482 |
| Over 40,000 | -3.013 | -9.828** | 2.816 |
| Constant | 8.817* | 0.397 | 4.372** |
| Observations | 6,667 | 5,746 | 3,178 |
| R-squared | 0.0076 | 0.0041 | 0.02 |
- Source: LEEP data; Census 2016
Disaggregated representation rates for the designated groups
Further to Finding 4.1, the figures in this section display the representation of the 4 designated groups further broken down by sector and occupational group.
The following figure displays the disaggregated representation for women.

Figure 22: Text description
| Occupational group | 2017 | 2018 | 2019 | 2020 | 2021 | 2022 | 2023 | LMA |
|---|---|---|---|---|---|---|---|---|
| Senior Managers | 27.7% | 28.4% | 29.0% | 29.6% | 30.6% | 31.3% | 32.4% | 27.6% |
| Middle and Other Managers | 42.3% | 41.7% | 42.7% | 42.6% | 42.9% | 43.4% | 43.1% | 39.4% |
| Professionals | 44.5% | 44.0% | 43.9% | 44.0% | 44.4% | 44.4% | 44.2% | 55.0% |
| Semi-Professionals and Technicians | 19.4% | 19.5% | 19.3% | 19.9% | 22.2% | 22.1% | 21.2% | 53.5% |
| Supervisors | 59.3% | 58.7% | 59.3% | 58.8% | 57.7% | 59.9% | 59.3% | 55.5% |
| Supervisors: Crafts and Trades | 8.2% | 8.3% | 9.2% | 10.5% | 9.9% | 10.0% | 9.4% | 10.8% |
| Administrative & Senior Clerical Personnel | 76.2% | 73.1% | 72.8% | 72.2% | 71.5% | 68.1% | 68.6% | 82.4% |
| Skilled Sales and Service Personnel | 54.4% | 53.6% | 53.3% | 53.6% | 55.0% | 52.8% | 52.2% | 49.7% |
| Skilled Crafts and Trades Workers | 4.8% | 4.8% | 4.8% | 5.1% | 4.4% | 4.4% | 4.4% | 4.0% |
| Clerical Personnel | 56.3% | 55.3% | 53.4% | 52.9% | 52.1% | 51.2% | 51.1% | 68.7% |
| Intermediate Sales and Service Personnel | 62.6% | 62.2% | 62.5% | 62.2% | 62.4% | 62.2% | 62.3% | 68.4% |
| Semi-Skilled Manual Workers | 11.6% | 12.1% | 12.2% | 13.1% | 13.4% | 13.7% | 11.4% | 17.1% |
| Other Sales and Service Personnel | 41.2% | 40.8% | 39.2% | 36.7% | 38.7% | 40.0% | 38.5% | 56.3% |
| Other Manual Workers | 10.2% | 10.4% | 12.8% | 15.3% | 18.0% | 11.4% | 11.5% | 22.1% |
- Source: LEEP data; Census 2016
The following figure displays the disaggregated representation for members of visible minorities:

Figure 23: Text description
| Occupational group | 2017 | 2018 | 2019 | 2020 | 2021 | 2022 | 2023 | LMA |
|---|---|---|---|---|---|---|---|---|
| Senior Managers | 10.2% | 11.0% | 12.0% | 13.1% | 14.5% | 15.4% | 17.1% | 11.5% |
| Middle and Other Managers | 24.5% | 25.7% | 26.6% | 29.7% | 31.0% | 32.0% | 33.5% | 17.6% |
| Professionals | 31.4% | 32.5% | 33.2% | 36.1% | 38.0% | 39.5% | 41.2% | 23.2% |
| Semi-Professionals and Technicians | 13.9% | 14.3% | 14.2% | 15.0% | 17.4% | 18.8% | 20.0% | 19.1% |
| Supervisors | 21.3% | 21.2% | 21.9% | 23.9% | 25.0% | 25.4% | 26.1% | 24.0% |
| Supervisors: Crafts and Trades | 10.2% | 11.0% | 11.1% | 11.6% | 13.0% | 13.3% | 14.3% | 11.0% |
| Administrative & Senior Clerical Personnel | 26.4% | 28.7% | 27.9% | 30.9% | 32.0% | 36.2% | 37.1% | 16.4% |
| Skilled Sales and Service Personnel | 30.0% | 30.9% | 31.0% | 33.9% | 37.5% | 41.1% | 42.9% | 27.7% |
| Skilled Crafts and Trades Workers | 14.2% | 14.8% | 15.5% | 15.2% | 16.5% | 17.4% | 18.4% | 12.0% |
| Clerical Personnel | 24.0% | 25.7% | 26.4% | 27.8% | 28.2% | 29.4% | 30.2% | 21.9% |
| Intermediate Sales and Service Personnel | 24.1% | 25.7% | 26.5% | 28.5% | 29.7% | 30.7% | 31.6% | 25.4% |
| Semi-Skilled Manual Workers | 17.8% | 18.2% | 18.4% | 17.7% | 18.5% | 19.5% | 20.6% | 22.4% |
| Other Sales and Service Personnel | 14.8% | 15.2% | 16.7% | 14.8% | 18.5% | 19.0% | 19.8% | 26.5% |
| Other Manual Workers | 13.8% | 13.9% | 11.5% | 10.9% | 12.4% | 14.0% | 15.1% | 21.0% |
- Source: LEEP data; Census 2016
The following figure displays the disaggregated representation for Indigenous peoples:

Figure 24: Text description
| Occupational group | 2017 | 2018 | 2019 | 2020 | 2021 | 2022 | 2023 | LMA |
|---|---|---|---|---|---|---|---|---|
| Senior Managers | 1.0% | 0.9% | 1.1% | 1.3% | 1.3% | 1.4% | 1.4% | 3.2% |
| Middle and Other Managers | 1.3% | 1.3% | 1.3% | 1.3% | 1.4% | 1.4% | 1.4% | 2.7% |
| Professionals | 1.2% | 1.2% | 1.2% | 1.3% | 1.3% | 1.3% | 1.2% | 2.4% |
| Semi-Professionals and Technicians | 2.5% | 2.4% | 2.4% | 2.5% | 2.5% | 2.4% | 2.4% | 4.2% |
| Supervisors | 2.3% | 2.4% | 2.2% | 2.4% | 2.6% | 2.9% | 3.1% | 3.9% |
| Supervisors: Crafts and Trades | 3.9% | 3.5% | 3.6% | 3.6% | 4.1% | 4.4% | 4.8% | 4.3% |
| Administrative & Senior Clerical Personnel | 1.8% | 1.7% | 1.8% | 1.9% | 2.1% | 2.0% | 2.0% | 3.5% |
| Skilled Sales and Service Personnel | 1.7% | 1.5% | 1.6% | 2.0% | 2.1% | 1.8% | 1.8% | 3.7% |
| Skilled Crafts and Trades Workers | 3.9% | 3.9% | 4.0% | 4.4% | 4.3% | 4.3% | 4.5% | 5.2% |
| Clerical Personnel | 2.1% | 2.1% | 2.2% | 2.2% | 2.3% | 2.6% | 2.6% | 4.2% |
| Intermediate Sales and Service Personnel | 2.4% | 2.4% | 2.4% | 2.7% | 2.6% | 2.5% | 2.5% | 4.5% |
| Semi-Skilled Manual Workers | 3.4% | 3.3% | 3.3% | 3.4% | 3.6% | 3.6% | 3.5% | 4.8% |
| Other Sales and Service Personnel | 4.0% | 3.9% | 3.3% | 3.8% | 3.7% | 3.9% | 5.0% | 5.8% |
| Other Manual Workers | 6.2% | 6.0% | 6.0% | 4.6% | 5.0% | 5.0% | 5.5% | 6.8% |
- Source: LEEP data; Census 2016
The following figure displays the disaggregated representation for persons with disabilities:

Figure 25: Text description
| Occupational group | 2017 | 2018 | 2019 | 2020 | 2021 | 2022 | 2023 | LMA |
|---|---|---|---|---|---|---|---|---|
| Senior Managers | 3.0% | 3.2% | 3.2% | 3.5% | 4.3% | 5.2% | 5.4% | 5.0% |
| Middle and Other Managers | 3.5% | 3.6% | 3.7% | 4.3% | 4.8% | 5.7% | 6.1% | 5.0% |
| Professionals | 3.4% | 3.6% | 3.8% | 4.5% | 4.9% | 5.5% | 5.8% | 8.9% |
| Semi-Professionals and Technicians | 2.6% | 2.5% | 2.4% | 2.6% | 3.3% | 3.5% | 3.7% | 7.6% |
| Supervisors | 3.8% | 4.0% | 4.1% | 4.8% | 6.5% | 7.9% | 8.0% | 27.5% |
| Supervisors: Crafts and Trades | 2.1% | 2.0% | 2.3% | 2.3% | 3.6% | 3.7% | 4.1% | 10.1% |
| Administrative & Senior Clerical Personnel | 3.7% | 4.1% | 4.5% | 4.7% | 5.3% | 6.4% | 6.7% | 10.0% |
| Skilled Sales and Service Personnel | 4.3% | 3.9% | 3.9% | 4.7% | 5.1% | 5.5% | 5.5% | 8.0% |
| Skilled Crafts and Trades Workers | 2.4% | 2.3% | 2.3% | 2.7% | 3.3% | 3.4% | 3.8% | 7.8% |
| Clerical Personnel | 4.2% | 4.6% | 4.6% | 4.8% | 5.7% | 6.5% | 6.9% | 9.3% |
| Intermediate Sales and Service Personnel | 3.4% | 3.5% | 3.5% | 4.5% | 4.7% | 4.7% | 4.7% | 10.8% |
| Semi-Skilled Manual Workers | 2.6% | 2.6% | 2.5% | 2.4% | 2.3% | 2.6% | 2.8% | 10.3% |
| Other Sales and Service Personnel | 4.3% | 4.1% | 4.2% | 4.7% | 5.0% | 4.3% | 5.1% | 10.7% |
| Other Manual Workers | 3.1% | 2.8% | 2.5% | 2.4% | 3.0% | 3.7% | 3.7% | 6.8% |
- Source: LEEP data; CSD 2017
Geospatial mapping of regional disparity in LEEP (representation)

Figure 26: Text description
| Census Metropolitan Area | Women attainment rate | Indigenous peoples attainment rate | Visible minorities attainment rate |
|---|---|---|---|
| Abbotsford | 60.0% | 57.7% | 11.6% |
| Calgary | 86.2% | 80.3% | 15.1% |
| Edmonton | 79.0% | 68.5% | 21.0% |
| Kelowna | 68.9% | 86.7% | 74.9% |
| Regina | 96.5% | 61.6% | 26.0% |
| Saskatoon | 83.8% | 58.0% | 34.2% |
| Thunder Bay | 65.6% | 96.9% | 150.6% |
| Vancouver | 78.3% | 85.5% | 8.1% |
| Victoria | 77.5% | 72.8% | 61.5% |
| Winnipeg | 67.3% | 76.0% | 17.5% |

Figure 27: Text description
| Census Metropolitan Area | Women attainment rate | Indigenous peoples attainment rate | Visible minorities attainment rate |
|---|---|---|---|
| Barrie | 56.0% | 90.4% | 49.0% |
| Belleville | 7.7% | 77.5% | 148.6% |
| Brantford | 70.1% | 83.1% | 82.7% |
| Greater Sudbury | 88.6% | 82.4% | 175.1% |
| Guelph | 73.1% | 109.2% | 32.4% |
| Hamilton | 82.4% | 97.3% | 36.6% |
| Kingston | 88.9% | 48.0% | 125.6% |
| Kitchener-Cambridge-Waterloo | 84.1% | 109.4% | 34.9% |
| London | 86.9% | 97.4% | 71.8% |
| Oshawa | 66.2% | 80.9% | 43.5% |
| Peterborough | 42.2% | 61.2% | 91.8% |
| St. Catharines-Niagara | 75.6% | 67.6% | 55.9% |
| Toronto | 89.8% | 150.1% | 9.6% |
| Windsor | 91.1% | 71.6% | 29.9% |
- Source: LEEP data

Figure 28: Text description
| Census Metropolitan Area | Women attainment rate | Indigenous peoples attainment rate | Visible minorities attainment rate |
|---|---|---|---|
| Halifax | 82.9% | 79.9% | 74.9% |
| Moncton | 84.9% | 61.1% | 180.6% |
| Montréal | 81.4% | 114.2% | 14.9% |
| Ottawa-Gatineau | 80.6% | 74.6% | 37.6% |
| Québec | 59.1% | 61.4% | 45.3% |
| Saguenay | 91.8% | 39.6% | 215.9% |
| Saint John | 80.9% | 102.9% | 218.3% |
| Sherbrooke | 87.8% | 51.4% | 60.2% |
| St. John's | 79.9% | 81.7% | 127.4% |
| Trois-Rivières | 69.6% | 95.9% | 71.6% |
- Source: LEEP data
Appendix F: References
- Behavioural Insights Team. (2022). How to Improve Workplace Equity - Evidence-based Actions for Employers. Retrieved from https://www.canada.ca/en/employment-social-development/corporate/portfolio/labour/programs/employment-equity/reports/employers-improve-workplace.html.
- Blackett, A. (2023). A Transformative Framework to Achieve and Sustain Employment Equity - Report of the Employment Equity Act Review Task Force. Retrieved from https://www.canada.ca/en/employment-social-development/corporate/portfolio/labour/programs/employment-equity/reports/act-review-task-force.html
- Employment and Social Development Canada. (2019). Evaluation of the Employment Equity Programs. Retrieved from https://www.canada.ca/en/employment-social-development/corporate/reports/evaluations/employment-equity-programs.html
- Employment and Social Development Canada. (2024, February 2). Minister O'Regan launches first of its kind pay transparency website: Equi'Vision. Retrieved from https://www.canada.ca/en/employment-social-development/news/2024/02/minister-oregan-launches-first-of-its-kind-pay-transparency-website-equivision.html
- Employment Equity Act (S.C. 1995, c. 44). Retrieved from https://laws-lois.justice.gc.ca/eng/acts/e-5.401/page-1.html
- Government of Canada. (2020). Supporting Canadians and Fighting COVID-19: Fall Economic Statement 2020. Retrieved from https://budget.canada.ca/fes-eea/2020/home-accueil-en.html
- Government of Canada. (n.d.). GC InfoBase - Infographic for Workplace Equity Program. Retrieved from https://www.tbs-sct.canada.ca/ems-sgd/edb-bdd/index-eng.html#infographic/program/HRSD-BGP04/intro
- Jain, H. C., Lawler, J. J., Bai, B. & Lee, E. K. (2010). Effectiveness of Canada's Employment Equity Legislation for Women (1997-2004): Implications for Policy Makers. Relations industrielles / Industrial Relations, 65(2), 304-329. https://doi.org/10.7202/044304ar
- Labour Program. (2023). Employment Equity Act: Annual Report 2022. Employment and Social Development Canada. Retrieved from https://www.canada.ca/en/employment-social-development/corporate/portfolio/labour/programs/employment-equity/reports/2022-annual.html
- Labour Program. (2023). Employment Equity Act: Annual Report 2023. Employment and Social Development Canada. Retrieved from https://www.canada.ca/en/employment-social-development/corporate/portfolio/labour/programs/employment-equity/reports/2023-annual.html
- Labour Program. (n.d.). Equi'Vision: An Employment Equity Tool. Employment and Social Development Canada. Retrieved from https://equivision.services.gc.ca/
- Labour Program. (n.d.). Federal Contractors Program (FCP) compliance assessment policy. Retrieved from https://www.canada.ca/en/employment-social-development/corporate/portfolio/labour/programs/employment-equity/federal-contractors/compliance-assessment.html
- Statistics Canada. (2017). 2016 Census of Population.
- Statistics Canada. (2019). 2017 Canadian Survey on Disability (CSD).
- Statistics Canada. (2021). Introduction to the North American Industry Classification System (NAICS) Canada 2022 Version 1.0. Retrieved from https://www.statcan.gc.ca/en/subjects/standard/naics/2022/v1/introduction
- Statistics Canada. (2022). 2021 Census of Population.