
Quarterly Financial report for the Quarter Ended December 31, 2018
Official Title: Employment and Social Development Canada Quarterly Financial Report Statement Outlining Results, Risks and Significant Changes in Operations, Personnel and Programs for the Quarter Ended December 31, 2018
1. Introduction
This quarterly report has been prepared by management as required by section 65.1 of the Financial Administration Act and in the form and manner prescribed by the Treasury Board. This quarterly report should be read in conjunction with the Main Estimates for the current year.
1.1 Authority, mandate and programs
The mission of Employment and Social Development Canada (ESDC), including the Labour Program and Service Canada, is to build a stronger and more inclusive Canada, support Canadians in helping them live productive and rewarding lives and improve Canadians’ quality of life.
The Minister of Families, Children and Social Development, the Minister of Employment, Workforce Development and Labour, the Minister of Seniors and the Minister of Public Services and Procurement and Accessibility are responsible for this organization.
ESDC delivers programs and services to each and every Canadian throughout their lives in a significant capacity. ESDC fulfills its mission by:
- developing policies that ensure Canadians can use their talents, skills and resources to participate in learning, work and their community;
- delivering programs that help Canadians move through life’s transitions, from school to work, from one job to another, from unemployment to employment, from the workforce to retirement;
- providing income support to seniors, families with children and those unemployed due to job loss, illness or caregiving responsibilities;
- helping Canadians with distinct needs, such as Indigenous people, persons with disabilities, homeless people, travelers and recent immigrants;
- ensuring labour relations stability by providing mediation services;
- promoting a fair and healthy workplace by enforcing minimum working conditions, promoting decent work and employment equity and fostering respect for international labour standards; and
- delivering programs and services on behalf of other departments and agencies.
Further details on ESDC’s authority, mandate and programs may be found in Part II of the Main Estimates and in the Departmental Plan.
1.2 Basis of presentation
This quarterly report has been prepared by management using an expenditure basis of accounting. The accompanying Statement of Authorities (Table 1) includes ESDC’s spending authorities granted by Parliament, consistent with the Main Estimates and the budgetary authorities used by the Department for the 2018–19 fiscal year. This quarterly report has been prepared using a special-purpose financial reporting framework designed to meet financial information needs with respect to the use of spending authorities.
The authority of Parliament is required before moneys can be spent by the Government. Approvals are given in the form of annually approved limits through appropriation acts or through legislation in the form of statutory spending authorities for specific purposes.
As part of the departmental performance reporting process, ESDC prepares its annual departmental financial statements on a full accrual basis in accordance with Treasury Board accounting policies, which are based on Canadian generally accepted accounting principles for the public sector. However, the spending authorities voted by Parliament remain on an expenditure basis.
The quarterly report has not been subject to an external audit or review.
1.3 ESDC’s financial structure
ESDC has a complex financial structure, with various funding mechanisms used to deliver its mandate. This includes budgetary authorities, comprised of voted and statutory authorities, as well as non-budgetary authorities. The voted budgetary authorities include Vote 1 (Operating Expenditures), vote-netted revenues, and Vote 5 (Grants and Contributions), while the statutory authorities are mainly comprised of the Old Age Security Program, the Canada Student Loans and Grants and Canada Apprentice Loans Program, the Canada Education Savings Program, the Canada Disability Savings Program, the Wage Earner Protection Program, Federal Workers’ Compensation and employee benefit plans (EBP). The non-budgetary authorities consist of loans disbursed under the Canada Student Financial Assistance Act and the Apprentice Loans Act.
The Department is financed by four main sources of funds:
- appropriated funds from the Consolidated Revenue Fund (CRF);
- the Employment Insurance (EI) Operating Account;
- the Canada Pension Plan (CPP); and
- Crown corporations and other government departments.
EI and CPP benefits and related administrative costs are charged against revenues earmarked in separate specified purpose accounts and not through appropriations from government. The EI Operating Account and the CPP are financed by employers and employees. Federal administrative costs incurred by departments in the delivery of programs related to EI and CPP are charged to the respective accounts and reported as revenues credited to the vote. Departmental costs related to the delivery of programs and services on behalf of other government departments, which are mainly for passport services and the administration of the Government Employee Compensation Act, are also reported as revenues netted against ESDC’s expenditures. The EI Operating Account and the CPP are excluded from ESDC’s Main and Supplementary Estimates. However, they are presented in the Departmental Plan. Accordingly, these accounts are not reflected in the Quarterly Financial Report.
2. Highlights of Fiscal Quarter and Fiscal Year-to-Date results
This section highlights the significant items that contributed to the net increase in resources available for the year and the net increase in actual expenditures for the quarter ending December 31, 2018.
ESDC’s total budgetary authority available in the third quarter ending December 31, 2018 was $61,097 million, which represents an overall increase of $2,857 million from the previous year. Much of this increase relates to an increase in statutory items. Statutory items are payments to be made under legislation previously approved by Parliament and are non‑discretionary. Total Year-to-Date (YTD) budgetary authorities used as of the third quarter ending December 31, 2018 were $45,842 million. In comparison, total YTD budgetary authorities used as of the third quarter of the previous year were $43,362 million, representing a year-over-year increase of $2,480 million.
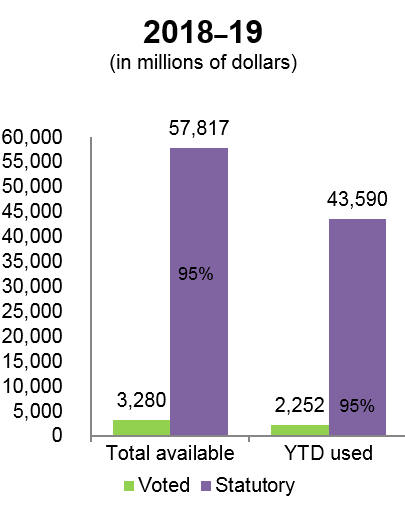
Text description for figure 1
| Total available | % Total available | YTD used | % YTD Used | |
|---|---|---|---|---|
| Voted | 3,280 | 5% | 2,252 | 5% |
| Statutory | 57,817 | 95% | 43,590 | 95% |
| Total | 61,097 | 100% | 45,842 | 100% |

Text description for figure 2
| Total available | % Total available | YTD used | % YTD Used | |
|---|---|---|---|---|
| Voted | 3,214 | 6% | 2,168 | 5% |
| Statutory | 55,026 | 94% | 41,194 | 95% |
| Total | 58,240 | 100% | 43,362 | 100% |
2.1 Significant changes to authorities
ESDC’s budgetary authorities available for use increased by $2,857 million compared to the third quarter of 2017–18 (Tables 1 and 2).
This increase is primarily associated with statutory items. In particular, forecasted OAS pension, Guaranteed Income Supplement (GIS) and Allowance payments represent increases of $2,045 million, $414 million and $53 million respectively, owing to expected changes in the average monthly benefit payments and in the number of beneficiaries. Other factors contributing to the increase include:
- An increase of $119 million in Canada Student Loans and Grants for Students and Canada Apprentice Loans Program mostly due to the implementation of Budget 2016 and Budget 2017 measures that increased the number of low-and middle-income students, including those with dependent children, eligible for the Canada Student Grants;
- An increase of $97 million to Registered Disability Savings Grants and Bonds which is due to a steady increase in total registered Canada Disability Savings Plans and participation in the program;
- An increase of $85 million to the Canada Education Savings Grant and the Canada Learning Bond, due to more people saving for the post-secondary education of children, to more children from low-income families receiving the education savings incentives for the first time in 2018–19 and to more children continuously receiving the Canada Learning Bond;
- An increase of $61 million in Grants and Contributions (Vote 5), mainly related to the funding received for Future Skills Center to support skills development and measurement in Canada and funds for the implementation of the new Indigenous Skills and Employment Training Program to reduce the skills and employment gap between the Indigenous and non-Indigenous populations;
- A decrease of $12 million for Universal Child Care Benefit (UCCB), as authorities include only retroactive payments pertaining to benefits paid prior to July 2016 since it has been replaced by the Canada Child Benefit (CCB); and
- A decrease of $5 million for other items.
| (in millions of dollars) | |
|---|---|
| Total budgetary authorities available for use — 2017–18 | 58,240 |
| Changes to authorities available for use | |
| Old Age Security Payments | 2,045 |
| Guaranteed Income Supplement Payments | 414 |
| Canada Student Loans and Grants and Canada Apprentice Loans Program | 119 |
| Canada Disability Savings Program | 97 |
| Canada Education Savings Program | 85 |
| Vote 5 — Grants and contributions | 61 |
| Allowance Payments | 53 |
| Universal Child Care Benefit | (12) |
| Other | (5) |
| Sub-Total - Changes to authorities available for use | 2,857 |
| Total budgetary authorities available for use — 2018–19 | 61,097 |
For non-budgetary loans, there is a net increase in authorities of $376 million from 2017–18 mainly as a result of introducing a fixed student contribution model to determine Canada Student Loans Program eligibility that allows students to gain valuable work experience without having to worry about a reduction in the amount of their financial assistance as announced in Budget 2016.
As shown in Table 2, total authorities related to personnel expenditures have decreased by $105 million mainly due to the funding for retroactive payments for collective agreements in the third quarter of 2017-18. There is also a decrease of $9 million to the amount of Employee Benefit Plans (EBP) as a result of a reduction to the EBP rate.
Variances to other operating expenditures (standard objects 02, 03, 04, 05, 06, 07 and 09) are the result of adjustments made to authorities available for use to bring them more in line with actual historical spending trends.
2.2 Significant changes to expenditures
Overall, the proportion of ESDC’s total budgetary expenditures as of December 31, 2018 is comparable to the usual spending presented at the third quarter, with approximately 75% of the authorities available for use expensed.
Compared to the previous year, total budgetary expenditures as of the quarter ending December 31, 2018 have increased by $2,480 million (5.7%) from $43,362 million to $45,842 million (refer to Tables 1 and 2).
This 5.7% increase is primarily explained by the rise in statutory expenditures from $41,194 million for the third quarter in 2017–18 to $43,590 million for the same period in 2018–19, representing a $2,396 million increase as of the end of the third quarter of 2018–19. The main reason for this rise is due to increases in statutory payments such as OAS pension, GIS payments and allowance payments, which have respectively increased by $1,613 million, $516 million and $15 million. The main factor explaining these increases is the aging population, thus a greater number of seniors receiving OAS and GIS benefits in addition to higher average amounts paid to beneficiaries.
In addition, payments under the Canada Student Loans and Grants and Canada Apprentice Loans Program have increased by $207 million compared to the spending as at December 31, 2017, mostly due to increased grant amounts for low-income, middle-income and part-time students provided through the Canada Student Grants.
An increase of $57 million in Vote 1 — Operating expenditures as compared to the same period last year is in part attributable to a decrease of $43 million in Gross Operating expenditures mainly attributable to the timing of payment processing for Labour Market Development Agreements administrative costs paid to provinces and territories. This $43 million is offset by a large decrease in recoveries from Vote-Netted Revenues (approx. $100 million) mostly related to the retroactive payments for collective agreements that were paid out in 2017-18, while this type of payment has not occurred in 2018-19.
In addition, expenditures under Vote 5 — Grants and Contributions have increased by $27 million compared to the spending at the end of the same quarter in 2017-18. This increase is partly attributable to the implementation of the Indigenous Early Learning and Child Care Transformation Initiative. The increase is mainly offset by a decrease in the Workforce Development Agreements (WDA) due to timing in signing agreements.
An increase of $21 million compared to the third quarter of 2017-18 for the Canada Education Savings Grant can be mainly attributed to more people opening Registered Education Savings Plans and requesting the education savings incentives for children.
An increase of $9 million compared to the third quarter of 2017–18 for the Canada Disability Savings Program is due to a steady increase in the program’s participation.
Other smaller changes, equating $15 million, also contribute to the variance.
| (in millions of dollars) | |
|---|---|
| Total budgetary authorities used as of December 31, 2017 | 43,362 |
| Changes in authorities used | |
| Old Age Security Payments | 1,613 |
| Guaranteed Income Supplement Payments | 516 |
| Canada Student Loans and Grants and Canada Apprentice Loans Program | 207 |
| Vote 1 — Operating expenditures | 57 |
| Vote 5 — Grants and contributions | 27 |
| Canada Education Savings Programs | 21 |
| Allowance Payments | 15 |
| Other | 15 |
| Canada Disability Savings Program | 9 |
| Sub-Total - Changes in authorities used | 2,480 |
| Total budgetary authorities used as of December 31, 2018 | 45,842 |
In Table 1, the net amount of non-budgetary loans disbursed under the Canada Student Financial Assistance Act has increased by $152 million at the end of the third quarter, primarily due to an increase in loans being issued.
In Table 2, the decrease in professional services (standard object 04) is mostly attributable to the timing of payments rather than changes in spending patterns.
3. Risks and uncertainties
ESDC faces a wide variety of risks due to its extensive mandate and responsibility for designing and delivering a broad span of programs and services to Canadians. ESDC maintains awareness of potential risks associated with the changing service delivery landscape, demographic changes within ESDC and Canadian society, protection of personal information, cyber-security, and the need to build and acquire relevant competencies in a rapidly changing work environment. ESDC is actively managing risks which could impact the Canadian public and continues to make progress on reducing risk levels for key corporate risks through an active enterprise risk management approach. This approach includes ongoing risk updates and discussions with senior management; continuous scanning of internal and external trends driving risks; aligning risk management with departmental goals; and basing risk assessments on evidence. Included in the supplementary information to the 2018–19 Departmental Plan, key risks and response strategies The key risks highlighted below might have a potential financial impact and a brief overview of progress to date to reduce them is provided.
3.1 Investment Planning and Project Management
There is a risk specific to individual projects that they may not deliver on time, within scope and on budget, or deliver their intended benefits and there is a risk that the level of ambition of the investment portfolio does not match with the Department’s capacity to execute.
Risk response strategies:
- To improve project management capacity for major initiatives, the implementation of project management tools to provide real-time information on project status, timelines and expenditures is progressing on target.
- A competency development model has been developed for project managers in order to improve their capacity.
3.2 Human Resource Management
There is a risk that the Department will not be able to sustain a sufficient workforce or attract skilled employees with the appropriate competencies to meet current and future organizational needs.
Risk response strategies:
- The Staffing and Recruitment Strategy has been implemented to ensure the Department has the right people, in the right place at the right time.
- A design thinking methodology has been developed to create a user-centric talent management model with a roadmap of key experiments to support an ESDC talent model.
- The Professional Development Framework to manage talent has been completed.
- A new Competency-Based Management approach is being developed, including learning paths to encourage employee development and career progression.
- To foster a productive workforce, the implementation of the Mental Health in the Workplace Integrated Framework and three-year Action Plan (2015–2018) has been completed. The Department is continuing to mitigate this risk through the implementation of a new three-year action plan for 2018–2021, which has been developed.
- HRSB / ESDC is working with the Office of the Chief Human Resources Officers (OCHRO), the Human Resources Council (HRC) and Policy Horizons to develop a future of work for Public service people management strategy and plan.
4. Significant changes in operations, personnel and programs
To achieve the goals and commitments of the Government of Canada and ESDC Service Strategy that seeks to transform how services are delivered to clients, the Department has launched the Service Transformation Plan. This plan serves as the roadmap for the transformation and modernization of ESDC’s services and advances its vision for improved service delivery. An Integrated Service Management function has been established within the Department that will define the operational context and enabling environment for a successful implementation of the Service Transformation Plan. The agenda aims to establish a new departmental culture and way of operating to ensure service delivery is managed holistically. In 2018–19, ESDC will focus on implementing initiatives related to integrated resource planning, integrated workload management and integrated view of all operations. More information on ESDC’s Service Strategy and Service Transformation Plan can be found in the 2018–19 Departmental Plan, under “Our vision for service excellence”.
5. Approval by senior officials
Approved by:
Mark Perlman, Chief Financial Officer
Gatineau, Canada
February 20, 2019
DATE
Graham Flack, Deputy Minister
Gatineau, Canada
February 22, 2019
DATE
Table 1: Statement of authorities (unaudited)
| Fiscal Year 2018–19 | Fiscal Year 2017–18 | ||||||
|---|---|---|---|---|---|---|---|
| Vote | (in thousands of dollars) | Total available for use for the year ending March 31, 20191 |
Used during the quarter ended December 31, 2018 |
Year to date used at quarter-end | Total available for use for the year ending March 31, 20181 |
Used during the quarter ended December 31, 2017 |
Year to date used at quarter-end |
| 1 | Operating expenditures | 733,807 | 221,451 | 634,310 | 728,484 | 94,426 | 576,107 |
| 5 | Grants and contributions | 2,545,972 | 688,965 | 1,617,998 | 2,484,935 | 653,467 | 1,591,176 |
| (S) | Contributions to employee benefit plans | 247,152 | 60,247 | 180,741 | 256,365 | 57,854 | 173,563 |
| (S) | Minister of Families, Children and Social Development—Salary and motor car allowance | 86 | 21 | 64 | 84 | 21 | 63 |
| (S) | Minister of Employment, Workforce Development and Labour—Salary and motor car allowance | 86 | 21 | 64 | 84 | 21 | 63 |
| (S) | Minister of Seniors—Motor car allowance | 86 | 25 | 32 | - | - | - |
| (S) | Old Age Security Payments (Old Age Security Act) | 40,854,760 | 10,719,725 | 31,567,611 | 38,810,000 | 10,129,871 | 29,954,945 |
| (S) | Guaranteed Income Supplement Payments (Old Age Security Act) | 12,262,059 | 3,085,318 | 9,151,303 | 11,848,000 | 2,962,407 | 8,635,393 |
| (S) | Canada Student Grants to qualifying full and part-time students pursuant to the Canada Student Financial Assistance Act | 1,190,685 | 161,307 | 876,790 | 1,135,016 | 124,751 | 718,818 |
| (S) | Canada Education Savings grant payments to Registered Education Savings Plan (RESP) trustees on behalf of RESP beneficiaries to encourage Canadians to save for post-secondary education for their children | 912,000 | 195,403 | 593,896 | 843,000 | 192,825 | 578,523 |
| (S) | Payments related to the direct financing arrangement under the Canada Student Financial Assistance Act | 858,073 | 113,504 | 308,841 | 795,376 | 107,511 | 262,017 |
| (S) | Allowance Payments (Old Age Security Act) | 550,221 | 138,457 | 414,889 | 497,000 | 137,154 | 399,944 |
| (S) | Canada Disability Savings Grant payments to Registered Disability Savings Plan (RDSP) issuers on behalf of RDSP beneficiaries to encourage long-term financial security of eligible individuals with disabilities | 435,456 | 70,214 | 235,561 | 371,500 | 66,592 | 219,426 |
| (S) | Canada Disability Savings Bond payments to Registered Disability Savings Plan (RDSP) issuers on behalf of RDSP beneficiaries to encourage long-term financial security of eligible individuals with disabilities | 233,243 | 16,414 | 49,223 | 200,600 | 24,807 | 56,237 |
| (S) | Canada Learning Bond payments to Registered Education Savings Plan (RESP) trustees on behalf of RESP beneficiaries to support access to post-secondary education for children from low-income families | 159,000 | 27,962 | 142,355 | 143,000 | 30,232 | 135,966 |
| (S) | Wage Earner Protection Program payments to eligible applicants owed wages and vacation pay, severance pay and termination pay from employers who are either bankrupt or in receivership as well as payments to trustees and receivers who will provide the necessary information to determine eligibility | 49,250 | 1,470 | 11,553 | 49,250 | 3,305 | 11,424 |
| (S) | Payments of compensation respecting government employees (Government Employees Compensation Act) and merchant seamen (Merchant Seamen Compensation Act) | 44,000 | 3,121 | 39,945 | 44,000 | (1,016) | 34,761 |
| (S) | Universal Child Care Benefit (Universal Child Care Benefit Act) | 12,000 | 5,487 | 11,487 | 24,000 | 4,774 | 8,299 |
| (S) | The provision of funds for interest and other payments to lending institutions and liabilities under the Canada Student Financial Assistance Act | 4,449 | 1,180 | 4,622 | 7,359 | 928 | 3,733 |
| (S) | Payment related to direct financing arrangement under the Apprentice Loans Act | 5,279 | 234 | 2,025 | 3,219 | 219 | 2,011 |
| (S) | Civil Service Insurance actuarial liability adjustments | 145 | - | - | 145 | - | - |
| (S) | Supplementary Retirement Benefits—Annuities agents' pensions | 35 | - | - | 35 | - | - |
| (S) | The provision of funds for interest payments to lending institutions under the Canada Student Loans Act | - | - | - | - | - | - |
| (S) | The provision of funds for liabilities including liabilities in the form of guaranteed loans under the Canada Student Loans Act | (2,889) | (644) | (1,724) | (3,572) | (1,139) | (2,596) |
| (S) | Spending of proceeds from the disposal of surplus Crown assets | 120 | 36 | 36 | 234 | - | 1 |
| (S) | Refunds of amounts credited to revenues in previous years | 58 | 11 | 58 | 91 | 78 | 91 |
| (S) | Spending pursuant to section 12(4) of the Canada Education Savings Act | 2,002 | - | 657 | 1,652 | - | 1,651 |
| Sub-total—Statutory items | 57,817,356 | 14,599,513 | 43,590,029 | 55,026,438 | 13,841,195 | 41,194,333 | |
| Total budgetary | 61,097,135 | 15,509,929 | 45,842,337 | 58,239,857 | 14,589,088 | 43,361,616 | |
| Non-Budgetary | |||||||
| (S) | Loans disbursed under the Canada Student Financial Assistance Act | 669,084 | (92,658) | 1,097,484 | 280,883 | (111,563) | 945,393 |
| (S) | Loans disbursed under the Apprentice Loans Act | 65,890 | 9,488 | 22,380 | 77,880 | 11,146 | 27,881 |
| Total Non-Budgetary | 734,974 | (83,170) | 1,119,864 | 358,763 | (100,417) | 973,274 | |
1.Includes only authorities available for use and granted by Parliament at quarter-end.
Table 2: Departmental budgetary expenditures by standard object (unaudited)
| Fiscal year 2018–19 | Fiscal year 2017–18 | |||||
|---|---|---|---|---|---|---|
| (in thousands of dollars) | Planned expenditures for the year ending March 31, 20191 |
Expended during the quarter ended December 31, 2018 | Year to date used at quarter-end | Planned expenditures for the year ending March 31, 20181 |
Expended during the quarter ended December 31, 2017 | Year to date used at quarter-end |
| Expenditures | ||||||
| (01) Personnel | 2,021,515 | 535,451 | 1,578,169 | 2,126,761 | 513,148 | 1,584,965 |
| (02) Transportation and communications | 63,621 | 14,617 | 39,060 | 60,404 | 14,728 | 37,197 |
| (03) Information | 76,839 | 16,537 | 30,877 | 72,207 | 24,022 | 36,342 |
| (04) Professional and special services | 659,927 | 180,465 | 405,578 | 687,685 | 153,700 | 430,814 |
| (05) Rentals | 280,308 | 54,538 | 170,751 | 273,448 | 49,151 | 161,873 |
| (06) Repair and maintenance | 6,557 | 945 | 2,313 | 5,464 | 883 | 1,606 |
| (07) Utilities, materials and supplies | 7,539 | 1,456 | 3,835 | 9,818 | 1,470 | 3,868 |
| (09) Acquisition of machinery and equipment | 31,106 | 3,040 | 7,331 | 38,878 | 8,082 | 15,400 |
| (10) Transfer payments | 59,948,391 | 15,205,084 | 44,930,092 | 57,091,149 | 14,416,973 | 42,528,908 |
| (12) Other subsidies and payments | 9,227 | (126) | 22,344 | 7,500 | 4,419 | 7,767 |
| Total gross budgetary expenditures | 63,105,030 | 16,012,007 | 47,190,350 | 60,373,314 | 15,186,576 | 44,808,740 |
| LESS: Revenues netted against expenditures | ||||||
| Recoverable expenditures on behalf of the Employment Insurance Operating Account | (1,321,207) | (323,131) | (940,877) | (1,447,723) | (430,713) | (1,045,179) |
| Recoverable expenditures on behalf of the Canada Pension Plan | (351,124) | (88,818) | (251,755) | (347,374) | (87,010) | (238,675) |
| Amounts recoverable from Crown agencies and other government departments regarding payments of injury compensation benefits | (124,671) | (44,221) | (78,200) | (124,671) | (40,589) | (76,635) |
| Other amounts recoverable from provincial and territorial governments, other departments or other programs within a department | (210,893) | (45,908) | (77,181) | (213,689) | (39,176) | (86,635) |
| Total revenues netted against expenditures | (2,007,895) | (502,078) | (1,348,013) | (2,133,457) | (597,488) | (1,447,124) |
| Total net budgetary expenditures | 61,097,135 | 15,509,929 | 45,842,337 | 58,239,857 | 14,589,088 | 43,361,616 |
1.Includes only authorities available for use and granted by Parliament at quarter-end.