
Employment Insurance Monitoring and Assessment Report for the fiscal year beginning April 1, 2015 and ending March 31, 2016 Chapter II - 7. Employment Insurance financial information
From: Employment and Social Development Canada
On this page
7. Employment Insurance financial information
The Employment Insurance (EI) program is financed through mandatory premium contributions paid by both employees and their employers based on the employees’ insurable earnings up to the annual Maximum Insurable Earnings (MIE). Since January 2010, self-employed persons that have opted into the EI program are also required to pay EI premiums in order to be eligible for EI special benefits.
EI Premiums and all program-related revenues, collected for the purposes of administering the EI program, are deposited into the Consolidated Revenue Fund (CRF)Footnote 122 and credited to the EI Operating Account (Account), while all EI benefits paid and administrative costs provided for under the Employment Insurance Act are paid out of the CRF and debited from the Account.
The following section provides information on EI premium rates and recent trends in revenues and expenditures recorded for the Account.
7.1 Employment Insurance premium rate
Pursuant to Section 66(1) of the Employment Insurance Act, beginning with the 2017 EI premium rate, the Canada Employment Insurance Commission (Commission) assumes responsibility for setting the annual EI premium rate according to a seven-year break-even mechanism, as forecasted by the EI Chief Actuary. The forecasted seven-year break-even EI rate is the premium rate that is expected to generate sufficient premium revenue to cover expected EI expenditures over the following seven years and eliminate any existing surplus or deficit in the Account. Annual changes to the EI premium rate are legislatively limited to increases or decreases of no more than five cents each year, excluding 2017, the first year under the seven-year mechanism when there was no limit on how much the rate could decline.
Example: Employment Insurance premium contributions
Bernard is an employee working at a telecom company in Kelowna, British Columbia, and earns $45,000 per year.
Based on his income level and assuming Bernard remained employed throughout the year, he will contribute $733.50 in EI premiums for the year with the 2017 premium rate of $1.63 for every $100 of insurable earnings.
Bernard’s employer will contribute $1,027 in EI premiums on Bernard's earnings, for a combined total of $1,760.5 in contributions made to the EI Operating Account in 2017.
The main indicator used to calculate the EI premiums that employees employers and self-employed persons, who have opted into the EI program, are required to pay each year, is the forecasted insurable earnings. EI premiums are paid for every $100 of insurable earnings, up to the annual MIE threshold. Under the Employment Insurance Act, the MIE is indexed annually based on average industrial earnings in Canada, as published by Statistics Canada. In 2017, the MIE was $51,300, an increase of 1.0% from the 2016 MIE of $50,800.
In 2017, the EI premium rate for employees (who were not covered by a provincial parental insurance plan) was set by the Commission at $1.63 per $100 of insurable earnings, a reduction of $0.25 from the 2016 rate of $1.88, to an annual maximum of $836 based on the MIE. Employers pay premiums that are 1.4 times the employee rate. This means that, in 2017, employers paid $2.28 for every $100 of insurable earnings to a maximum of $1,170. Self-employed persons who have opted into the program pay the same EI premium rate as employees, and also pay premiums up to the annual MIE.Footnote 123
| 2015 | 2016 | 2017 | ||
|---|---|---|---|---|
| Residents of a province without a provincial parental insurance plan | Employees | $1.88 | $1.88 | $1.63 |
| Employers | $2.63 | $2.63 | $2.28 | |
| Residents of a province with a provincial parental insurance plan | Employees | $1.54 | $1.52 | $1.27 |
| Employers | $2.16 | $2.13 | $1.78 | |
| Maximum Insurable Earnings | $49,500 | $50,800 | $51,300 | |
- Source: Government of Canada, Public Accounts of Canada 2017, Volume I: Summary Report and Consolidated Financial Statements (Ottawa: Receiver General of Canada, October 2017).
The EI program provides for a reduction in the premium rate of employees who are covered by a provincial parental insurance plan. Quebec is the only province in Canada that administers its own parental insurance plan, known as the Quebec Parental Insurance Plan (QPIP), which provides paid parental, adoption, maternity and paternity benefits. These benefits replace maternity and parental benefits provided by the EI program and, as such, EI premiums in Quebec are lower to reflect the fact that the EI program does not provide maternity and parental benefits to Quebec residents. QPIP is financed by Quebec workers and their employers. The EI premium rate for residents of Quebec in 2017 was established at $1.27 per $100 of insurable earnings. For employers, the premium rate per $100 of insurable earnings was therefore $1.78 in 2017.
7.2 Premium Refund Provision
There are also circumstances in which a share or all of EI premiums paid can be rebated to contributors if certain conditions are met.
The EI program includes a provision that grants premium refunds to employees with insurable earnings equal to or less than $2,000, as they have not worked enough hours to be eligible for EI benefits. Employees who have paid premiums on earnings that exceed the MIE and the maximum contribution in a given tax year are also entitled to a refund of their excess contributions. Under these two circumstances, when the employees file their income tax returns they are entitled to receive a refund of all or a portion of their EI premiums paid in the year. Employers do not receive a corresponding refund.
According to Canada Revenue Agency (CRA) data on T4 slips from employers, there were 929,600 individuals eligible for the full EI premium refund in 2015, representing 5.3% of those with insurable earnings. Of this number, almost 690,000 filed an income tax return in 2015. There was an estimated total of 607,500 tax filers with insurable earnings worth $2,000 or less who paid EI premiums and received a full premium refund based on CRA T1 tax filer data, and a total of $10.8 million in EI premiums were refunded in 2015, relatively unchanged from the $10.7 million in premiums refunded in 2014. Those who received the full premium refund reported an average refund amount of $17.80, an increase of $0.30 from an average rebate of $17.50 in 2014.
7.3 Premium Reduction Program
The EI program also supports the delivery of sickness benefits through private sector employers through the Premium Reduction Program (PRP). The PRP grants employers EI premium reductions when their employees are covered under the employer’s qualified wage-loss plans, also known as short-term disability plans. The plan must meet or exceed certain requirements stipulated in the Employment Insurance Act and Regulations and at least 5/12 of the employer premium reduction must be passed on to the employees covered.
To be considered for a premium reduction, the plan that provides short-term disability benefits to employees must also:
- provide at least 15 weeks of benefits for short-term disability;
- match or exceed the level of benefits provided under EI;
- pay benefit to employees within eight days of illness or injury (the elimination period cannot exceed seven consecutive days)Footnote 124;
- be accessible to employees within three months of hiring; and
- cover employees on a 24-hour-a-day basis.
Given that these employer-sponsored plans reduce the amount of EI special benefits otherwise payable, qualified employers under the PRP pay premiums at a rate that is lower than 1.4 times those of their employees.
For each calendar year, the rates of premium reduction are established based on four categories of qualified plans, with a distinct rate for each category.
- Category 1: Cumulative paid sick leave plans that allow for a minimum monthly accumulation of at least one day and for a maximum accumulation of at least 75 days.
- Category 2: Enhanced cumulative paid sick leave plans that allow for a minimum monthly accumulation of at least one day and two thirds and for a maximum accumulation of at least 125 days.
- Category 3: Weekly indemnity plans with a maximum benefit period of at least 15 weeks.
- Category 4: Weekly indemnity plans with a maximum benefit period of at least 52 weeks. (This reduction is available only to public and para-public employers of a province).
Rates of premium reduction are expressed as a percentage of employee insurable earnings. In 2017, the rates of reduction for each category were 0.21%, 0.36%, 0.35% and 0.39% of insurable earnings for categories 1 through 4 respectively.Footnote 125 Table 58 presents the total value of the premium reductions for the period 2011 to 2015, the most recent year available at the time of preparing this report.
Based on the findings of the most recent departmental supplemental study on the PRP, there were approximately 26,700 employers receiving EI premium reductions through the PRP in 2013. Larger firms were most likely to participate in the PRP, with 59.3% of firms with more than 500 employees participating in 2013, compared to 31.7% of firms with 200-499 employees, 17.1% of firms with 100-199 employees and less than 10.0% of firms with fewer than 50 employees. As of 2013, 7.1 million workers had employment in firms receiving a premium reductionFootnote 126.
| 2011 | 2012 | 2013 | 2014 | 2015 | |
|---|---|---|---|---|---|
| Premium reductions | $877 | $920 | $909 | $854 | $837 |
- Source: Office of the Chief Actuary – Office of the Superintendent of Financial Institutions Canada, 2018 Actuarial Report on the Employment Insurance Premium Rate.
7.4 Small Business Job Credit
On September 11, 2014, the Government of Canada announced the introduction of the new Small Business Job Credit, a two-year measure (2015 and 2016) to help small businesses create jobs and growth and support Canada’s economic recovery, by reducing 15% (18% in Quebec) of their EI premiums from the legislated rate of $1.88 per $100 to $1.60 per $100 of insurable earnings (or from $2.63 to $2.24 in employer premiums per $100 of insurable earnings). Any business that paid employer EI premiums equal to or less than $15,000 in those two years would be eligible for the credit.
In 2016, approximately 766,900 businesses received the Small Business Job Credit with an average refund of $416 , resulting in a total reduction of EI premium revenues by $319 million.
Assessing the Hiring Credit for Small Business
The Hiring Credit for Small Business (HCSB) was an EI premium rebate in effect for three years, from 2011 to 2013. This measure intended to encourage hiring among small businesses by providing up to a $1,000 credit to offset any year-over-year increase in employer EI premiums. To be eligible in 2011 and 2012, prior-year employer premiums needed to be no more than $10,000 while in 2013 this threshold was $15,000.
A supplemental study* of the HCSB found that the credit provided annually on average about $220 million in employer premium reductions to approximately 550,000 firms. This meant benefitting firms received on average approximately $400 each year, or about 0.6% of their combined total of payrolls and EI premiums.
The same supplemental study also assessed the HCSB’s impact in encouraging hiring, with a secondary objective to explore if it promoted firm performance more broadly in areas such as productivity, revenues, and investment. The HCSB did not seem to have encouraged hiring except among unincorporated start-ups. The study also notes that the maximum credit of $1,000 is small as a broader share of labour costs, on average less than one per cent. The supplemental study provides more detailed analysis of the credit and literature review of the impact of similar measures.
* ESDC and Finance Canada, Assessing the Hiring Credit for Small Business (Ottawa: ESDC, Employment Insurance Policy Directorate and Finance Canada, 2018).
7.5 Recent trends in revenues and expenditures
According to the Public Accounts of Canada, total EI revenues fell by 4.2% to $22.6 billion, while EI expenditures increased by 6.3% to $22.5 billion over the previous year. This has generated an approximate net surplus of $84.4 million in FY1617. By comparison, surpluses of $3.2 billion, $3.3 billion, and $2.4 billion were recorded in FY1314, FY1415 and FY1516 respectively (see Table 59).
| 2012/2013 | 2013/2014 | 2014/2015 | 2015/2016 | 2016/2017 | |
|---|---|---|---|---|---|
| Revenues * | $20,871.9 | $22,226.9 | $23,014.8 | $23,586.1 | $22,603.3 |
| Expenditures ** | $18,887.2 | $18,997.2 | $19,759.3 | $21,192.9 | $22,518.9 |
| Annual Surplus (Deficit) | $1,984.7 | $3,229.7 | $3,255.4 | $2,393.2 | $84.4 |
- * Includes all revenues and funding from EI premiums; interest owed on accounts receivable; penalties applied to claimants for violations of terms and conditions of the EI program, and for some years additional funding measures introduced for Employment Insurance under the federal budget.
- ** Includes all expenses related to funding and operations of the EI program including benefit payments under Part I of the EI program; Employment Benefit and Support Measure expenditures under Part II; EI benefit repayments; administrative costs of the EI program; and outstanding debts counted as liabilities against the EI Operating Account.
On March 31, 2017, the accumulated surplus in the EI Operating Account was approximately $3.0 billion, up from an accumulated surplus of $2.9 billion and $0.5 billion on March 31, 2016 and March 31, 2015, respectively, and an accumulated deficit of $2.7 billion on March 31, 2014 (see Chart 41). This increase of the accumulated surplus is mainly a result of the decline in the number of claims established, which can be attributed in part to the growth in the employment observed in FY1617. Annex 5 summarizes EI revenue and expenditure trends for the past three fiscal years and the amount of expenditures across all benefit types.
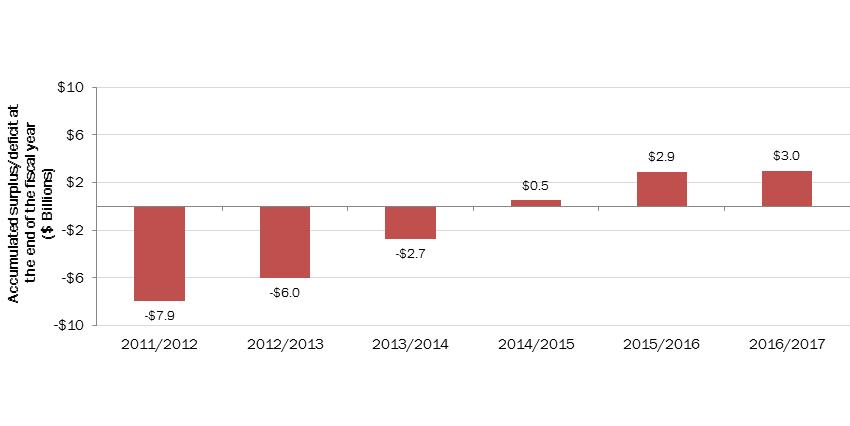
Show data table
| Revenue minus expenditures ($ billions) | |
|---|---|
| 2011/2012 | -$7.9 |
| 2012/2013 | -$6.0 |
| 2013/2014 | -$2.7 |
| 2014/2015 | $0.5 |
| 2015/2016 | $2.9 |
| 2016/2017 | $3.0 |
- Source: Government of Canada, Public Accounts of Canada 2017, Volume I: Summary Report and Consolidated Financial Statements (Ottawa: Receiver General of Canada, October 2017).