
Employment Insurance Monitoring and Assessment Report for the fiscal year beginning April 1, 2016 and ending March 31, 2017 Chapter II - 6. Employment Insurance special benefits
From: Employment and Social Development Canada
6. Employment Insurance special benefits
EI special benefits provide temporary income support to eligible insured employees or self-employed persons (including fishers) who are unable to work due to specific life circumstances. These circumstances include sickness; pregnancy; and caregiving for a newborn, a newly adopted child, a critically ill child, and a gravely ill family member with a significant risk of death.
To qualify for EI special benefits, insured employees must have accumulated a minimum of 600 hours of insurable employment during their qualifying period, meet the eligibility criteria of the specific special benefits being claimed, and experience a reduction in their normal weekly earnings by over 40%. Self-employed persons may qualify if they opted into the EI program at least one full year prior to claiming benefits, have self-employment earnings that meet the minimum self-employment eligibility thresholdFootnote 95 in the calendar year preceding the claim, and—as with insured employees—meet the other eligibility criteria specific to the special benefits being claimed.
Subsection 2.6.1 provides a summary overview of special benefits in terms of the number of new claims established, the amount paid and the level of benefits. The following subsections examine the EI special benefits one by one. Subsection 2.6.2 discusses maternity and parental benefits. Sickness benefits are introduced in subsection 2.6.3. Sub-sections 2.6.4 and 2.6.5 examine compassionate care benefitsFootnote 96 and benefits for parents of critically ill children (PCIC), respectively. Finally, subsection 2.6.6 looks at the use of special benefits by self-employed persons who have opted into the EI program.
For the purpose of this section, EI special benefit claims refer to EI claims for which at least one dollar of special benefits was paid.Footnote 97
6.1 Employment Insurance special benefits claims overview
Over the period assessed, there were about 563,400 new special benefit claims established, which represents a 2.3% increase over the previous fiscal year and the sixth consecutive year-over-year increase. Of this number, two thirds of special benefit claims included sickness benefits (67.2%), while 34.8% and 30.2% included parental and maternity benefits respectively. The two other types of special benefits were paid less frequently. About 1.8% of all special benefit claims included compassionate care benefits and 0.7% included PCIC benefits (see Table 44).
| Number of claims | Amount paid ($ millions) | |||||
|---|---|---|---|---|---|---|
| 2015/2016 | 2016/2017 | Change (%) | 2015/2016 | 2016/2017 | Change (%) | |
| Maternity | 174,510 | 170,330 | -2.4% | $1,110.9 | $1,137.3 | +2.4% |
| Parental | 196,660 | 195,960 | -0.4% | $2,643.5 | $2,705.1 | +2.3% |
| Sickness | 365,480 | 378,700 | +3.6% | $1,456.0 | $1,567.4 | +7.7% |
| Compassionate care | 7,871 | 10,193 | +29.5% | $18.3 | $54.1 | +195.4% |
| PCIC | 3,740 r | 4,211 | +12.6% | $23.8 r | $26.5 | +11.3% |
| Canada | 550,810 | 563,380 | +2.3% | $5,252.5 r | $5,490.4 | +4.5% |
- Note: Data may not add up to the total due to rounding. Percentage change is based on unrounded numbers. Includes all claims for which at least $1 in EI special benefits was paid. New claims established by benefit type may not sum as claimants can receive multiple benefit types on a single claim.
- r Revised data.
- Source: Employment and Social Development Canada, Employment Insurance (EI) administrative data. Data on maternity, parental and sickness benefits are based on a 10% sample of EI administrative data, whereas data on compassionate care benefits and PCIC claims are based on a 100% sample.
The number of sickness claims established increased by 3.6% in comparison to the previous year, whereas maternity and parental claims recorded decreases of 2.4% and 0.4%, respectively. Compassionate care benefits experienced the largest percentage change with a 29.5% hike in new claims, followed by PCIC claims which increased by 12.6%.
The total amount of special benefits paid increased by 4.5% over the previous year, totaling $5.5 billion for FY1617. Amounts paid went up for all types of special benefits. As in the previous fiscal year, the largest percentage increase was registered for compassionate care benefits (+195.4%), followed by PCIC benefits (+11.3%).
Like previous years, almost two thirds of special benefit claims (65.3%) were established by women, and they received the majority of the amount paid in special benefits (81.8%). The largest proportion of special benefits received by women can be explained in particular by maternity benefits, and the fact that women received 91.4% of the total amount paid in parental benefits and 68.9% of the compassionate care benefits. Women also received the majority of special benefits for self-employed persons (97.7%).
By age, claimants between the ages of 25 and 39 years old established almost half (48.7%) of new special benefit claims and most claims for maternity (87.3%) and parental (86.1%) benefits. They also received the largest share of total special benefits paid (71.2%) and received 89.5% and 88.3% of the total amounts paid for maternity and parental benefits respectively. Claimants aged 40 and older represented the largest proportion of people claiming sickness benefits (60.9%) and compassionate care benefits (76.6%) and received 64.0% and 78.0% of the amounts paid in sickness benefits and compassionate care benefits, respectively.
The average weekly benefit rate for new special benefit claims established jumped 2.0% to reach $432. The share of special benefit claims for which the maximum weekly benefit rate was paid was 40.7%, a slight dip of 0.8 percentage points compared to the previous year.
More flexible and inclusive Employment Insurance benefits and leaves for Canadian families
In Budget 2017, the government committed to offering more flexible and inclusive EI benefits to Canadian families. The Budget Implementation Act, 2017, No. 1 modified all current EI special benefits, and measures were implemented on December 3, 2017. Consequently, these measures were not in effect during the reporting period examined in this report. These measures include the following:
- Allow pregnant workers to begin receiving the 15 weeks of EI maternity benefits up to 12 weeks before the expected delivery date rather than the current eight weeks.
- Allow parents to choose between receiving the regular duration of EI parental benefits for 35 weeks at 55% of their average weekly insurable earnings, or to receive the new extended duration of parental benefits for 61 weeks at a reduced rate of 33% of their average weekly insurable earnings, up to a maximum amount depending on the selected option.
- Introduce a new EI Family Caregiver Benefit for Adults that gives eligible caregivers access to a maximum of 15 weeks of benefits to provide care or support to an adult family member who is critically ill or injured.
- Expand the definition of caregiver to family members eligible for PCIC benefits (renamed EI Family Caregiver Benefit for Children) and the new Family Caregiver Benefit for Adults.
- Allow doctors and nurse practitioners, and not only doctors, to issue the medical certificates required for compassionate care benefits and Family Caregiver benefits to take care of a critically ill adult or child.
Employment Insurance special benefits and firms
According to 2015 tax dataFootnote 98—the most recent microdata available when writing this report—there were just over 190,400 firmsFootnote 99 (15.9% of all firms in 2015) associated with the establishment of an EI special benefit claim as a claimant’s current or most recent employer (see Table 45). This is a slight increase of 0.8% from the previous year.
The distribution of the workforce and EI special benefit claimants is roughly similar by size of employer, unlike EI regular benefits for which larger firms are under-represented (see section 2.2 Employment Insurance regular benefits). In the case of special benefits, the largest difference between employee and claimant distributions was observed in small-sized firms (1 to 19 employees), but only at a difference of 3.1 percentage points. In regards to large firms (500 employees or more), the share of EI special benefit claimants (42.3%) was very similar to the presence of their employees in the workforce (43.1%). In contrast, the share of regular benefit claims established by their employees was less (32.0%). Whereas workforce adjustment issues during a difficult business or economic context may offer some explanation of the higher relative use of EI regular benefits among small firms, the use of EI special benefits more likely relates to the demographic profile of the workforce, individual circumstances, and the nature of the work in the industry.
| Number of firms | Employment distribution** (% Share) |
EI claimant*** (% Share) |
||
|---|---|---|---|---|
| All firms | Firms with at least one employee receiving EI special benefits | |||
| Small | 1,083,684 | 109,630 | 21.6% | 18.5% |
| Small-medium | 92,694 | 62,746 | 19.5% | 21.1% |
| Medium-large | 15,646 | 14,856 | 15.8% | 18.0% |
| Large | 3,215 | 3,192 | 43.1% | 42.3% |
| Canada | 1,195,239 | 190,424 | 100.0% | 100.0% |
- * The categories of firm size reflect those found in Business Dynamics in Canada, a Statistics Canada publication. Small-sized firms are defined as those that employ 1 to 19 employees. Small-to-medium-sized firms employ 20 to 99 employees. Medium-to-large sized firms employ 100 to 499 employees. Large-sized firms employ 500 employees or more.
- **The number of workers in a firm is the number of individuals with employment income in that firm, as indicated on a T4 form. The number of workers is adjusted so that each individual in the labour force is only counted once and individuals who work for more than one firm are taken into account. For example, if an employee earned $25,000 in firm 1 and $25,000 in firm 2, then he or she was recorded as 0.5 employees at the first firm and 0.5 employees at the second firm.
- *** These are based on the number of people receiving EI special benefits in 2015.
- Sources: Employment and Social Development Canada, Employment Insurance (EI) administrative data. Data are based on a 100% sample of EI data. Canada Revenue Agency (CRA) administrative data. CRA data are based on a 100% sample.
6.2 Employment Insurance maternity and parental benefits
EI maternity benefits are available to eligible biological mothers who cannot work because they are pregnant or have recently given birth. EI maternity claimants need to meet the eligibility requirements for EI special benefits in terms of insurable hours of employment or earnings (see section 2.6 Employment Insurance special benefits) and provide the Commission with a signed statement attesting to their pregnancy and their expected or actual date of delivery. Footnote 100Qualified claimants may receive up to 15 weeks of maternity benefits per benefit period. Benefits can begin to be paid eight weeks prior to the expected date of birth and can last up to 17 weeks after the child’s actual birth date.Footnote 101
EI parental benefits are available to parents who take a leave from work to care for a newborn or recently adopted child or children. To be eligible for parental benefits, applicants must meet the eligibility requirements for EI special benefits in terms of hours of insurable employment or earnings and provide a signed certificate certifying the child’s date of birth or the date of the child’s placement in their home for an adoption. Up to 35 weeks of parental benefits are available to qualified claimants and can be shared between parents for a combined maximum total of 35 weeks of benefits.Footnote 102
For the purpose of these sections, EI maternity claims refer to claims for which at least one dollar of maternity benefits was paid, and EI parental claims refer to claims for which at least one dollar of parental benefits was paid. It should be noted that the maternity and parental benefits offered under the EI program only apply to parents who reside outside of Quebec as the Quebec Parental Insurance Plan (QPIP) has provided benefits to salaried workers and self-employed persons in Quebec who are eligible to take maternity, paternity, parental, or adoption leave since January 1, 2006.
Employment Insurance maternity and parental benefits: coverage and accessibility
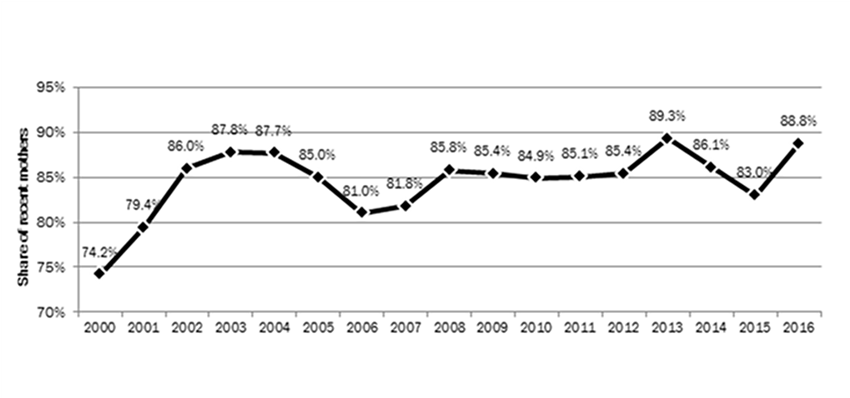
According to the 2016 Employment Insurance Coverage Survey (EICS), 209,800 recent mothers (those with a child aged 12 months or less) living outside Quebec had insurable employment in 2016, which represents 72.0% of all recent mothers.
Among those 209,800 recent mothers, 88.8% reported having received maternity or parental benefits in 2016, which represents an increase of 5.8 percentage points from the previous year (83.0%) and the second-highest share since the year 2000 when the survey began collecting data (see Chart 36).
Show data table
| 2000 | 2001 | 2002 | 2003 | 2004 | 2005 | 2006 | 2007 | 2008 | 2009 | 2010 | 2011 | 2012 | 2013 | 2014 | 2015 | 2016 | |
|---|---|---|---|---|---|---|---|---|---|---|---|---|---|---|---|---|---|
| Share of recent mothers (%) | 74.2% | 79.4% | 86.0% | 87.8% | 87.7% | 85.0% | 81.0% | 81.8% | 85.8% | 85.4% | 84.9% | 85.1% | 85.4% | 89.3% | 86.1% | 83.0% | 88.8% |
- Source: Statistics Canada, Employment Insurance Coverage Survey, 2000 to 2016
According to EICS data, the proportion of spouses of recent mothers living outside Quebec who received or intended to claim EI parental benefits increased to 12.9% in 2016 compared to 11.9% in 2015. In Quebec, a larger share of recent fathers received parental benefits or intended to receive them (80.1%), which may be largely due to the paternity benefit paid specifically to fathers as part of QPIP.
Access to maternity and parental benefits and coverage
According to 2016 EICS data, the share of recent mothers with insurable employment in Quebec who received maternity or parental benefits under QPIP (96.9%) is greater than that of persons having received EI maternity or parental benefits in other regions of Canada (88.8%). This situation can be explained by several factors, most notably the mandatory participation of self-employed persons under QPIP in comparison to the voluntary participation in the EI program and the lower eligibility requirement based on earnings under QPIP ($2,000).
Employment Insurance maternity claims, amount paid and level of benefits
The total number of new maternity claims established dropped by 2.4% over the previous year to nearly 170,300 in FY1617 (see Table 46). The number of maternity claims fell in almost all provinces and territories, except in Nunavut (+10.0%) and British Columbia (+0.2%) where the number of new claims stayed virtually the same.
Women between 25 and 39 years old established 87.3% of new maternity claims while women aged 24 years old and younger represented 9.1% of new claims. While the number of new claims established by mothers aged 24 years old and under and by mothers between 25 and 39 years old dropped compared to the previous year, the number for mothers aged 40 years and older reported an increase.
Despite the observed decrease in the number of maternity claims established, the amount paid in EI maternity benefits increased by 2.4% from the previous year to $1.1 billion in FY1617. All provinces and territories, except Prince Edward Island, Nova Scotia and Manitoba, recorded greater amounts paid compared to the previous year.
| Number of claims | Amount paid ($ millions) | |||||
|---|---|---|---|---|---|---|
| 2015/2016 | 2016/2017 | Change (%) | 2015/2016 | 2016/2017 | Change (%) | |
| Province or territory | ||||||
| Newfoundland and Labrador | 2,970 | 2,750 | -7.4% | $17.7 | $18.5 | +4.1% |
| Prince Edward Island | 1,050 | 1,030 | -1.9% | $6.5 | $6.2 | -3.6% |
| Nova Scotia | 5,680 | 5,000 | -12.0% | $33.1 | $32.0 | -3.6% |
| New Brunswick | 4,410 | 4,130 | -6.3% | $25.6 | $27.9 | +9.0% |
| Quebec | ─ | ─ | ─ | ─ | ─ | ─ |
| Ontario | 84,190 | 83,770 | -0.5% | $542.6 | $556.9 | +2.6% |
| Manitoba | 8,870 | 8,150 | -8.1% | $53.1 | $51.5 | -3.1% |
| Saskatchewan | 8,330 | 7,760 | -6.8% | $52.3 | $53.0 | +1.3% |
| Alberta | 31,860 | 30,580 | -4.0% | $209.5 | $212.9 | +1.6% |
| British Columbia | 26,300 | 26,340 | +0.2% | $165.2 | $172.6 | +4.5% |
| Yukon | 290 | 280 | -3.4% | $1.9 | $2.0 | +7.2% |
| Northwest Territories | 360 | 320 | -11.1% | $2.1 | $2.5 | +19.3% |
| Nunavut | 200 | 220 | +10.0% | $1.3 | $1.3 | +3.0% |
| Age Category | ||||||
| 24 years old and under | 16,990 | 15,470 | -8.9% | $81.9 | $77.4 | -5.5% |
| 25 to 39 years old | 151,630 | 148,720 | -1.9% | $988.3 | $1,017.9 | +3.0% |
| 40 years old and over | 5,890 | 6,140 | +4.2% | $40.6 | $41.9 | +3.1% |
| Canada | 174,510 | 170,330 | -2.4% | $1,110.9 | $1,137.3 | +2.4% |
- Note: Data may not add up to the total due to rounding. Percentage change is based on unrounded numbers. Includes claims for which at least $1 of EI maternity benefits was paid.
- Source: Employment and Social Development Canada, Employment Insurance (EI) administrative data. Data are based on a 10% sample of EI administrative data.
Women between 25 and 39 years old received 89.5% of the total amount paid in maternity benefits, while women aged 24 years old and younger and those aged 40 years and older received 6.8% and 3.7% of the total amount paid, respectively.
Maternity benefits are frequently combined in the same claim with other types of benefits, particularly parental and sickness benefits, with 98.4% of all EI maternity claims completed during the reporting fiscal year including some other type of EI benefits (see subsection 2.1.2 Combined Employment Insurance claims).
The average weekly maternity benefit rate increased by 2.3% to $447. A little less than half (49.4%) of claimants received the maximum weekly benefit rate. On average, the highest weekly maternity benefit rate was for claims established in the Northwest Territories ($499) and the Yukon ($493), and by mothers aged 40 years old and over ($475).
Employment Insurance parental benefits, amount paid and level of benefits
Over FY1617, almost 196,000 new EI parental claims were established, which represented a slight dip of 0.4% from the previous year (see Table 47). Less than 1.0% of these parental claims came from adoptive parents (about 1,800). The number of new claims dropped in almost all provinces and territories, except Ontario and British Columbia.
Although women established the vast majority of parental claims (85.0%), their number fell by 2.1% compared to the previous year. Conversely, the number of parental claims established by men grew 10.5%.
As in the past, individuals aged between 25 and 39 years old established the largest share of new parental claims (86.1%), while those aged 24 years old and younger and 40 years and older represented 8.1% and 5.8% of new claims respectively.
The total amount paid in parental benefits jumped by 2.3% compared to the previous year, totaling $2.7 billion for the reporting period. At the provincial and territorial levels, only Prince Edward Island and Nunavut observed a decrease in their respective amounts paid in parental benefits.
As with new claims, the majority of the total amount of parental benefits was paid to women (91.4%). Men and women experienced an annual increase in their total amount paid in parental benefits—by 9.5% and 1.7%, respectively. Claimants aged between 25 and 39 years old received the greatest share of paid benefits (88.3%), while claimants aged 24 years old and under and those aged 40 years old and over received 6.6% and 5.1% of the total amount paid respectively.
The average weekly parental benefit rate reached $457, a 2.4% increase in comparison to the previous year. More than half (53.3%) of claimants received the maximum weekly benefit rate. On average, the weekly benefit rate was higher for claims established in the Northwest Territories ($513), by men ($503) and by claimants aged 40 years old and over ($489).
| Number of claims | Amount paid ($ millions) | |||||
|---|---|---|---|---|---|---|
| 2015/2016 | 2016/2017 | Change (%) | 2015/2016 | 2016/2017 | Change (%) | |
| Province or territory | ||||||
| Newfoundland and Labrador | 2,960 | 2,930 | -1.0% | $39.9 | $42.0 | +5.3% |
| Prince Edward Island | 1,140 | 1,130 | -0.9% | $15.4 | $14.4 | -6.8% |
| Nova Scotia | 6,470 | 5,970 | -7.7% | $77.0 | $79.4 | +3.0% |
| New Brunswick | 4,940 | 4,580 | -7.3% | $61.8 | $62.5 | +1.2% |
| Quebec | ─ | ─ | ─ | ─ | ─ | ─ |
| Ontario | 96,390 | 98,370 | +2.1% | $1,297.7 | $1,328.0 | +2.3% |
| Manitoba | 9,970 | 9,440 | -5.3% | $125.0 | $126.1 | +0.9% |
| Saskatchewan | 9,140 | 8,720 | -4.6% | $121.1 | $127.8 | +5.5% |
| Alberta | 34,830 | 33,480 | -3.9% | $497.7 | $501.7 | +0.8% |
| British Columbia | 29,670 | 30,340 | +2.3% | $395.9 | $409.5 | +3.4% |
| Yukon | 340 | 330 | -2.9% | $3.4 | $4.2 | +22.3% |
| Northwest Territories | 480 | 390 | -18.8% | $4.6 | $6.6 | +43.3% |
| Nunavut | 330 | 280 | -15.2% | $3.9 | $2.8 | -29.0% |
| Gender | ||||||
| Men | 26,690 | 29,490 | +10.5% | $213.5 | $233.7 | +9.5% |
| Women | 169,970 | 166,470 | -2.1% | $2,430.0 | $2,471.4 | +1.7% |
| Age category | ||||||
| 24 years old and under | 17,030 | 15,840 | -7.0% | $191.9 | $177.8 | -7.3% |
| 25 to 39 years old | 168,720 | 168,670 | 0.0% | $2,316.5 | $2,389.0 | +3.1% |
| 40 years old and over | 10,910 | 11,450 | +4.9% | $135.1 | $138.3 | +2.3% |
| Canada | 196,660 | 195,960 | -0.4% | $2,643.5 | $2,705.1 | +2.3% |
- Note: Data may not add up to the total due to rounding. Percentage change is based on unrounded numbers. Includes claims for which at least $1 of EI parental benefits was paid.
- Source: Employment and Social Development Canada, Employment Insurance (EI) administrative data. Data are based on a 10% sample of EI administrative data.
DurationFootnote 103 of Employment Insurance maternity and parental benefits
As observed during previous fiscal years, claimants used almost all of the EI maternity and parental weeks to which they were entitled. For the vast majority (91.5%) of maternity claims completed over FY1617, mothers received benefits during the 15 weeks available to them. The average duration of completed maternity claims remained at 14.6 weeks.
Methodological note: Change made to the method of calculating the duration of special benefit claims *
In the FY1516 Employment Insurance Monitoring and Assessment Report, statistics on the duration of special benefits were calculated using various periods to produce the most accurate statistics possible. For example, statistics on the actual duration of maternity, parental, and sickness benefits were based on the claims established over the first two quarters of the fiscal year. This ensured that data was based on as many completed claims as possible.
A new method of calculating the duration of special benefits based on claims completed during the fiscal year was adopted in this year’s Employment Insurance Monitoring and Assessment Report. Analyses done with this new method show more precise estimations of the actual duration than the method using only claims established during the first two quarters. Moreover, the new method better reflects the EI program changes that could impact the duration of special benefit claims.
Statistics on the proportion of claims for special benefits that used the maximum number of weeks were already calculated using completed claims in the FY1516 Employment Insurance Monitoring and Assessment Report. This calculation method based on completed claims continues to be used in this year’s report.
* Except EI PCIC benefits. Claims for this type of benefit are processed manually. Therefore, information concerning the completed claims is not available.
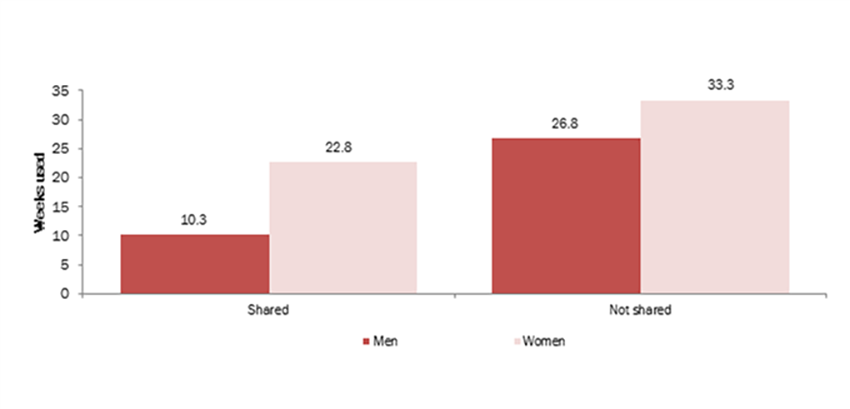
In the case of parental claims, eligible parents can choose to share the 35 weeks of benefits available. Statistics on parental claims completed during the reporting period show that when weeks of benefits were shared, women received an average of 22.8 weeks, whereas men received 10.3 weeks (see Chart 37). The average duration of parental claims on a family basis was 33.1 weeks for parents who decided to share the benefits. For parents who did not share the available weeks of benefits, the average duration of parental benefits was 32.9 weeks for claims that were completed in FY1617.
Show data table
| 2016/2017 | |
|---|---|
| Men (shared) | 10.3 |
| Women (shared) | 22.8 |
| Men (non-shared) | 26.8 |
| Women (non-shared) | 33.3 |
- Source: Employment and Social Development Canada, Employment Insurance (EI) administrative data. Data are based on a 10% sample of EI administrative data.
Based on completed claims, the combined number of weeks of EI maternity and parental benefits used by families was an average of 47.6 weeks on a family basis or 95.2% of the 50 weeks of maternity and parental benefits to which they were entitled (See Table 48). Of these 47.6 weeks, 33.0 were paid in parental benefits and 14.6 were paid in maternity benefits.
Low-income claimants receiving the Family Supplement collected an average of 47.7 weeks of maternity and parental benefits for completed claims over the reporting fiscal year. These claimants received an average of 33.0 weeks of parental benefits and 14.7 weeks of maternity benefits (See subsection 2.1.1 for more information on the Family Supplement).
| 2012/2013 r | 2013/2014 r | 2014/2015 r | 2015/2016 r | 2016/2017 p | |
|---|---|---|---|---|---|
| Maternity | 14.6 | 14.6 | 14.6 | 14.6 | 14.6 |
| Parental, per family | |||||
| Shared | 33.7 | 32.9 | 33.5 | 33.2 | 33.1 |
| Not shared | 32.8 | 32.9 | 33.0 | 32.9 | 32.9 |
| Combined maternity and parental benefits, per family (Share of total entitlement used) |
47.6 (95.1%) |
47.5 (95.0%) |
47.7 (95.4%) |
47.6 (95.1%) |
47.6 (95.2%) |
- Note: Completed claims include those that are terminated and those that are dormant and remained inactive as of August the following fiscal year. Shares of entitlement used are based on unrounded numbers.
- P Preliminary estimates.
- r Data revised on account of the new duration calculation method based on claims completed during the fiscal year.
- Source: Employment and Social Development Canada, Employment Insurance (EI) administrative data. Data are based on a 10% sample of EI administrative data.
6.3 Employment Insurance sickness benefits
EI sickness benefits are paid over a maximum period of 15 weeks to qualified people who are unable to work because of illness, injury or quarantine, but would otherwise be available to work. The exact maximum duration of benefits to which a sickness claimant is entitled depends on the recommendations from their physician or an approved medical practitioner. With job protection through the Canada Labour Code and the provincial and territorial statutes under labour law, EI sickness benefits allow claimants to recover while conserving their attachment to the labour market.
To be eligible for EI sickness benefits, claimants need to meet the eligibility requirements for EI special benefits in terms of hours of insurable employment or earnings (see section 2.6 Employment Insurance special benefits) and provide the Commission with a medical certificate signed by an attending doctor or approved medical practitioner.
For the purpose of this section, EI sickness claims refer to claims for which at least one dollar of sickness benefits was paid.
Premium Reduction Program
Employers who offer short-term disability plans to their employees that are at least equivalent to the EI sickness benefits and that meet certain requirements stipulated in the Employment Insurance Act and Employment Insurance Regulations can register their plans with the Employment Insurance Commission to obtain a lower EI premium rate than the regular employer rate through the Premium Reduction Program (PRP).
More information on the effect on premiums and number of firms affected can found in section 2.7 Employment Insurance financial information.
Employment Insurance sickness claims, amount paid and level of benefits
Over FY1617, there were 378,700 new sickness claims established, which represented a 3.6% hike over the previous year and the fourth consecutive annual increase. The number of sickness claims established went up in British Columbia and provinces in central and eastern Canada, except Newfoundland and Labrador, while the number of claims decreased in the Prairies and in the Northwest Territories (see Table 49).
| Number of claims | Amount paid ($ millions) | |||||
|---|---|---|---|---|---|---|
| 2015/2016 | 2016/2017 | Change (%) | 2015/2016 | 2016/2017 | Change (%) | |
| Province or territory | ||||||
| Newfoundland and Labrador | 10,170 | 10,140 | -0.3% | $43.0 | $45.1 | +4.8% |
| Prince Edward Island | 5,780 | 6,000 | +3.8% | $17.3 | $20.2 | +16.2% |
| Nova Scotia | 18,500 | 19,070 | +3.1% | $65.8 | $74.0 | +12.4% |
| New Brunswick | 22,800 | 24,830 | +8.9% | $74.3 | $92.7 | +24.8% |
| Quebec | 111,420 | 119,210 | +7.0% | $400.0 | $428.8 | +7.2% |
| Ontario | 99,060 | 105,010 | +6.0% | $424.3 | $461.8 | +8.8% |
| Manitoba | 10,590 | 9,970 | -5.9% | $44.9 | $43.7 | -2.7% |
| Saskatchewan | 7,640 | 7,060 | -7.6% | $33.6 | $35.4 | +5.3% |
| Alberta | 29,240 | 26,520 | -9.3% | $136.1 | $138.2 | +1.6% |
| British Columbia | 49,490 | 50,170 | +1.4% | $212.9 | $223.9 | +5.2% |
| Yukon | 430 | 420 | -2.3% | $1.8 | $2.1 | +14.2% |
| Northwest Territories | 250 | 200 | -20.0% | $1.3 | $0.9 | -29.6% |
| Nunavut | 110 | 100 | -9.1% | $0.5 | $0.7 | +33.1% |
| Gender | ||||||
| Men | 160,580 | 163,870 | +2.0% | $684.5 | $745.5 | +8.9% |
| Women | 204,900 | 214,830 | +4.8% | $771.5 | $821.9 | +6.5% |
| Age category | ||||||
| 24 years old and under | 27,730 | 28,710 | +3.5% | $81.9 | $91.5 | +11.7% |
| 25 to 44 years old | 151,890 | 156,530 | +3.1% | $592.1 | $635.0 | +7.3% |
| 45 to 54 years old | 89,420 | 90,600 | +1.3% | $375.7 | $396.9 | +5.6% |
| 55 years old and over | 96,440 | 102,860 | +6.7% | $406.3 | $444.0 | +9.3% |
| Canada | 365,480 | 378,700 | +3.6% | $1,456.0 | $1,567.4 | +7.7% |
- Note: Data may not add up to the total due to rounding. Percentage change is based on unrounded numbers. Includes claims for which at least $1 of EI sickness benefits was paid.
- Source: Employment and Social Development Canada, Employment Insurance (EI) administrative data. Data are based on a 10% sample of EI administrative data.
A larger share of new EI sickness claims were established by women (56.7%) than men (43.3%). However, both men and women recorded annual increases in the number of sickness claims of +2.0% and +4.8%, respectively.
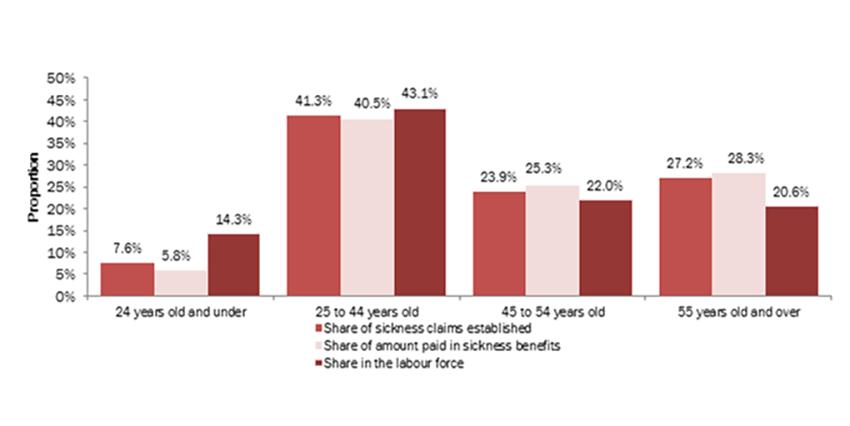
By age, claimants aged 55 years old and over established 27.2% of new sickness claims, which is a bit higher than their representation in the Canadian labour force in FY1617 (20.6%).Footnote 104 Claimants aged 24 years old and under represented 7.6% of established sickness claims while they formed 14.3% of the labour force in Canada (see Chart 38). In comparison to the year before, claimants of all age groups experienced a boost in the number of claims, but the biggest hike was observed among claimants aged 55 years old and over.
Show data table
| Share of sickness claims established | Share of amount paid in sickness benefits | Share in the labour force | |
|---|---|---|---|
| 24 years old and under | 7.6% | 5.8% | 14.3% |
| 25 to 44 years old | 41.3% | 40.5% | 43.1% |
| 45 to 54 years old | 23.9% | 25.3% | 22.0% |
| 55 years old and over | 27.2% | 28.3% | 20.6% |
- Note: Includes claims for which at least $1 of EI sickness benefits was paid.
- Sources: Employment and Social Development Canada, Employment Insurance (EI) administrative data. Data are based on a 10% sample of EI administrative data. Statistics Canada, Labour Force Survey, CANSIM table 282-0001.
The total amount paid in sickness benefits went up 7.7% compared to the previous year to $1.6 billion during the reporting period. The majority of provinces and territories, with the exception of Manitoba and the Northwest Territories, recorded an increase in their total amount paid in sickness benefits (see Table 49).
While women received a slighter larger share of the amount paid in sickness benefits than men, 52.4% compared to 47.6%, men experienced a bigger annual increase in the amount received than women, +8.9% versus +6.5%.
As with new claims, claimants aged 55 years and older received a larger share of the total amount of payments for sickness benefits (28.3%) than their weight in the labour force (20.6%), while claimants aged 24 years old and younger received a smaller share (5.8%) compared to their presence in labour force (14.3%) (see Chart 38). All age groups reported a hike in the total amount of sickness benefits received compared to the previous year.
| Employment ’000s (Percentage share) |
Number of claims ’000s (Percentage share) |
Amount paid ($ millions) (Percentage share) |
|
|---|---|---|---|
| Goods-producing industries | 3,823.1 (21.1%) |
96.9 (25.6%) |
$435.0 (27.8%) |
| Agriculture, forestry, fishing, hunting, mining and oil and gas extraction | 610.3 (3.4%) |
17.2 (4.5%) |
$68.0 (4.3%) |
| Utilities | 137.0 (0.8%) |
0.4 (0.1%) |
$1.6 (0.1%) |
| Construction | 1,389.9 (7.7%) |
35.5 (9.4%) |
$179.6 (11.5%) |
| Manufacturing | 1,685.9 (9.3%) |
43.9 (11.6%) |
$185.8 (11.9%) |
| Services-producing industries | 14,330.2 (78.9%) |
262.4 (69.3%) |
$1,066.1 (68.0%) |
| Wholesale and retail trade | 2,756.2 (15.2%) |
59.3 (15.7%) |
$220.4 (14.1%) |
| Transportation and warehousing | 913.1 (5.0%) |
20.1 (5.3%) |
$94.1 (6.0%) |
| Finance, insurance, real estate, rental and leasing | 1,141.4 (6.3%) |
11.9 (3.2%) |
$51.4 (3.3%) |
| Professional, scientific and technical services | 1,398.8 (7.7%) |
9.8 (2.6%) |
$42.1 (2.7%) |
| Business, building and other support services* | 767.0 (4.2%) |
29.2 (7.7%) |
$118.7 (7.6%) |
| Educational services | 1,274.8 (7.0%) |
10.9 (2.9%) |
$39.7 (2.5%) |
| Health care and social assistance | 2,346.7 (12.9%) |
44.9 (11.8%) |
$192.9 (12.3%) |
| Information, culture and recreation** | 788.6 (4.3%) |
7.5 (2.0%) |
$28.5 (1.8%) |
| Accommodation and food services | 1,218.5 (6.7%) |
27.7 (7.3%) |
$87.5 (5.6%) |
| Other services (excluding public administration) | 781.7 (4.3%) |
16.2 (4.3%) |
$67.5 (4.3%) |
| Public administration | 943.4 (5.2%) |
25.1 (6.6%) |
$123.2 (7.9%) |
| Unclassified | N/A | 19.4 (5.1%) |
$66.3 (4.2%) |
| Canada | 18,153.4 (100.0%) |
378.7 (100.0%) |
$1,567.4 (100.0%) |
- Note: Data may not add up to the total due to rounding. Percentage shares are based on unrounded numbers. Includes claims for which at least $1 of EI sickness benefits was paid.
- * Includes management of companies and enterprises and administrative and support, waste management and remediation services.
- ** Includes information and cultural industries and arts, entertainment and recreation industries.
- Sources: Employment and Social Development Canada, Employment Insurance (EI) administrative data. Data are based on a 10% sample of EI administrative data. Statistics Canada, Labour Force Survey, CANSIM table 282-0007 (for employment).
By industry, the goods-producing industries were overrepresented among EI sickness claims and total benefits paid as they accounted for 25.6% of new EI sickness claims and 27.8% of sickness benefits paid while they represented 21.1% of workers (see Table 50). In contrast, workers from the services-producing industries were underrepresented among EI sickness claims and EI sickness benefits paid, with some exceptions at the industry-level (for example, Business, building and other support services).
The average weekly sickness benefit rate was $417, a 1.8% increase compared to the previous year. Almost a third (33.1%) of claimants received the maximum weekly benefit rate, which represented a decrease of 1.3 percentage points compared to the previous year. On average, the highest weekly sickness benefit rate was paid for claims established in the Northwest Territories ($517), by men ($455), and by claimants aged between 45 and 54 years old ($428).
DurationFootnote 105 of Employment Insurance sickness benefits
A maximum of 15 weeks of EI sickness benefits may be paid to qualified individuals because of illness, injury or quarantine, though this number could be less depending on their physician’s recommendation.
The actual average duration of sickness benefits completed during the reporting period was 9.8 weeks. On average, men and women received 9.5 and 10.1 weeks of sickness benefits respectively for completed claims.
As in previous years, the average number of weeks of sickness benefits paid increased with the age of claimants. In fact, claimants aged 24 years old and younger experienced, on average, the shortest duration (8.9 weeks of benefits), while claimants aged 55 years and older registered, on average, the longest duration (10.5 weeks of benefits) among completed EI sickness claims.
| 2012/2013 r | 2013/2014 r | 2014/2015 r | 2015/2016 r | 2016/2017 p | |
|---|---|---|---|---|---|
| 24 years old and under | 23.3% | 25.3% | 29.4% | 27.0% | 27.7% |
| 25 to 44 years old | 30.9% | 31.9% | 32.6% | 32.8% | 31.7% |
| 44 to 54 years old | 37.2% | 38.8% | 38.2% | 37.6% | 38.3% |
| 55 years old and over | 39.8% | 41.7% | 41.7% | 41.9% | 42.0% |
| Canada | 34.1% | 35.6% | 36.1% | 35.9% | 35.7% |
- Note: Includes all claims for which at least $1 in EI sickness benefits was paid. Completed claims include those that are terminated and those that are dormant and remained inactive as of August the following fiscal year.
- p Preliminary data.
- r Revised data.
- Source: Employment and Social Development Canada, Employment Insurance (EI) administrative data. Data are based on a 10% sample of EI administrative data.
A little more than a third (35.7%) of completed sickness claims had used the maximum number of 15 weeks of sickness benefitsFootnote 106, which is a similar proportion as the year before (see Table 51). Women (37.3%) were more likely to use the maximum number of weeks than men (33.7%).
As observed for the average duration of benefits, the use of all 15 weeks of benefits available also appears to be correlated with the age of claimants. In total, the share of completed sickness claims that used all 15 eligible weeks was 27.7% for claimants aged 24 years old and younger, and climbed to 42.0% for claimants aged 55 years and older (see Table 51).
6.4 Employment Insurance compassionate care benefits
EI compassionate care benefitsFootnote 107 offer temporary income support for up to 26 weeksFootnote 108 to eligible claimants who need to take time away from work to provide care or support to family members who have a serious medical condition with a significant risk of death within 26 weeks.Footnote 109 The benefits may be paid to one family member or shared between family members, and only one family member needs to serve the waiting period.
To be eligible for EI compassionate care benefits, claimants need to meet the eligibility requirements for EI special benefits in terms of hours of insurable of employment or earnings (see section 2.6 Employment Insurance special benefits) and must submit a medical certificate issued by the family member’s medical doctorFootnote 110 to the Commission.
For the purpose of this section, EI compassionate care claims refer to claims for which at least one dollar of compassionate care benefits was paid.
Compassionate care recipients
Family members for whom claimants can claim EI compassionate care benefits include, but are not limited to, the following individuals: spouse, including common-law partner; child or child of the claimant’s spouse; parent or the spouse of the claimant’s parent; other family members (such as siblings, step-siblings, grandparents, grandchildren, nieces, nephews and in-laws); and any other individual considered as a close relative, whether or not he or she is related by blood, adoption, marriage or common-law partnership.
A supplemental studyFootnote 111 using data on compassionate care applicants during FY1516 showed that 58.1% of people filed a claim to take care of a parent, 27.5% a common-law partner or spouse, 4.3% a brother or sister, 3.5% a child, and 6.6% another type of recipient. According to the same study, the number of compassionate care claims increased with the care recipient’s age. In 16.9% of cases, applicants who filed a claim did so to take care of a recipient aged between 18 and 54 years old, while in 34.8% of cases, applicants wanted to take care of a recipient aged 75 years and older.
Employment Insurance compassionate care claims, amount paid and level of benefits
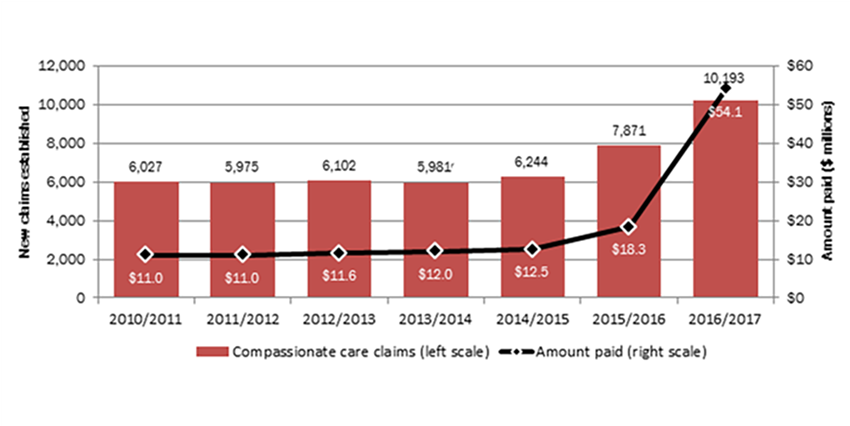
The total number of new claims established for EI compassionate care benefits grew by 29.5% compared with the previous year, to 10,200 in FY1617. This is the second consecutive substantial annual increase as the number of claims went up by 26.1% the year before (see Chart 39). This is in part due to the increase in maximum entitlement, which went from 6 to 26 weeks in January 2016. This increase might make periods of interrupted employment for caregiving responsibilities less of a financial burden than the shorter entitlement of six weeks.
Show data table
| 2010/2011 | 2011/2012 | 2012/2013 | 2013/2014 | 2014/2015 | 2015/2016 | 2016/2017 | |
|---|---|---|---|---|---|---|---|
| Compassionate care claims (left scale) | 6,027 | 5,975 | 6,102 | 5,981 r | 6,244 | 7,871 | 10,193 |
| Amount paid (right scale) ($ millions) | $11.0 | $11.0 | $11.6 | $12.0 | $12.5 | $18.3 | $54.1 |
- Note: Includes claims for which at least $1 of EI compassionate care benefits was paid.
- r Revised data.
- Source: Employment and Social Development Canada, Employment Insurance (EI) administrative data. Data are based on a 100% sample of EI administrative data.
The number of new compassionate care claims went up in all regions with the largest percentage changes having been registered in the Territories (+75.0%) and Nova Scotia (+51.0) (see Table 52).
| Number of claims | Amount paid ($ millions) | |||||
|---|---|---|---|---|---|---|
| 2015/2016 | 2016/2017 | Change (%) | 2015/2016 | 2016/2017 | Change (%) | |
| Region | ||||||
| Newfoundland and Labrador | 92 | 106 | +15.2% | $0.2 | $0.6 | +176.5% |
| Prince Edward Island | 51 | 55 | +7.8% | $0.1 | $0.3 | +182.7% |
| Nova Scotia | 243 | 367 | +51.0% | $0.6 | $2.1 | +277.8% |
| New Brunswick | 205 | 245 | +19.5% | $0.5 | $1.4 | +220.9% |
| Quebec | 1,319 | 1,759 | +33.4% | $2.8 | $7.7 | +170.8% |
| Ontario | 3,465 | 4,452 | +28.5% | $8.0 | $23.0 | +189.1% |
| Manitoba | 297 | 391 | +31.6% | $0.7 | $2.2 | +198.3% |
| Saskatchewan | 200 | 258 | +29.0% | $0.5 | $1.7 | +230.0% |
| Alberta | 741 | 1,002 | +35.2% | $2.0 | $6.1 | +209.6% |
| British Columbia | 1,238 | 1,523 | +23.0% | $2.9 | $8.8 | +201.5% |
| Territories | 20 | 35 | +75.0% | $0.1 | $0.2 | +251.1% |
| Gender | ||||||
| Men | 2,260 | 2,812 | +24.4% | $5.9 | $16.8 | +186.1% |
| Women | 5,611 | 7,381 | +31.5% | $12.4 | $37.3 | +199.8% |
| Age category | ||||||
| 24 years old and under | 138 | 176 | +27.5% | $0.3 | $0.7 | +190.5% |
| 25 to 44 years old | 2,450 r | 3,259 | +33.0% | $5.8 r | $17.0 | +194.0% |
| 45 to 54 years old | 2,758 r | 3,461 | +25.5% | $6.4 r | $18.5 | +187.2% |
| 55 years old and over | 2,525 | 3,297 | +30.6% | $5.9 | $17.9 | +206.0% |
| Canada | 7,871 | 10,193 | +29.5% | $18.3 | $54.1 | +195.4% |
- Note: Data may not add up to the total due to rounding. Percentage change is based on unrounded numbers. Includes claims for which at least $1 of EI compassionate care benefits was paid.
- r Revised data.
- Source: Employment and Social Development Canada, Employment Insurance (EI) administrative data. Data are based on a 100% sample of EI administrative data.
As in the past, women established the majority of compassionate care claims (72.4%). There was an annual increase in new claims of 24.4% for men and 31.5% for women.
By age group, individuals aged between 25 and 44 years old had established a smaller share of compassionate care claims (32.0%) than their relative weight in the Canadian labour forceFootnote 112 (43.1%). Conversely, people aged between 45 and 54 years old and those aged 55 years and older had established a larger share of claims for compassionate care benefits (34.0% and 32.3% respectively) than their presence in the Canadian labour force (22.0% and 20.6% respectively).
The total amount paid in compassionate care benefits almost tripled compared to the previous fiscal year, registering a growth of 195.4% to $54.1 million for the reporting period. This hike is partly due to the increased number of new claims established for compassionate care benefits and the extended maximum duration, effective since January 3, 2016, of benefits payable and of the benefit period within which benefits can be received. Therefore, the new compassionate care claims established during the reporting fiscal year were eligible to receive a higher maximum number of weeks of benefits than most claims established during the previous fiscal year (FY1516). Moreover, the FY1516 claims established on or after January 3, 2016, as well as those established before January 3, 2016, with an open benefit window when the extension was implemented, could have also received a higher number of weeks of compassionate care benefits and a longer benefit period, and consequently could have been extended in the reporting fiscal year.
The amounts paid in compassionate care benefits went up in all regions. The majority of the total amount of compassionate care benefits was paid to women (68.9%). Men and women experienced an annual increase in their amounts received for compassionate care benefits, +186.1% and +199.8% respectively.
As with new claims, claimants aged between 25 and 44 years old received a smaller share of the amounts paid in compassionate care benefits than their demographic weight in the Canadian labour force: 31.4% of all benefits paid versus 43.1% of the labour force. Conversely, claimants aged between 45 and 54 years old and those aged 55 years old and over received 34.1% and 33.1% of the total amount of payments for compassionate care benefits, while they represent 22.0% and 20.6% of the labour force respectively. All age groups recorded a hike in the amounts received compared to the previous year.
The average weekly benefit rate for compassionate care benefits grew by 2.4% to $444. A little less than half (43.6%) of claimants received the maximum weekly benefit rate. On average, the highest weekly benefit rate for compassionate care benefits was paid for claims established in the Territories ($498), by men ($478), and by claimants aged between 25 and 44 years old ($457).
There were around 650 claims established during the reporting period for which the weeks of benefits were shared among qualifying family members, which represented 6.4% claims. This is an increase compared to the previous year, when 3.7% of claims were shared between family members.
DurationFootnote 113 of Employment Insurance compassionate care benefits
Since January 3, 2016, the number of weeks of compassionate care benefits that may be paid to qualified claimants was raised to 26 weeks per claim. This represents a sizeable increase from the previous six weeks of entitlement. The weeks of benefits can be shared with other family members if they are also entitled to these benefits.
The average duration of EI compassionate care claims completed during FY1617 was 9.7 weeks. This is an increase of 4.9 weeks in comparison to the previous year, which can be attributed to the growth in the maximum number of weeks of compassionate care benefits available since January 3, 2016 (see Table 53). The average duration of compassionate care claims completed during FY1516 remained similar to those of previous fiscal years even if several claims established at the end of the period could have received six weeks or more of benefits. This is explained by the methodological change in calculating statistics on duration, which is now based on completed claims. Several claims established during FY1516 entitled to up to 26 weeks of benefits were extended and completed over the next fiscal year and are therefore not included in the calculation of the duration of completed claims over FY1516.
Men and women received, on average, a similar number of weeks of compassionate care benefits for claims completed during FY1617 (about 9.7 weeks). Claimants aged 24 years old and under, between 25 and 44 years old, and between 45 and 54 years old received, on average, close to 9.4 weeks of compassionate care benefits for completed claims, while claimants aged 55 years and over received an average of 10.4 weeks.
Among completed compassionate care claims, 64.0% used six weeks of benefits or more. This proportion, which is slightly higher than those recorded over previous years (see Table 53), appears to show that despite an increase in the maximum number of weeks of compassionate care benefits available, a large share of claims did not receive any extra available weeks, which may in part be due to the death of a care recipient. In total, 13.4% of completed compassionate care claims received the maximum number of 26 weeks of benefits.
| 2012/2013 r | 2013/2014 r | 2014/2015 r | 2015/2016 r | 2016/2017 p | |
|---|---|---|---|---|---|
| Share in percentage of compassionate care claims using six weeks of benefits or more | 58.7% | 58.6% | 58.5% | 54.2% | 64.0% |
| Average duration | 4.8 | 4.7 | 4.7 | 4.8 | 9.7 |
- Note: Includes claims for which at least $1 of EI compassionate care benefits was paid. Completed claims include those that are terminated and those that are dormant and remained inactive as of August the following fiscal year
- p Preliminary data.
- r Data revised to take into account the new duration calculation method, which is based on completed claims during the fiscal year.
- Source: Employment and Social Development Canada, Employment Insurance (EI) administrative data. Data are based on a 100% sample of EI administrative data.
A recent studyFootnote 114 updating research results on the use and duration of compassionate care benefits confirmed that the death of a care recipient is one of the main reasons for not receiving or claiming the maximum number of weeks of benefits. Moreover, claimants who took care of their spouse or lived with the care recipient are most likely to use the entire benefit entitlement.
A similar proportion of men and women used six weeks or more of compassionate care benefits among the claims completed during the reporting fiscal year. However, claimants aged 55 years and over were more likely to receive six weeks or more of compassionate care benefits (68.2%) than claimants aged 24 years old and under (56.4%).
6.5 Parents of Critically Ill Children benefits
Parents of Critically Ill Children (PCIC) benefitsFootnote 115 offer temporary income support for a maximum period of 35 weeks to eligible workers and self-employed persons who take a leave from work to provide care for or support to a critically ill or injured child. Benefits can be shared between parents, who may receive them simultaneously or separately, up to the maximum number of weeks of eligibility.
To receive PCIC benefits, claimants need to meet the eligibility requirements for EI special benefits in terms of hours of insurable employment or earnings (see section 2.6 Employment Insurance special benefits) and must be able to demonstrate that they are the parent of a child who is critically ill or injuredFootnote 116, demonstrate that their child is under 18 years of age at the time the 52-week benefit window is opened, and provide a signed medical certificate by a specialist medical doctor.Footnote 117 To be considered critically ill, a child’s life must be at risk as a result of illness or injury, there must have been a significant change in the child’s baseline state of health and the child must require the care or support of his/her parent(s).
For the purpose of this section, PCIC claims refers to claims for which at least one dollar of PCIC benefits was paid.
Employment Insurance Parents of Critically Ill Children claims, amount paid, and level of benefits
Over FY1617, there were close to 4,200 new PCIC claims established, which represented a 12.6% increase compared to the previous year (see Chart 40). More PCIC claims were established by women (80.6%) than men (19.4%). Yet, men and women alike recorded an annual increase in the number of new claims, +8.9% and +13.5% respectively (see Table 54).
By age, claimants aged between 25 and 44 years old established the largest share of new PCIC claims (88.8%), while those aged 24 years old and under and those aged 45 years old and over represented 5.3% and 5.9% of new claims respectively.
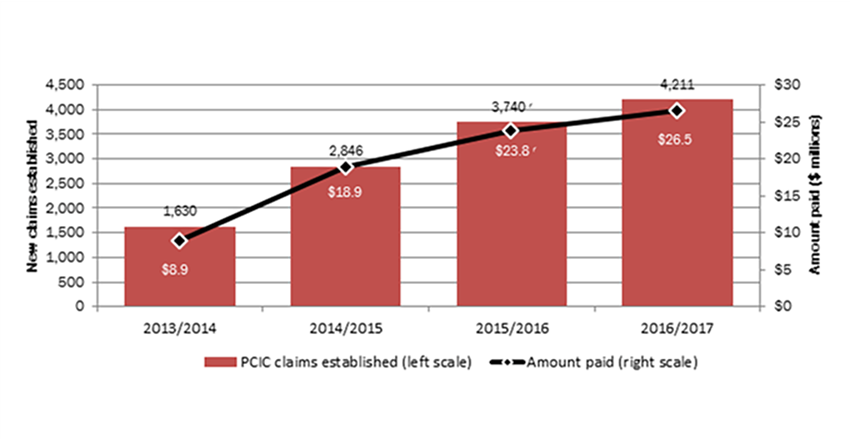
Show data table
| 2013/2014 | 2014/2015 | 2015/2016 | 2016/2017 | |
|---|---|---|---|---|
| PCIC claims established (left scale) | 1,630 | 2,846 | 3,740 r | 4,211 |
| Amount paid (right scale) ($ millions) | $8.9 | $18.9 | $23.8 r | $26.5 |
- Note: Includes claims for which at least $1 of EI PCIC benefits was paid.
- r Revised data.
- Source: Employment and Social Development Canada, Employment Insurance (EI) administrative data. Data are based on a 100% sample of EI administrative data.
The amount paid in PCIC benefits reached $26.5 million during the reporting period, which is an increase of 11.3% compared to the previous fiscal year. As with established claims, women received most of the benefits paid (80.1%), while by age, claimants aged between 25 and 44 years old received the majority of benefits paid for this type of benefit (87.9%).
| Number of claims | Amount paid ($ millions) | |||||
|---|---|---|---|---|---|---|
| 2015/2016 r | 2016/2017 | Change (%) | 2015/2016 r | 2016/2017 | Change (%) | |
| Gender | ||||||
| Men | 751 | 818 | +8.9% | $5.2 | $5.3 | +0.6% |
| Women | 2,989 | 3,393 | +13.5% | $18.6 | $21.2 | +14.3% |
| Age category | ||||||
| 24 years old and under | 216 | 222 | +2.8% | $1.1 | $1.1 | -2.9% |
| 25 to 44 years old | 3,276 | 3,740 | +14.2% | $20.5 | $23.3 | +13.2% |
| 45 to 54 years old | 226 | 229 | +1.3% | $2.0 | $2.0 | +1.3% |
| 55 years old and over | 22 | 20 | -9.1% | $0.1 | $0.1 | -13.3% |
| Canada | 3,740 | 4,211 | +12.6% | $23.8 | $26.5 | +11.3% |
- Note: Data may not add up to the total due to rounding. Percentage change is based on unrounded numbers. Includes claims for which at least $1 of EI PCIC benefits was paid.
- r Revised data.
- Source: Employment and Social Development Canada, Employment Insurance (EI) administrative data. Data are based on a 100% sample of EI administrative data.
For the reporting fiscal year, the average weekly PCIC benefit rate was $447, which represents a growth of 1.5% compared to the previous year. On average, the highest weekly PCIC benefit rate was paid for claims established by men ($481) and for claimants aged 55 years and older ($455).
DurationFootnote 118 of Employment Insurance PCIC benefits
Under PCIC benefits, claimants are provided with up to 35 weeks of benefits that can be shared among eligible parents and split into segments over a claimant’s 52-week benefit period.
Individuals receiving PCIC benefits used, on average, 17.2 weeks of benefits over the reporting period, a decrease of 0.3 weeks compared to the previous fiscal year. On average, women received more weeks of benefits than men, 18.7 weeks compared to 14.3 weeks respectively. The average number of weeks used was higher for claimants aged 55 years old and over (21.9 weeks) and for those aged between 45 and 54 years old (21.7 weeks).
6.6 Employment Insurance special benefits for self-employed persons
Self-employed persons may make a claim for EI special benefits after signing up for the EI Program. The special benefits available to self-employed persons are the same as those offered to salaried employees.
To be eligible for EI special benefits for self-employed persons, an individual must:
- register with the Canada Employment Insurance Commission (CEIC);
- wait for 12 months from the date of his or her confirmed registration before claiming EI special benefits;
- have reduced the amount of time devoted to his or her business by more than 40%;
- have earned the minimum number of self-employed earnings during the calendar year preceding the year he or she applies for benefits;Footnote 119
- pay EI premiums at the same rate as salaried employees for at least one year before he or she may claim benefits; and
- meet the eligibility criteria specific to the special benefits being claimed.Footnote 120
During FY1617, there were 1,800 additional self-employed persons who entered into a voluntary agreement with the CEIC in order to be eligible for EI special benefits, bringing the total number of self-employed persons who are enrolled in the EI Program to almost 19,400 participants. This represents a growth of 10.4% compared to the previous year (see Table 55).
| 2012/2013 | 2013/2014 | 2014/2015 | 2015/2016 | 2016/2017 | |
|---|---|---|---|---|---|
| Net enrolments | 2,389 | 1,530 | 1,448 | 1,704 | 1,820 |
| New participants to the program (opted in) |
3,315 | 2,063 | 1,946 | 2,338 | 2,547 |
| Registrants who cancelled or terminated participation (opted out) |
-926 | -533 | -498 | -634 | -727 |
| Cumulative total, at the end of the fiscal year | 12,864 | 14,394 | 15,842 | 17,546 | 19,366 |
- Source: Employment and Social Development Canada, Service Canada administrative data, 100% sample.
Employment Insurance special benefits for self-employed persons, claims, amount paid and level of benefits
A total of 749 special benefit claims were established by self-employed persons in FY1617, a 3.6% increase compared with the previous fiscal year and the same number of claims recorded as two years ago. The benefit types most frequently received by self-employed EI claimants were maternity benefits and parental benefits (see Table 56).
Ontario is the region that established the largest number of claims. However, unlike other regions and Canada as a whole, it experienced a slight dip in the number of claims relative to the previous fiscal year ( 0.9%). Quebec’s under-representation in terms of new claims established (3.2%) reflects the fact that the province offers maternity, parental, adoption, and paternity benefits outside the EI program with mandatory participation of self-employed persons (see 2.6.2 Employment Insurance maternity and parental benefits).
As in the past, women made up the vast majority (96.7%) of new claims established for self-employed persons. By age, claimants between 30 and 39 years old accounted for the largest share of new claims (69.7%). Claimants in this age group as well as those aged 40 years old and over reported an annual increase in the number of new claims, +6.7% and +5.0% respectively, while claimants aged 29 years old and under recorded a decrease of 7.1% compared to the previous fiscal year.
The total amount paid in EI special benefits to self-employed persons reached $7.7 million for the reporting period. This 1.9% decrease compared to last year is due to the reduction of payments in parental benefits. These benefits represented 61.2% of the total special benefits received by self-employed persons, while maternity benefits accounted for 32.1% (see Table 56).
| Number of claims | Amount paid ($ millions) | |||||
|---|---|---|---|---|---|---|
| 2015/2016 | 2016/2017 | Change (%) | 2015/2016 | 2016/2017 | Change (%) | |
| Benefit type | ||||||
| Maternity | 569 | 579 | +1.8% | $1.9 | $2.5 | +27.4% |
| Parental | 584 | 578 | -1.0% | $5.7 | $4.7 | -18.1% |
| Other EI special benefits | 136 | 156 | +14.7% | $0.1 | $0.5 | +242.2% |
| Region | ||||||
| Atlantic | 46 | 55 | +19.6% | $0.3 | $0.6 | +156.5% |
| Quebec | 22 | 24 | +9.1% | $0.0 | $0.1 | +345.8% |
| Ontario | 331 | 328 | -0.9% | $3.6 | $3.3 | -7.8% |
| Prairies | 155 | 156 | +0.6% | $1.9 | $2.3 | +24.3% |
| British Columbia and the Territories | 169 | 186 | +10.1% | $2.1 | $1.3 | -37.1% |
| Gender | ||||||
| Men | 27 | 25 | -7.4% | $0.2 | $0.2 | -13.3% |
| Women | 696 | 724 | +4.0% | $7.6 | $7.5 | -1.6% |
| Age category | ||||||
| 29 years old and under | 154 | 143 | -7.1% | $1.3 | $1.5 | +17.0% |
| 30 to 39 years old | 489 | 522 | +6.7% | $6.0 | $5.4 | -9.6% |
| 40 years old and over | 80 | 84 | +5.0 % | $0.5 | $0.8 | +39.8% |
| Canada | 723 | 749 | +3.6% | $7.8 | $7.7 | -1.9% |
- Note: Data may not add up to the total due to rounding. Percentage change is based on unrounded numbers. Includes all claims to self-employed persons for which at least $1 in EI special benefits was paid. New claims established by benefit type may not sum as claimants can receive multiple benefit types on a single claim.
- Source: Employment and Social Development Canada, Employment Insurance (EI) administrative data. Data are based on a 100% sample of EI administrative data.
There were large regional differences in terms of annual changes in amounts received in special benefits for self-employed persons. The Atlantic provinces, Quebec, and the Prairies recorded an increase in their respective amount paid, while Ontario, British Columbia and the Territories saw a drop.
As observed with claims, women received the largest share of the total special benefits paid to self-employed persons. Men and women saw an annual decrease in their total amount received in benefits, -13.3% and -1.6% respectively.
Even though persons aged between 30 and 39 years old received the largest proportion of special benefit payments for self-employed persons, they recorded an annual decrease of 9.6% in benefits paid. Persons aged 29 years old and under and those aged 40 years old and over each posted an increase in benefits paid (+17.0% and +39.8% respectively).
The average weekly benefit rateFootnote 121 for special benefits paid to self-employed persons increased by 2.0% to $335 per claim. On average, the highest weekly benefit rate was for claims established in British Columbia and the Territories ($380), by women ($335), and by claimants aged between 30 and 39 years old ($354).