
Employment Insurance Monitoring and Assessment Report for the fiscal year beginning April 1, 2017 and ending March 31, 2018
Annex 3: Employment benefits and Support Measures data tables
From: Employment and Social Development Canada
-
Annex 3.1 - Overview of Labour Market Development Agreements
Allocations ($000)1 Province/Territory Signature date Implementation date 2018/2019 2017/2018 2016/2017 $225M top up $1.95B envelope Total LMDA funding $125M top up $1.95B envelope Total LMDA funding $125M top up $1.95B envelope Total LMDA funding Newfoundland and Labrador September 4, 2008 November 2, 2009 7,797 125,599 133,397 4,602 125,651 130,253 4,505 126,037 130,542 Prince Edward Island September 5, 2008 October 5, 2009 2,147 24,124 26,271 1,123 24,484 25,607 1,179 24,899 26,078 Nova Scotia June 13, 2008 July 1, 2009 8,643 77,374 86,018 4,639 77,960 82,599 4,898 78,384 83,282 New Brunswick December 13, 1996 April 1, 1997 8,964 89,192 98,156 4,884 89,599 94,483 5,084 89,854 94,938 Quebec April 21, 1997 April 1, 1998 59,869 569,315 629,184 33,988 574,763 608,751 35,598 576,865 612,464 Ontario November 23, 2005 January 1, 2007 71,719 571,427 643,146 40,092 574,961 615,053 43,416 577,144 620,560 Manitoba April 17, 1997 November 27, 1997 6,786 42,955 49,741 3,598 42,806 46,404 3,442 42,804 46,246 Saskatchewan February 6, 1998 January 1, 1999 6,140 35,943 42,083 3,226 35,158 38,384 2,593 34,959 37,552 Alberta December 6, 1996 November 1, 1997 29,290 127,676 156,966 14,822 116,795 131,617 10,491 110,671 121,162 British Columbia February 20, 2008 February 2, 2009 22,847 276,944 299,791 13,576 278,354 291,931 13,374 278,971 292,345 Northwest Territories February 27, 1998 October 1, 1998 292 2,964 3,256 162 3,000 3,162 170 3,031 3,201 Yukon July 8, 2009 February 1, 2010 247 3,762 4,009 140 3,708 3,848 130 3,602 3,731 Nunavut May 11, 2000 April 1, 2000 257 2,725 2,983 147 2,761 2,908 119 2,780 2,899 Canada 225,000 1,950,000 2,175,000 125,000 1,950,000 2,075,000 125,000 1,950,000 2,075,000 - 1. Funds that are transferred to cover administrative costs are not included in the amounts. Please refer to Annex 3.12 for administrative costs.
-
Annex 3.2 – Employment Insurance (EI) Part II – General definitions
Eligibility for Employment Benefits and Support Measures (EBSMs) or similar programs funded under Part II
In FY1718, to be eligible for Employment Benefits, individuals must be unemployed and have a current Employment Insurance (EI) claim as an “active EI client” or a claim that ended in the preceding five years as a “former EI client.” Those who began a maternity or parental claim in the preceding five years, after which they left the labour market to care for their newborn or newly adopted children, also qualify as former EI clients and are eligible for Employment Benefits upon re-entry into the labour market. Unemployed individuals who are neither active nor former EI clients are considered “non-insured” and are eligible to participate in Employment Assistance Services as well as self-services provided by the National Employment Service.
Labour Market Development Agreements (LMDAs)
LMDAs provide the frameworks within which EBSM delivery takes place. EBSMs are flexible by design, allowing provincial and territorial jurisdictions (P/Ts) to develop and deliver programs that respond to local and regional labour market needs. With the implementation of the Canada-Yukon LMDA on February 1, 2010, all provinces and territories are now fully responsible for the design and delivery of programs similar to EBSMs established under Part II of the EI Act. In support of these activities, Employment and Social Development Canada (ESDC) transfers LMDA funding to the provinces and territories and focuses on accountability, evaluation and ongoing policy development. ESDC also delivers Pan-Canadian programming and maintains, in partnership with the provinces and territories, specific projects and activities in the national interest under Part II of the EI Act. Canada retains responsibility for the delivery of insurance benefits under Part I of the EI Act and for the aspects of labour market development reflective of national interests. For more information on LMDAs, please refer to: Labour Market Development Agreements.
Apprentices
Apprentices are paid by their employer during periods of practical training. During the classroom portion of their training, apprentices are eligible for regular benefits under Part I of the EI Act. The apprentice requires a referral under the authority of Section 25 of the EI Act to access these benefits. Depending on the regional and local priorities of the province or territory, the apprentice may receive EI Part II support to cover classroom-related expenses.
Aboriginal Skills and Employment Training Strategy (ASETS)
ESDC negotiates agreements with indigenous organizations to design and deliver employment programs and services for indigenous people at the community level. Aboriginal Skills and Employment Training Strategy (ASETS) is the successor to the Aboriginal Human Resources Development Strategy (AHRDS), which expired on March 31, 2010.
The sunsetting of AHRDS and the modernization of ESDC's Aboriginal labour market programming—through ASETS—coincides with ESDC’s process of modernizing the administration of grants and contributions. The ASETS advances labour market outcomes for First Nations, Métis, and Inuit via demand-driven skills development, strategic partnerships with provinces, territories and the private sector, and via increased accountability. It also supports the development of a skilled Aboriginal workforce, which is one of the Aboriginal Economic Development Framework’s objectives.
Job Bank
Job Bank is an Internet service that helps connect employers and workers. It is the largest web-based network of job advertisements across Canada and is available to Canadian employers and job seekers free of charge. See Job Bank.
-
Annex 3.3 – EBSM Program descriptions
Employment benefits
Targeted Wage Subsidies assist insured participants to obtain on-the-job work experience by providing employers with financial assistance toward the wages of participants. This benefit encourages employers to hire unemployed individuals whom they would not normally hire in the absence of a subsidy.
Self-Employment provides financial assistance and business planning advice to EI-eligible participants to help them start their own business. This financial assistance is intended to cover personal living expenses and other expenses during the initial stages of the business.
Job Creation Partnerships projects provide insured participants with opportunities to gain work experience that will lead to ongoing employment. Activities of the project help develop the community and the local economy.
Skills Development helps insured participants to obtain employment skills by giving them direct financial assistance that enables them to select, arrange for and pay for their own training.
Targeted Earnings Supplements encourage unemployed persons to accept employment by offering them financial incentives. Quebec offers a similar measure—Return to Work Supplement—to help with expenses related to returning to work (for example, new tools, office materials or clothing).
Support Measures
Employment Assistance Services provide funding to organizations to enable them to provide employment assistance to unemployed persons. The services provided may include individual counselling, action planning, job search skills, job-finding clubs, job placement services, the provision of labour market information, case management and follow-up.
Labour Market Partnerships provide funding to help employers, employee and employer associations, and communities to improve their capacity to deal with human resource requirements and to implement labour force adjustments. These partnerships involve developing plans and strategies, and implementing adjustment measures
Research and Innovation supports activities that identify better way of helping people to prepare for or keep employment and to be productive participants in the labour force. Funds are provided to eligible recipients to enable them to carry out demonstration projects and research for this purpose.
-
Annex 3.4 – EBSM overview
Clients served2 Gender Men 57.4% Women 42.6% Age3 15 to 19 6.9% 20 to 24 14.2% 25 to 29 14.1% 30 to 34 12.6% 35 to 39 11.4% 40 to 44 9.7% 45 to 49 8.9% 50 to 54 8.8% 55 and older 13.4% EI clients served Active claimants 73.0% Former claimants 27.0% Intervention-to-client ratio Clients 715,658 Interventions 1,107,740 Ratio 1.55 Participation in interventions as a percentage of total Employment benefits Targeted Wage Subsidies 1.4% Self-Employment 0.5% Job Creation Partnerships 0.3% Skills Development-Regular 5.0% Skills Development-Apprentices 5.6% Targeted Earning Supplements 0.0% Support Measures: Employment Assistance Services Employment services 48.5% Group services 2.0% Individual counselling 33.5% Pan-Canadian 3.2% Designated group participation in EBSMs Women 44.9% Indigenous peoples4 8.2% Persons with disabilities4 13.1% Visible minorities4 7.2% Labour market Employment 18,487,700 Unemployment rate 6.1% - 1. In FY1314, Newfoundland and Labrador implemented a new case management system. In the context of the transition to this new system, FY1718 administrative data counts for the province on clients and interventions presented in this year’s report are estimates, based on partial counts and other sources of information, such as the audited financial statements and temporary transitional data capturing processes for that period. As such, Newfoundland and Labrador’s estimates should be interpreted with caution in the context of national results.
- 2. Clients with an unknown gender were added to the male category.
- 3. SD-Apprentices and Group Services are excluded from the distribution because client date of birth is not collected.
- 4. Reported counts are generally lower than actual numbers because data are collected through self-identification.
- Sources: Client and Participant datasets.
-
Annex 3.5 – EBSM clients: Clients served, by client type1,2
2017/18 Provinces
and
TerritoriesEI clients Non-insured clients served Total clients served EI active claimants Former claimants served Total EI clients served Target3 Active claimants served Newfoundland and Labrador 9,000 9,390 2,370 11,760 1,107 12,867 Prince Edward Island 2,797 3,487 784 4,271 1,852 6,123 Nova Scotia 9,500 9,152 2,397 11,549 4,337 15,886 New Brunswick 9,000 11,302 3,116 14,418 8,410 22,828 Quebec 136,500 127,614 32,965 160,579 79,764 240,343 Ontario 66,100 56,484 29,702 86,186 106,483 192,669 Manitoba 0 8,792 3,729 12,521 12,279 24,800 Saskatchewan 11,475 9,442 4,156 13,598 5,035 18,633 Alberta 49,000 35,101 15,856 50,957 38,909 89,866 British Columbia 37,500 32,881 10,209 43,090 25,883 68,973 Northwest Territories 300 333 343 676 793 1,469 Yukon 300 208 44 252 108 360 Nunavut 165 153 168 321 773 1,094 National Headquarters n/a n/a n/a n/a n/a n/a Total EBSMs 331,637 304,339 105,839 410,178 285,733 695,911 Indigenous Pan-Canadian 13,614 9,659 10,088 19,747 n/a 19,747 Canada 345,251 313,998 115,927 429,925 285,733 715,658 - 1. In FY1314, Newfoundland and Labrador implemented a new case management system. In the context of the transition to this new system, FY1718 administrative data counts for the province on clients and interventions presented in this year’s report are estimates, based on partial counts and other sources of information, such as the audited financial statements and temporary transitional data capturing processes for that period. As such, Newfoundland and Labrador’s estimates should be interpreted with caution in the context of national results.
- 2. This table includes clients served between April 1, 2017, and March 31, 2018, with one count per client served.
- 3. Each jurisdiction's target refers to the number of EI active clients served, except in Quebec, where it includes both active and former clients served.
- Source: Client dataset.
-
Annex 3.6 – New EBSM interventions1,2
2017/18 N.L. P.E.I. N.S. N.B. Que. Ont.3 Man. Sask. Alta. B.C. N.W.T Yk. Nun. NHQ Canada Employment benefits Targeted Wage Subsidies 820 696 809 2,293 6,452 2,039 36 0 127 1,897 60 3 34 n/a 15,266 Self-Employment 286 146 555 315 1,593 0 133 70 302 2,328 14 0 7 n/a 5,749 Job Creation Partnerships 1,311 60 107 0 0 161 178 0 1,026 217 10 0 0 n/a 3,070 Skills Development–Regular 3,608 2,123 1,140 6,877 22,894 4,694 1,978 6,962 1,150 3,496 55 27 356 n/a 55,360 Skills Development–Apprentices 2,012 267 1,527 2,207 0 15,360 3,901 5,406 17,723 13,560 125 150 39 n/a 62,277 Targeted Earning Supplements 0 0 0 0 0 0 0 0 0 0 0 0 0 n/a 0 Total employment benefits 8,037 3,292 4,138 11,692 30,939 22,254 6,226 12,438 20,328 21,498 264 180 436 n/a 141,722 Support Measures: EAS Employment services 8,402 5,520 22,711 9,819 186,529 0 34,140 5,958 147,055 115,425 0 273 1,200 n/a 537,032 Group services 3,647 0 1,682 0 15,985 0 0 387 0 63 0 0 0 n/a 21,764 Individual counselling 6,578 1,072 2,260 22,796 72,240 192,092 19,104 5,024 0 48,290 1,907 0 0 n/a 371,363 Total Support Measures: EAS 18,627 6,592 26,653 32,615 274,754 192,092 53,244 11,369 147,055 163,778 1,907 273 1,200 n/a 930,159 Total Support Measures: EAS–without group services 14,980 6,592 24,971 32,615 258,769 192,092 53,244 10,982 147,055 163,715 1,907 273 1,200 n/a 908,395 Total benefits and Support Measures: EAS 26,664 9,884 30,791 44,307 305,693 214,346 59,470 23,807 167,383 185,276 2,171 453 1,636 n/a 1,071,881 Indigenous Pan-Canadian 454 123 552 676 2,425 5,599 5,122 6,325 3,484 9,864 246 283 110 596 35,859 Grand Total–Benefits and Support Measures: EAS 27,118 10,007 31,343 44,983 308,118 219,945 64,592 30,132 170,867 195,140 2,417 736 1,746 596 1,107,740 Grand Total–without group services 23,471 10,007 29,661 44,983 292,133 219,945 64,592 29,745 170,867 195,077 2,417 736 1,746 596 1,085,976 - 1. In FY1314, Newfoundland and Labrador implemented a new case management system. In the context of the transition to this new system, FY1718 administrative data counts for the province on clients and interventions presented in this year’s report are estimates, based on partial counts and other sources of information, such as the audited financial statements and temporary transitional data capturing processes for that period. As such, Newfoundland and Labrador’s estimates should be interpreted with caution in the context of national results.
- 2. Interventions in this table refer to all new starts between April 1, 2017 and March 31, 2018.
- 3. Ontario counts one individual counselling intervention per client.
- Source: Participant dataset.
-
Annex 3.7 – EBSM designated members – women1,2
New Starts, by Intervention (%)—2017/18 N.L. P.E.I. N.S. N.B. Que. Ont. Man. Sask. Alta. B.C. N.W.T Yk. Nun. NHQ Canada Employment benefits Targeted Wage Subsidies 60.8 39.4 43.6 52.5 44.0 42.9 44.4 0.0 55.9 46.2 15.0 100.0 0.0 n/a 45.5 Self-Employment 51.7 43.2 41.8 35.9 48.0 0.0 40.6 44.3 51.0 52.2 57.1 0.0 42.9 n/a 48.5 Job Creation Partnerships 43.3 68.3 62.6 0.0 0.0 73.3 34.3 0.0 46.2 35.5 0.0 0.0 0.0 n/a 45.9 Skills Development–Regular 40.5 58.5 55.4 49.9 43.3 45.7 54.2 59.1 56.9 56.1 41.8 40.7 52.0 n/a 48.5 Skills Development–Apprentices 8.6 8.6 4.4 4.2 0.0 3.1 2.8 4.9 6.3 5.1 8.8 5.3 7.7 n/a 4.8 Targeted Earning Supplements 0.0 0.0 0.0 0.0 0.0 0.0 0.0 0.0 0.0 0.0 0.0 0.0 0.0 n/a 0.0 Total employment benefits 34.6 49.9 32.6 41.4 43.7 16.2 21.1 35.5 12.1 22.4 20.5 12.2 47.5 n/a 28.9 Support Measures: EAS Employment services 43.2 50.2 49.7 48.2 45.5 0.0 48.8 33.4 48.0 49.1 0.0 46.2 46.8 n/a 47.3 Individual counselling 49.6 55.1 50.0 45.6 45.4 48.0 51.6 44.6 0.0 49.2 38.4 0.0 0.0 n/a 47.6 Total Support Measures: EAS 46.0 51.0 49.7 46.3 45.5 48.0 49.8 38.5 48.0 49.1 38.4 46.2 46.8 n/a 47.4 Total benefits and Support Measures: EAS 38.4 50.6 47.3 45.0 45.3 44.7 46.8 36.9 43.6 46.0 36.3 32.7 47.0 n/a 44.9 Indigenous Pan-Canadian 34.1 42.3 42.9 44.8 47.3 45.7 42.9 47.3 32.4 41.1 46.3 36.4 63.6 89.4 43.6 Grand total, benefits and Support Measures: EAS 38.3 50.5 47.2 45.0 45.3 44.7 46.5 39.1 43.4 45.8 37.3 34.1 48.1 89.4 44.9 - 1. In FY1314, Newfoundland and Labrador implemented a new case management system. In the context of the transition to this new system, FY1718 administrative data counts for the province on clients and interventions presented in this year’s report are estimates, based on partial counts and other sources of information, such as the audited financial statements and temporary transitional data capturing processes for that period. As such, Newfoundland and Labrador’s estimates should be interpreted with caution in the context of national results.
- 2. All percentages are based on new start interventions only (the number of interventions started in FY1718).
- Source: Participant dataset.
-
Annex 3.8 – EBSM designated members – Persons with disabilities1,2
New Starts, by Intervention (%)—2017/18 N.L. P.E.I. N.S. N.B. Que. Ont. Man. Sask. Alta. B.C. N.W.T Yk. Nun. NHQ Canada Employment benefits Targeted Wage Subsidies 0.0 2.6 19.0 4.4 39.7 9.8 0.0 0.0 0.0 32.8 0.0 33.3 0.0 n/a 24.9 Self-Employment 0.0 0.0 14.2 4.1 2.1 0.0 7.5 12.9 4.3 35.4 0.0 0.0 0.0 n/a 17.1 Job Creation Partnerships 0.0 8.3 10.3 0.0 0.0 0.0 3.9 0.0 3.2 26.7 0.0 0.0 0.0 n/a 3.7 Skills Development–Regular 0.0 3.4 21.7 5.0 5.2 0.0 4.9 4.6 2.1 39.0 0.0 11.1 0.8 n/a 6.6 Skills Development–Apprentices 0.0 0.0 0.1 0.6 0.0 0.0 0.2 1.8 0.0 0.5 0.0 0.0 0.0 n/a 0.3 Targeted Earning Supplements 0.0 0.0 0.0 0.0 0.0 0.0 0.0 0.0 0.0 0.0 0.0 0.0 0.0 n/a 0.0 Total employment benefits 0.0 2.9 11.9 4.0 12.2 0.9 1.9 3.5 0.4 13.6 0.0 2.2 0.7 n/a 6.1 Support Measures: EAS Employment services 0.0 20.4 22.3 18.1 8.9 0.0 7.6 10.8 4.8 40.1 0.0 14.3 0.6 n/a 15.3 Individual counselling 0.0 9.6 30.7 9.1 6.7 9.6 7.2 10.7 0.0 43.2 0.5 0.0 0.0 n/a 13.3 Total Support Measures: EAS 0.0 18.7 23.0 11.9 8.3 9.6 7.5 10.7 4.8 41.0 0.5 14.3 0.6 n/a 14.5 Total benefits and Support Measures: EAS 0.0 13.4 21.5 9.8 8.7 8.7 6.9 6.9 4.2 37.8 0.5 9.5 0.6 n/a 13.4 Indigenous Pan-Canadian 4.0 7.3 4.7 5.3 0.7 3.4 5.9 10.7 2.7 5.8 0.0 1.1 0.0 2.5 5.5 Grand total, benefits and Support Measures: EAS 0.2 13.4 21.1 9.7 8.7 8.5 6.8 7.7 4.2 36.2 0.5 6.3 0.6 2.5 13.1 - 1. In FY1314, Newfoundland and Labrador implemented a new case management system. In the context of the transition to this new system, FY1718 administrative data counts for the province on clients and interventions presented in this year’s report are estimates, based on partial counts and other sources of information, such as the audited financial statements and temporary transitional data capturing processes for that period. As such, Newfoundland and Labrador’s estimates should be interpreted with caution in the context of national results.
- 2. All percentages are based on new start interventions only (the number of interventions started in FY1718). These reported counts are generally lower than actual numbers because data are collected through self-identification.
- Source: Participant dataset.
-
Annex 3.9 – EBSM designated members – Indigenous peoples1,2
New Starts, by Intervention (%)—2017/18 N.L. P.E.I. N.S. N.B. Que. Ont. Man. Sask. Alta. B.C. N.W.T Yk. Nun. NHQ Canada Employment benefits Targeted Wage Subsidies 0.0 0.3 3.7 0.0 0.0 1.4 16.7 0.0 3.9 11.1 28.3 33.3 0.0 n/a 2.1 Self-Employment 0.0 0.0 4.9 0.0 0.0 0.0 9.8 10.0 2.3 8.0 50.0 0.0 0.0 n/a 4.4 Job Creation Partnerships 0.0 0.0 1.9 0.0 0.0 1.9 15.2 0.0 10.5 39.2 0.0 0.0 0.0 n/a 7.7 Skills Development–Regular 0.0 0.7 3.1 0.0 0.0 1.1 11.8 8.4 0.6 12.2 50.9 25.9 77.5 n/a 3.0 Skills Development–Apprentices 0.0 0.0 0.0 0.0 0.0 0.0 1.2 2.5 0.1 0.4 24.0 0.0 0.0 n/a 0.4 Targeted Earning Supplements 0.0 0.0 0.0 0.0 0.0 0.0 0.0 0.0 0.0 0.0 0.0 0.0 0.0 n/a 0.0 Total employment benefits 0.0 0.5 2.3 0.0 0.0 0.4 5.2 5.8 0.7 4.5 34.8 4.4 69.4 n/a 1.9 Support Measures: EAS Employment services 0.0 0.8 3.4 0.0 0.1 0.0 11.4 12.8 9.0 14.0 0.0 12.8 67.8 n/a 6.8 Individual counselling 0.0 1.1 4.3 0.0 0.0 0.9 9.0 11.6 0 15.1 77.4 0.0 0.0 n/a 3.6 Total Support Measures: EAS 0.0 0.9 3.5 0.0 0.1 0.9 10.5 12.3 9.0 14.3 77.4 12.8 67.8 n/a 5.5 Total benefits and Support Measures: EAS 0.0 0.8 3.3 0.0 0.1 0.9 10.0 8.8 8.0 13.2 72.2 9.5 68.2 n/a 5.0 Indigenous Pan-Canadian 100 100 100 100 100 100 100 100 100 100 100 100 100 100 100 Grand total, benefits and Support Measures: EAS 4.0 2.0 5.1 1.5 0.9 3.4 17.1 28.2 9.9 17.6 75.1 44.3 70.2 100.0 8.2 - 1. In FY1314, Newfoundland and Labrador implemented a new case management system. In the context of the transition to this new system, FY1718 administrative data counts for the province on clients and interventions presented in this year’s report are estimates, based on partial counts and other sources of information, such as the audited financial statements and temporary transitional data capturing processes for that period. As such, Newfoundland and Labrador’s estimates should be interpreted with caution in the context of national results.
- 2. All percentages are based on new start interventions only (the number of interventions started in FY1718). These reported counts are generally lower than actual numbers because data are collected through self-identification.
- Source: Participant dataset.
-
Annex 3.10 – EBSM designated members – Visible minorities1,2,3
New Starts, by Intervention (%)—2017/18 N.L. P.E.I. N.S. N.B. Que. Ont. Man. Sask. Alta. B.C. N.W.T Yk. Nun. NHQ Canada Employment benefits Targeted Wage Subsidies 0.0 6.2 2.8 2.2 0.0 9.1 11.1 0.0 0.8 12.0 10.0 0.0 0.0 n/a 3.7 Self-Employment 0.0 2.1 4.9 1.3 0.0 0.0 12.8 11.4 3.0 11.9 14.3 0.0 0.0 n/a 6.0 Job Creation Partnerships 0.0 1.7 0.0 0.0 0.0 13.7 10.1 0.0 1.8 8.8 0.0 0.0 0.0 n/a 2.8 Skills Development–Regular 0.0 3.3 3.0 2.8 0.0 16.7 24.1 6.4 4.3 11.1 14.5 0.0 0.6 n/a 4.4 Skills Development–Apprentices 0.0 0.0 0.1 0.0 0.0 0.1 0.9 1.3 0.0 0.2 3.2 0.0 0.0 n/a 0.3 Targeted Earning Supplements 0.0 0.0 0.0 0.0 0.0 0.0 0.0 0.0 0.0 0.0 0.0 0.0 0.0 n/a 0.0 Total employment benefits 0.0 3.6 2.2 2.1 0.0 4.6 8.9 4.2 0.4 4.4 8.3 0.0 0.5 n/a 2.6 Support Measures: EAS Employment services 0.0 18.3 6.5 14.1 0.0 0.0 24.5 8.5 1.9 14.8 0.0 0.7 1.4 n/a 6.2 Individual counselling 0.0 10.5 6.0 5.4 0.0 14 26.5 10.1 0.0 14.7 16.9 0.0 0.0 n/a 11.3 Total Support Measures: EAS 0.0 17.0 6.4 8.0 0.0 14 25.2 9.2 1.9 14.8 16.9 0.7 1.4 n/a 8.3 Total benefits and Support Measures: EAS 0.0 12.5 5.8 6.5 0.0 13.1 23.5 6.5 1.7 13.6 15.9 0.4 1.2 n/a 7.5 Indigenous Pan-Canadian 0.0 0.0 0.0 0.0 0.0 0.0 0.0 0.0 0.0 0.0 0.0 0.0 0.0 0.0 0.0 Grand total, benefits and Support Measures: EAS 0.0 12.4 5.7 6.4 0.0 12.7 21.7 5.1 1.7 12.9 14.3 0.3 1.1 0.0 7.2 - 1. In FY1314, Newfoundland and Labrador implemented a new case management system. In the context of the transition to this new system, FY1718 administrative data counts for the province on clients and interventions presented in this year’s report are estimates, based on partial counts and other sources of information, such as the audited financial statements and temporary transitional data capturing processes for that period. As such, Newfoundland and Labrador’s estimates should be interpreted with caution in the context of national results.
- 2. Quebec, and NHQ did not report participation levels for members of the visible minority groups. Therefore, these jurisdictions were excluded from the calculation of the national average.
- 3. All percentages are based on new start interventions only (the number of interventions started in FY1718). These reported counts are generally lower than actual numbers because data are collected through self-identification.
- Source: Participant dataset.
-
Annex 3.11 - EBSM and Pan-Canadian activities ― Part I - Final expenditures
In $000s by Intervention—2017/18 N.L. P.E.I. N.S. N.B. Que. Ont. Man. Sask. Alta. B.C. N.W.T. Yk. Nun. NHQ Canada Self-Employment 1,521 831 2,134 2,353 7,072 63 780 410 2,445 3,695 102 0 0 n/a 21,406 Job Creation Partnerships1 1,341 70 171 0 106 225 224 10 25 257 0 0 0 n/a 2,430 Skills Development 21,527 13,292 19,156 47,868 48,548 73,794 26,858 21,721 97,001 52,252 769 764 308 n/a 423,858 TOTAL2 24,389 14,193 21,461 50,221 55,726 74,082 27,862 22,141 99,471 56,204 871 764 308 n/a 447,694 - 1. In Quebec, this amount refers only to pan-Canadian activities.
- 2. Totals may not add due to rounding.
- Source: Benefit and Overpayment System
-
Annex 3.12 - EBSM final expenditures5
In $000s by Intervention—2017/18 N.L. P.E.I. N.S. N.B. Que. Ont. Man. Sask. Alta. B.C. N.W.T. Yk. Nun. NHQ Canada Employment benefits Targeted Wage Subsidies 5,752 3,512 3,974 12,395 69,231 3,429 209 0 1,114 9,480 323 26 400 n/a 109,845 Self-Employment 7,314 2,061 6,477 4,741 22,850 0 1,341 272 2,038 14,272 203 0 18 n/a 61,586 Job Creation Partnerships 8,497 692 1,271 0 0 1,825 1,260 0 12,089 8,053 0 0 0 n/a 33,687 Skills Development 90,748 12,501 39,565 57,232 231,736 141,494 25,972 30,823 63,554 131,659 995 1,793 1,501 n/a 829,573 Total employment benefits 112,312 18,766 51,288 74,368 323,816 146,748 28,783 31,095 78,794 163,464 1,521 1,818 1,918 n/a 1,034,691 Support Measures: EAS Employment assistance 6,835 5,120 28,972 10,543 148,782 324,522 9,776 5,417 49,501 101,810 1,180 1,445 150 n/a 694,054 Total Support Measures: EAS 6,835 5,120 28,972 10,543 148,782 324,522 9,776 5,417 49,501 101,810 1,180 1,445 150 n/a 694,054 Sub-total : Employment benefits and Support Measures: EAS 119,147 23,886 80,260 84,911 472,598 471,270 38,559 36,512 128,295 265,274 2,701 3,264 2,068 n/a 1,728,745 Other Support Measures Labour Market Partnerships 4,485 1,721 1,991 8,944 102,854 28,295 5,680 1,418 3,322 12,764 128 124 172 n/a 171,898 Research and Innovation 5,229 0 348 628 7,556 115,488 2,165 454 0 16,373 80 95 0 n/a 148,417 Total other Support Measures 9,714 1,721 2,339 9,572 110,409 143,783 7,845 1,872 3,322 29,137 208 219 172 n/a 320,315 Total EBSM— Part II 128,861 25,607 82,599 94,483 583,007 615,053 46,404 38,384 131,617 294,411 2,909 3,483 2,240 n/a 2,049,060 Overcontribution1 1,392 0 0 1,636 0 0 0 0 0 4,393 253 364 521 43,382 50,941 Pan-Canadian (see details in Annex 3.13) 1,966 225 1,665 1,501 10,319 21,731 14,660 12,853 13,885 15,069 2,560 980 2,419 20,378 120,210 Adjustment2 (4,161) 0 0 (1,636) 0 19,390 0 0 0 (2,042) (266) (280) (765) (20,377) (10,136) Total including Pan-Canadian 128,057 25,832 84,264 95,984 593,326 656,175 61,064 51,237 145,502 311,831 5,456 4,548 4,415 42,383 2,210,074 Administrative costs related to LMDAs3 8,931 2,695 10,149 8,922 58,920 57,277 6,078 6,021 9,594 18,721 1,450 389 546 n/a 189,693 - 1. Overcontributions will be recovered during FY1819.
- 2. This adjustment reflects overpayments established, refunds of previous years' expenditures and other accounting adjustments.
- 3. Net Administrative costs include $181 million (salary and non-salary) to administer LMDAs and $11 million for rent.
- 4. Expenditures for Ontario TWS (Job Placement with Incentives) were estimated by Ontario. In Ontario's financial statements, actual expenditures for Ontario's TWS-similar interventions were included in total EAS expenditures, because the province has integrated these services in its employment service model, in order to maximize the flexibility of program delivery by third-party service providers.
- 5. Totals may not add due to rounding.
- Source: provincial/territorial audited statements.
-
Annex 3.13 - EI Part II Pan-Canadian ― Final expenditures1
In $000s by Intervention—2017/18 N.L. P.E.I. N.S. N.B. Que. Ont. Man. Sask. Alberta B.C. N.W.T. Yk. Nun. NHQ Canada Pan-Canadian - Programming funds Aboriginal Skills and Employment Training Strategy 1,966 225 1,665 1,501 10,319 21,731 14,660 12,853 13,885 15,069 2,560 980 2,419 1,110 100,942 Labour Market Partnerships n/a n/a n/a n/a n/a n/a n/a n/a n/a n/a n/a n/a n/a 13,882 13,882 Research and Innovation n/a n/a n/a n/a n/a n/a n/a n/a n/a n/a n/a n/a n/a 5,386 5,386 Grand total Pan-Canadian 1,966 225 1,665 1,501 10,319 21,731 14,660 12,853 13,885 15,069 2,560 980 2,419 20,378 120,210 - 1. Totals may not add due to rounding
- Source: SAP
-
Annex 3.14 - Returns to employment and unpaid benefits indicators1
2017/18 Clients who returned to employment2 Unpaid benefits ($ millions)2 Targets3 Results Results vs. targets (%) Targets3 Results Results vs. targets (%) SD-Apprentices Group services Other4 Total SD-Apprentices Group services Other4 Total5 Newfoundland and Labrador 5,000 1,068 1 1,726 2,795 56% 24.0 12.5 0.0 5.0 17.5 73% Prince Edward Island 2,132 176 0 2,026 2,202 103% 8.1 2.1 0.0 5.1 7.1 88% Nova Scotia 5,000 1,134 176 4,314 5,624 112% 24.0 13.6 1.4 8.9 23.9 100% New Brunswick 7,900 1,471 0 7,329 8,800 111% 30.5 11.4 0.0 17.7 29.1 96% Quebec 50,900 0 3,004 65,790 68,794 135% 240.0 0.0 24.7 302.9 327.6 137% Ontario 53,000 11,084 0 28,594 39,678 75% 272.0 120.7 0.0 112.5 233.2 86% Manitoba 6,500 2,779 0 1,726 4,505 69% 45.5 29.9 0.0 11.5 41.3 91% Saskatchewan 6,700 2,907 53 1,919 4,879 73% 50.0 35.9 0.6 13.9 50.4 101% Alberta 25,000 11,654 0 7,072 18,726 75% 225.0 169.9 0.0 63.6 233.4 104% British Columbia 21750 8,565 11 12,421 20,997 97% 142.0 99.4 0.1 37.1 136.6 96% Northwest Territories 200 63 0 79 142 71% 2.5 0.6 0.0 0.7 1.3 52% Yukon 250 80 0 61 141 56% 2.6 0.8 0.0 0.2 1.0 39% Nunavut 95 23 0 29 52 55% 0.7 0.4 0.0 0.3 0.8 108% Canada 184,427 41,004 3,245 133,086 177 335 96% 1,067 497.0 26.8 579.4 1,103 103% - 1. In FY1314, Newfoundland and Labrador implemented a new case management system. In the context of the transition to this new system, FY1718 administrative data counts for the province on clients and interventions presented in this year’s report are estimates, based on partial counts and other sources of information, such as the audited financial statements and temporary transitional data capturing processes for that period. As such, Newfoundland and Labrador’s estimates should be interpreted with caution in the context of national results.
- 2. ASETS activity resulted in 9,553 returns to employment and $21.1 million in unpaid benefits. These amounts are not included in the provincial totals.
- 3. Targets are for EBSM regular clients only.
- 4. The “Other” category includes all other EBSMs. SD-Apprentices and group services are reported separately because a different methodology is used to calculate returns to employment for these two measures.
- 5. Some unpaid benefit figures have been rounded.
- Source: Results dataset.
-
Annex 3.15 - Returns to employment by EBSM intervention1,2
2017/18 N.L. P.E.I. N.S. N.B. Que.4 Ont. Man. Sask. Alta. B.C.4 N.W.T4 Yk. Nun. NHQ Canada Employment benefits Targeted Wage Subsidies 99 371 468 981 1,834 1,016 0 0 11 921 1 1 0 n/a 5,703 Self-Employment 117 152 376 294 1,167 0 19 18 81 912 8 0 0 n/a 3,144 Job Creation Partnerships 310 29 71 0 0 53 19 0 247 103 1 0 0 n/a 833 Skills Development—Regular 981 540 703 2,815 9,530 595 252 212 82 1,712 17 12 16 n/a 17,467 Skills Development—Apprentices3 1,068 176 1,134 1,471 0 11,084 2,779 2,907 11,654 8,565 63 80 23 n/a 41,004 Targeted Earning Supplements 0 0 0 0 0 0 0 0 0 0 0 0 0 n/a 0 Total benefits 2,575 1,268 2,752 5,561 12,531 12,748 3,069 3,137 12,075 12,213 90 93 39 n/a 68,151 Suppport Measures: EAS Employment services 111 776 2,523 905 46,280 0 662 642 6,651 7,848 0 48 13 n/a 66,459 Group services 1 0 176 0 3,004 0 0 53 0 11 0 0 0 n/a 3,245 Individual counselling 108 158 173 2,334 6,979 26,930 774 1,047 0 925 52 0 0 n/a 39,480 Total Support Measures: EAS 220 934 2,872 3,239 56,263 26,930 1,436 1,742 6,651 8,784 52 48 13 n/a 109,184 Total employment benefits and Support Measures: EAS 2,795 2,202 5,624 8,800 68,794 39,678 4,505 4,879 18,726 20,997 142 141 52 n/a 177,335 Target 5,000 2,132 5,000 7,900 50,900 53,000 6,500 6,700 25,000 21,750 200 250 95 n/a 184,427 Results vs. targets (%) 56% 103% 112% 111% 135% 75% 69% 73% 75% 97% 71% 56% 55% n/a 96% - 1. In FY1314, Newfoundland and Labrador implemented a new case management system. In the context of the transition to this new system, FY1718 administrative data counts for the province on clients and interventions presented in this year’s report are estimates, based on partial counts and other sources of information, such as the audited financial statements and temporary transitional data capturing processes for that period. As such, Newfoundland and Labrador’s estimates should be interpreted with caution in the context of national results.
- 2. Results associated solely with the ASETS are not available.
- 3. Results for SD-Apprentices do not match those in Annex 3.14. Results presented in this Annex are associated with the last intervention in which a client participated. Employment Benefits participation supersedes participation in Employment Services.
- 4. Due to the methodology difference, these numbers are different from the POB's result.
- Sources: Results dataset and Common System for Grants and Contributions (CSGC)
-
Annex 3.16 - Incremental impacts of EBSMs at the national and provincial levels
The following presents the results from an analysis of EBSM incremental impacts over three years after participation for active claimants who started participating in 2007 to 2008 or between 2006 and 2008 (i.e., post-program impacts over three consecutive years between 2008 and 2012 or 2006 and 2012). The national results from this analysis were presented in the FY1314 EI MAR. This section of Annex 3 presents the national results as well as those at the provincial levels.
Study Objective and Methodology
Incremental impacts of EBSMs represent the direct effect of program participation on participants' labour market experience (i.e., earnings from employment/self-employment, incidence of employment and use of EI) after participation. The role of the incremental impact analysis is to isolate the effects of participation from other factors such as inflation, economic cycles, layoff, etc. In order to achieve this, the incremental impact analysis compares the labour market experience of participants before and after their participation, with that of non-participants before and after the same period (see diagram).
The analysis covered up to 100% of active and former claimants who started their participation in EBSMs between January 1, 2007 and December 31, 2008 or between January 1, 2006 and December 31, 2008. This analysis was conducted at the national level with participants from the 13 PTs. It was also conducted at the provincial level for 9 provinces. Results were not produced for Quebec since the Quebec Government is responsible for evaluating its LMDAFootnote 41. As well, it was not possible to produce incremental impacts for the territories because the number of participants was too low to generate reliable results. The 2007 to 2008 reference period was used at the national level as well as in provinces where the number of participants was sufficient to produce results. The period was extended by one year (2006 to 2008) in other provinces in order to increase the sample size. Despite adding this year, the number of participants for some EBSMs was still too low to generate impacts for those program and services.
Example of incremental impact calculation
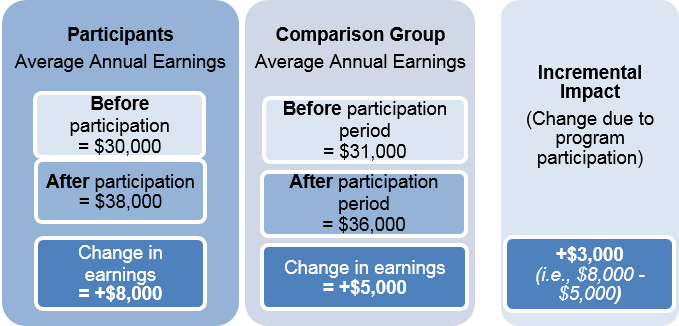
Text version
Participants
Average annual earnings- Before participation
= $30,000 - After participation
= $38,000 - Change in earnings
= +$8,000
Comparison group
Average annual earnings- Before participation period
= $31,000 - After participation period
= $36,000 - Change in earnings
= +$5,000
Incremental impact
- (Change due to program participation)
- +$3,000
(i.e., $8,000 - $5,000)
The analysis was conducted using linked administrative data from EI Part I and II and the Canada Revenue Agency (CRA). The comparison group was composed of active claimants who were eligible to participate in EBSMs but did not start participation in 2007 or 2008 or between 2006 and 2008.
The impacts of EBSM participation on improving the labour market experience of participants were measured using the following indicators:
- Average earnings from employment and/or self-employment: An increase in earnings indicates that participants improved their employment situation by either working more hours or by having a better paying job than they did before participation.
- Incidence of employment (i.e., incidence of having earnings from employment and/or self-employment): Measures whether participants were more likely to be employed after participation. A gain means that a higher proportion of participants were employed after participation than they would have been if they had not participated or if they had received minimal employment services.
- Amount of EI benefits received: Measures the average amount of EI benefits collected.
- Average number of weeks in receipt of EI: Measures the average number of weeks participants spent on EI.
The same methodology was used at national and at the provincial levels.
National Results
The following presents results at the national level and for the 9 provinces covered by this analysis. The national results are presented along with a text description to help readers understand how to interpret the results. The provincial results are presented in table format only. Since different reference periods were used at the national level and across provinces (i.e., 2007 to 2008 or 2006 to 2008) the results are not directly comparable.
The national analysis covered active claimants in the 2007 to 2008 period. Key results are as follows:
Skills Development (SD): As shown in Table 1 below, SD participants experienced earnings gains in each of the three years after participation but those increases became larger over time. The incremental gains averaged $2,300 per year. Active claimants also had an average incremental increase of 4.7 percentage points in their incidence of employment in the three years following participation. As well, SD participation resulted in lower use of EI benefits. The incremental decreases averaged $400 per year.
Targeted Wage Subsidies (TWS): Active claimants had incremental gains in earnings in each of the three years following the end of their TWS participation averaging $1,300 per year. These gains were accompanied by incremental increases in incidence of employment in each year after participation averaging 6.1 percentage points per year. Most impacts on EI benefits collected were not statistically significant at the 95% level. In this context, it is not possible to draw any clear conclusion about TWS effectiveness in reducing the use of EI after participation.
Self-Employment (SE): Over the three-year period following the end of their participation, active claimants had an average incremental reduction of $10,200 per year in their earnings from employment and/or self-employment and a reduction of 19 percentage points per year in their incidence of employment.
The earnings results should be interpreted with caution, as they may not fully capture the financial situation of participants. Impacts were examined using individual earnings reported in the T1 and T4 taxation files from CRA, and measured relative to active claimants who did not participate in SE and may have been in any employment/unemployment situation following participation (e.g., unemployed, paid employee or self-employed). According to a study from Statistics Canada, self-employed individuals in Canada have a lower average annual income than paid employees ($46,200 versus $52,400 in 2009), but the average net worth of their households is 2.7 times that of the paid employee households, which indicates that some self-employed individuals may leave funds within their business for reinvestment purposes.Footnote 42 Since the incremental impacts of SE were measured relative to a comparison group that also included paid employees and did not take the net worth of participants and comparison cases into account, the results may not be fully reflective of the financial situation of SE participants after their participation.
The incremental impact analysis also shows that SE participants collected $1,600 less in EI benefits per year on average. Those results should also be interpreted carefully since the time worked under self-employment does not allow self-employed Canadians to qualify for regular EI benefits.
Job Creation Partnerships (JCP): Participation in JCP improved active claimants' earnings by an average of $1,200 per year. They also had incremental increases in the incidence of employment in each of the three years after participation, averaging 4.9 percentage points per year. As well, on average, active claimants collected $300 less in EI benefits annually.
Employment Assistance Services only (EAS-only): Impacts were measured for the active claimants who only participated in EAS without receiving other programs or services. EAS participation was effective at helping active claimants to return to employment. Incremental impact results show that they improved their incidence of employment, while reducing their use of EI in the three year period after participation. Specifically, they had an average incremental gain of 0.6 percentage points per year in their incidence of employment, as well as average incremental decreases of $390 per year in their use of EI benefits.
Active claimants had incremental decreases in their earnings averaging $465 per year. However, the result should be interpreted with caution, as EAS is a short term and low intensity measure that is not focused on human capital development. EAS mostly includes services such as counselling, help with job search, development of return-to-work action plans and, in some cases, very short training such as first aid. In this context, it may not be reasonable to expect that participation in EAS-only would result in improving participants' earnings. However a recent evaluation on the timing of participation in EAS showed that participants who started their EAS within four weeks after initiating an EI claim had earnings gains in both the short- and medium-term after participation and achieved quicker return to employment.
Overall, results at the national level are similar to those in the provinces, with modest differences.
2.1 Canada Table 1. Incremental impacts at the national level (for Active Claimants who started an EBSM between 2007 and 2008) Indicators Post-program period Average annual impact Total impact 1st year 2nd year 3rd year Skills Development (n=18,025) Earnings ($) 292*** 2,745*** 3,904*** 2,314*** 6,943*** Incidence of employment (percentage points) 3.1*** 5.2*** 5.8*** 4.7*** n/a EI benefits ($) -755*** -298*** -191*** -415*** -1,244*** EI weeks (weeks) -2.3*** -0.9*** -0.5*** -1.2*** -3.7*** Targeted Wage Subsidies (n=9,114) Earnings ($) 1,270*** 1,112*** 1,580*** 1,338*** 4,014*** Incidence of employment (percentage points) 7.7*** 5.3*** 5.6*** 6.1*** n/a EI benefits ($) -32 -55 -209** -99 -296 EI weeks (weeks) 0.3 0.2 -0.3 0.1 0.2 Self-Employment (n=10,220)1 Earnings ($) -11,412*** -9,929*** -9,375*** -10,236*** -30,708*** Incidence of employment (percentage points) -22.7*** -18.3*** -16.1*** -19.0*** n/a EI benefits ($) -2,038*** -1,473*** -1,172*** -1,561*** -4,682*** EI weeks (weeks) -5.7*** -4.0*** -3.1*** -4.2*** -12.7*** Job Creation Partnerships (n=2,456) Earnings ($) 1,427*** 1,286** 850 1,179** 3,537** Incidence of employment (percentage points) 6.1*** 4.5*** 3.8*** 4.9*** n/a EI benefits ($) -513*** -404*** -44 -320*** -961*** EI weeks (weeks) -0.8** -0.8** 0.3 -0.5 -1.4 Employment Assistance Services (EAS) (n=108,230) Earnings ($) -1,113*** -368*** 87 -465*** -1,395*** Incidence of employment (percentage points) 0.6*** 0.6*** 0.8*** 0.6** n/a EI benefits ($) -512*** -371*** -288*** -390*** -$1,171 EI weeks (weeks) -1.7*** -1.1*** -0.8*** -1.2*** -3.6*** - Significance level ***1%; **5%; *10%
- 1 Earnings results for Self-Employment should be interpreted with caution. They may not fully capture the financial wellbeing of participants. The impacts were examined using individual earnings reported in the T1 and T4 taxation files from CRA, and measured relative to active claimants who did not participate in SE and may have been in any employment/unemployment situation following participation (e.g., unemployed, paid employee or self-employed). According to a study from Statistics Canada, self-employed individuals in Canada have a lower average annual income than paid employees ($46,200 versus $52,400 in 2009), but the average net worth of their households is 2.7 times that of the paid employee households, which indicates that some self-employed individuals may leave funds within their business for reinvestment purposes.Footnote 42 Since the incremental impacts of SE were measured relative to a comparison group that also included paid employees and did not take the net worth of participants and comparison cases into account, the results may not be fully reflective of the financial wellbeing of SE participants after their participation. As well, the decreases in EI use may be due to EI eligibility effect as self-employed Canadians cannot qualify for regular EI benefits.
2.2 Newfoundland and Labrador Table 2. Incremental impacts for Active Claimants in Newfoundland and Labrador (for Active Claimants who started an EBSM between 2006 and 2008) Indicators Post-program period Average annual impact Total impact 1st year 2nd year 3rd year Skills Development (n=8,611) Earnings ($) $1,820*** $3,836*** $6,477*** $4,046*** $12,139*** Incidence of employment (percentage points) 1.0** 2.5*** 2.9*** 2.1*** n/a EI benefits ($) -$800*** -$319*** -$200*** -$440*** -$1,319*** EI weeks (weeks) -3.4*** -1.8*** -1.4*** -2.2*** -6.6*** Targeted Wage Subsidies (n=728) Earnings ($) $4,229*** $3,331*** $3,234*** $3,598*** $10,795*** Incidence of employment (percentage points) 6.5*** 5.3*** 4.9*** 5.6*** n/a EI benefits ($) -$1,677*** -$1,229*** -$1,055*** -$1,320*** -$3,961*** EI weeks (weeks) -4.4*** -3.1*** -2.5*** -3.3*** -9.9*** Self-Employment (n=314)1 Earnings ($) -$8,102*** -$5,771*** -$5,647*** -$6,507*** -$19,520*** Incidence of employment (percentage points) -19.9*** -18.3*** -14.8*** -17.7*** n/a EI benefits ($) -$3,860*** -$2,951*** -$2,268*** -$3,026*** -$9,079*** EI weeks (weeks) -12.0*** -8.9*** -7.0*** -9.3*** -27.9*** Job Creation Partnerships (n=1,346) Earnings ($) -$300 -$678 -$837* -$605 -$1,815 Incidence of employment (percentage points) 3.2*** 1.6 2.3** 2.4*** n/a EI benefits ($) -$714*** -$445*** -$116 -$425*** -$1,275*** EI weeks (weeks) -1.0** -0.2 0.9** -0.1 -0.2 Employment Assistance Services (EAS) (n=11,904) Earnings ($) $927*** $2,158*** $2,503*** $1,863*** $5,588*** Incidence of employment (percentage points) 2.0*** 2.2*** 2.1*** 2.1*** n/a EI benefits ($) -$375*** -$176*** -$128** -$226*** -$679*** EI weeks (weeks) -0.9*** -0.3** -0.1 -0.4*** -1.3*** Significance level ***1%; **5%; *10% 1 See note 1 under table 1.2.3 Prince Edward Island Table 3. Incremental impacts for Active Claimants in Prince Edward Island (for Active Claimants who started an EBSM between 2007 and 2008) Indicators Post-program period Average annual impact Total impact 1st year 2nd year 3rd year Skills Development (n=1,516) Earnings ($) $2,635*** $4,591*** $5,054*** $4,091*** $12,273*** Incidence of employment (percentage points) 1.7** 3.0*** 2.6*** 2.4*** n/a EI benefits ($) -$477*** -$393*** -$168 -$346*** -$1,038*** EI weeks (weeks) -1.1*** -1.1** -0.7 -1.0*** -2.9*** Targeted Wage Subsidies Not available due to low sample size. Self-Employment Not available due to low sample size. Job Creation Partnerships Not available due to low sample size. Employment Assistance Services (EAS) (n=1,635) Earnings ($) $426*** $870 $1,089** $795** $2,386** Incidence of employment (percentage points) 1.7** 2.0** 1.0 1.6** n/a EI benefits ($) -$645*** -$330** -$506 -$494*** -$1,481* EI weeks (weeks) -1.8*** -0.6 -1.2*** -1.2*** -3.6*** Significance level ***1%; **5%; *10%2.4 Nova Scotia Table 4. Incremental impacts for Active Claimants in Nova Scotia (for Active Claimants who started an EBSM between 2006 and 2008) Indicators Post-program period Average annual impact Total impact 1st year 2nd year 3rd year Skills Development (n=4,911) Earnings ($) $3,427*** $5,996*** $7,728*** $5,714*** $17,142*** Incidence of employment (percentage points) 6.3*** 8.3*** 9.7*** 8.1*** n/a EI benefits ($) -$1,051*** -$532*** -$440*** -$675*** -$2,024*** EI weeks (weeks) -3.2*** -1.7*** -1.3*** -2.1*** -6.2*** Targeted Wage Subsidies (n=307) Earnings ($) $3,889*** $2,642** $3,151** $3,228** $9,683** Incidence of employment (percentage points) 6.2** 6.4** 7.7** 6.8** n/a EI benefits ($) -$1,374*** -$834*** -$835** -$1,015*** -$3,044*** EI weeks (weeks) -4.3*** -2.3** -2.5** -3.0*** -9.1*** Self-Employment (n=846)1 Earnings ($) -$10,302*** -$8,752*** -$9,691*** -$9,561*** -$28,683*** Incidence of employment (percentage points) -29.5*** -25.4*** -22.4*** -25.8*** n/a EI benefits ($) -$2,506*** -$2,116*** -$1,814*** -$2,145*** -$6,436*** EI weeks (weeks) -7.3*** -5.7*** -5.0*** -6.0*** -18.0*** Job Creation Partnerships (n=350) Earnings ($) $571 $543 -$923 $64 $191 Incidence of employment (percentage points) 3.9* -1.1 -1.4 0.5 n/a EI benefits ($) -$664** -$426 -$245 -$445* -$1,335* EI weeks (weeks) -2.3** -1.3 -0.7 -1.4* -4.3* Employment Assistance Services (EAS) (n=9,456) Earnings ($) $177 $1,346*** $1,653*** $1,059*** $3,176*** Incidence of employment (percentage points) 1.2*** 1.9*** 1.4*** 1.5*** n/a EI benefits ($) -$705*** -$579*** -$414*** -$566*** -$1,698*** EI weeks (weeks) -2.3*** -1.7*** -1.2*** -1.7*** -5.1*** Significance level ***1%; **5%; *10% 1 See note 1 under table 1.2.5 New Brunswick Table 5. Incremental impacts for Active Claimants in New Brunswick (for Active Claimants who started an EBSM between 2006 and 2008) Indicators Post-program period Average annual impact Total impact 1st year 2nd year 3rd year Skills Development (n=4,528) Earnings ($) $1,051 $5,158*** $7,120*** $4,443*** $13,328*** Incidence of employment (percentage points) 9.4*** 9.9*** 11.9*** 10.4*** n/a EI benefits ($) -$752*** -$294 $86 -$320* -$960* EI weeks (weeks) -0.8 0.5 0.8 0.2 0.5 Targeted Wage Subsidies (n=388) Earnings ($) $1,998** $1,276 $1,777** $1,684** $5,051* Incidence of employment (percentage points) 7.6*** 6.0*** 7.7*** 7.1*** n/a EI benefits ($) $441 $802** $720** $655** $1,964** EI weeks (weeks) 2.0** 2.9*** 2.2** 2.4*** 7.2*** Self-Employment (n=628)1 Earnings ($) -$9,224*** -$8,154*** -$7,771*** -$8,383*** -$25,149*** Incidence of employment (percentage points) -26.7*** -26.1*** -20.2*** -24.3*** n/a EI benefits ($) -$3,297*** -$2,804*** -$2,512*** -$2,871*** -$8,613*** EI weeks (weeks) -8.6*** -7.0*** -6.1*** -7.2*** -21.7*** Job Creation Partnerships JCP was not delivered in New Brunswick during the observed period. Employment Assistance Services (EAS) (n=12,841) Earnings ($) $1,636*** $2,528*** $2,668*** $2,277*** $6,832*** Incidence of employment (percentage points) 3.1*** 3.7*** 3.8*** 3.5*** n/a EI benefits ($) -$117 $6 $183* $24 $72 EI weeks (weeks) 0.0 0.5* 1.0*** 0.5** 1.5** Significance level ***1%; **5%; *10%2.6 Ontario2 Table 6. Incremental impacts for Active Claimants in Ontario (for Active Claimants who started an EBSM between 2007 and 2008) Indicators Post-program period Average annual impact Total impact 1st year 2nd year 3rd year Skills Development (n=17,015) Earnings ($) -$1,959*** $379 $1,607*** n/a n/a Incidence of employment (percentage points) 4.2*** 5.4*** 6.0*** 5.2*** n/a EI benefits ($) -$799*** -$233*** -$187*** -$406*** -$1,219*** EI weeks (weeks) -2.3*** -0.6*** -0.5*** -1.1*** -3.4*** Targeted Wage Subsidies (n=2,530) Earnings ($) $2,176* $2,439* $2,650* $2,479** $7,437** Incidence of employment (percentage points) 7.3*** 11.3*** 8.6*** 9.1*** n/a EI benefits ($) $442* $61 -$104 $133 $399 EI weeks (weeks) 1.4* 0.2 0.0 0.6 1.7 Self-Employment (n=3,731)1 Earnings ($) -$10,930*** -$9,433*** -$8,575*** -$9,646*** -$28,937*** Incidence of employment (percentage points) -23.9*** -18.4*** -14.5*** -18.9*** n/a EI benefits ($) -$1,681*** -$1,099*** -$794*** -$1,191*** -$3,573*** EI weeks (weeks) -4.7*** -2.9*** -2.0*** -3.2*** -9.6*** Job Creation Partnerships (n=668) Earnings ($) $2,248* $3,513*** $3,290** $3,017** $9,051** Incidence of employment (percentage points) 7.3*** 7.2*** 5.8*** 6.8*** n/a EI benefits ($) -$518* -$381 $70 -$276 -$829 EI weeks (weeks) -1.9*** -1.2* -0.3 -1.1** -3.4** Employment Assistance Services (EAS) (n=35,302) Earnings ($) -$654*** $465*** $895*** $235 $706 Incidence of employment (percentage points) 2.8*** 3.1*** 3.3*** 3.1*** n/a EI benefits ($) -$669*** -$280*** -$162*** -$370*** -$1,111*** EI weeks (weeks) -2.2*** -0.7*** -0.5*** -1.1*** -3.3*** Significance level ***1%; **5%; *10% 1 See note 1 under table 1. 2 In Ontario, participation in SD is up to three years in length. In the incremental impact analysis, the participation period is defined as two years. As a result, participants may still be in training during the first year of post-program results. Therefore, it is not unexpected to observe incremental decreases in earnings, as participants are not available for full time work in year 1 and will be transitioning into employment in year 2. To interpret trends for Ontario, the third year is the most relevant period to consider for incremental impacts. As a result, the average annual impact and total impact are not applicable for Ontario.
2.7 Manitoba Table 7. Incremental impacts for Active Claimants in Manitoba (for Active Claimants who started an EBSM between 2006 and 2008) Indicators Post-program period Average annual impact Total impact 1st year 2nd year 3rd year Skills Development (n=3,750) Earnings ($) $3,387*** $5,971** $7,032** $5,461** $16,384** Incidence of employment (percentage points) 10.6** 10.1** 11.8** 10.8** n/a EI benefits ($) -$546*** -$458*** -$212** -$405*** -$1,215*** EI weeks (weeks) -1.8*** -1.3*** -0.6** -1.2*** -3.7*** Targeted Wage Subsidies (n=339) Earnings ($) -$1,345 -$768 -$86 -$722 -$2,166 Incidence of employment (percentage points) 6.9* 2.6 2.7 4.1 n/a EI benefits ($) -$407 -$751** -$251 -$470 -$1,409 EI weeks (weeks) -1.4 -1.8 -0.5 -1.3 -3.8 Self-Employment (n=517)1 Earnings ($) -$12,450*** -$9,940*** -$9,231*** -$10,540*** -$31,621*** Incidence of employment (percentage points) -26.6*** -21.3*** -19.1*** -22.3*** n/a EI benefits ($) -$1,364*** -$1,177*** -$999*** -$1,180*** -$3,541*** EI weeks (weeks) -3.8*** -3.0*** -2.5*** -3.1*** -9.3*** Job Creation Partnerships (n=286) Earnings ($) $4,126*** $4,655*** $5,029*** $4,470*** $13,409*** Incidence of employment (percentage points) 8.1*** 7.5*** 9.9*** 8.5*** n/a EI benefits ($) -$549** -$427 -$130 -$369* -$1,106* EI weeks (weeks) -1.8** -1.7** -0.6 -1.4** -4.1** Employment Assistance Services (EAS) (n=15,131) Earnings ($) -$320 $266 $407* $118 $353 Incidence of employment (percentage points) 2.8*** 3.5*** 1.7*** 2.7*** n/a EI benefits ($) -$363*** -$235*** -$253*** -$284*** -$851*** EI weeks (weeks) -1.4*** -0.8*** -0.8*** -1.0*** -3.0*** Significance level ***1%; **5%; *10% 1 See note 1 under table 1.
2.8 Saskatchewan Table 8. Incremental impacts for Active Claimants in Saskatchewan (for Active Claimants who started an EBSM between 2006 and 2008) Indicators Post-program period Average annual impact Total impact 1st year 2nd year 3rd year Skills Development (n=1,375) Earnings ($) $2,299*** $5,189*** $6,961*** $4,839*** $14,517*** Incidence of employment (percentage points) 5.8*** 6.4*** 6.5*** 6.2*** n/a EI benefits ($) -$401*** -$223** $83 -$180** -$541** EI weeks (weeks) -1.0*** -0.7*** 0.1 -0.5** -1.6** Targeted Wage Subsidies Not available due to low sample size. Self-Employment Not available due to low sample size. Job Creation Partnerships JCP was not delivered by Saskatchewan during the observed period. Employment Assistance Services (EAS) (n=5,269) Earnings ($) -$371 $731** $1,381*** $580** $1,741** Incidence of employment (percentage points) 1.9*** 2.1*** 0.9 1.6*** n/a EI benefits ($) -$442*** -$332*** -$278*** -$351*** -$1,052*** EI weeks (weeks) -1.3*** -1.0*** -0.8*** -1.0*** -3.1*** Significance level ***1%; **5%; *10%2.9 Alberta Table 9. Incremental impacts for Active Claimants in Alberta (for Active Claimants who started an EBSM between 2006 and 2008) Indicators Post-program period Average annual impact Total impact 1st year 2nd year 3rd year Skills Development (n=2,356) Earnings ($) -$121 $1,044 $2,359** $1,108 $3,324 Incidence of employment (percentage points) 9.3*** 10.0*** 10.6*** 10.0*** n/a EI benefits ($) -$277* $137 $42 -$33 -$98 EI weeks (weeks) -1.0** 0.2 0.0 -0.3 -0.7 Targeted Wage Subsidies Not available due to low sample size. Self-Employment (n=658)1 Earnings ($) -$13,493*** -$12,430*** -$13,046*** -$12,990*** -$38,970*** Incidence of employment (percentage points) -14.7*** -14.4*** -13.9*** -14.3*** n/a EI benefits ($) -$971*** -$658*** -$308* -$646*** -$1,938*** EI weeks (weeks) -2.4*** -1.6*** -0.8* -1.6*** -4.9*** Job Creation Partnerships (n=521) Earnings ($) $144 -$950 -$1,144 -$650 -$1,950 Incidence of employment (percentage points) 7.0*** 9.8*** 3.7 6.8*** n/a EI benefits ($) $314 $616*** $503** $478*** $1,433*** EI weeks (weeks) 0.9 1.6*** 1.4** 1.3*** 4.0*** Employment Assistance Services (EAS) (n=20,997) Earnings ($) -$969*** -$627** -$602** -$733*** -$2,198*** Incidence of employment (percentage points) 1.7*** 1.6*** 0.8* 1.4*** n/a EI benefits ($) -$530*** -$253*** -$164*** -$315*** -$946*** EI weeks (weeks) -1.5*** -0.6*** -0.4*** -0.8*** -2.5*** Significance level ***1%; **5%; *10% 1 See note 1 under table 1.2.10 British Columbia Table 10. Incremental impacts for Active Claimants in British Columbia (for Active Claimants who started an EBSM between 2007 and 2008) Indicators Post-program period Average annual impact Total impact 1st year 2nd year 3rd year Skills Development (n=4,090) Earnings ($) $2,560*** $5,559*** $6,395*** $4,824*** $14,471*** Incidence of employment (percentage points) 5.8*** 7.2*** 6.9*** 6.6*** n/a EI benefits ($) -$768*** -$448*** -$173** -$463*** -$1,389*** EI weeks (weeks) -2.3*** -1.3*** -0.5*** -1.4*** -4.1*** Targeted Wage Subsidies (n=1,491) Earnings ($) $3,121*** $3,141*** $3,756*** $3,319*** $9,957*** Incidence of employment (percentage points) 7.1*** 5.9*** 6.5*** 6.5*** n/a EI benefits ($) $113 -$161 -$111 -$53 -$158 EI weeks (weeks) 0.5 -0.3 -0.4 -0.1 -0.2 Self-Employment (n=1,764)1 Earnings ($) -$10,521*** -$8,450*** -$7,806*** -$8,915*** -$26,746*** Incidence of employment (percentage points) -17.7*** -13.8*** -13.1*** -14.8*** n/a EI benefits ($) -$1,723*** -$1,155*** -$735*** -$1,204*** -$3,613*** EI weeks (weeks) -4.7*** -3.1*** -1.8*** -3.2*** -9.5*** Job Creation Partnerships Not available due to low sample size. Employment Assistance Services (EAS) (n=28,985) Earnings ($) -$511*** $299*** $801*** $196 $589 Incidence of employment (percentage points) 3.6*** 2.6*** 3.0*** 3.0*** n/a EI benefits ($) -$507*** -$337*** -$298*** -$381*** -$1,142*** EI weeks (weeks) -1.7*** -0.9*** -0.8*** -1.1*** -3.4*** Significance level ***1%; **5%; *10% 1 See note 1 under table 1.2.11 Total Impacts by Province Table 11. Total impacts for Active Claimants by province (for Active Claimants who started an EBSM between 2007 and 2008) Indicators Newfoundland and Labrador Prince Edward Island Nova Scotia New Brunswick Ontario Manitoba Saskatchewan Alberta British Columbia Skills Development Earnings ($) $12,139*** $12,273*** $17,142*** $13,328*** n/a $16,384** $14,517*** $3,324 $14,471*** EI benefits ($) -$1,319*** -$1,038*** -$2,024*** -$960* -$1,219*** -$1,215*** -$541** -$98 -$1,389*** EI weeks (weeks) -6.6*** -2.9*** -6.2*** 0.5 -3.4*** -3.7*** -1.6** -0.7 -4.1*** Targeted Wage Subsidies Earnings ($) $10,795*** Not available due to low sample size. $9,683** $5,051* $7,437** -$2,166 Not available due to low sample size. Not available due to low sample size. $9,957*** EI benefits ($) -$3,961*** -$3,044*** $1,964** $399 -$1,409 -$158 EI weeks (weeks) -9.9*** -9.1*** 7.2*** 1.7 -3.8 -0.2 Self-Employment1 Earnings ($) -$19,520*** Not available due to low sample size. -$28,683*** -$25,149*** -$28,937*** -$31,621*** Not available due to low sample size. -$38,970*** -$26,746*** EI benefits ($) -$9,079*** -$6,436*** -$8,613*** -$3,573*** -$3,541*** -$1,938*** -$3,613*** EI weeks (weeks) -27.9*** -18.0*** -21.7*** -9.6*** -9.3*** -4.9*** -9.5*** Job Creation Partnerships Earnings ($) -$1,815 Not available due to low sample size. $191 JCP was not delivered in New Brunswick during the observed period. $9,051** $13,409*** JCP was not delivered by Saskatchewan during the observed period. -$1,950 Not available due to low sample size. EI benefits ($) -$1,275*** -$1,335* -$829 -$1,106* $1,433*** EI weeks (weeks) -0.2 -4.3* -3.4** -4.1** 4.0*** Employment Assistance Services (EAS) Earnings ($) $5,588*** $2,386** $3,176*** $6,832*** $706 $353 $1,741** -$2,198*** $589 EI benefits ($) -$679*** -$1,481* -$1,698*** $72 -$1,111*** -$851*** -$1,052*** -$946*** -$1,142*** EI weeks (weeks) -1.3*** -3.6*** -5.1*** 1.5** -3.3*** -3.0*** -3.1*** -2.5*** -3.4*** Significance level ***1%; **5%; *10% 1See note 1 under table 1. - Before participation
-
Annex 3.17 – Online resources for EBSMs by province and territory
- Alberta
Provincial website: https://www.alberta.ca/jobs-alberta.aspx
Skill Development Employment Benefit (SD-R): https://www.alberta.ca/employment-training-services-directory.aspx
Skills Development Employment Benefit - Apprenticeship (SD-A): https://www.alberta.ca/apprentic eship.aspx
Self Employment (SE): https://www.alberta.ca/training-work-programs.aspx
Employment Programs (JCPs): https://www.alberta.ca/jobs-alberta.aspx
Employment Assistance Services (EAS): https://www.alberta.ca/employment-services.aspx
Labour Market Partnerships Employer-Sponsored Training (LMPs): https://www.alberta.ca/workforce-partnerships.aspx
- British Columbia
Provincial website: https://www.workbc.ca/Employment-Services.aspx
Skill Development Employment Benefit (SD-R): https://www.workbc.ca/Training-Education.aspx
Skills Development Employment Benefit - Apprenticeship (SD-A)
https://www.workbc.ca/Employment-Services/Apprenticeship-Training-Supports.aspx
http://apply.workbc.ca/intake/locationpicker.aspx?type=APR
Targeted Wage Subsidies (TWS): https://gthiringsolutions.ca/en/nanaimo/services/wage_subsidy
Self Employment (SE):
https://www.workbc.ca/Employment-Services/WorkBC-Centres/Online-Services.aspx
Employment Programs (JCPs): https://www.workbc.ca/employment-services/community-and-employer-partnerships/job-creation-partnerships.aspx
Employment Assistance Services (EAS): https://www.workbc.ca/
Labour Market Partnerships Employer-Sponsored Training (LMPs): https://www.workbc.ca/employment-services/community-and-employer-partnerships/labour-market-partnerships.aspx
Research and Innovation (R&I): https://www.workbc.ca/Employment-Services/Community-and-Employer-Partnerships/Research-and-Innovation.aspx
- Manitoba
Provincial website: https://residents.gov.mb.ca/findingwork.html
Skill Development Employment Benefit (SD-R): https://residents.gov.mb.ca/findingwork.html
Skills Development Employment Benefit - Apprenticeship (SD-A): https://residents.gov.mb.ca/findingwork.html
Targeted Wage Subsidies (TWS): https://residents.gov.mb.ca/findingwork.html
Self Employment (SE): https://residents.gov.mb.ca/findingwork.html
Employment Programs (JCPs): https://residents.gov.mb.ca/findingwork.html
Employment Assistance Services (EAS): https://residents.gov.mb.ca/findingwork.html
Labour Market Partnerships Employer-Sponsored Training (LMPs): https://residents.gov.mb.ca/findingwork.html
Research and Innovation (R&I): https://residents.gov.mb.ca/findingwork.html
- New Brunswick
Provincial website: https://www.nbjobs.ca/
Skill Development Employment Benefit (SD-R): https://www.nbjobs.ca/explore
Skills Development Employment Benefit - Apprenticeship (SD-A): https://www.nbjobs.ca/explore
Targeted Wage Subsidies (TWS): https://www.nbjobs.ca/employers
Self Employment (SE): https://www.nbjobs.ca/self-employment
Employment Programs (JCPs): https://www.nbjobs.ca/employers
Employment Assistance Services (EAS): https://www.nbjobs.ca/
Labour Market Partnerships Employer-Sponsored Training (LMPs): www.nbjobs.ca/employers
- Newfoundland and Labrador
Provincial website: https://www.aesl.gov.nl.ca
Skill Development Employment Benefit (SD-R): https://www.aesl.gov.nl.ca/lmda/skills_dev.html
Skills Development Employment Benefit - Apprenticeship (SD-A): https://www.aesl.gov.nl.ca/lmda/apprenticeship.html
Targeted Wage Subsidies (TWS): https://www.aesl.gov.nl.ca/foremployers/wagesubsidy.html
Self Employment (SE): https://www.aesl.gov.nl.ca/lmda/sea.html
Employment Programs (JCPs): https://www.aesl.gov.nl.ca/lmda/jcp.html
Employment Assistance Services (EAS): https://www.aesl.gov.nl.ca
Labour Market Partnerships Employer-Sponsored Training (LMPs): https://www.aesl.gov.nl.ca/lmda/lmp.html
Research and Innovation (R&I): Delivered by a Third Party external organization. https://www.cna.nl.ca/Research-And-Innovation/
- Nova Scotia
Provincial website: https://www.novascotia.ca/employmentnovascotia
Skill Development Employment Benefit (SD-R): https://www.novascotia.ca/employmentnovascotia/programs/skills-development.asp
Skills Development Employment Benefit - Apprenticeship (SD-A): https://www.novascotia.ca/employmentnovascotia/apprenticeship/
Targeted Wage Subsidies (TWS): https://www.novascotia.ca/employmentnovascotia/programs/start.asp
Self Employment (SE): https://www.novascotia.ca/employmentnovascotia/programs/self-employment.asp
Employment Programs (JCPs): https://www.novascotia.ca/employmentnovascotia/programs/job-creation-partnerships.asp
Employment Assistance Services (EAS): https://www.novascotia.ca/employmentnovascotia/programs/NSWorks.asp
Labour Market Partnerships Employer-Sponsored Training (LMPs): under development
- Nunavut
Provincial website: https://www.gov.nu.ca/education
- Northwest Territories
Provincial website: https://www.ece.gov.nt.ca/en/services/career-and-employment
Skill Development Employment Benefit (SD-R): https://www.ece.gov.nt.ca/en/services/career-and-employment
Skills Development Employment Benefit - Apprenticeship (SD-A): https://www.ece.gov.nt.ca/en/services/career-and-employment
Targeted Wage Subsidies (TWS): https://www.ece.gov.nt.ca/en/services/career-and-employment
Self Employment (SE): https://www.ece.gov.nt.ca/en/services/career-and-employment
Employment Programs (JCPs): https://www.ece.gov.nt.ca/en/services/career-and-employment
Employment Assistance Services (EAS): https://www.ece.gov.nt.ca/en/services/career-and-employment
Labour Market Partnerships Employer-Sponsored Training (LMPs): https://www.ece.gov.nt.ca/en/services/career-and-employment
Research and Innovation (R&I): https://www.ece.gov.nt.ca/en/services/career-and-employment
- Ontario
Provincial website: https://www.ontario.ca/page/employment-ontario
Skill Development Employment Benefit (SD-R): https://www.ontario.ca/page/second-career
Skills Development Employment Benefit - Apprenticeship (SD-A): https://www.ontario.ca/page/apprenticeship-ontario
Targeted Wage Subsidies (TWS): https://www.ontario.ca/page/hiring-incentives-employers
Employment Programs (JCPs): http://www.tcu.gov.on.ca/eng/eopg/programs/jcp.html
Employment Assistance Services (EAS): www.ontario.ca/page/employment-ontario-live-chat
Labour Market Partnerships Employer-Sponsored Training (LMPs):
http://tcu.gov.on.ca/eng/eopg/cojg/
Research and Innovation (R&I): http://www.Ontario.ca
- Prince Edward Island
Provincial website:
Skill Development Employment Benefit (SD-R):
Skills Development Employment Benefit - Apprenticeship (SD-A):
Targeted Wage Subsidies (TWS):
Self Employment (SE):
Employment Programs (JCPs):
Employment Assistance Services (EAS):
Labour Market Partnerships Employer-Sponsored Training (LMPs):
Research and Innovation (R&I):
- Saskatchewan
Provincial website: https://www.saskjobs.ca/
Skill Development Employment Benefit (SD-R): www.saskatchewan.ca/residents/jobs-working-and-training/job-training-and-financial-support-programs
Skills Development Employment Benefit - Apprenticeship (SD-A): http://saskapprenticeship.ca/
Employment Assistance Services (EAS): Does not use websites to deliver services. Agreements are negotiated directly with Service Providers who may use online resources.
Labour Market Partnerships Employer-Sponsored Training (LMPs): Does not use websites to deliver services. Agreements are negotiated directly with Service Providers who may use online resources.
- Quebec
Provincial website: https://www.mtess.gouv.qc.ca/index_en.asp
Skill Development Employment Benefit (SD-R): https://www.quebec.ca/emploi/developpement-des-competences/
Skills Development Employment Benefit - Apprenticeship (SD-A): www.quebec.ca/emploi/metiers-et-professions/
Targeted Wage Subsidies (TWS): https://www.mtess.gouv.qc.ca/index_en.asp
Self Employment (SE): https://www.mtess.gouv.qc.ca/index_en.asp
Employment Programs (JCPs): https://www.mtess.gouv.qc.ca/index_en.asp
Employment Assistance Services (EAS): https://www.emploiquebec.gouv.qc.ca/en/
Labour Market Partnerships Employer-Sponsored Training (LMPs): www.mtess.gouv.qc.ca/index_en.asp
Research and Innovation (R&I): www.mtess.gouv.qc.ca/index_en.asp
- Yukon
Provincial website: www.yukonworkfutures.gov.yk.ca
Skill Development Employment Benefit (SD-R): http://www.education.gov.yk.ca/training.html
Skills Development Employment Benefit - Apprenticeship (SD-A): http://www.education.gov.yk.ca/trades_apprentice.html
Targeted Wage Subsidies (TWS): http://www.education.gov.yk.ca/training.html
Employment Assistance Services (EAS): http://www.education.gov.yk.ca/training.html
Labour Market Partnerships Employer-Sponsored Training (LMPs): http://www.education.gov.yk.ca/training.html
Retrieved on: February 5, 2019 - Alberta