
Employment Insurance Monitoring and Assessment Report for the fiscal year beginning April 1, 2017 and ending March 31, 2018
Annex 2: Employment Insurance benefits data tables
-
Annex 2.1 Employment Insurance benefits - Concepts and definitions
Chapter II and Annex 2 provide information on the numbers of new claims established, the average actual duration, the average weekly benefit rate, the amount paid in benefits, employment insurance claimant categories (long-tenured workers, occasional claimants, frequent claimants), seasonal regular claimants and claim status (active, open, completed, terminated, dormant and combined). These concepts are defined below.
Concept Definition New claims established New claims established refer to new Employment Insurance claims that have been received, processed and approved by Employment and Social Development Canada (via Service Canada) for which at least $1 in benefits was paid to an Employment Insurance claimant.
To avoid double counting, each claim established is counted only once. Thus, a claim that was established, for example, in November 2016 (i.e. in FY1617) and for which benefits paid to an Employment Insurance claimant began in December 2016 (i.e. in FY1617) and ended in June 2017 (i.e. in FY1718) is included in the FY1617 statistics, but is not counted in the FY1718 statistics.
New claims established designate a different concept from new applications submitted to Employment and Social Development Canada (and received by the organization). An application may be submitted, but not necessarily established. This is the case, for example, when the application is rejected because not all of the eligibility requirements are met.
It should be noted that the number of new claims established during a fiscal year does not necessarily correspond to the number of new Employment Insurance claimants because a claimant can have more than one Employment Insurance claim established annually.
New claims established are also referred to under other names such as: new claims established, benefits, claims and claims established. The terms "new," "benefits" and "established" are sometimes omitted so as not to complicate the text. In all cases, these terms refer to the same concept.Average actual duration The average actual duration of Employment Insurance claims refers, in regard to these claims, to the average number of weeks of benefits per claim during which at least one dollar in benefits was paid to an Employment Insurance claimant. For claims associated with most benefits types, the average actual duration is calculated by dividing the sum of the number of weeks of benefits during which at least one dollar was paid per claim by the number of claims that were completed based on the variable assessed (that is, the average actual duration for Ontario is equal to the sum of the number of weeks of benefits paid in Ontario for all claims completed during a fiscal year divided by the number of claims that were completed in Ontario during the same period.
Average actual duration for claims for Employment Insurance fishing benefits, Work-Sharing benefits and family caregiver benefits for children are calculated using claims established during the reference period rather than claims completed during the reference period.
The average actual duration is a different concept than the average maximum duration: the latter is the maximum number of weeks during which benefits may be paid (under sections 12 and 152.14 of the Employment Insurance Act, and Section 8 of the Employment Insurance (Fishing) Regulations), while the former is the number of weeks for which benefits are actually paid.Average weekly benefit rate The average weekly benefit rate, or level of EI benefits, refers to the rate of weekly benefits payable on average for an Employment Insurance claim.
The average weekly benefit rate is calculated by dividing the sum of the weekly benefit rate of each claim by the number of claims that were established.
The Family Supplement is always included in the calculation of the average weekly benefit rate, unless otherwise specified.
The average weekly benefit rate is not necessarily equal to the amount of benefits actually paid on average per claim established. The amount paid may be less than the benefit rate, especially if the weekly benefits are reduced because the claimant worked while on claim (for more information, see subsection 2.2.8 of Chapter II relating to the Working While on Claim provision).Amount paid The amount paid refers to the sum of benefit payments that claimants who have established an Employment Insurance claim have received. In other words, it is the value of Employment Insurance benefits that were paid to Employment Insurance claimants. The amount paid is always reported on a cash basis, meaning that they are reported in the year in which they were paid regardless of when the claim was established. Thus, the amount paid in benefits to an Employment Insurance claimant who, for example, had a claim established in November 2016 (i.e. in FY1617) and received payment starting in December 2016 (i.e. in FY1617) and ending in June 2017 (i.e. in FY1718) are included in the fiscal year statistics for FY1617 and FY1718. If this claimant received $200 per week for 17 weeks between December 2016 and March 2017, and $200 per week for 12 weeks between April and June 2017, an amount of $3,400 will be allocated to FY1617 and $2,400 will be allocated to FY1718. Long-Tenured workers Long-Tenured workers are Employment Insurance (EI) claimants who have paid at least 30% of the maximum annual EI premiums in 7 of the past 10 years and who, over the last five years, have collected EI regular or fishing benefits for 35 weeks or less. Frequent claimants Frequent claimants are EI claimants who have had three or more EI regular or fishing claims and have collected benefits for a total of more than 60 weeks in the past five years. Occasional claimants Occasional claimants are EI claimants who do not meet the requirements for either long-tenured workers or frequent claimants. Seasonal claimants Seasonal claimants are individuals who established three or more regular or fishing claims in the five fiscal years preceding the reference year, of which at least two were established at the same time of year as their claim in the reference year.
A claim is considered to have been established at the same time of year if it was established between eight weeks before and eight weeks after the week in which the reference year claim was established.Active claims Active claims are claims for which benefits are still being paid during the reference period.
With regards to the subsection 2.2.4 Extension of Employment Insurance regular benefits for workers in regions affected by the downturn in commodity prices, active claims represent those that were established after January 4, 2015 in the 15 EI economic regions targeted by the Budget Implementation Act, 2016, No.1 and that were still open by the time the implementation act came into effect on July 3, 2016.Open claims Open claims are those for which the claimants are still receiving or still can receive EI benefits. Completed claims Completed claims refer to claims that are terminated and those that are dormant. Terminated claims Terminated claims are those that have ended and for which claimants are no longer eligible to receive Employment Insurance benefits. The main reasons associated with the termination of claims is either that all weeks of benefits the claimant was entitled to be paid or that the claim reached the last week of the benefit period, that is the last week for which Employment Insurance benefits could be paid. Dormant claims Dormant claims are those that, as of August of the reference year following the reporting fiscal year, are open but are not active. Combined or mixed claims A combined or mixed claim refers to an Employment Insurance claim for which the claimant receives more than one type of benefit during the claimant’s benefit period. The eight types of benefits available under the Employment Insurance program as stipulated in Chapter II and Annex 2 are: regular benefits, fishing benefits, maternity benefits, parental benefits, sickness benefits, compassionate care benefits, family caregiver benefit for adults, family caregiver benefit for children and Work-Sharing benefits. Regular and fishing benefits can never be combined in the same claim.
A claim for which a claimant receives both regular benefits and maternity benefits during its benefit period is treated as two separate claims in cases where information on regular benefits or maternity benefits is reported separately (as in the case of Annexes 2.5 and 2.14, which report data on the two types of benefits separately; in this example, each of the two annexes would add one claim to its totals). Conversely, if aggregated information is presented, the claim is considered a single claim (as in the case of Annex 2.3, which presents data on all Employment Insurance benefits). -
Annex 2.2 Employment Insurance maximum number of benefit weeks entitlement
Employment Insurance maximum number of benefit weeks entitlement Number of hours of insurable employment in qualifying period Regional rate of unemployment 6% and under More than 6% but not more than 7% More than 7% but not more than 8% More than 8% but not more than 9% More than 9% but not more than 10% More than 10% but not more than 11% More than 11% but not more than 12% More than 12% but not more than 13% More than 13% but not more than 14% More than 14% but not more than 15% More than 15% but not more than 16% More than 16% 420-454 0 0 0 0 0 0 0 0 26 28 30 32 455-489 0 0 0 0 0 0 0 24 26 28 30 32 490-524 0 0 0 0 0 0 23 25 27 29 31 33 525-559 0 0 0 0 0 21 23 25 27 29 31 33 560-594 0 0 0 0 20 22 24 26 28 30 32 34 595-629 0 0 0 18 20 22 24 26 28 30 32 34 630-664 0 0 17 19 21 23 25 27 29 31 33 35 665-699 0 15 17 19 21 23 25 27 29 31 33 35 700-734 14 16 18 20 22 24 26 28 30 32 34 36 735-769 14 16 18 20 22 24 26 28 30 32 34 36 770-804 15 17 19 21 23 25 27 29 31 33 35 37 805-839 15 17 19 21 23 25 27 29 31 33 35 37 840-874 16 18 20 22 24 26 28 30 32 34 36 38 875-909 16 18 20 22 24 26 28 30 32 34 36 38 910-944 17 19 21 23 25 27 29 31 33 35 37 39 945-979 17 19 21 23 25 27 29 31 33 35 37 39 980-1,014 18 20 22 24 26 28 30 32 34 36 38 40 1,015-1,049 18 20 22 24 26 28 30 32 34 36 38 40 1,050-1,084 19 21 23 25 27 29 31 33 35 37 39 41 1,085-1,119 19 21 23 25 27 29 31 33 35 37 39 41 1,120-1,154 20 22 24 26 28 30 32 34 36 38 40 42 1,155-1,189 20 22 24 26 28 30 32 34 36 38 40 42 1,190-1,224 21 23 25 27 29 31 33 35 37 39 41 43 1,225-1,259 21 23 25 27 29 31 33 35 37 39 41 43 1,260-1,294 22 24 26 28 30 32 34 36 38 40 42 44 1,295-1,329 22 24 26 28 30 32 34 36 38 40 42 44 1,330-1,364 23 25 27 29 31 33 35 37 39 41 43 45 1,365-1,399 23 25 27 29 31 33 35 37 39 41 43 45 1,400-1,434 24 26 28 30 32 34 36 38 40 42 44 45 1,435-1,469 25 27 29 31 33 35 37 39 41 43 45 45 1,470-1,504 26 28 30 32 34 36 38 40 42 44 45 45 1,505-1,539 27 29 31 33 35 37 39 41 43 45 45 45 1,540-1,574 28 30 32 34 36 38 40 42 44 45 45 45 1,575-1,609 29 31 33 35 37 39 41 43 45 45 45 45 1,610-1,644 30 32 34 36 38 40 42 44 45 45 45 45 1,645-1,679 31 33 35 37 39 41 43 45 45 45 45 45 1,680-1,714 32 34 36 38 40 42 44 45 45 45 45 45 1,715-1,749 33 35 37 39 41 43 45 45 45 45 45 45 1,750-1,784 34 36 38 40 42 44 45 45 45 45 45 45 1,785-1,819 35 37 39 41 43 45 45 45 45 45 45 45 1,820+ 36 38 40 42 44 45 45 45 45 45 45 45 Source: Employment Insurance Act, Schedule I.
-
Annex 2.3 Employment Insurance benefits
Annex 2.3.1 Employment Insurance benefits: New claims established1 Province or territory FY1314 FY1415 FY1516 FY1617 FY1718 Change (%) FY1617 to FY1718 Newfoundland and Labrador 82,040 81,230 85,910 74,000 81,090 +9.6 Prince Edward Island 21,330 21,950 22,140 22,540 22,720 +0.8 Nova Scotia 78,610 79,550 82,410 82,710 85,300 +3.1 New Brunswick 85,620 85,020 88,670 88,910 91,130 +2.5 Quebec 492,840 491,160 496,680 483,700 482,990 -0.1 Ontario 572,990 561,200 569,620 552,030 562,570 +1.9 Manitoba 56,620 57,000 64,660 59,250 61,440 +3.7 Saskatchewan 44,400 47,840 57,110 49,850 51,250 +2.8 Alberta 146,070 169,840 235,470 201,610 170,270 -15.5 British Columbia 205,300 208,320 216,790 197,770 200,820 +1.5 Yukon 2,560 2,450 2,410 2,300 2,200 -4.3 Northwest Territories 2,310 2,250 2,320 2,380 2,420 +1.7 Nunavut 1,260 990 1,230 1,290 1,340 +3.9 Gender Men 976,920 994,200 1,075,810 984,150 974,660 -1.0 Women 815,030 814,600 849,610 834,190 840,880 +0.8 Age 24 years old and under 182,350 181,910 194,270 178,010 172,810 -2.9 25 to 44 years old 860,520 871,570 933,430 883,950 876,270 -0.9 45 to 54 years old 399,020 391,140 402,020 370,360 363,410 -1.9 55 years old and over 350,060 364,180 395,700 386,020 403,050 +4.4 EI claimant category2 Long-tenured workers 461,460 412,320 600,900 543,960 525,560 -3.4 Occasional claimants 991,310 1,063,380 988,250 960,300 970,360 +1.0 Frequent claimants 339,180 333,100 336,270 314,080 319,620 +1.8 Canada 1,791,950 1,808,800 1,925,420 1,818,340 1,815,540 -0.2 - Note: Includes claims for which at least $1 of EI benefits was paid.
- 1 Excludes Parents of Critically Ill Children/Caregiver benefits due to the incompatibility of administrative data sources.
- 2 See Annex 2.1 for definitions related to EI claimant categories.
- Source: Employment and Social Development Canada, Employment Insurance (EI) administrative data. Data are based on a 10% sample of EI administrative data.
Annex 2.3.2 – Employment Insurance benefits: Average weekly benefit rate1,2 ($) Province or territory FY1314 FY1415 FY1516 FY1617 FY1718 Change (%) FY1617 to FY1718 Newfoundland and Labrador 422 435 448 445 456 +2.5 Prince Edward Island 403 416 428 432 436 +1.0 Nova Scotia 404 419 425 426 431 +1.0 New Brunswick 402 412 424 426 431 +1.3 Quebec 409 420 428 433 443 +2.2 Ontario 419 431 441 451 458 +1.7 Manitoba 408 422 435 440 444 +0.9 Saskatchewan 432 452 466 465 467 +0.5 Alberta 453 472 486 485 487 +0.4 British Columbia 416 429 442 447 454 +1.7 Yukon 472 474 490 498 502 +0.9 Northwest Territories 489 495 505 510 519 +1.9 Nunavut 464 469 472 485 501 +3.2 Gender Men 443 457 469 473 480 +1.5 Women 387 398 409 416 422 +1.5 Age 24 years old and under 380 394 407 400 403 +0.8 25 to 44 years old 429 442 455 460 467 +1.4 45 to 54 years old 420 434 446 452 460 +1.7 55 years old and over 405 417 428 433 440 +1.6 EI claimant category3 Long-tenured workers 453 468 477 485 490 +1.0 Occasional claimants 397 414 419 422 429 +1.7 Frequent claimants 428 439 449 457 467 +2.2 Canada 417 431 443 447 453 +1.5 - Note: Percentage change is based on unrounded numbers. Includes claims for which at least $1 of EI benefits was paid.
- 1 Excludes Parents of Critically Ill Children/Caregiver benefits due to the incompatibility of administrative data sources.
- 2 Takes into account Family Supplement top-ups paid to Employment Insurance claimants.
- 3 See Annex 2.1 for definitions related to EI claimant categories.
- Source: Employment and Social Development Canada, Employment Insurance (EI) administrative data. Data are based on a 10% sample of EI administrative data.
Annex 2.3.3 – Employment Insurance benefits: Amount paid1 ($ million) Province or territory FY1314 FY1415 FY1516 FY1617 FY1718 Change (%) FY1617 to FY1718 Newfoundland and Labrador 837.8 862.8 958.6 1,040.2 1,185.2 +13.9 Prince Edward Island 200.0 211.4 228.1 230.7 248.1 +7.5 Nova Scotia 738.7 748.1 833.0 841.3 892.2 +6.0 New Brunswick 828.0 824.0 904.0 919.0 954.0 +3.8 Quebec 3,374.2 3,507.1 3,649.7 3,430.7 3,558.2 +3.7 Ontario 5,241.9 5,270.5 5,478.3 5,443.2 5,657.7 +3.9 Manitoba 482.8 498.2 573.4 587.3 631.3 +7.5 Saskatchewan 413.9 437.4 572.7 671.5 700.9 +4.4 Alberta 1,383.6 1,507.0 2,362.3 3,158.3 2,655.3 -15.9 British Columbia 1,798.0 1,862.8 2,031.1 2,064.2 2,089.5 +1.2 Yukon 29.5 30.4 25.9 27.3 27.8 +1.6 Northwest Territories 31.4 29.3 28.8 29.9 30.9 +3.2 Nunavut 18.1 15.1 16.2 17.6 23.6 +33.9 Gender Men 7,872.5 8,088.4 9,411.7 9,868.8 9,678.0 -1.9 Women 7,505.4 7,715.7 8,250.3 8,592.2 8,976.6 +4.5 Age 24 years old and under 1,319.7 1,316.1 1,523.7 1,522.2 1,443.0 -5.2 25 to 44 years old 8,281.6 8,525.3 9,497.1 9,869.4 9,908.0 +0.4 45 to 54 years old 3,050.6 3,069.2 3,341.4 3,450.0 3,431.5 -0.5 55 years old and over 2,726.1 2,893.5 3,299.8 3,619.4 3,872.1 +7.0 EI claimant category2 Long-tenured workers 4,424.0 3,919.7 5,516.7 6,220.4 5,890.2 -5.3 Occasional claimants 7,860.5 8,774.0 8,877.8 9,048.8 9,288.2 +2.6 Frequent claimants 3,093.3 3,110.4 3,267.6 3,191.8 3,476.3 +8.9 Canada 15,377.9 15,804.1 17,662.0 18,461.0 18,654.7 +1.0 - Note: Data may not add up to the total due to rounding. Percentage change is based on unrounded numbers. Includes claims for which at least $1 of EI benefits was paid.
- 1 Excludes Parents of Critically Ill Children/Caregiver benefits due to the incompatibility of administrative data sources.
- 2 See Annex 2.1 for definitions related to EI claimant categories.
- Source: Employment and Social Development Canada, Employment Insurance (EI) administrative data. Data are based on a 10% sample of EI administrative data.
-
Annex 2.4 Employment Insurance benefits (by Employment Insurance economic region)
Annex 2.4.1 – Employment Insurance benefits by EI economic region1: New claims established EI economic region FY1314 FY1415 FY1516 FY1617 FY1718 Change (%) FY1617 to FY1718 Newfoundland and Labrador St. John's 13,990 14,810 16,190 16,210 16,620 +2.5 Newfoundland - Labrador 68,050 66,420 69,720 57,790 64,470 +11.6 Prince Edward Island Prince Edward Island2 21,330 9,530 n/a n/a n/a n/a Charlottetown2 n/a 2,960 5,470 5,860 5,570 -4.9 Prince Edward Island2 n/a 9,460 16,670 16,680 17,150 +2.8 Nova Scotia Eastern Nova Scotia 27,010 27,660 28,370 28,580 30,060 +5.2 Western Nova Scotia 34,090 33,860 35,120 34,740 35,660 +2.6 Halifax 17,510 18,030 18,920 19,390 19,580 +1.0 New Brunswick Fredericton-Moncton-Saint-John 26,370 26,280 28,070 27,670 28,250 +2.1 Madawaska-Charlotte 14,520 14,250 14,270 13,880 14,380 +3.6 Restigouche-Albert 44,730 44,490 46,330 47,360 48,500 +2.4 Quebec Gaspésie-Îles-de-la-Madeleine 27,240 26,520 27,320 27,780 27,900 +0.4 Quebec 39,040 40,290 40,400 38,730 40,490 +4.5 Trois-Rivières 10,700 9,900 10,060 9,550 9,650 +1.0 South Central Quebec 10,590 9,760 9,190 9,950 8,780 -11.8 Sherbrooke 9,690 10,850 10,060 9,870 10,150 +2.8 Montérégie 31,260 30,970 33,220 32,400 31,710 -2.1 Montréal 176,260 176,270 179,760 174,100 174,490 +0.2 Central Quebec 87,370 87,010 87,800 86,170 86,950 +0.9 North Western Quebec 22,690 23,260 22,520 21,010 21,210 +1.0 Bas-Saint-Laurent-Côte-Nord 52,600 49,550 50,290 49,020 47,100 -3.9 Hull 12,860 13,420 13,320 12,980 12,630 -2.7 Chicoutimi-Jonquière 12,540 13,360 12,740 12,140 11,930 -1.7 Ontario Ottawa 33,380 33,180 34,370 33,210 32,610 -1.8 Eastern Ontario 26,590 26,590 27,780 26,630 26,410 -0.8 Kingston 5,790 5,730 5,110 5,520 5,140 -6.9 Central Ontario 60,790 58,200 61,340 60,350 59,150 -2.0 Oshawa 17,820 17,890 17,760 17,770 18,760 +5.6 Toronto 213,260 207,290 211,410 205,510 204,230 -0.6 Hamilton 29,520 29,230 29,400 29,650 29,240 -1.4 St. Catharines 22,220 19,580 20,760 20,330 20,380 +0.2 London 20,550 19,400 18,920 19,270 20,780 +7.8 Niagara 17,410 17,520 18,080 17,240 17,280 +0.2 Windsor 14,420 19,480 13,630 12,200 19,440 +59.3 Kitchener 22,420 20,450 20,340 20,980 21,820 +4.0 Huron 17,680 17,570 17,710 20,100 19,450 -3.2 South Central Ontario 19,740 18,560 19,210 19,310 21,680 +12.3 Sudbury 8,150 7,870 8,760 7,290 7,430 +1.9 Thunder Bay 6,440 6,510 6,540 6,000 6,370 +6.2 Northern Ontario 36,810 36,150 38,500 30,670 32,400 +5.6 Manitoba Winnipeg 31,920 31,990 36,060 32,910 34,580 +5.1 Southern Manitoba 15,060 15,120 18,200 17,150 17,180 +0.2 Northern Manitoba 9,640 9,890 10,400 9,190 9,680 +5.3 Saskatchewan Regina 7,800 8,510 9,830 10,260 10,470 +2.0 Saskatoon 11,360 12,220 14,780 13,940 13,430 -3.7 Southern Saskatchewan 11,660 13,080 15,310 12,210 12,750 +4.4 Northern Saskatchewan 13,580 14,030 17,190 13,440 14,600 +8.6 Alberta Calgary 46,710 54,040 74,310 63,390 55,710 -12.1 Edmonton 50,510 57,710 81,150 67,740 61,260 -9.6 Northern Alberta 12,180 14,890 20,620 22,770 13,900 -39.0 Southern Alberta 36,670 43,200 59,390 47,710 39,400 -17.4 British Columbia Southern Interior British Columbia 38,040 38,600 43,030 36,590 36,700 +0.3 Abbotsford 11,120 10,690 10,790 11,090 10,750 -3.1 Vancouver 91,040 90,310 90,370 84,900 87,510 +3.1 Victoria 12,560 12,660 12,990 12,090 12,870 +6.5 Southern Coastal British Columbia 30,310 30,380 32,410 31,280 30,000 -4.1 Northern British Columbia 22,230 25,680 27,200 21,820 22,990 +5.4 Territories Yukon2 2,560 1,120 n/a n/a n/a n/a Whitehorse2 n/a 740 1,560 1,420 1,340 -5.6 Yukon (excluding Whitehorse)2 n/a 590 850 880 860 -2.3 Northwest Territories2 2,310 1,330 n/a n/a n/a n/a Yellowknife2 n/a 310 810 870 840 -3.4 Northwest Territories (excluding Yellowknife)2 n/a 610 1,510 1,510 1,580 +4.6 Nunavut2 1,260 510 n/a n/a n/a n/a Iqualuit2 n/a 100 300 230 320 +39.1 Nunavut (excluding Iqaluit)2 n/a 380 930 1,060 1,020 -3.8 Canada 1,791,950 1,808,800 1,925,420 1,818,340 1,815,540 -0.2 - Note: Includes claims for which at least $1 of EI benefits was paid.
- 1 Excludes Parents of Critically Ill children/Caregiver benefits due to incompatibility of administrative data sources
- 2 As of October 12, 2014, there is a total of 62 EI economic regions, instead of 58 regions. The EI economic regions of Prince Edward Island, Yukon, the Northwest Territories and Nunavut were each divided into two EI economic regions, one consisting of the capital area and the remaining consisting of the non-capital area.
- Source: Employment and Social Development Canada, Employment Insurance (EI) administrative data. Data are based on a 10% sample of EI administrative data.
Annex 2.4.2 – Employment Insurance benefits by EI economic region: Average weekly benefit rate1,2 ($) EI economic region FY1314 FY1415 FY1516 FY1617 FY1718 Change (%) FY1617 to FY1718 Newfoundland and Labrador St. John's 430 441 456 464 463 -0.3 Newfoundland - Labrador 421 434 447 440 454 +3.3 Prince Edward Island Prince Edward Island3 403 409 n/a n/a n/a n/a Charlottetown3 n/a 402 413 406 405 -0.2 Prince Edward Island3 n/a 428 433 441 446 +1.3 Nova Scotia Eastern Nova Scotia 419 435 439 440 446 +1.3 Western Nova Scotia 392 407 413 416 418 +0.6 Halifax 405 415 426 425 431 +1.4 New Brunswick Fredericton-Moncton-Saint-John 392 403 414 416 424 +1.9 Madawaska-Charlotte 391 398 411 411 420 +2.2 Restigouche-Albert 413 421 434 436 439 +0.6 Quebec Gaspésie-Îles-de-la-Madeleine 421 432 437 443 451 +1.8 Quebec 417 427 435 441 454 +3.1 Trois-Rivières 400 409 415 419 436 +3.8 South Central Quebec 406 419 429 437 443 +1.4 Sherbrooke 403 412 418 430 435 +1.0 Montérégie 403 415 424 432 439 +1.7 Montréal 407 419 427 433 442 +2.2 Central Quebec 401 412 420 426 436 +2.5 North Western Quebec 417 428 433 438 446 +1.7 Bas-Saint-Laurent-Côte-Nord 417 425 433 435 445 +2.4 Hull 422 431 439 452 458 +1.3 Chicoutimi-Jonquière 408 422 423 427 437 +2.1 Ontario Ottawa 435 448 455 465 468 +1.0 Eastern Ontario 409 424 431 441 440 -0.1 Kingston 409 425 421 437 441 +1.1 Central Ontario 407 419 432 444 448 +0.9 Oshawa 429 449 452 466 475 +2.1 Toronto 422 433 445 455 464 +2.1 Hamilton 425 433 444 455 464 +2.1 St. Catharines 399 409 413 428 434 +1.4 London 414 426 427 439 450 +2.6 Niagara 411 425 438 444 455 +2.7 Windsor 404 448 437 433 467 +8.1 Kitchener 427 438 444 458 459 +0.4 Huron 414 421 435 441 449 +1.9 South Central Ontario 418 429 440 455 461 +1.2 Sudbury 426 434 453 453 455 +0.7 Thunder Bay 438 439 459 467 474 +1.6 Northern Ontario 424 432 445 442 451 +2.1 Manitoba Winnipeg 411 425 436 448 447 0.0 Southern Manitoba 401 416 434 432 441 +2.1 Northern Manitoba 410 417 435 428 438 +2.6 Saskatchewan Regina 448 457 466 480 476 -0.7 Saskatoon 434 459 466 469 471 +0.5 Southern Saskatchewan 421 444 464 459 468 +1.8 Northern Saskatchewan 429 450 467 455 457 +0.7 Alberta Calgary 456 473 485 484 485 +0.4 Edmonton 458 474 489 492 495 +0.9 Northern Alberta 462 484 494 498 494 -0.5 Southern Alberta 440 465 479 472 475 +0.7 British Columbia Southern Interior British Columbia 422 434 450 443 455 +2.9 Abbotsford 366 383 391 407 409 +0.6 Vancouver 413 424 435 451 456 +1.2 Victoria 426 436 450 453 463 +2.2 Southern Coastal British Columbia 419 433 444 443 451 +1.9 Northern British Columbia 438 454 467 459 467 +1.8 Territories Yukon3 472 471 n/a n/a n/a n/a Whitehorse3 n/a 478 485 504 503 -0.1 Yukon (excluding Whitehorse)3 n/a 474 498 487 501 +2.7 Northwest Territories3 489 488 n/a n/a n/a n/a Yellowknife3 n/a 499 505 511 523 +2.4 Northwest Territories (excluding Yellowknife)3 n/a 507 506 509 517 +1.6 Nunavut3 464 464 n/a n/a n/a n/a Iqualuit3 n/a 497 499 524 517 -1.4 Nunavut (excluding Iqaluit)3 n/a 470 463 477 496 +5.3 Canada 417 431 443 447 453 +1.5 - Note: Percentage change is based on unrounded numbers. Includes claims for which at least $1 of EI benefits was paid.
- 1 Excludes Parents of Critically Ill children/Caregiver benefits due to incompatibility of administrative data sources
- 2 Takes into account Family Supplement top-ups paid to Employment Insurance claimants.
- 3 As of October 12, 2014, there is a total of 62 EI economic regions, instead of 58 regions. The EI economic regions of Prince Edward Island, Yukon, the Northwest Territories and Nunavut were each divided into two EI economic regions, one consisting of the capital area and the remaining consisting of the non-capital area.
- Source: Employment and Social Development Canada, Employment Insurance (EI) administrative data. Data are based on a 10% sample of EI administrative data.
Annex 2.4.3 – Employment Insurance benefits by EI economic region: Amount paid1 ($ million) EI economic region FY1314 FY1415 FY1516 FY1617 FY1718 Change (%) FY1617 to FY1718 Newfoundland and Labrador St. John's 120.1 130.5 146.2 167.4 191.6 +14.4 Newfoundland - Labrador 717.7 732.4 812.4 872.7 993.6 +13.8 Prince Edward Island Prince Edward Island2 200.0 153.1 13.1 n/a n/a n/a Charlottetown2 n/a 11.1 46.9 52.3 50.1 -4.3 Prince Edward Island2 n/a 47.1 168.1 178.4 198.0 +11.0 Nova Scotia Eastern Nova Scotia 286.6 286.4 328.9 335.5 362.0 +7.9 Western Nova Scotia 300.1 298.5 321.4 322.3 337.6 +4.8 Halifax 151.9 163.1 182.6 183.5 192.5 +4.9 New Brunswick Fredericton-Moncton-Saint-John 222.1 225.5 257.6 263.4 259.3 -1.5 Madawaska-Charlotte 132.3 120.5 125.2 117.1 124.6 +6.4 Restigouche-Albert 473.7 478.0 521.2 538.5 570.1 +5.9 Quebec Gaspésie-Îles-de-la-Madeleine 271.7 273.8 291.4 290.4 322.5 +11.1 Quebec 221.6 240.7 259.0 237.7 254.8 +7.2 Trois-Rivières 69.3 65.3 66.6 58.2 63.4 +9.0 South Central Quebec 53.1 57.6 57.0 53.5 51.9 -2.9 Sherbrooke 54.2 67.2 66.7 61.9 62.1 +0.2 Montérégie 188.1 195.7 218.8 207.6 210.1 +1.2 Montréal 1,211.3 1,289.1 1,331.2 1,273.9 1,288.5 +1.1 Central Quebec 566.1 569.7 585.3 533.1 596.1 +11.8 North Western Quebec 178.1 176.4 180.1 164.2 163.6 -0.3 Bas-Saint-Laurent-Côte-Nord 398.0 390.9 397.4 372.8 370.3 -0.7 Hull 80.0 89.7 95.1 91.9 91.4 -0.5 Chicoutimi-Jonquière 82.7 91.0 101.0 85.6 83.6 -2.4 Ontario Ottawa 322.4 333.4 352.9 341.9 344.7 +0.8 Eastern Ontario 207.6 217.3 238.4 229.5 231.2 +0.7 Kingston 48.4 51.4 46.0 48.1 47.7 -0.9 Central Ontario 485.5 487.6 503.2 505.7 541.4 +7.1 Oshawa 159.0 162.7 167.4 167.5 181.8 +8.5 Toronto 2,149.4 2,161.6 2,224.3 2,178.7 2,244.7 +3.0 Hamilton 251.7 258.6 275.6 275.9 289.9 +5.1 St. Catharines 171.9 164.1 163.1 168.8 174.3 +3.2 London 182.2 179.3 174.5 169.7 193.3 +13.9 Niagara 158.4 142.2 166.7 154.9 159.5 +3.0 Windsor 133.7 129.6 147.5 108.2 125.7 +16.2 Kitchener 197.0 202.2 194.7 199.1 210.4 +5.6 Huron 133.9 142.4 148.1 162.2 166.0 +2.4 South Central Ontario 169.8 165.2 169.4 177.3 189.2 +6.7 Sudbury 68.5 69.2 75.4 94.2 84.0 -10.8 Thunder Bay 48.5 54.5 55.9 55.3 57.3 +3.6 Northern Ontario 354.1 349.1 375.2 406.2 416.7 +2.6 Manitoba Winnipeg 271.3 272.4 321.0 312.1 332.4 +6.5 Southern Manitoba 112.5 122.1 143.0 152.5 155.0 +1.6 Northern Manitoba 99.0 103.6 109.3 122.6 144.0 +17.4 Saskatchewan Regina 71.1 76.8 93.7 106.6 118.0 +10.6 Saskatoon 99.8 111.3 144.1 177.0 187.0 +5.6 Southern Saskatchewan 99.0 106.2 142.8 169.9 170.9 +0.6 Northern Saskatchewan 144.0 143.0 192.2 217.9 225.0 +3.3 Alberta Calgary 474.1 510.1 786.2 1,057.4 917.0 -13.3 Edmonton 466.9 515.4 781.3 1,037.9 922.1 -11.2 Northern Alberta 122.6 139.3 225.5 323.4 236.9 -26.8 Southern Alberta 320.0 342.3 569.3 739.5 579.3 -21.7 British Columbia Southern Interior British Columbia 302.7 321.9 386.2 439.6 433.6 -1.4 Abbotsford 86.9 86.7 88.6 93.0 93.3 +0.4 Vancouver 834.7 852.0 866.0 830.6 867.7 +4.5 Victoria 113.4 115.5 124.0 119.8 119.5 -0.2 Southern Coastal British Columbia 250.2 258.9 297.7 279.6 281.9 +0.8 Northern British Columbia 210.0 227.9 268.6 301.6 293.4 -2.7 Territories Yukon2 29.5r 24.0r 2.7r n/a r n/a n/a Whitehorse2 n/a 3.2 14.3r 18.4r 19.0 +3.1 Yukon (excluding Whitehorse)2 n/a r 3.2r 9.0r 8.9r 8.8 -1.5 Northwest Territories2 31.4r 24.8r 3.6r n/a r n/a n/a Yellowknife2 n/a 1.2r 7.7r 10.1r 9.3 -7.3 Northwest Territories (excluding Yellowknife)2 n/a 3.3 17.5 19.8 21.5 +8.5 Nunavut2 18.1 12.8 1.3 n/a n/a n/a Iqualuit2 n/a 0.6 2.7 3.0 4.1 +36.4 Nunavut (excluding Iqaluit)2 n/a 1.7 12.1 14.6 19.5 +33.4 Canada 15,377.9 15,804.1 17,662.0 18,461.0 18,654.7 +1.0 - Note: Data may not add up to the total due to rounding. Percentage change is based on unrounded numbers. Includes claims for which at least $1 of EI benefits was paid.
- 1 Excludes Parents of Critically Ill Children/Caregiver benefits due to incompatibility of administrative data sources
- 2 As of October 12, 2014, there is a total of 62 Employment Insurance (EI) economic regions, instead of 58 regions. The EI economic regions of Prince Edward Island, Yukon, the Northwest Territories and Nunavut were each divided into two EI economic regions, one consisting of the capital area and the remaining consisting of the non-capital area. Amounts paid were registered in FY1516 in the four former EI economic regions in spite of the change in EI economic region boundaries because some claims established just prior to that change had continued to be paid in FY1516.
- r Revised.
- Source: Employment and Social Development Canada, Employment Insurance (EI) administrative data. Data are based on a 10% sample of EI administrative data.
-
Annex 2.5 Regular benefits
Annex 2.5.1 – Regular benefits: New claims established Province or territory FY1314 FY1415 FY1516 FY1617 FY1718 Change (%) FY1617 to FY1718 Newfoundland and Labrador 63,290 63,410 67,880 55,590 62,170 +11.8 Prince Edward Island 16,040 16,560 16,790 16,910 16,430 -2.8 Nova Scotia 59,530 60,730 62,020 62,610 63,880 +2.0 New Brunswick 69,450 68,930 72,030 70,120 70,610 +0.7 Quebec 424,230 423,840 422,200 405,460 399,080 -1.6 Ontario 401,030 391,380 390,830 366,810 373,130 +1.7 Manitoba 35,640 37,280 41,810 39,310 40,230 +2.3 Saskatchewan 27,390 31,500 39,580 34,090 35,190 +3.2 Alberta 84,000 105,780 167,800 141,140 112,400 -20.4 British Columbia 140,810 139,040 146,080 124,830 122,410 -1.9 Yukon 2,020 1,880 1,840 1,750 1,610 -8.0 Northwest Territories 1,530 1,680 1,550 1,740 1,760 +1.1 Nunavut 850 600 680 770 810 +5.2 Gender Men 808,040 826,410 896,610 806,660 788,880 -2.2 Women 517,770 516,200 534,480 514,470 510,830 -0.7 Age 24 years old and under 129,400 129,700 140,640 126,880 118,750 -6.4 25 to 44 years old 580,650 592,390 639,540 588,420 571,930 -2.8 45 to 54 years old 330,230 323,840 329,800 298,500 289,420 -3.0 55 years old and over 285,530 296,680 321,110 307,330 319,610 +4.0 EI claimant category1 Long-tenured workers 285,000 261,760 380,460 329,290 310,270 -5.8 Occasional claimants 731,030 776,150 742,840 706,150 699,370 -1.0 Frequent claimants 309,780 304,700 307,790 285,690 290,070 +1.5 Canada 1,325,810 1,342,610 1,431,090 1,321,130 1,299,710 -1.6 - Note: Includes claims for which at least $1 of EI regular benefits was paid.
- 1 See Annex-2.1 for definitions related to EI claimant categories.
- Source: Employment and Social Development Canada, Employment Insurance (EI) administrative data. Data are based on a 10% sample of EI administrative data.
Annex 2.5.2 – Regular benefits: Average actual duration (number of weeks) Province or territory FY1314 FY1415 FY1516 FY1617 FY1718p Change (%)
FY1617 to FY1718Newfoundland and Labrador 26.2 25.8 26.0 31.8r 32.4 +1.8 Prince Edward Island 23.5 22.8 23.3 23.3r 22.9 -1.5 Nova Scotia 23.9 23.1 23.7 23.3r 22.5 -3.2 New Brunswick 23.7 23.8 24.0 23.6r 22.3 -5.6 Quebec 18.5 18.7 18.6 18.2r 16.7 -8.4 Ontario 19.7 19.0 18.3 18.9r 17.4 -7.5 Manitoba 17.8 17.2 17.9 19.3r 19.1 -1.2 Saskatchewan 18.3 18.2 18.3 24.8r 25.9 +4.2 Alberta 15.9 16.4 17.4 24.5 28.4 +15.8 British Columbia 19.0 18.5 18.4 20.3r 19.7 -2.8 Yukon 23.2 24.2 21.6 21.0r 21.4 +2.0 Northwest Territories 26.2 24.2 26.6 21.6r 22.3 +3.3 Nunavut 27.2 31.4 27.0 31.2r 32.6 +4.6 Gender Men 19.7 19.6 19.6 20.9r 20.3 -3.0 Women 19.7 19.2 18.9 20.3r 19.7 -2.6 Age 24 years old and under 17.8 17.6 17.6 18.7r 17.5 -6.3 25 to 44 years old 18.9 18.6 18.5 19.6r 19.1 -2.9 45 to 54 years old 20.2 19.9 19.8 21.4r 20.8 -2.9 55 years old and over 21.5 21.3 21.1 22.9r 22.3 -2.7 EI claimant category1 Long-tenured workers 18.7 18.0 17.4 20.0 21.0 +4.8 Occasional claimants 19.0 18.9 19.0 20.1r 18.9 -5.7 Frequent claimants 22.2 22.0 22.1 23.1r 21.9 -5.1 Canada 19.7 19.4 19.3 20.7r 20.1 -2.9 - Note: Percentage change is based on unrounded numbers. Includes claims for which at least $1 of EI regular benefits was paid. Based on completed claims which include those that are terminated and those that are dormant and remained inactive as of August the following fiscal year.
- 1 See Annex-2.1 for definitions related to EI claimant categories.
- r Revised.
- p Preliminary.
- Source: Employment and Social Development Canada, Employment Insurance (EI) administrative data. Data are based on a 10% sample of EI administrative data.
Annex 2.5.3 – Regular benefits: Average weekly benefit rate1 ($) Province or territory FY1314 FY1415 FY1516 FY1617 FY1718 Change (%)
FY1617 to FY1718Newfoundland and Labrador 417 430 444 434 447 +3.1 Prince Edward Island 395 407 419 419 426 +1.8 Nova Scotia 400 417 423 422 427 +1.1 New Brunswick 403 413 426 430 437 +1.7 Quebec 414 426 434 440 450 +2.4 Ontario 421 435 445 454 462 +1.9 Manitoba 412 424 438 441 449 +1.7 Saskatchewan 435 458 472 468 471 +0.7 Alberta 462 484 495 493 496 +0.6 British Columbia 419 434 449 451 459 +1.8 Yukon 477 478 494 501 500 -0.2 Northwest Territories 487 498 507 511 527 +3.1 Nunavut 460 472 469 486 514 +5.8 Gender Men 443 458 470 474 481 +1.6 Women 382 395 406 412 419 +1.8 Age 24 years old and under 389 405 419 412 416 +1.0 25 to 44 years old 430 445 458 462 470 +1.7 45 to 54 years old 423 437 449 454 r 463 +1.8 55 years old and over 407 420 431 435 442 +1.6 EI claimant category2 Long-tenured workers 454 472 482 489 495 +1.1 Occasional claimants 403 420 428 429 437 +1.8 Frequent claimants 425 436 446 453 464 +2.3 Canada 419 433r 446 449 457 +1.6 - Note: Percentage change is based on unrounded numbers. Includes claims for which at least $1 of EI regular benefits was paid.
- 1 Takes into account Family Supplement top-ups paid to claimants with regular benefits. Includes benefits paid for training purposes under section 25 of the Employment Insurance Act.
- 2 See Annex-2.1 for definitions related to EI claimant categories.
- r Revised.
- Source: Employment and Social Development Canada, Employment Insurance (EI) administrative data. Data are based on a 10% sample of EI administrative data.
Annex 2.5.4 – Regular benefits: Amount paid1 ($ million) Province or territory FY1314 FY1415 FY1516 FY1617 FY1718 Change (%)
FY1617 to FY1718Newfoundland and Labrador 644.3 666.5 749.5 822.2 953.6 +16.0 Prince Edward Island 144.3 147.5r 162.6 161.2 175.5 +8.9 Nova Scotia 535.3 534.1 603.0 595.5 642.5 +7.9 New Brunswick 643.7 640.9 712.5 703.0 729.6 +3.8 Quebec 2,986.9 3,115.2 3,227.0 2,974.1 3,043.3 +2.3 Ontario 3,128.9 3,093.1r 3,200.8 3,069.9 3,183.3 +3.7 Manitoba 267.7 277.2 338.3 352.1 386.2 +9.7 Saskatchewan 225.4 246.3 361.3 450.8 473.3 +5.0 Alberta 670.5 746.9 r 1,499.9 2,274.7 1,804.8 -20.7 British Columbia 1,067.1 1,081.5 1,219.0 1,217.0 1,193.0 -2.0 Yukon 21.3 22.7 18.7 18.8 18.9 +0.9 Northwest Territories 20.3 20.5 20.2 19.3 20.8 +7.6 Nunavut 11.9 9.5 9.4 11.5 15.8 +37.5 Gender Men 6,851.0 7,032.7r 8,253.4 8,612.3 8,359.3 -2.9 Women 3,516.6 3,569.3 3,868.8 4,057.8 4,281.2 +5.5 Age 24 years old and under 973.2 966.1 1,153.7 1,158.1 1,076.1 -7.1 25 to 44 years old 4,510.3 4,603.5 5,345.2 5,548.9 5,449.7 -1.8 45 to 54 years old 2,586.6 2,604.6 2,844.6 2,921.7 2,876.7 -1.5 55 years old and over 2,297.5 2,427.9 2,778.8 3,041.3 3,238.0 +6.5 EI claimant category2 Long-tenured workers 2,377.2 2,136.9 3,141.1 3,681.5 3,343.6 -9.2 Occasional claimants 5,278.5 5,735.6 6,118.7 6,220.2 6,272.5 +0.8 Frequent claimants 2,712.0 2,729.5 2,862.3 2,768.4 3,024.4 +9.2 Canada 10,367.6 10,602.0 12,122.2 12670.1 12,640.5 -0.2 - Note: Data may not add up to the totals due to rounding. Percentage change is based on unrounded numbers. Includes claims for which at least $1 of EI regular benefits was paid.
- 1 Takes into account Family Supplement top-ups paid to claimants with regular benefits. Includes benefits paid for training purposes under section 25 of the Employment Insurance Act.
- 2 See Annex-2.1 for definitions related to EI claimant categories.
- r Revised.
- Source: Employment and Social Development Canada, Employment Insurance (EI) administrative data. Data are based on a 10% sample of EI administrative data.
-
Annex 2.6 Regular benefits (by industry)
Annex 2.6.1 – Regular benefits (by industry): New claims established Industry FY1314 FY1415 FY1516 FY1617 FY1718 Change (%)
FY1617 to FY1718Goods-producing industries 512,200 511,030 565,610 484,720 502,080 +3.6 Agriculture, forestry, fishing and hunting 57,140 56,880 57,360 51,910 53,760 +3.6 Mining and oil and gas extraction 24,380 28,900 38,250 24,430 21,340 -12.6 Utilities 4,680 4,420 4,230 3,980 4,150 +4.3 Construction 274,730 274,140 316,290 273,380 288,870 +5.7 Manufacturing 151,270 146,690 149,480 131,020 133,960 +2.2 Service-producing industries 769,260 748,370 821,740 762,630 764,150 +0.2 Wholesale trade 43,940 44,050 48,240 43,600 39,790 -8.7 Retail trade 79,210 72,850 83,500 76,300 79,090 +3.7 Transportation and warehousing 56,690 56,270 67,950 59,470 60,190 +1.2 Finance and insurance 14,750 13,820 15,500 14,080 15,020 +6.7 Real estate and rental and leasing 18,050 18,030 20,220 18,640 17,720 -4.9 Professional, scientific and technical services 53,800 54,690 61,630 54,190 52,690 -2.8 Business, building and support services1 96,850 93,310 100,250 88,740 86,380 -2.7 Educational services 145,810 146,040 156,100 153,460 157,110 +2.4 Health care and social assistance 48,840 47,160 47,610 45,740 46,590 +1.9 Information, culture and recreation2 41,960 39,470 41,320 38,030 39,080 +2.8 Accommodation and food services 63,360 58,550 63,840 60,630 63,840 +5.3 Other services (except public administration) 40,700 40,730 45,900 42,020 40,340 -4.0 Public administration 65,300 63,400 69,680 67,730 66,310 -2.1 Unclassified 44,350 83,210 43,740 73,780 33,480 -54.6 Canada 1,325,810 1,342,610 1,431,090 1,321,130 1,299,710 -1.6 - Note: Includes claims for which at least $1 of EI regular benefits was paid.
- 1 This industry sector comprises the industries with codes 55 (Management of companies and enterprises) and 56 (Administrative and support, waste management and remediation services) from the North American Industry Classification System.
- 2 This industry sector comprises the industries with codes 51 (Information and cultural industries) and 71 (Arts, entertainment and recreation) from the North American Industry Classification System.
- Source: Employment and Social Development Canada, Employment Insurance (EI) administrative data. Data are based on a 10% sample of EI administrative data.
Annex 2.6.2 – Regular benefits (by industry): Average actual duration (number of weeks) Industry FY1314 FY1415 FY1516 FY1617 FY1718p Change (%)
FY1617 to FY1718Goods-producing industries 19.3 19.1 19.3 20.7r 19.9 -4.1 Agriculture, forestry, fishing and hunting 21.5 21.4 21.6 22.0r 21.8 -0.9 Mining and oil and gas extraction 20.3 20.7 20.8 23.9r 27.0 +13.1 Utilities 17.0 18.5 17.6 18.4r 18.8 +2.4 Construction 18.1 18.1 18.4 19.6r 19.1 -2.7 Manufacturing 20.6 20.0 20.0 21.9r 19.6 -10.4 Service-producing industries 19.9 19.5 19.3 20.5r 20.1 -1.9 Wholesale trade 23.5 23.1 22.7 23.7r 23.7 -0.3 Retail trade 22.7 22.2 21.9 22.8r 22.5 -1.1 Transportation and warehousing 19.3 19.1 18.9 20.9r 20.0 -4.1 Finance and insurance 25.1 24.4 23.3 24.3r 24.2 -0.4 Real estate and rental and leasing 21.9 22.3 22.0 22.9r 23.9 +4.5 Professional, scientific and technical services 21.2 21.2 20.9 22.7r 22.3 -2.0 Business, building and support services1 21.6 21.3 21.2 22.0r 21.2 -3.5 Educational services 11.9 11.7 11.9 12.4r 12.6 +1.3 Health care and social assistance 21.3 21.2 21.0 22.3 21.3 -4.2 Information, culture and recreation2 20.7 20.4 20.0 20.7r 20.6 -0.3 Accommodation and food services 22.6 22.0 22.1 22.7r 22.5 -1.3 Other services (except public administration) 21.5 21.1 20.9 22.4r 22.3 -0.4 Public administration 20.4 20.4 20.1 21.7r 21.9 +0.6 Unclassified 20.8 22.4 19.7 22.8r 22.0 -3.7 Canada 19.7 19.4 19.3 20.7r 20.1 -2.9 - Note: Percentage change is based on unrounded numbers. Includes claims for which at least $1 of EI regular benefits was paid. Based on completed claims which include those that are terminated and those that are dormant and remained inactive as of August the following fiscal year.
- 1 This industry sector comprises the industries with codes 55 (Management of companies and enterprises) and 56 (Administrative and support, waste management and remediation services) from the North American Industry Classification System.
- 2 This industry sector comprises the industries with codes 51 (Information and cultural industries) and 71 (Arts, entertainment and recreation) from the North American Industry Classification System.
- r Revised.
- p Preliminary.
- Source: Employment and Social Development Canada, Employment Insurance (EI) administrative data. Data are based on a 10% sample of EI administrative data.
Annex 2.6.3 – Regular benefits (by industry): Average weekly benefit rate1 ($) Industry FY1314 FY1415 FY1516 FY1617 FY1718 Change (%)
FY1617 to FY1718Goods-producing industries 451 467 480 485 493 +1.7 Agriculture, forestry, fishing and hunting 403 416 429 431 441 +2.5 Mining and oil and gas extraction 495 510 522 528 531 +0.7 Utilities 494 501 516 524 532 +1.5 Construction 473 487 498 505 512 +1.4 Manufacturing 423 439 448 453 464 +2.4 Service-producing industries 399 413r 425r 430r 434 +1.1 Wholesale trade 412 424 440 447 449 +0.3 Retail trade 352 368 374 386 386 +0.1 Transportation and warehousing 390 403 425 417 420 +0.6 Finance and insurance 436 445 462 463 481 +3.8 Real estate and rental and leasing 407 421 432 440 449 +2.0 Professional, scientific and technical services 448 463 479 482 488 +1.3 Business, building and support services2 394 409 419 422 429 +1.7 Educational services 438 449 457 466 473 +1.3 Health care and social assistance 384 394 402 408 414 +1.6 Information, culture and recreation3 388 401 413 414 418 +1.0 Accommodation and food services 330 341 352 355 359 +1.1 Other services (except public administration) 380 394 416 418 422 +1.0 Public administration 426 437 446 451 460 +2.1 Unclassified 392 412 419 423 427 +0.8 Canada 419 433r 446 449 457 +1.6 - Note: Percentage change is based on unrounded numbers. Includes claims for which at least $1 of EI regular benefits was paid.
- 1 Takes into account Family Supplement top-ups paid to claimants with regular benefits.
- 2 This industry sector comprises the industries with codes 55 (Management of companies and enterprises) and 56 (Administrative and support, waste management and remediation services) from the North American Industry Classification System.
- 3 This industry sector comprises the industries with codes 51 (Information and cultural industries) and 71 (Arts, entertainment and recreation) from the North American Industry Classification System.
- r Revised.
- Source: Employment and Social Development Canada, Employment Insurance (EI) administrative data. Data are based on a 10% sample of EI administrative data.
Annex 2.6.4 – Regular benefits (by industry): Amount paid1 ($ million) Industry FY1314 FY1415 FY1516 FY1617 FY1718 Change (%)
FY1617 to FY1718Goods-producing industries 4,349.4 4,379.8 5,337.1 5,397.7 5,343.6 -1.0 Agriculture, forestry, fishing and hunting 503.6 500.7 520.4 515.6 578.2 +12.2 Mining and oil and gas extraction 253.1 238.9 445.0 448.8 310.0 -30.9 Utilities 40.0 41.1 39.1 42.2 48.2 +14.3 Construction 2,324.7 2,376.7r 2,934.7 3,001.5 3,113.4 +3.7 Manufacturing 1,228.0 1,222.4 1,397.9 1,389.6 1,293.7 -6.9 Service-producing industries 5,734.4r 5,656.9 6,487.5 6,687.7 6,998.6 +4.6 Wholesale trade 435.7 421.0 497.1 515.1 492.3 -4.4 Retail trade 630.3 607.0 685.4 712.3 763.4 +7.2 Transportation and warehousing 412.9 400.3 520.5 556.8 533.3 -4.2 Finance and insurance 167.0 155.9 166.5 177.9 193.9 +8.9 Real estate and rental and leasing 155.3 163.7 191.8 208.1 207.3 -0.4 Professional, scientific and technical services 510.6 505.4 630.5 666.4 601.1 -9.8 Business, building and support services2 784.5 787.0 881.9 876.9 871.4 -0.6 Educational services 605.8 634.6 711.6 695.1 850.0 +22.3 Health care and social assistance 360.2 362.2 371.2 389.6 424.0 +8.8 Information, culture and recreation3 332.8 318.3 336.2 337.1 377.7 +12.0 Accommodation and food services 460.3 427.2 498.2 496.3 559.9 +12.8 Other services (except public administration) 336.6 334.4 399.4 424.4 421.5 -0.7 Public administration 542.3 539.9 597.3 631.5 702.7 +11.3 Unclassified 283.9 565.3 297.6 584.7 298.4 -49.0 Canada 10,367.6 10,602.0 12,122.2 12,670.1 12,640.5 -0.2 - Note: Data may not add up to the totals due to rounding. Percentage change is based on unrounded numbers. Includes claims for which at least $1 of EI regular benefits was paid.
- 1 Takes into account Family Supplement top-ups paid to claimants with regular benefits. Includes benefits paid for training purposes under section 25 of the Employment Insurance Act.
- 2 This industry sector comprises the industries with codes 55 (Management of companies and enterprises) and 56 (Administrative and support, waste management and remediation services) from the North American Industry Classification System.
- 3 This industry sector comprises the industries with codes 51 (Information and cultural industries) and 71 (Arts, entertainment and recreation) from the North American Industry Classification System.
- r Revised.
- Source: Employment and Social Development Canada, Employment Insurance (EI) administrative data. Data are based on a 10% sample of EI administrative data.
-
Annex 2.7 Regular benefits (by regional unemployment rate and hours of insurable employment from previous employment)
Annex 2.7.1 – Regular benefits (by regional unemployment rate and hours of insurable employment from previous employment): New claims established Regional unemployment rate1 FY1314 FY1415 FY1516 FY1617 FY1718 Change (%)
FY1617 to FY17186.0% and under 187,910 273,380 218,020 171,350 384,230 +124.2 6.1% ~ 7.0% 196,410 158,060 363,660 363,170 425,580 +17.2 7.1% ~ 8.0% 259,710 329,870 279,030 299,000 134,750 -54.9 8.1% ~ 9.0% 327,910 236,460 216,290 169,290 110,860 -34.5 9.1% ~ 10.0% 45,870 78,450 75,660 65,480 31,660 -51.6 10.1% ~ 11.0% 84,810 55,950 50,430 35,420 7,990 -77.4 11.1% ~ 12.0% 52,390 44,380 16,740 21,420 60,140 +180.8 12.1% ~ 13.0% 10,030 7,660 43,880 35,300 13,420 -62.0 13.1% ~ 14.0% 6,620 470 16,910 11,350 28,240 +148.8 14.1% ~ 15.0% 20,030 25,870 23,650 38,190 24,020 -37.1 15.1% ~ 16.0% 57,470 25,100 31,980 25,370 10,270 -59.5 16.1% or greater 76,650 106,960 94,840 85,790 68,550 -20.1 Hours of insurable employment from previous employment 420 to 559 16,200 15,540 16,070 20,010 18,660 -6.7 560 to 699 52,690 48,850 51,100 56,330 47,490 -15.7 700 to 839 88,590 88,530 91,000 102,770 104,810 +2.0 840 to 979 112,690 115,160 116,610 113,880 110,790 -2.7 980 to 1,119 125,430 127,920 132,800 119,850 114,140 -4.8 1,120 to 1,259 127,170 128,290 131,700 122,760 120,710 -1.7 1,260 to 1,399 116,850 117,920 126,290 113,860 114,510 +0.6 1,400 to 1,539 127,380 127,610 134,580 125,170 125,090 -0.1 1,540 to 1,679 109,630 109,360 115,230 103,540 105,730 +2.1 1,680 to 1,819 110,030 109,480 119,890 103,900 106,150 +2.2 1,820 or more 339,150 353,950 395,820 339,060 331,630 -2.2 Canada 1,325,810 1,342,610 1,431,090 1,321,130 1,299,710 -1.6 - Note: Includes claims for which at least $1 of EI regular benefits was paid.
- 1 Unemployment rates used for the Employment Insurance program are a moving average of seasonally adjusted monthly rates of unemployment produced by Statistics Canada, as per section 17 of the Employment Insurance Regulations.
- Source: Employment and Social Development Canada, Employment Insurance (EI) administrative data. Data are based on a 10% sample of EI administrative data.
Annex 2.7.2 – Regular benefits (by regional unemployment rate and hours of insurable employment from previous employment): Average actual duration (number of weeks) Regional unemployment rate1 FY1314 FY1415 FY1516 FY1617r FY1718p Change (%)
FY1617 to FY17186.0% and under 15.9 15.7 17.2 19.0 14.5 -23.7 6.1% ~ 7.0% 17.5 18.0 15.9 18.9 17.3 -8.2 7.1% ~ 8.0% 17.7 18.2 19.2 18.9 19.8 5.0 8.1% ~ 9.0% 19.9 19.5 19.4 19.7 23.4 +18.5 9.1% ~ 10.0% 21.1 19.7 19.2 21.0 22.5 +7.6 10.1% ~ 11.0% 20.6 21.4 21.3 22.9 22.5 -1.9 11.1% ~ 12.0% 22.0 21.2 23.8 24.9 25.4 +2.3 12.1% ~ 13.0% 26.0 23.6 19.8 24.2 30.4 +25.8 13.1% ~ 14.0% 24.3 25.1 19.7 24.0 22.3 -6.9 14.1% ~ 15.0% 26.5 26.7 27.9 26.1 25.8 -1.1 15.1% ~ 16.0% 26.0 28.0 26.6 28.6 26.7 -6.4 16.1% or greater 26.3 25.2 26.4 32.0 33.0 +3.1 Hours of insurable employment from previous employment 420 to 559 26.6 25.9 26.6 28.3 28.6 +1.1 560 to 699 21.3 20.6 20.8 21.6 22.1 +2.5 700 to 839 19.3 18.8 18.5 19.2 18.6 -3.4 840 to 979 19.8 19.4 19.2 20.4 19.6 -4.3 980 to 1,119 19.5 19.4 19.0 20.2 19.6 -3.0 1,120 to 1,259 18.9 18.5 18.4 19.6 19.1 -2.5 1,260 to 1,399 18.4 18.2 17.8 19.2 18.3 -4.4 1,400 to 1,539 17.0 16.7 16.8 17.8 17.0 -4.3 1,540 to 1,679 18.4 18.4 18.3 19.4 18.7 -3.6 1,680 to 1,819 19.8 19.8 19.6 21.2 20.1 -5.3 1,820 or more 21.4 21.2 21.1 22.8 22.4 -1.6 Canada 19.7 19.4 19.3 20.7 20.1 -2.9 - Note: Percentage change is based on unrounded numbers. Includes claims for which at least $1 of EI regular benefits was paid. Based on completed claims which include those that are terminated and those that are dormant and remained inactive as of August the following fiscal year.
- 1 Unemployment rates used for the Employment Insurance program are a moving average of seasonally adjusted monthly rates of unemployment produced by Statistics Canada, as per section 17 of the Employment Insurance Regulations.
- r Revised.
- p Preliminary.
- Source: Employment and Social Development Canada, Employment Insurance (EI) administrative data. Data are based on a 10% sample of EI administrative data.
Annex 2.7.3 – Regular benefits (by regional unemployment rate and hours of insurable employment from previous employment): Average weekly benefit rate1 ($) Regional unemployment rate2 FY1314 FY1415 FY1516 FY1617 FY1718 Change (%)
FY1617 to FY17186.0% and under 442 452 452 454 459 +1.1 6.1% ~ 7.0% 416 433 456 453 454 +0.3 7.1% ~ 8.0% 417 428 439 446 468 +4.8 8.1% ~ 9.0% 415 426 443 451 460 +2.1 9.1% ~ 10.0% 412 436 427 443 462 +4.3 10.1% ~ 11.0% 413 430 447 466 462 -0.8 11.1% ~ 12.0% 411 419 481 449 456 +1.4 12.1% ~ 13.0% 429 434 448 478 461 -3.5 13.1% ~ 14.0% 429 506 442 432 448 +3.6 14.1% ~ 15.0% 413 422 431 429 436 +1.8 15.1% ~ 16.0% 413 431 433 443 442 -0.2 16.1% or greater 420 429 444 433 445 +2.7 Hours of insurable employment from previous employment 420 to 559 309 328 340 334 333 -0.3 560 to 699 342r 353 369 365 370 +1.5 700 to 839 356 367 379 380 377 -0.8 840 to 979 374 387 397 402 405 +0.8 980 to 1,119 388 402 411 417 424 +1.8 1,120 to 1,259 403 417 427 436 445 +2.1 1,260 to 1,399 422 434 446 451 462 +2.4 1,400 to 1,539 438 452 462 472 481 +1.9 1,540 to 1,679 439 452 463 472 482 +2.0 1,680 to 1,819 445 457 471 478 488 +2.0 1,820 or more 463 478 491 499 505 +1.3 Canada 419 433r 446 449 457 +1.6 - Note: Percentage change is based on unrounded numbers. Includes claims for which at least $1 of EI regular benefits was paid.
- 1 Takes into account Family Supplement top-ups paid to claimants with regular benefits.
- 2 Unemployment rates used for the Employment Insurance program are a moving average of seasonally adjusted monthly rates of unemployment produced by Statistics Canada, as per section 17 of the Employment Insurance Regulations.
- r Revised.
- Source: Employment and Social Development Canada, Employment Insurance (EI) administrative data. Data are based on a 10% sample of EI administrative data.
Annex 2.7.4 – Regular benefits (by regional unemployment rate and hours of insurable employment from previous employment): Amount paid1 ($ million) Regional unemployment rate2 FY1314 FY1415 FY1516 FY1617 FY1718 Change (%)
FY1617 to FY17186.0% and under 2,512.0 2,848.1 4,089.6 1,381.8 2,329.3 +68.6 6.1% ~ 7.0% 1,583.2 1,855.8 2,836.0 3,092.1 3,453.9 +11.7 7.1% ~ 8.0% 2,957.8 2,661.5 1,572.8 2,511.9 1,751.9 -30.3 8.1% ~ 9.0% 406.5 461.9 727.7 2,022.7 1,367.9 -32.4 9.1% ~ 10.0% 573.1 534.0 526.8 539.5 527.8 -2.2 10.1% ~ 11.0% 455.0 444.9 194.9 337.2 275.9 -18.2 11.1% ~ 12.0% 108.1 112.5 294.4 282.4 522.9 +85.1 12.1% ~ 13.0% 164.0 24.8 60.8 460.1 350.0 -23.9 13.1% ~ 14.0% 150.0 227.4 235.3 165.6 275.9 +66.6 14.1% ~ 15.0% 424.0 379.2 378.3 345.7 364.1 +5.3 15.1% ~ 16.0% 503.0 604.6 459.2 295.1 205.9 -30.2 16.1% or greater 530.9 447.4 746.2 1,235.9 1,215.2 -1.7 Hours of insurable employment from previous employment 420 to 559 133.8 127.2 144.0 175.8r 207.5 +18.0 560 to 699 380.0 361.1 380.7 437.8 460.8 +5.2 700 to 839 592.4r 592.5r 625.3 720.0 812.3 +12.8 840 to 979 795.4 829.4 879.3 917.6 946.5 +3.1 980 to 1,119 891.1 931.0 1,001.5 1,002.1 1,015.7 +1.3 1,120 to 1,259 871.5 903.0 985.0 1,001.8 1,065.4 +6.4 1,260 to 1,399 814.0 851.0 931.2 950.8 999.5 +5.1 1,400 to 1,539 853.0 872.5 976.4 996.0 1,037.2 +4.1 1,540 to 1,679 803.8 836.3 932.8 958.5 973.3 +1.5 1,680 to 1,819 923.5 924.4 1,075.4 1,107.4 1,076.9 -2.8 1,820 or more 3,309.1 3,373.4 4,190.5 4,401.8 4,045.4 -8.1 Canada 10,367.6 10,602.0 12,122.2 12,670.1 12,640.5 -0.2 - Note: Data may not add up to the totals due to rounding. Totals include amounts paid for claims where data on hours of insurable employment are missing. Percentage change is based on unrounded numbers. Includes claims for which at least $1 of EI regular benefits was paid.
- 1 Takes into account Family Supplement top-ups paid to claimants with regular benefits. Includes benefits paid for training purposes under section 25 of the Employment Insurance Act.
- 2 Unemployment rates used for the Employment Insurance program are a moving average of seasonally adjusted monthly rates of unemployment produced by Statistics Canada, as per section 17 of the Employment Insurance Regulations.
- r Revised.
- Source: Employment and Social Development Canada, Employment Insurance (EI) administrative data. Data are based on a 10% sample of EI administrative data.
-
Annex 2.8 Regular benefits (by Employment Insurance economic region)
Annex 2.8.1 – Regular benefits (by Employment Insurance economic region): New claims established EI economic region FY1314 FY1415 FY1516 FY1617 FY1718 Change (%)
FY1617 to FY1718Newfoundland and Labrador St. John’s 9,740 10,550 12,290 12,510 12,900 +3.1 Newfoundland – Labrador 53,550 52,860 55,590 43,080 49,270 +14.4 Prince Edward Island Prince Edward Island1 16,040 6,940 n/a n/a n/a n/a Charlottetown1 n/a 2,320 4,070 4,420 3,820 -13.6 Prince Edward Island (excluding Charlottetown)1 n/a 7,300 12,720 12,490 12,610 +1.0 Nova Scotia Eastern Nova Scotia 21,600 22,110 22,420 22,580 23,760 +5.2 Western Nova Scotia 26,340 26,450 27,000 26,950 27,020 +0.3 Halifax 11,590 12,170 12,600 13,080 13,100 +0.2 New Brunswick Fredericton-Moncton-Saint-John 19,040 19,230 20,920 19,800 20,180 +1.9 Madawaska-Charlotte 11,830 11,370 11,240 10,700 10,940 +2.2 Restigouche- Albert 38,580 38,330 39,870 39,620 39,490 -0.3 Quebec Gaspésie-Île-de-la Madeleine 24,670 23,830 24,740 24,990 25,180 +0.8 Québec 32,840 34,200 33,750 31,470 32,950 +4.7 Trois-Rivières 8,870 8,620 8,430 7,930 7,820 -1.4 South Central Quebec 8,930 8,160 7,480 7,900 6,820 -13.7 Sherbrooke 8,070 9,210 8,230 7,990 8,000 +0.1 Montérégie 26,190 25,750 27,030 26,160 24,880 -4.9 Montreal 152,130 152,310 152,860 146,390 144,110 -1.6 Central Quebec 74,410 74,540 73,830 70,970 71,440 +0.7 North Western Quebec 19,970 20,300 19,850 17,960 17,730 -1.3 Lower Saint Lawrence and North Shore 47,280 44,590 44,610 43,010 40,660 -5.5 Hull 10,340 10,750 10,660 10,430 9,890 -5.2 Chicoutimi-Jonquière 10,530 11,580 10,730 10,260 9,600 -6.4 Ontario Ottawa 19,950 20,180 21,210 19,470 19,340 -0.7 Eastern Ontario 19,820 19,820 20,220 18,910 18,670 -1.3 Kingston 3,820 3,770 3,120 3,530 3,110 -11.9 Central Ontario 44,080 42,610 44,200 42,800 41,030 -4.1 Oshawa 12,700 12,350 12,280 12,270 12,690 +3.4 Toronto 145,690 141,040 141,370 132,690 131,950 -0.6 Hamilton 20,220 19,540 19,400 19,210 18,630 -3.0 St. Catharines 16,770 14,660 15,240 14,710 14,310 -2.7 London 14,210 13,430 12,300 12,710 13,770 +8.3 Niagara 12,610 12,330 12,760 12,160 11,600 -4.6 Windsor 10,230 15,520 9,340 8,360 14,490 +73.3 Kitchener 15,050 13,340 13,340 13,360 13,570 +1.6 Huron 13,750 13,040 12,940 13,970 13,360 -4.4 South Central Ontario 13,040 11,590 11,890 11,480 13,110 +14.2 Sudbury 5,780 5,540 6,550 4,560 4,990 +9.4 Thunder Bay 4,520 4,580 4,990 4,250 4,460 +4.9 Northern Ontario 28,790 28,040 29,680 22,370 24,050 +7.5 Manitoba Winnipeg 19,370 20,080 22,270 21,380 21,920 +2.5 Southern Manitoba 9,260 9,750 11,550 10,960 11,180 +2.0 Northern Manitoba 7,010 7,450 7,990 6,970 7,130 +2.3 Saskatchewan Regina 3,970 4,470 5,700 6,270 6,330 +1.0 Saskatoon 6,100 7,510 9,730 9,210 8,640 -6.2 Southern Saskatchewan 7,500 8,550 10,590 8,320 8,710 +4.7 Northern Saskatchewan 9,820 10,970 13,560 10,290 11,510 +11.9 Alberta Calgary 26,580 32,730 52,480 43,150 35,620 -17.5 Edmonton 29,770 36,310 57,060 47,150 42,230 -10.4 Northern Alberta 7,320 10,290 16,090 18,750 9,880 -47.3 Southern Alberta 20,330 26,450 42,170 32,090 24,670 -23.1 British Columbia Southern Interior British Columbia 29,140 28,630 32,740 25,790 25,520 -1.0 Abbotsford 7,980 7,380 7,390 7,160 6,690 -6.6 Vancouver 58,780 55,620 54,580 49,110 47,730 -2.8 Victoria 7,790 7,520 7,920 6,650 6,710 +0.9 Southern Coastal British Columbia 21,280 20,740 22,350 20,390 19,220 -5.7 Northern British Columbia 15,840 19,150 21,100 15,730 16,540 +5.1 Territories Yukon1 2,020 780 n/a n/a n/a n/a Whitehorse1 n/a 560 1,070 950 820 -13.7 Yukon (excluding Whitehorse)1 n/a 540 770 800 790 -1.3 Northwest Territories1 1,530 990 n/a n/a n/a n/a Yellowknife1 n/a 170 410 510 520 +2.0 Northwest Territories (excluding Yellowknife)1 n/a 520 1,140 1,230 1,240 +0.8 Nunavut1 850 280 n/a n/a n/a n/a Iqualuit1 n/a 40 110 110 170 +54.5 Nunavut (excluding Iqaluit)1 n/a 280 570 660 640 -3.0 Canada 1,325,810 1,342,610 1,431,090 1,321,130 1,299,710 -1.6 - Note: Includes claims for which at least $1 of EI regular benefits was paid.
- 1 As of October 12, 2014, there is a total of 62 Employment Insurance (EI) economic regions, instead of 58 regions. The EI economic regions of Prince Edward Island, Yukon, the Northwest Territories and Nunavut were each divided into two EI economic regions, one consisting of the capital area and the remaining consisting of the non-capital area.
- Source: Employment and Social Development Canada, Employment Insurance (EI) administrative data. Data are based on a 10% sample of EI administrative data.
Annex 2.8.2 – Regular benefits (by Employment Insurance economic region): Average actual duration (number of weeks)
EI economic regionFY1314 FY1415 FY1516 FY1617 FY1718p Change (%)
FY1617 to FY1718Newfoundland and Labrador St. John’s 17.3 17.6 18.7 19.2r 20.7 +7.9 Newfoundland – Labrador 27.7 27.3 27.6 35.4 r 35.5 +0.3 Prince Edward Island Prince Edward Island1 23.5 23.2 25.3 n/a n/a n/a Charlottetown1 n/a n/a 19.6 19.4 18.8 -2.7 Prince Edward Island (excluding Charlottetown)1 n/a n/a 23.9 24.7 r 24.3 -1.6 Nova Scotia Eastern Nova Scotia 27.4 26.0 27.4 26.8 r 26.2 -2.1 Western Nova Scotia 23.4 22.6 23.0 22.0 r 21.3 -3.1 Halifax 18.8 19.4 18.9 19.8 r 18.8 -5.0 New Brunswick Fredericton-Moncton-Saint-John 19.6 19.5 20.4 19.9 r 18.6 -6.6 Madawaska-Charlotte 23.2 21.6 21.4 20.6 r 19.0 -8.0 Restigouche- Albert 26.0 26.6 26.5 26.4 r 25.0 -5.4 Quebec Gaspésie-Île-de-la Madeleine 24.6 26.2 26.0 25.4 r 25.0 -1.5 Québec 15.1 15.3 15.9 15.3 r 14.1 -8.4 Trois-Rivières 18.3 18.0 17.4 16.2 r 15.2 -6.2 South Central Quebec 13.9 14.3 14.8 13.8 r 12.9 -6.3 Sherbrooke 16.3 17.2 17.1 16.2 r 14.3 -12.1 Montérégie 16.5 16.9 16.9 16.4 r 15.1 -7.8 Montreal 18.9 19.2 19.0 18.9 r 16.9 -10.9 Central Quebec 18.0 17.7 17.4 16.5 r 15.5 -6.3 North Western Quebec 19.8 19.3 20.1 18.8 r 17.3 -8.0 Lower Saint Lawrence and North Shore 19.0 19.6 19.3 19.1 r 17.1 -10.4 Hull 16.9 17.3 18.0 17.4 r 16.1 -7.5 Chicoutimi-Jonquière 17.3 18.0 19.2 18.1 r 16.7 -7.7 Ontario Ottawa 17.6 17.4 17.1 17.4 r 16.2 -6.9 Eastern Ontario 18.0 18.1 17.8 18.4 r 16.7 -9.7 Kingston 17.3 17.9 18.1 17.2 r 15.7 -8.6 Central Ontario 18.6 17.5 16.9 17.5 r 16.6 -5.1 Oshawa 19.5 16.7 15.5 17.6 r 15.5 -11.7 Toronto 21.0 20.3 19.6 19.1 r 17.9 -6.4 Hamilton 18.1 16.5 16.9 16.4 r 16.1 -1.8 St. Catharines 18.9 19.0 17.5 17.4 r 16.4 -5.7 London 19.3 19.3 18.2 16.5 r 16.3 -1.4 Niagara 19.9 18.4 18.2 18.3 r 16.7 -8.7 Windsor 20.4 19.0 16.6 19.2 r 10.9 -43.3 Kitchener 18.1 18.4 17.0 16.7 r 15.6 -6.5 Huron 18.4 18.3 17.1 17.1 r 15.5 -9.8 South Central Ontario 16.9 16.7 16.2 16.4 r 14.0 -14.8 Sudbury 18.3 18.2 17.3 25.0 24.4 -2.3 Thunder Bay 16.5 17.4 16.0 15.9 r 15.5 -2.9 Northern Ontario 22.4 22.4 21.7 28.7 r 27.9 -2.9 Manitoba Winnipeg 16.0 15.7 16.9 17.0 r 16.4 -3.6 Southern Manitoba 15.7 14.8 15.8 16.7 r 16.2 -3.0 Northern Manitoba 25.2 24.5 24.4 30.5 r 31.6 +3.4 Saskatchewan Regina 15.4 14.0 14.9 16.4 r 16.6 +1.0 Saskatoon 14.9 15.6 16.0 22.6 r 24.4 +7.7 Southern Saskatchewan 15.9 16.7 16.4 24.0 r 25.8 +7.5 Northern Saskatchewan 23.3 22.7 23.2 31.6 r 33.0 +4.2 Alberta Calgary 16.8 16.8 17.5 26.4 r 29.8 +13.1 Edmonton 15.1 15.7 16.8 24.0 r 26.1 +8.5 Northern Alberta 17.0 18.3 19.8 21.7 r 31.6 +45.7 Southern Alberta 15.5 16.1 17.3 24.4 r 28.6 +17.5 British Columbia Southern Interior British Columbia 17.8 18.3 18.4 24.2 r 24.5 +1.4 Abbotsford 18.7 18.4 17.3 16.9 r 16.7 -0.8 Vancouver 19.3 18.3 17.7 17.4 r 16.7 -4.0 Victoria 18.4 17.2 17.3 18.1 r 15.8 -12.6 Southern Coastal British Columbia 18.8 18.9 19.1 18.9 r 17.3 -8.3 Northern British Columbia 20.9 19.7 20.6 26.3 r 24.6 -6.5 Territories Yukon1 23.2 26.5 29.6 n/a n/a n/a Whitehorse1 n/a 11.9 16.7 21.9 r 22.8 +3.8 Yukon (excluding Whitehorse)1 n/a n/a 20.4 19.9 r 19.5 -2.0 Northwest Territories1 26.2 25.4 35.0 n/a n/a n/a Yellowknife1 n/a n/a 17.6 14.7 r 16.5 +12.1 Northwest Territories (excluding Yellowknife)1 n/a n/a 25.0 24.6 r 24.4 -0.5 Nunavut1 27.2 32.0 34.7 n/a n/a n/a Iqualuit1 n/a n/a 17.6 16.8 r 22.6 +34.0 Nunavut (excluding Iqaluit)1 n/a n/a 25.5 34.3 34.6 +1.0 Canada 19.7 19.4 19.3 20.7 r 20.1 -2.9 - Note: Percentage change is based on unrounded numbers. Includes claims for which at least $1 of EI regular benefits was paid. Based on completed claims which include those that are terminated and those that are dormant and remained inactive as of August the following fiscal year.
- 1 As of October 12, 2014, there is a total of 62 Employment Insurance (EI) economic regions, instead of 58 regions. The EI economic regions of Prince Edward Island, Yukon, the Northwest Territories and Nunavut were each divided into two EI economic regions, one consisting of the capital area and the remaining consisting of the non-capital area.
- r Revised.
- p Preliminary.
- Source: Employment and Social Development Canada, Employment Insurance (EI) administrative data. Data are based on a 10% sample of EI administrative data.
Annex 2.8.3 – Regular benefits (by Employment Insurance economic region): Average weekly benefit rate1 ($) EI economic region FY1314 FY1415 FY1516 FY1617 FY1718 Change (%)
FY1617 to FY1718Newfoundland and Labrador St. John’s 434 447 460 468 466 -0.5 Newfoundland – Labrador 414 426 440 424 442 +4.4 Prince Edward Island Prince Edward Island2 395 399 n/a n/a n/a n/a Charlottetown2 n/a 401 416 399 406 +1.8 Prince Edward Island (excluding Charlottetown)2 n/a 417 421 426 432 +1.6 Nova Scotia Eastern Nova Scotia 413 432 434 433 440 +1.5 Western Nova Scotia 388 404 411 411 414 +0.5 Halifax 405 417 428 424 429 +1.1 New Brunswick Fredericton-Moncton-Saint-John 393 406r 418 422 432 +2.3 Madawaska-Charlotte 391 399 413 413 424 +2.5 Restigouche- Albert 411 421 433 438 443 +1.3 Quebec Gaspésie-Île-de-la Madeleine 421 430 437 442 451 +2.0 Québec 428 438 445 452 467 +3.2 Trois-Rivières 409 418 424 429 446 +3.9 South Central Quebec 414r 425r 441 444 458 +3.1 Sherbrooke 411 419 426r 440 447 +1.7 Montérégie 408 420 430 439 448 +1.9 Montreal 412 424 432 438 448 +2.2 Central Quebec 407 418 427 434 445 +2.6 North Western Quebec 422 437 440 447 453 +1.5 Lower Saint Lawrence and North Shore 422 429 439 441 452 +2.6 Hull 424 436 445 457 463 +1.2 Chicoutimi-Jonquière 413 427 432 434 446 +2.7 Ontario Ottawa 429 443 453 460 464 +1.0 Eastern Ontario 410 428 435 443r 440 -0.6 Kingston 411 429 429 438 443 +1.1 Central Ontario 412 425 437 449 452 +0.8 Oshawa 432 453 456 472 483 +2.2 Toronto 424 435 447 458 467 +2.0 Hamilton 431 437 452 460 468 +1.7 St. Catharines 405 412 417 434 440 +1.5 London 416 423 427 441 455 +3.0 Niagara 415 433 439 447 457 +2.3 Windsor 408 456 440 440 481 +9.2 Kitchener 429 443 452 463 464 +0.1 Huron 419 431 445 451 458 +1.5 South Central Ontario 419 431 445 460 468 +1.6 Sudbury 430 444 457 458 466 +1.6 Thunder Bay 446 455r 463 476 485 +1.9 Northern Ontario 429 439 452 444 455 +2.4 Manitoba Winnipeg 417 429 441 451 456 +1.1 Southern Manitoba 404 419 438 435 443 +1.8 Northern Manitoba 409 417 431 421 435 +3.4 Saskatchewan Regina 455 468 473 490 487 -0.6 Saskatoon 437 469 474 476 478 +0.2 Southern Saskatchewan 426 450 469 461 472 +2.4 Northern Saskatchewan 432 453 472 453 457 +1.0 Alberta Calgary 462 484 493 490 493 +0.6 Edmonton 470 487 499 500 505 +0.9 Northern Alberta 465 489r 499 500 498 -0.3 Southern Alberta 450 477 490 481 485 +0.7 British Columbia Southern Interior British Columbia 428 442 459 448 463 +3.4 Abbotsford 359 373r 383 398 395 -0.9 Vancouver 412 424 438 453 460 +1.5 Victoria 428 438r 454 459 461 +0.6 Southern Coastal British Columbia 426r 443 457 456 459 +0.6 Northern British Columbia 444 462 474 461 474 +3.0 Territories Yukon2 477 476 n/a n/a n/a n/a Whitehorse2 n/a 485 491 510 496 -2.7 Yukon (excluding Whitehorse)2 n/a 473 499 491 504 +2.6 Northwest Territories2 487 492 n/a n/a n/a n/a Yellowknife2 n/a 511 506 508 533 +4.9 Northwest Territories (excluding Yellowknife)2 n/a 507 507 513 525 +2.4 Nunavut2 460 464 n/a n/a n/a n/a Iqualuit2 n/a 494 496 526 523 -0.5 Nunavut (excluding Iqaluit)2 n/a 477 464 480 512 +6.7 Canada 419 433r 446 449 457 +1.6 - Note: Percentage change is based on unrounded numbers. Includes claims for which at least $1 of EI regular benefits was paid.
- 1 Takes into account Family Supplement top-ups paid to claimants with regular benefits.
- 2 As of October 12, 2014, there is a total of 62 Employment Insurance (EI) economic regions, instead of 58 regions. The EI economic regions of Prince Edward Island, Yukon, the Northwest Territories and Nunavut were each divided into two EI economic regions, one consisting of the capital area and the remaining consisting of the non-capital area.
- r Revised.
- Source: Employment and Social Development Canada, Employment Insurance (EI) administrative data. Data are based on a 10% sample of EI administrative data.
Annex 2.8.4 – Regular benefits (by Employment Insurance economic region): Amount paid1 ($ million) EI economic region FY1314 FY14152 FY15162 FY1617 FY1718 Change (%)
FY1617 to FY1718Newfoundland and Labrador St. John’s 71.0 82.0 98.6 116.3 139.1 +19.6 Newfoundland – Labrador 573.4 584.5 650.9 705.9 814.5 +15.4 Prince Edward Island Prince Edward Island2 144.3 105.7 8.5 n/a n/a n/a Charlottetown2 n/a 8.3 33.4 34.1 32.3 -5.3 Prince Edward Island (excluding Charlottetown)2 n/a 33.5 120.6 127.1 143.2 +12.7 Nova Scotia Eastern Nova Scotia 225.8 222.4 256.1 257.9 283.4 +9.9 Western Nova Scotia 224.1 219.8 241.1 231.8 244.9 +5.7 Halifax 85.3 91.9 105.8 105.8 114.2 +7.9 New Brunswick Fredericton-Moncton-Saint-John 142.0 146.2 176.3 170.1 172.9 +1.7 Madawaska-Charlotte 104.2 92.1 96.5 87.9 93.0 +5.8 Restigouche- Albert 397.6 402.7 439.7 445.0 463.6 +4.2 Quebec Gaspésie-Île-de-la Madeleine 248.2 249.1 266.8 264.2 295.6 +11.9 Québec 188.5 209.8 222.0 198.3 211.6 +6.7 Trois-Rivières 59.6 57.1 57.5 48.6 53.3 +9.6 South Central Quebec 44.1 47.5 47.0 42.7 40.7 -4.6 Sherbrooke 45.6 58.5 57.4 50.6 50.5 -0.3 Montérégie 161.5 168.6 186.3 174.3 173.2 -0.6 Montreal 1,090.8 1,166.0 1,195.6 1,124.4 1,116.9 -0.7 Central Quebec 495.5 496.5 508.2 449.4 499.2 +11.1 North Western Quebec 160.5 159.5 164.2 146.7 141.6 -3.5 Lower Saint Lawrence and North Shore 354.6 349.5 354.2 327.0 318.4 -2.6 Hull 67.4 74.9 81.2 76.5 74.7 -2.4 Chicoutimi-Jonquière 70.5 78.1 86.5 71.4 67.6 -5.3 Ontario Ottawa 147.4 151.3 165.8 151.8 152.4 +0.4 Eastern Ontario 137.1 144.8 160.2 146.6 145.7 -0.7 Kingston 26.1 27.9 24.1 23.9 24.2 +1.2 Central Ontario 316.3 310.7 320.9 313.5 333.7 +6.4 Oshawa 89.9 89.9 93.6 91.1 101.9 +11.8 Toronto 1,218.5 1,215.2 1,230.7 1,148.5 1,177.8 +2.6 Hamilton 141.1 137.5 145.9 143.5 150.2 +4.7 St. Catharines 117.2 109.2 106.7 106.7 108.2 +1.3 London 109.1 104.9 92.6 88.3 107.3 +21.6 Niagara 100.1 88.9 103.8 93.9 94.4 +0.5 Windsor 85.3 83.8 98.6 62.5 77.6 +24.1 Kitchener 111.9 108.9 104.5 101.6 108.2 +6.5 Huron 94.1 95.3 98.6 101.2 99.3 -1.9 South Central Ontario 90.6 82.8 86.7 84.1 91.6 +8.9 Sudbury 45.5 43.0 50.9 64.6 55.2 -14.6 Thunder Bay 31.4 33.9 36.0 33.4 35.1 +5.2 Northern Ontario 267.2 265.1 281.4 314.4 320.6 +1.9 Manitoba Winnipeg 134.8 138.4 171.9 169.3 182.0 +7.5 Southern Manitoba 60.9 64.1 82.9 88.6 91.2 +2.9 Northern Manitoba 72.0 74.7 83.6 94.2 113.0 +19.9 Saskatchewan Regina 28.7 31.3 43.8 52.3 61.8 +18.2 Saskatoon 43.4 52.1 82.1 109.4 117.1 +7.0 Southern Saskatchewan 52.6 60.3 87.9 115.4 115.4 0.0 Northern Saskatchewan 100.6 102.6 147.5 173.7 179.1 +3.1 Alberta Calgary 217.0 237.3 486.3 747.9 613.1 -18.0 Edmonton 227.7 260.7 489.2 730.6 632.7 -13.4 Northern Alberta 65.1 79.3 157.5 253.3 176.4 -30.4 Southern Alberta 160.8 169.6 366.9 542.9 382.6 -29.5 British Columbia Southern Interior British Columbia 207.9 221.2 273.0 318.5 310.0 -2.6 Abbotsford 51.8 48.9 49.3 48.7 48.9 +0.4 Vancouver 449.4 435.8 436.5 391.0 403.4 +3.2 Victoria 57.1 57.4 64.6 56.4 53.8 -4.6 Southern Coastal British Columbia 158.4 161.5 193.8 173.2 165.0 -4.8 Northern British Columbia 142.5 156.8 201.8 229.2 211.9 -7.5 Territories Yukon2 21.3 17.0 1.8 n/a n/a n/a Whitehorse2 n/a 2.6 9.2 10.8 10.9 +1.2 Yukon (excluding Whitehorse)2 n/a 3.1 7.7 8.0 8.0 +0.5 Northwest Territories2 20.3 17.2 2.6 n/a n/a n/a Yellowknife2 n/a 0.7 3.8 4.3 4.3 +0.2 Northwest Territories (excluding Yellowknife)2 n/a 2.7 13.8 15.0 16.4 +9.8 Nunavut2 11.9 7.9 0.7 n/a n/a n/a Iqualuit2 n/a 0.2 0.7 1.3 2.0 +54.3 Nunavut (excluding Iqaluit)2 n/a 1.4 8.0 10.2 13.8 +35.3 Canada 10,367.6 10,602.0 12,122.2 12,670.1 12,640.5 -0.2 - Note: Data may not add up to the totals due to rounding. Percentage change is based on unrounded numbers. Includes claims for which at least $1 of EI regular benefits was paid.
- 1 Takes into account Family Supplement top-ups paid to claimants with regular benefits. Includes benefits paid for training purposes under section 25 of the Employment Insurance Act.
- 2 As of October 12, 2014, there is a total of 62 Employment Insurance (EI) economic regions, instead of 58 regions. The EI economic regions of Prince Edward Island, Yukon, the Northwest Territories and Nunavut were each divided into two EI economic regions, one consisting of the capital area and the remaining consisting of the non-capital area. Amounts paid were registered in FY1516 in the four former EI economic regions in spite of the change in EI economic region boundaries because some claims established just prior to that change had continued to be paid in FY1516.
- Source: Employment and Social Development Canada, Employment Insurance (EI) administrative data. Data are based on a 10% sample of EI administrative data.
-
Annex 2.9 Seasonal regular claimants
Annex 2.9.1 – Seasonal regular claimants1: New claims established2 Province or territory FY1314 FY1415 FY1516 FY1617 FY1718 Change (%) FY1617 to FY1718 Newfoundland and Labrador 32,100 30,720 32,470 17,130 14,630 -14.6 Prince Edward Island 8,750 8,580 8,590 8,430 8,340 -1.1 Nova Scotia 26,060 25,560 24,970 24,630 25,340 +2.9 New Brunswick 34,470 34,090 34,910 33,620 33,890 +0.8 Quebec 160,890 159,240 159,380 156,020 157,360 +0.9 Ontario 95,870 97,110 98,420 92,340 96,070 +4.0 Manitoba 10,520 10,820 11,090 9,970 10,320 +3.5 Saskatchewan 7,770 7,770 8,240 4,800 3,790 -21.0 Alberta 13,000 13,700 15,280 8,650 7,690 -11.1 British Columbia 32,100 31,370 31,500 24,410 22,960 -5.9 Yukon 550 520 560 420 430 +2.4 Northwest Territories 280 210 230 220 260 +18.2 Nunavut 50 30 50 40 30 -25.0 Gender Men 262,030 261,810 266,130 232,770 235,580 +1.2 Women 160,380 157,910 159,560 147,910 145,530 -1.6 Age 24 years old and under 10,940 10,540 10,470 8,130 7,930 -2.5 25 to 44 years old 155,330 154,680 156,900 142,730 144,000 +0.9 45 to 54 years old 126,060 120,920 119,340 103,330 98,730 -4.5 55 years old and over 130,080 133,580 138,980 126,490 130,450 +3.1 Canada 422,410 419,720 425,690 380,680 381,110 +0.1 - Note: Includes claims for which at least $1 of EI regular benefits was paid.
- 1 Seasonal regular claimants are individuals who established three or more regular or fishing claims in the five fiscal years preceding the reference year, of which at least two were established at the same time of year as their claim in the reference year. For the purposes of this annex, a 17-week window is used to determine whether a claim was established at the same time of year as their claim in the reference year. Specifically, a claim is considered to have been established at the same time of year if was established between eight weeks before and eight weeks after the week in which the reference year claim was established.
- 2 In previous Employment Insurance Monitoring and Assessment Reports, this annex dealt with all seasonal claimants, not only seasonal regular claimants. By definition, all those receiving fishing benefits were considered seasonal claimants, and their statistics were therefore included in this annex. For the FY1718 Employment Insurance Monitoring and Assessment Report, for consistency and simplicity, this annex deals only with seasonal regular claimants, and data on individuals receiving fishing benefits are shown separately in Annex 2.10.
- Source: Employment and Social Development Canada, Employment Insurance (EI) administrative data. Data are based on a 10% sample of EI administrative data.
Annex 2.9.2 – Seasonal regular claimants1: Average actual duration (number of weeks) Province or territory FY1314 FY1415 FY1516 FY1617 FY1718p Change (%) FY1617 to FY1718 Newfoundland and Labrador 26.9 26.6 26.7 34.5r 32.8 -5.0 Prince Edward Island 23.8 23.1 23.6 23.9r 23.7 -1.0 Nova Scotia 23.7 22.7 23.6 22.9r 22.4 -2.0 New Brunswick 24.6 24.6 24.6 24.2r 23.2 -3.8 Quebec 16.8 17.1 17.1 16.7r 15.5 -6.9 Ontario 14.6 14.6 14.0 14.8r 13.8 -6.6 Manitoba 14.7 13.8 15.3 16.1r 15.7 -2.2 Saskatchewan 16.3 16.2 16.6 24.7r 22.7 -8.3 Alberta 13.2 12.9 14.2 21.8r 22.4 +2.6 British Columbia 15.8 15.0 15.0 17.4r 16.9 -2.5 Yukon 22.4 21.3 19.9 19.4r 20.2 +4.2 Northwest Territories 27.0 23.7 24.1 24.5r 21.3 -13.1 Nunavut 27.8 37.3 26.7 38.0 31.0 -18.4 Gender Men 19.0 18.9 19.0 19.9r 18.4 -7.4 Women 16.8 16.3 16.1 17.2r 16.5 -4.2 Age 24 years old and under 18.1 17.7 18.2 18.7r 17.6 -5.7 25 to 44 years old 17.1 16.9 17.0 17.5r 16.5 -6.0 45 to 54 years old 18.0 17.7 17.7 18.7r 17.6 -5.9 55 years old and over 19.5 19.2 19.1 20.7r 19.0 -7.8 Canada 18.2 17.9 17.9 18.9r 17.7 -6.5 - Note: Percentage change is based on unrounded numbers. Includes claims for which at least $1 of EI regular benefits was paid. Based on completed claims which include those that are terminated and those that are dormant and remained inactive as of August the following fiscal year.
- 1 Seasonal regular claimants are individuals who established three or more regular or fishing claims in the five fiscal years preceding the reference year, of which at least two were established at the same time of year as their claim in the reference year. For the purposes of this annex, a 17-week window is used to determine whether a claim was established at the same time of year as their claim in the reference year. Specifically, a claim is considered to have been established at the same time of year if was established between eight weeks before and eight weeks after the week in which the reference year claim was established.
- p Preliminary.
- r Revised.
- Source: Employment and Social Development Canada, Employment Insurance (EI) administrative data. Data are based on a 10% sample of EI administrative data.
Annex 2.9.3 – Seasonal regular claimants1: Average weekly benefit rate2,3 ($) Province or territory FY1314 FY1415 FY1516 FY1617 FY1718 Change (%) FY1617 to FY1718 Newfoundland and Labrador 426 439 452 428 439 +2.4 Prince Edward Island 404 413 431 443 452 +2.1 Nova Scotia 411 427 433 440 450 +2.2 New Brunswick 417 426 440 453 465 +2.7 Quebec 436 447 456 466 475 +2.0 Ontario 443 456 466 478 486 +1.7 Manitoba 425 435 442 452 465 +2.9 Saskatchewan 441 451 465 457 487 +6.5 Alberta 468 478 488 485 505 +4.1 British Columbia 422 431 445 444 451 +1.6 Yukon 489 497 514 517 524 +1.3 Northwest Territories 498 513 517 515 536 +4.2 Nunavut 501 431 507 484 466 -3.7 Gender Men 458 470 481 487 495 +1.6 Women 392 403 413 423 436 +3.0 Age 24 years old and under 444 462 478 479 490 +2.2 25 to 44 years old 451 464 475 484 495 +2.1 45 to 54 years old 431 443 454 462 473 +2.5 55 years old and over 412 423 432 437 447 +2.3 Canada 433 445 455 462 473 +2.2 - Note: Percentage change is based on unrounded numbers. Includes claims for which at least $1 of EI regular benefits was paid.
- 1 Seasonal regular claimants are individuals who established three or more regular or fishing claims in the five fiscal years preceding the reference year, of which at least two were established at the same time of year as their claim in the reference year. For the purposes of this annex, a 17-week window is used to determine whether a claim was established at the same time of year as their claim in the reference year. Specifically, a claim is considered to have been established at the same time of year if was established between eight weeks before and eight weeks after the week in which the reference year claim was established.
- 2 In previous Employment Insurance Monitoring and Assessment Reports, this annex dealt with all seasonal claimants, not only seasonal regular claimants. By definition, all those receiving fishing benefits were considered seasonal claimants, and their statistics were therefore included in this annex. For the FY1718 Employment Insurance Monitoring and Assessment Report, for consistency and simplicity, this annex deals only with seasonal regular claimants, and data on individuals receiving fishing benefits are shown separately in Annex 2.10.
- 3 Takes into account Family Supplement top-ups paid to seasonal regular claimants.
- p Preliminary.
- r Revised.
- Source: Employment and Social Development Canada, Employment Insurance (EI) administrative data. Data are based on a 10% sample of EI administrative data.
Annex 2.9.4 – Seasonal regular claimants1: Amount paid2,3 ($ million) Province or territory FY1314 FY1415 FY1516 FY1617 FY1718 Change (%) FY1617 to FY1718 Newfoundland and Labrador 340.2 342.1 365.8 359.0 240.3 -33.1 Prince Edward Island 79.1 75.8 82.6 80.4 92.9 +15.6 Nova Scotia 230.3 222.4 238.1 230.3 259.4 +12.7 New Brunswick 322.5 330.4 352.2 343.6 363.1 +5.7 Quebec 1043.2 1082.2 1126.7 1041.2 1128.0 +8.3 Ontario 547.9 572.0 606.0 585.9 638.4 +9.0 Manitoba 60.2 63.3 71.0 68.7 76.5 +11.4 Saskatchewan 53.1 53.5 63.9 59.9 49.2 -17.8 Alberta 73.7 78.4 99.9 111.7 97.8 -12.4 British Columbia 180.4 188.9 191.4 188.5 175.0 -7.2 Yukon 5.4 6.0 4.8 4.7 4.6 -2.7 Northwest Territories 3.4 2.6 2.8 2.6 2.9 +12.3 Nunavut 0.8 0.5 0.5 0.8 0.6 -24.6 Gender Men 2,097.6 2,162.1 2,311.1 2,214.8 2,176.0 -1.8 Women 842.5 856.0 894.5 862.4 952.9 +10.5 Age 24 years old and under 82.9 80.4 87.3 76.4 71.9 -5.9 25 to 44 years old 1,058.4 1,089.1 1,157.1 1,108.0 1,147.8 +3.6 45 to 54 years old 862.6 859.2 884.9 826.8 808.3 -2.2 55 years old and over 936.3 989.3 1076.3 1066.0 1100.9 +3.3 Canada 2,940.2 3,018.1 3,205.6 3,077.2 3,128.9 +1.7 - Note: Data may not add up to the total due to rounding. Percentage change is based on unrounded numbers. Includes claims for which at least $1 of EI regular benefits was paid.
- 1 Seasonal regular claimants are individuals who established three or more regular or fishing claims in the five fiscal years preceding the reference year, of which at least two were established at the same time of year as their claim in the reference year. For the purposes of this annex, a 17-week window is used to determine whether a claim was established at the same time of year as their claim in the reference year. Specifically, a claim is considered to have been established at the same time of year if was established between eight weeks before and eight weeks after the week in which the reference year claim was established.
- 2 In previous Employment Insurance Monitoring and Assessment Reports, this annex dealt with all seasonal claimants, not only seasonal regular claimants. By definition, all those receiving fishing benefits were considered seasonal claimants, and their statistics were therefore included in this annex. For the FY1718 Employment Insurance Monitoring and Assessment Report, for consistency and simplicity, this annex deals only with seasonal regular claimants, and data on individuals receiving fishing benefits are shown separately in Annex 2.10.
- 3 Takes into account Family Supplement top-ups paid to seasonal regular claimants.
- p Preliminary.
- r Revised.
- Source: Employment and Social Development Canada, Employment Insurance (EI) administrative data. Data are based on a 10% sample of EI administrative data.
-
Annex 2.10 Fishing benefits
Annex 2.10.1 – Fishing benefits: New claims established Province or territory FY1314 FY1415 FY1516 FY1617 FY1718 Change (%) FY1617 to FY1718 Newfoundland and Labrador 11,218 11,160 11,469 11,819 12,275 +3.9 Prince Edward Island 2,834 2,844 2,981 3,108 3,261 +4.9 Nova Scotia 5,225 5,185 5,327 5,448 5,632 +3.4 New Brunswick 2,751 2,791 2,977 3,066 3,311 +8.0 Quebec 1,409 1,390 1,409 1,425 1,411 -1.0 British Columbia 2,644 3,124 2,940 2,919 2,942 +0.8 Other provinces and territories 1,094 1,093 1,168 1,149 1,223 +6.4 Gender Men 22,372 22,590 23,121 23,502 24,015 +2.2 Women 4,803 4,997 5,150 5,432 6,040 +11.2 Age 24 years old and under 1,127 1,218 1,380 1,460 1,564 +7.1 25 to 44 years old 8,335 8,214 8,327 8,335 8,683 +4.2 45 to 54 years old 8,420 8,228 8,184 8,171 8,217 +0.6 55 years old and over 9,293 9,927 10,380 10,968 11,591 +5.7 Canada 27,175 27,587 28,271 28,934 30,055 +3.9 - Note: Includes claims for which at least $1 of EI fishing benefits was paid.
- Source: Employment and Social Development Canada, Employment Insurance (EI) administrative data. Data are based on a 100% sample of EI administrative data.
Annex 2.10.2 – Fishing benefits: Average actual duration (number of weeks) Province or territory FY1314 FY1415 FY1516 FY1617 FY1718p Change (%) FY1617 to FY1718 Newfoundland and Labrador 20.9 20.7 20.7 21.2 19.5 -8.0 Prince Edward Island 19.8 20.3 19.7 19.7 19.1 -3.1 Nova Scotia 19.9 19.9 19.8 20.0 19.8 -0.9 New Brunswick 19.9 19.8 19.4 19.8 19.6 -1.0 Quebec 19.9 19.5 18.6 20.0 17.1 -14.5 British Columbia 22.8 23.2 22.9 23.0 23.1 +0.4 Other provinces and territories 23.4 22.8 22.3 22.5 23.2 +2.8 Gender Men 20.4 20.4 20.1 20.5 19.5 -4.8 Women 22.3 22.3 22.0 22.3 21.5 -3.8 Age 24 years old and under 20.3 20.2 20.3 20.3 20.4 +0.5 25 to 44 years old 20.3 20.4 20.2 20.5 20.2 -1.3 45 to 54 years old 20.5 20.5 20.2 20.5 19.3 -5.9 55 years old and over 21.3 21.3 21.0 21.3 20.0 -6.3 Canada 20.7 20.7 20.5 20.8 19.9 -4.4 - Note: Percentage change is based on unrounded numbers. Includes claims for which at least $1 of EI fishing benefits was paid. Based on completed claims which include those that are terminated and those that are dormant and remained inactive as of August the following fiscal year.
- p Preliminary.
- Source: Employment and Social Development Canada, Employment Insurance (EI) administrative data. Data are based on a 100% sample of EI administrative data.
Annex 2.10.3 – Fishing benefits: Average weekly benefit rate1 ($) Province or territory FY1314 FY1415 FY1516 FY1617 FY1718 Change (%) FY1617 to FY1718 Newfoundland and Labrador 464 484 497 506 515 +1.9 Prince Edward Island 475 493 511 527 532 +0.9 Nova Scotia 474 498 506 519 521 +0.3 New Brunswick 486 499 511 519 521 +0.3 Quebec 489 504 513 525 532 +1.4 British Columbia 432 459 444 457 449 -1.8 Other provinces and territories 405 414 431 426 431 +1.1 Gender Men 470 489 498 509 514 +1.0 Women 443 465 480 489 494 +0.9 Age 24 years old and under 449 464 475 481 483 +0.5 25 to 44 years old 467 484 494 503 507 +0.7 45 to 54 years old 471 490 500 511 517 +1.2 55 years old and over 461 484 493 504 510 +1.0 Canada 465 485 494 505 510 +0.9 - Note: Percentage change is based on unrounded numbers. Includes claims for which at least $1 of EI fishing benefits was paid.
- 1 Takes into account Family Supplement top-ups paid to claimants with fishing benefits.
- Source: Employment and Social Development Canada, Employment Insurance (EI) administrative data. Data are based on a 100% sample of EI administrative data.
Annex 2.10.4 – Fishing benefits: Amount paid1 ($ million) Province or territory FY1314 FY1415 FY1516 FY1617 FY1718 Change (%) FY1617 to FY1718 Newfoundland and Labrador 100.1 98.6 108.1 111.4 121.4 +9.0 Prince Edward Island 22.6 24.1 26.2 28.4 29.5 +3.6 Nova Scotia 49.2 49.9 53.0 57.2 59.8 +4.5 New Brunswick 27.0 26.6 29.3 31.1 34.7 +11.4 Quebec 12.3 12.8 12.5 12.0 11.2 -7.2 British Columbia 25.4 31.7 31.3 29.9 30.4 +1.7 Other provinces and territories 11.3 12.0 11.8 12.9 13.3 +3.1 Gender Men 205.0 210.9 223.9 229.5 241.0 +5.0 Women 43.0 44.7 48.4 53.4 59.2 +10.9 Age 24 years old and under 10.9 10.4 11.6 14.0 14.8 +5.7 25 to 44 years old 75.0 74.3 78.6 82.1 90.1 +9.7 45 to 54 years old 78.8 78.7 81.4 79.9 82.0 +2.7 55 years old and over 83.2 92.2 100.7 106.9 113.3 +6.0 Canada 247.9 255.6 272.3 282.9 300.2 +6.1 - Note: Data may not add up to the total due to rounding. Percentage change is based on unrounded numbers. Includes claims for which at least $1 of EI fishing benefits was paid.
- 1 Takes into account family Supplement top-ups paid to claimants with fishing benefits.
- Source: Employment and Social Development Canada, Employment Insurance (EI) administrative data. Data are based on a 10% sample of EI administrative data.
-
Annex 2.11 Special benefits
Annex 2.11.1 – Special benefits1: New claims established Province or territory FY1314 FY1415 FY1516 FY1617 FY1718 Change (%)
FY1617 to FY1718Newfoundland and Labrador 11,650 11,940 12,490 12,080 13,040 +7.9 Prince Edward Island 5,930 6,340 6,610 6,850 6,860 +0.1 Nova Scotia 21,110 21,600 23,830 24,110 25,890 +7.4 New Brunswick 24,190 24,850 26,980 28,480 33,000 +15.9 Quebec 105,110 107,060 112,690 120,900 133,050 +10.0 Ontario 184,720 183,350 192,110 198,760 204,730 +3.0 Manitoba 19,570 18,910 20,230 19,100 20,910 +9.5 Saskatchewan 15,240 14,740 16,230 15,380 16,420 +6.8 Alberta 54,730 58,090 62,330 58,820 58,960 +0.2 British Columbia 71,440 75,040 75,380 77,130 82,320 +6.7 Yukon 590 670 740 710 710 0.0 Northwest Territories 690 600 720 640 710 +10.9 Nunavut 380 350 470 420 490 +16.7 Gender Men 170,840 177,350 188,700 195,280 212,700 +8.9 Women 344,510 346,190 362,110 368,100 384,390 +4.4 Age 24 years old and under 39,800 39,730 41,940 41,340 42,020 +1.6 25 to 44 years old 298,570 301,340 317,170 321,680 337,320 +4.9 45 to 54 years old 91,240 90,650 93,420 94,840 100,990 +6.5 55 years old and over 85,740 91,820 98,280 105,520 116,760 +10.7 Employment status Employees 514,700 522,810 550,250 562,660 596,310 +6.0 Self-employed persons 650 730 560 720 780 +8.3 Canada 515,350 523,540 550,810 563,380 597,090 +6.0 - Note: Includes claims for which at least $1 of EI special benefits was paid.
- 1 Includes maternity, parental, sickness, and compassionate care benefits. Excludes family caregiver benefits for adults and children due to incompatibility of administrative data sources.
- Source: Employment and Social Development Canada, Employment Insurance (EI) administrative data. Data are based on a 10% sample of EI administrative data.
Annex 2.11.2 – Special benefits1: Average weekly benefit rate2 ($) Province or territory FY1314 FY1415 FY1516 FY1617 FY1718 Change (%)
FY1617 to FY1718Newfoundland and Labrador 401 408 422 436 437 +0.2 Prince Edward Island 387 397 407 424 429 +1.2 Nova Scotia 393 400 409 416 425 +2.1 New Brunswick 395 405 419 421 433 +2.9 Quebec 380 390 398 406 416 +2.5 Ontario 410 420 430 441 449 +2.0 Manitoba 397 413 424 432 432 +0.1 Saskatchewan 414 430 442 453 456 +0.8 Alberta 430 445 454 460 467 +1.6 British Columbia 403 411 422 434 443 +2.2 Yukon 452 463 475 494 503 +1.8 Northwest Territories 488 478 503 508 508 0.0 Nunavut 474 458 472 482 487 +1.0 Gender Men 433 444 454 462 470 +1.8 Women 388 398 408 416 423 +1.6 Age 24 years old and under 321 330 343 346 353 +2.1 25 to 44 years old 420 431 441 450 457 +1.6 45 to 54 years old 399 409 423 430 441 +2.4 55 years old and over 385 396 403 414 423 +2.1 Employment status Employees 403 414 424 432 440 +1.8 Self-employed persons 326 315 329 337 331 -1.8 Canada 403 414 423 432 440 +1.8 - Note: Percentage change is based on unrounded numbers. Includes claims for which at least $1 of EI special benefits was paid.
- 1 Includes maternity, standard parental, sickness, and compassionate care benefits. Excludes family caregiver benefits for adults and children due to incompatibility of administrative data sources and extended parental benefits which are calculated at a lower benefit rate.
- 2 Takes into account Family Supplement top-ups paid to claimants with special benefits.
- Source: Employment and Social Development Canada, Employment Insurance (EI) administrative data. Data are based on a 10% sample of EI administrative data.
Annex 2.11.3 – Special benefits1: Amount paid2 ($ million) Province or territory FY1314 FY1415 FY1516 FY1617 FY1718 Change (%)
FY1617 to FY1718Newfoundland and Labrador 93.5 98.0 101.3 106.6 110.8 +3.9 Prince Edward Island 32.9 39.7 39.5 41.2 43.3 +4.9 Nova Scotia 154.2 164.2 177.1 188.0 190.3 +1.2 New Brunswick 157.4 156.8 162.7 185.1 190.8 +3.1 Quebec 365.6 373.8 407.8 442.0 505.9 +14.5 Ontario 2,108.1 2,179.2 2,281.4 2,379.7 2,486.9 +4.5 Manitoba 206.0 212.6 224.6 224.4 237.2 +5.7 Saskatchewan 187.3 188.2 208.5 218.8 226.8 +3.6 Alberta 712.5 762.2 848.9 863.2 852.0 -1.3 British Columbia 705.3 751.2 779.7 817.9r 869.8 +6.4 Yukon 8.1 7.7 7.3 8.5 8.9 +4.4 Northwest Territories 16.7 c 13.5 c 13.8 c 15.0 c 16.8 c +12.3 Nunavut Unknown 1.2 0.5 0.1 0.1 0.2 +35.2 Gender Men 803.2 834.1 909.2 1,001.3 1,077.5 +7.6 Women 3,945.7 4,113.4 4,343.4 4,489.1 4,662.0 +3.9 Age 24 years old and under 334.8 339.6 357.1 348.5 353.0 +1.3 25 to 44 years old 3,694.8 3,854.9 4,076.6 4,240.3 4,391.2 +3.6 45 to 54 years old 378.9 383.0 405.4 438.5 475.1 +8.3 55 years old and over 340.3 370.0 413.5 463.2 520.2 +12.3 Employment status Employees 4,740.7 4,939.8 5,244.7 5,482.8r 5,729.6 +4.5 Self-employed persons 8.2 7.7 7.9 7.7 9.9 +27.8 Canada 4,748.9 4,947.5 5,252.5 5,490.5r 5,739.5 +4.5 - Note: Data may not add up to the total due to rounding. Percentage change is based on unrounded numbers. Includes claims for which at least $1 of EI special benefits was paid.
- 1 Includes maternity, parental, sickness, compassionate care benefits and family caregiver benefits for adults and children.
- 2 Takes into account Family Supplement top-ups paid to claimants with special benefits.
- c For confidentiality purposes, data for Northwest Territories and Nunavut have been combined.
- r Revised.
- Source: Employment and Social Development Canada, Employment Insurance (EI) administrative data. Data are based on a 10% sample of EI administrative data, except for data on compassionate care benefits and family caregiver benefits for adults and children, which are based on a 100% sample.
-
Annex 2.12 Special benefits (by Employment Insurance economic region)
Annex 2.12.1 – Special benefits (by Employment Insurance economic region)1: New claims established EI economic region FY1314 FY1415 FY1516 FY1617 FY1718 Change (%)
FY1617 to FY1718Newfoundland and Labrador St. John’s 4,440 4,590 4,440 4,570 5,080 +11.2 Newfoundland – Labrador 7,210 7,350 8,050 7,510 7,960 +6.0 Prince Edward Island Prince Edward Island2 5,930 3,310 n/a n/a n/a n/a Charlottetown2 n/a 760 1,830 2,130 1,990 -6.6 Prince Edward Island (excluding Charlottetown)2 n/a 2,270 4,780 4,720 4,870 +3.2 Nova Scotia Eastern Nova Scotia 6,470 6,800 7,290 7,600 8,500 +11.8 Western Nova Scotia 8,010 7,970 9,200 8,950 9,920 +10.8 Halifax 6,630 6,830 7,340 7,560 7,470 -1.2 New Brunswick Fredericton-Moncton-Saint-John 9,130 9,050 9,980 10,180 11,010 +8.2 Madawaska-Charlotte 3,870 4,000 4,120 4,130 4,680 +13.3 Restigouche- Albert 11,190 11,800 12,880 14,170 17,310 +22.2 Quebec Gaspésie-Île-de-la Madeleine 3,150 3,530 3,480 3,980 4,750 +19.3 Québec 9,420 9,270 10,330 10,800 11,730 +8.6 Trois-Rivières 3,000 2,640 2,830 2,910 3,210 +10.3 South Central Quebec 2,840 2,690 2,700 2,990 3,190 +6.7 Sherbrooke 2,380 2,610 2,550 3,150 3,250 +3.2 Montérégie 7,120 7,350 8,420 8,650 9,470 +9.5 Montreal 33,090 33,100 35,590 38,450 42,850 +11.4 Central Quebec 20,490 21,040 21,830 24,180 25,780 +6.6 North Western Quebec 4,540 4,600 4,330 4,560 5,420 +18.9 Lower Saint Lawrence and North Shore 12,250 12,770 12,930 13,600 14,860 +9.3 Hull 3,160 3,380 3,280 3,380 3,640 +7.7 Chicoutimi-Jonquière 3,670 4,080 4,420 4,250 4,900 +15.3 Ontario Ottawa 13,960 13,270 13,860 14,310 14,140 -1.2 Eastern Ontario 7,380 7,520 8,250 8,210 8,750 +6.6 Kingston 2,210 2,120 2,110 2,130 2,130 0.0 Central Ontario 18,140 16,790 18,820 18,920 19,350 +2.3 Oshawa 5,630 5,970 5,980 6,020 6,660 +10.6 Toronto 71,580 71,370 74,040 77,080 77,040 -0.1 Hamilton 9,800 10,300 10,620 11,100 11,320 +2.0 St. Catharines 6,260 5,530 6,410 6,470 6,650 +2.8 London 6,890 6,360 6,930 7,110 7,770 +9.3 Niagara 5,270 5,690 5,750 5,610 6,170 +10.0 Windsor 4,780 4,560 4,640 4,520 5,680 +25.7 Kitchener 7,640 7,430 7,280 7,900 8,470 +7.2 Huron 4,680 5,260 5,550 7,100 7,200 +1.4 South Central Ontario 6,680 6,880 7,370 7,800 8,690 +11.4 Sudbury 2,620 2,790 2,560 3,040 2,840 -6.6 Thunder Bay 2,180 2,100 1,950 1,980 2,080 +5.1 Northern Ontario 9,020 9,410 9,990 9,460 9,790 +3.5 Manitoba Winnipeg 12,210 12,180 12,870 11,630 13,180 +13.3 Southern Manitoba 5,380 5,040 5,630 5,680 5,880 +3.5 Northern Manitoba 1,980 1,690 1,730 1,790 1,850 +3.4 Saskatchewan Regina 3,490 3,570 3,890 3,910 4,200 +7.4 Saskatoon 4,440 4,120 4,500 4,450 4,660 +4.7 Southern Saskatchewan 3,790 4,010 4,150 3,830 4,170 +8.9 Northern Saskatchewan 3,520 3,040 3,690 3,190 3,390 +6.3 Alberta Calgary 18,000 19,550 20,220 19,240 20,700 +7.6 Edmonton 18,830 19,690 21,670 20,310 19,920 -1.9 Northern Alberta 4,190 4,080 4,950 4,710 4,120 -12.5 Southern Alberta 13,710 14,770 15,490 14,560 14,220 -2.3 British Columbia Southern Interior British Columbia 10,840 11,680 12,160 12,250 12,700 +3.7 Abbotsford 4,580 4,730 4,360 5,240 5,370 +2.5 Vancouver 34,840 36,700 36,830 36,380 39,940 +9.8 Victoria 5,020 5,390 5,190 5,510 6,090 +10.5 Southern Coastal British Columbia 9,470 10,110 10,480 11,570 11,280 -2.5 Northern British Columbia 6,690 6,430 6,360 6,180 6,940 +12.3 Territories Yukon2 590 440 n/a n/a n/a n/a Whitehorse2 n/a 180 590 570 590 +3.5 Yukon (excluding Whitehorse)2 n/a 50 150 140 120 -14.3 Northwest Territories2 690 380 n/a n/a n/a n/a Yellowknife2 n/a 120 390 370 360 -2.7 Northwest Territories (excluding Yellowknife)2 n/a 100 330 270 350 +29.6 Nunavut2 380 210 n/a n/a n/a n/a Iqualuit2 n/a 60 170 110 170 +54.5 Nunavut (excluding Iqaluit)2 n/a 80 300 310 320 +3.2 Canada 515,350 523,540 550,810 563,380 597,090 +6.0 - Note: Includes claims for which at least $1 of EI special benefits was paid.
- 1 Includes maternity, parental, sickness and compassionate care benefits. Excludes family caregiver benefits for adults and children due to incompatibility of administrative data sources.
- 2 As of October 12, 2014, there is a total of 62 Employment Insurance (EI) economic regions, instead of 58 regions. The EI economic regions of Prince Edward Island, Yukon, the Northwest Territories and Nunavut were each divided into two EI economic regions, one consisting of the capital area and the remaining consisting of the non-capital area.
- Source: Employment and Social Development Canada, Employment Insurance (EI) administrative data. Data are based on a 10% sample of EI administrative data.
Annex 2.12.2 – Special benefits (by Employment Insurance economic region)1: Average weekly benefit rate2 ($) EI economic region FY1314 FY1415 FY1516 FY1617 FY1718 Change (%)
FY1617 to FY1718Newfoundland and Labrador St. John’s 412 415 430 445 440 -1.2 Newfoundland – Labrador 395 403 417 430 435 +1.1 Prince Edward Island Prince Edward Island3 387 397 n/a n/a n/a n/a Charlottetown3 n/a 389 383 405 402 -0.8 Prince Edward Island (excluding Charlottetown)3 n/a 399 416 432 440 +1.8 Nova Scotia Eastern Nova Scotia 412 419 426 436 449 +3.0 Western Nova Scotia 372 381 391 395 402 +1.6 Halifax 400 401 414 421 429 +1.8 New Brunswick Fredericton-Moncton-Saint-John 386 403 415 414 422 +1.9 Madawaska-Charlotte 382 394 399 401 408 +1.8 Restigouche- Albert 407 410 428 433 448 +3.5 Quebec Gaspésie-Île-de-la Madeleine 387 407 403 414 422 +2.0 Québec 379 385 397 408 419 +2.6 Trois-Rivières 367 382 385 389 408 +5.1 South Central Quebec 381 389 391 410 406 -1.0 Sherbrooke 374 390 381 400 404 +1.0 Montérégie 373 386 400 402 410 +2.0 Montreal 382 389 402 407 420 +3.3 Central Quebec 370 382 391 397 406 +2.4 North Western Quebec 379 388 392 401 413 +3.0 Lower Saint Lawrence and North Shore 391 402 404 410 417 +1.7 Hull 412 409 412 433 440 +1.8 Chicoutimi-Jonquière 386 404 405 414 423 +2.1 Ontario Ottawa 440 453 455 470 473 +0.6 Eastern Ontario 400 410 417 432 437 +1.2 Kingston 405 414 408 434 439 +1.2 Central Ontario 388 399 414 427 435 +2.0 Oshawa 418 435 440 449 463 +3.0 Toronto 417 426 438 446 456 +2.2 Hamilton 411 424 425 443 457 +3.2 St. Catharines 379 397 400 409 420 +2.7 London 405 422 421 432 442 +2.3 Niagara 390 404 428 431 446 +3.4 Windsor 396 418 430 419 434 +3.7 Kitchener 415 422 426 444 449 +1.1 Huron 399 394 412 422 435 +3.2 South Central Ontario 409 420 423 444 445 +0.4 Sudbury 409 407 432 437 433 -0.8 Thunder Bay 418 400 445 451 452 +0.2 Northern Ontario 405 406 420 431 440 +2.1 Manitoba Winnipeg 399 416 427 437 432 -1.1 Southern Manitoba 390 407 412 419 432 +3.1 Northern Manitoba 404 409 445 439 437 -0.5 Saskatchewan Regina 432 436 451 461 459 -0.6 Saskatoon 416 431 441 449 457 +1.9 Southern Saskatchewan 398 417 438 447 458 +2.3 Northern Saskatchewan 410 437 437 454 451 -0.7 Alberta Calgary 437 449 459 465 472 +1.5 Edmonton 432 443 456 466 474 +1.7 Northern Alberta 447 464 472 484 478 -1.1 Southern Alberta 412 435 439 438 449 +2.4 British Columbia Southern Interior British Columbia 400 403 422 430 438 +1.9 Abbotsford 356 374 378 394 398 +1.2 Vancouver 407 417 425 443 448 +1.0 Victoria 421 428 437 440 463 +5.3 Southern Coastal British Columbia 396 402 416 415 439 +5.7 Northern British Columbia 418 418 438 447 450 +0.6 Territories Yukon3 452 465 n/a n/a n/a n/a Whitehorse3 n/a 453 474 496 507 +2.0 Yukon (excluding Whitehorse)3 n/a 478 476 485 486 +0.2 Northwest Territories3 488 475 n/a n/a n/a n/a Yellowknife3 n/a 482 506 516 509 -1.3 Northwest Territories (excluding Yellowknife)3 n/a 485 499 497 507 +1.9 Nunavut3 474 450 n/a n/a n/a n/a Iqualuit3 n/a 499 528 530 514 -3.1 Nunavut (excluding Iqaluit)3 n/a 451 441 465 470 +1.2 Canada 403 414 423 432 440 +1.8 - Note: Percentage change is based on unrounded numbers. Includes claims for which at least $1 of EI special benefits was paid.
- 1 Includes maternity, standard parental, sickness, and compassionate care benefits. Excludes family caregiver benefits for adults and children due to incompatibility of administrative data sources and extended parental benefits which are calculated at a lower benefit rate.
- 2 Takes into account Family Supplement top-ups paid to claimants with special benefits.
- 3 As of October 12, 2014, there is a total of 62 Employment Insurance (EI) economic regions, instead of 58 regions. The EI economic regions of Prince Edward Island, Yukon, the Northwest Territories and Nunavut were each divided into two EI economic regions, one consisting of the capital area and the remaining consisting of the non-capital area.
- Source: Employment and Social Development Canada, Employment Insurance (EI) administrative data. Data are based on a 10% sample of EI administrative data.
Annex 2.12.3 – Special benefits (by Employment Insurance economic region)1: Amount paid2 ($ million) EI economic region FY1314 FY14153 FY15163 FY1617 FY1718 Change (%)
FY1617 to FY1718Newfoundland and Labrador St. John’s 45.4 44.6 43.3 47.2 48.8 +3.3 Newfoundland – Labrador 48.0 53.1 57.7 59.2 61.3 +3.5 Prince Edward Island Prince Edward Island3 32.9 33.4 4.3 n/a n/a n/a Charlottetown3 n/a 2.3 12.1 16.4 15.6 -4.8 Prince Edward Island (excluding Charlottetown)3 n/a 3.9 22.9 24.7 27.5 +11.3 Nova Scotia Eastern Nova Scotia 35.7 37.9 43.6 47.2 47.6 +1.0 Western Nova Scotia 53.3 56.6 58.7 66.2 66.6 +0.7 Halifax 65.0 69.4 74.4 74.5 75.3 +1.0 New Brunswick Fredericton-Moncton-Saint-John 78.3 77.9 79.7 91.7 84.8 -7.5 Madawaska-Charlotte 23.2 23.6 23.2 24.1 26.0 +8.2 Restigouche- Albert 55.7 54.9 59.2 68.9 78.9 +14.4 Quebec Gaspésie-Île-de-la Madeleine 11.7 11.7 12.4 14.5 16.3 +12.4 Québec 32.9 30.4 36.8 38.8 43.0 +10.7 Trois-Rivières 9.4 8.0 8.9 9.5 10.1 +6.1 South Central Quebec 8.9 9.9 9.9 10.4 11.1 +6.4 Sherbrooke 8.2 8.4 9.0 11.1 11.2 +1.0 Montérégie 25.6 26.2 31.4 32.5 36.5 +12.4 Montreal 117.2 120.0 133.3 146.7 170.2 +16.0 Central Quebec 68.5 71.7 75.6 82.1 96.0 +17.0 North Western Quebec 17.2 16.7 15.9 17.4 22.0 +26.5 Lower Saint Lawrence and North Shore 42.5 40.8 42.6 45.4 51.4 +13.2 Hull 12.6 14.8 13.8 15.4 16.8 +8.6 Chicoutimi-Jonquière 11.5 12.6 14.5 14.2 15.9 +12.2 Ontario Ottawa 174.8 182.1 187.2 190.0 192.2 +1.1 Eastern Ontario 70.2 72.3 78.0 82.4 85.4 +3.6 Kingston 22.2 23.4 21.9 24.2 23.4 -3.0 Central Ontario 168.5 175.7 181.9 191.5 207.3 +8.2 Oshawa 68.9 72.7 73.7 76.4 79.9 +4.6 Toronto 926.7 944.5 990.5 1,028.4 1,064.9 +3.5 Hamilton 110.4 120.8 129.6 132.2 139.5 +5.5 St. Catharines 54.6 54.8 56.0 62.0 66.0 +6.5 London 72.7 74.0 81.6 81.1 85.9 +5.9 Niagara 57.9 53.1 62.7 60.7 64.9 +6.9 Windsor 48.3 45.8 48.7 45.6 48.1 +5.6 Kitchener 83.9 93.0 90.1 97.2 101.7 +4.6 Huron 39.6 47.0 49.1 60.6 66.6 +9.9 South Central Ontario 78.8 82.1 82.7 93.0 97.5 +4.9 Sudbury 22.8 26.1 24.5 29.5 28.8 -2.3 Thunder Bay 17.0 20.6 20.0 22.0 22.3 +1.3 Northern Ontario 85.9 82.9 92.8 90.5 95.2 +5.2 Manitoba Winnipeg 135.7 133.3 147.1 141.3 150.2 +6.3 Southern Manitoba 51.0 57.4 57.9 61.5 62.9 +2.4 Northern Manitoba 19.0 21.3 18.9 20.6 22.3 +8.3 Saskatchewan Regina 42.4 45.4 49.8 54.3 56.2 +3.5 Saskatoon 56.1 57.5 60.6 66.5 69.2 +4.1 Southern Saskatchewan 46.4 45.8 53.8 54.2 55.5 +2.4 Northern Saskatchewan 42.3 39.0 43.3 42.4 44.6 +5.0 Alberta Calgary 256.4 272.5 294.0 301.6 302.5 +0.3 Edmonton 238.9 254.5 284.5 297.3 288.0 -3.1 Northern Alberta 57.4 59.8 67.6 69.5 60.4 -13.1 Southern Alberta 159.0 172.5 198.9 191.4 195.2 +2.0 British Columbia Southern Interior British Columbia 94.4 100.4 111.0 120.4 123.5 +2.6 Abbotsford 34.4 37.4 38.8 43.8 44.1 +0.6 Vancouver 378.6 406.3 418.7 430.5 455.7 +5.9 Victoria 54.3 56.4 57.7 61.4 63.9 +4.1 Southern Coastal British Columbia 82.7 86.5 92.4 95.8 106.8 +11.5 Northern British Columbia 60.2 61.9 58.4 63.1 71.6 +13.4 Territories Yukon3 8.1 7.0 0.9 n/a n/a n/a Whitehorse3 n/a 0.6 5.1 7.6 8.0 +5.7 Yukon (excluding Whitehorse)3 n/a 0.1 1.3 0.9 0.8 -18.2 Northwest Territories3 10.7 7.6 1.0 n/a n/a n/a Yellowknife3 n/a 0.5 3.9 5.7 5.0 -13.0 Northwest Territories (excluding Yellowknife)3 n/a 0.4 3.1 4.3 4.6 +7.0 Nunavut3 6.0 4.4 0.5 n/a n/a n/a Iqualuit3 n/a 0.3 1.8 1.5 2.1 +36.3 Nunavut (excluding Iqaluit)3 n/a 0.2 3.4 3.5 5.0 +43.3 Canada 4,741.0 4,928.7 5,228.8 5,464.4 5,700.8 +4.3 - Note: Data may not add up to the total due to rounding. Percentage change is based on unrounded numbers. Includes claims for which at least $1 of EI special benefits was paid.
- 1 Includes maternity, parental, sickness, and compassionate care benefits. Excludes family caregiver benefits for adults and children due to incompatibility of administrative data sources. Therefore, total amounts paid in EI special benefits do not match those in annex 2.11.3.
- 2 Takes into account Family Supplement top-ups paid to claimants with special benefits.
- 3 As of October 12, 2014, there is a total of 62 Employment Insurance (EI) economic regions, instead of 58 regions. The EI economic regions of Prince Edward Island, Yukon, the Northwest Territories and Nunavut were each divided into two EI economic regions, one consisting of the capital area and the remaining consisting of the non-capital area. Amounts paid were registered in FY1516 in the four former EI economic regions in spite of the change in EI economic region boundaries because some claims established just prior to that change had continued to be paid in FY1516.
- Source: Employment and Social Development Canada, Employment Insurance (EI) administrative data. Data are based on a 10% sample of EI administrative data.
-
Annex 2.13 Firms and Employment Insurance regular and special benefits (by industry)
Annex 2.13 – Firms and Employment Insurance regular and special benefits (by industry) Industry Distribution of firms Distribution of the firm’s workforce1 EI regular claimant distribution2 EI special claimant distribution2 (#)
2016(%)
2016(#)
2016(%)
2016(#)
2016(%)
2016(#)
2016(%)
2016Goods-producing industries 262,900 21.9 3,688,003 19.5 702,421 39.4 156,515 19.9 Agriculture, forestry, fishing and hunting 52,166 4.3 324,842 1.7 65,590 3.7 15,846 2.0 Mining, and oil and gas extraction 8,934 0.7 214,435 1.1 48,586 2.7 7,881 1.0 Utilities 837 0.1 118,513 0.6 5,999 0.3 2,764 0.4 Construction 151,788 12.7 1,292,399 6.8 393,623 22.1 57,183 7.3 Manufacturing 49,175 4.1 1,737,814 9.2 188,622 10.6 72,841 9.3 Services-producing industries 864,777 72.1 14,992,407 79.4 1,062,203 59.7 623,436 79.3 Wholesale trade 47,918 4.0 875,108 4.6 67,402 3.8 29,997 3.8 Retail trade 104,011 8.7 2,151,136 11.4 109,221 6.1 85,875 10.9 Transportation and warehousing 72,610 6.1 801,179 4.2 86,349 4.8 33,640 4.3 Finance and insurance 32,950 2.7 753,743 4.0 22,604 1.3 28,089 3.6 Real estate and rental and leasing 53,285 4.4 338,318 1.8 28,888 1.6 12,852 1.6 Professional, scientific and technical services 154,225 12.9 1,059,201 5.6 79,121 4.4 33,078 4.2 Business, building and other support services3 58,732 4.9 1,239,261 6.6 135,422 7.6 54,456 6.9 Educational services 14,032 1.2 1,382,436 7.3 173,843 9.8 50,351 6.4 Health care and social assistance 105,950 8.8 1,633,078 8.6 67,120 3.8 104,200 13.3 Information, culture and recreation4 31,882 2.7 686,870 3.6 55,273 3.1 19,523 2.5 Accommodation and food services 75,649 6.3 1,500,558 7.9 87,521 4.9 58,954 7.5 Other services (except public administration) 108,313 9.0 732,450 3.9 59,880 3.4 31,670 4.0 Public administration 5,220 0.4 1,839,069 9.7 89,559 5.0 80,751 10.3 Unclassified 72,129 6.0 213,291 1.1 15,999 0.9 5,950 0.8 Canada 1,199,806 100.0 18,893,701 100.0 1,780,622 100.0 785,902 100.0 - Note: Data may not add up to the total due to rounding.
- 1 The number of workers in a firm is the number of individuals paid employment income by that firm, as indicated on a T4 form. The number of workers is adjusted so that each individual in the labour force is only counted once and individuals who work for more than one firm are taken into account. For example, if an employee earned $25,000 in firm 1 and $25,000 in firm 2, then he or she was recorded as 0.5 employees at the first firm and 0.5 employees at the second firm.
- 2 These columns are based on the number of people receiving EI regular and/or special benefits in 2016.
- 3 This industry category comprises the industries with codes 55 (Management of companies and enterprises) and 56 (Administrative and support, waste management and mediation services) from the North American Industry Classification System.
- 4 This industry category comprises the industries with codes 51 (Information and cultural industries) and 71 (Arts, entertainment and recreation) from the North American Industry Classification System.
- Sources: Employment and Social Development Canada, EI administrative data. Data are based on a 100% sample of EI data; Canada Revenue Agency (CRA) administrative data. CRA data are based on a 100% sample.
-
Annex 2.14 Maternity benefits
Annex 2.14.1 – Maternity benefits1: New claims established Province or territory FY1314 FY1415 FY1516 FY1617 FY1718 Change (%)
FY1617 to FY1718Newfoundland and Labrador 2,940 2,730 2,970 2,750 2,730 -0.7 Prince Edward Island 990 1,060 1,050 1,030 900 -12.6 Nova Scotia 4,840 5,430 5,680 5,000 5,060 +1.2 New Brunswick 4,280 4,230 4,410 4,130 4,180 +1.2 Quebec2 n/a n/a n/a n/a n/a n/a Ontario 84,110 82,350 84,190 83,770 83,920 +0.2 Manitoba 8,910 8,090 8,870 8,150 8,610 +5.6 Saskatchewan 7,820 7,780 8,330 7,760 8,330 +7.3 Alberta 29,280 31,070 31,860 30,580 29,470 -3.6 British Columbia 25,650 25,690 26,300 26,340 27,430 +4.1 Yukon 220 250 290 280 240 -14.3 Northwest Territories 370 260 360 320 300 -6.3 Nunavut 230 140 200 220 300 +36.4 Age 24 years old and under 17,650 17,520 16,990 15,470 15,080 -2.5 25 to 29 years old 49,730 49,300 49,060 47,800 46,170 -3.4 30 to 34 years old 64,730 66,320 70,100 68,500 68,610 +0.2 35 to 39 years old 31,450 30,270 32,470 32,420 34,660 +6.9 40 years old and over 6,080 5,670 5,890 6,140 6,950 +13.2 Canada 169,640 169,080 174,510 170,330 171,470 +0.7 - Note: Includes claims for which at least $1 of EI maternity benefits was paid.
- 1 Figures also include maternity benefits for self-employed individuals.
- 2 Since January 2006, Quebec has administered its own maternity benefits under the Quebec Parental Insurance Plan.
- Source: Employment and Social Development Canada, Employment Insurance (EI) administrative data. Data are based on a 10% sample of EI administrative data.
Annex 2.14.2 – Maternity benefits: Average actual duration (number of weeks) Province or territory FY1314 FY1415 FY1516 FY1617 FY1718P Change (%)
FY1617 to FY1718Newfoundland and Labrador 14.2 14.2 14.1 14.3 14.3 -0.3 Prince Edward Island 14.2 14.2 14.2 14.6 14.5 -1.2 Nova Scotia 14.6 14.6 14.5 14.7r 14.7 +0.4 New Brunswick 14.5 14.6 14.7 14.7r 14.6 -0.3 Quebec1 n/a n/a n/a n/a n/a n/a Ontario 14.6 14.7 14.7r 14.6 14.7 +0.2 Manitoba 14.6 14.8 14.6 14.7 14.6 -0.6 Saskatchewan 14.6 14.7 14.7 14.7 14.7 -0.3 Alberta 14.6 14.6 14.6 14.6 14.7 +0.2 British Columbia 14.7 14.7 14.7 14.6 14.7 +0.3 Yukon 14.5 14.4 14.5 14.4 15.0 +4.1 Northwest Territories 14.8 14.6 14.8 14.2 14.3 +1.3 Nunavut 15.0 14.8 14.0 14.5 14.3 -1.7 Age 24 years old and under 14.6 14.6 14.7 14.6 14.6 0.0 25 to 29 years old 14.6 14.7 14.7 14.6 14.7 +0.2 30 to 34 years old 14.6 14.6 14.6 14.7r 14.7 +0.2 35 to 39 years old 14.6 14.6 14.7r 14.6 14.6 -0.1 40 years old and over 14.4 14.5 14.5 14.6r 14.7 +0.7 Canada 14.6 14.6 14.6 14.6 14.7 +0.2 - Note: Percentage change is based on unrounded numbers. Includes claims for which at least $1 of EI maternity benefits was paid. Based on completed claims which include those that are terminated and those that are dormant and remained inactive as of August the following fiscal year.
- 1 Since January 2006, Quebec has administered its own maternity benefits under the Quebec Parental Insurance Plan.
- p Preliminary.
- r Revised.
- Source: Employment and Social Development Canada, Employment Insurance (EI) administrative data. Data are based on a 10% sample of EI administrative data.
Annex 2.14.3 – Maternity benefits: Average weekly benefit rate1 ($) Province or territory FY1314 FY1415 FY1516 FY1617 FY1718 Change (%)
FY1617 to FY1718Newfoundland and Labrador 418 430 424 450 438 -2.5 Prince Edward Island 387 421 432 436 446 +2.3 Nova Scotia 396 394 409 411 425 +3.6 New Brunswick 393 403 414 424 431 +1.7 Quebec2 n/a n/a n/a n/a n/a n/a Ontario 420 429 439 448 457 +2.1 Manitoba 388 407 416 432 422 -2.3 Saskatchewan 409 427 439 455 452 -0.8 Alberta 426 441 449 462 467 +1.2 British Columbia 409 421 428 437 449 +2.7 Yukon 457 438 474 493 518 +5.2 Northwest Territories 489 492 495 499 499 -0.2 Nunavut 472 434 453 480 469 -2.4 Age 24 years old and under 304 315 325 326 335 +2.8 25 to 29 years old 401 411 419 430 435 +1.3 30 to 34 years old 439 451 459 469 475 +1.2 35 to 39 years old 448 460 468 476 482 +1.4 40 years old and over 448 459 462 475 480 +0.9 Canada 416 427 436 447 454 +1.6 - Note: Percentage change is based on unrounded numbers. Includes claims for which at least $1 of EI maternity benefits was paid.
- 1 Takes into account Family Supplement top-ups paid to claimants with maternity benefits.
- 2 Since January 2006, Quebec has administered its own maternity benefits under the Quebec Parental Insurance Plan.
- Source: Employment and Social Development Canada, Employment Insurance (EI) administrative data. Data are based on a 10% sample of EI administrative data.
Annex 2.14.4 – Maternity benefits: Amount paid1 ($ million) Province or territory FY1314 FY1415 FY1516 FY1617 FY1718 Change (%)
FY1617 to FY1718Newfoundland and Labrador 17.4 17.6 17.7 18.5 17.8 -3.8 Prince Edward Island 5.2 6.9 6.5 6.2 6.5 +4.8 Nova Scotia 26.8 32.1 33.1 32.0 31.4 -1.8 New Brunswick 25.9 25.6 25.6 27.9 25.1 -10.2 Quebec2 n/a n/a n/a n/a n/a n/a Ontario 514.4 522.4 542.6 556.9 566.4 +1.7 Manitoba 50.4 49.5 53.1 51.5 55.4 +7.5 Saskatchewan 46.8 48.2 52.3 53.0 55.4 +4.5 Alberta 182.2 198.1 209.5 212.9 206.2 -3.1 British Columbia 154.0 159.7 165.2 172.6 179.9 +4.2 Yukon 1.8 1.5 1.9 2.0 1.9 -8.4 Northwest Territories 2.8 2.0 2.1 2.5 2.3 -9.2 Nunavut 1.7 0.8 1.3 1.3 2.1 +58.2 Age 24 years old and under 80.8 80.3 81.9 77.4 76.1 -1.6 25 to 29 years old 296.1 297.2 302.6 308.1 297.1 -3.6 30 to 34 years old 410.0 440.9 466.0 480.6 484.5 +0.8 35 to 39 years old 203.5 207.4 219.7 229.3 245.5 +7.0 40 years old and over 39.0 38.6 40.6 41.9 47.1 +12.3 Canada 1,029.5 1,064.3 1,110.9 1,137.3 1,150.3 +1.1 - Note: Data may not add up to the total due to rounding. Percentage change is based on unrounded numbers. Includes claims for which at least $1 of EI maternity benefits was paid.
- 1 Takes into account Family Supplement top-ups paid to claimants with maternity benefits.
- 2 Since January 2006, Quebec has administered its own maternity benefits under the Quebec Parental Insurance Plan.
- Source: Employment and Social Development Canada, Employment Insurance (EI) administrative data. Data are based on a 10% sample of EI administrative data.
-
Annex 2.15 Parental benefits (biological and adoptive)
Annex 2.15.1 – Parental benefits (biological and adoptive): New claims established Province or territory FY1314 FY1415 FY1516 FY1617 FY1718 Change (%)
FY1617 to FY1718 (Total)Standard1 Extended2 Total Newfoundland and Labrador 3,030 2,820 2,960 2,930 2,720 70 2,790 -4.8 Prince Edward Island 1,170 1,150 1,140 1,130 950 50 1,000 -11.5 Nova Scotia 5,580 6,110 6,470 5,970 5,620 210 5,830 -2.3 New Brunswick 4,810 4,720 4,940 4,580 4,550 160 4,710 +2.8 Quebec3 n/a n/a n/a n/a n/a n/a n/a n/a Ontario 96,630 94,920 96,390 98,370 92,770 5,110 97,880 -0.5 Manitoba 9,950 9,380 9,970 9,440 9,780 270 10,050 +6.5 Saskatchewan 8,750 8,470 9,140 8,720 9,030 260 9,290 +6.5 Alberta 31,520 33,640 34,830 33,480 31,760 1,370 33,130 -1.0 British Columbia 28,660 29,210 29,670 30,340 31,090 1,160 32,250 +6.3 Yukon 290 340 340 330 1,080 c 40 c 310 -6.1 Northwest Territories 460 350 480 390 430 +10.3 Nunavut 270 210 330 280 380 +35.7 Gender Men 25,480 26,540 26,690 29,490 30,390 460 30,850 +4.6 Women 165,640 164,780 169,970 166,470 158,960 8,240 167,200 +0.4 Age 24 years old and under 17,610 17,500 17,030 15,840 14,700 720 15,420 -2.7 25 to 29 years old 52,890 52,010 51,830 51,080 47,450 1,930 49,380 -3.3 30 to 34 years old 72,410 74,080 77,880 77,230 74,620 3,400 78,020 +1.0 35 to 39 years old 38,000 36,980 39,010 40,360 40,670 2,100 42,770 +6.0 40 years old and over 10,210 10,750 10,910 11,450 11,910 550 12,460 +8.8 Canada 191,120 191,320 196,660 195,960 189,350 8,700 198,050 +1.1 - Note: Includes claims for which at least $1 of EI parental benefits was paid. Parental benefits that are shared between two parents are considered as two separate claims.
- 1 Starting December 3, 2017, parents can choose between receiving standard or extended parental benefits. Standard parental benefits are equivalent to the parental benefits offered in previous fiscal years, that is, up to 35 weeks of parental benefits paid at 55% of the average weekly insurable earnings.
- 2 Extended parental benefits offer up to 61 weeks of parental benefits paid at 33% of the average weekly insurable earnings.
- 3 Since January 2006, Quebec has administered its own parental benefits under the Quebec Parental Insurance Plan.
- c For confidentiality purposes, data for Yukon, Northwest Territories and Nunavut have been combined.
- Source: Employment and Social Development Canada, Employment Insurance (EI) administrative data. Data are based on a 10% sample of EI administrative data.
Annex 2.15.2 – Parental benefits (biological and adoptive): Average actual duration (number of weeks) Province or territory FY1314 FY1415 FY1516 FY1617 FY1718p
Standard only1Change (%)
FY1617 to FY1718Newfoundland and Labrador 30.0 30.6 30.9 29.9 30.4 +1.7 Prince Edward Island 29.6 30.7 30.2 29.9 29.7 -0.7 Nova Scotia 29.3 29.4 28.7 29.5r 29.3 -0.5 New Brunswick 29.6 30.2 29.8 29.7r 29.3 -1.2 Quebec2 n/a n/a n/a n/a n/a n/a Ontario 30.1 30.2 30.3 30.0 30.0 0.0 Manitoba 30.4 30.5 30.5 30.3 29.7 -2.1 Saskatchewan 31.2 31.2 31.3 30.9r 31.0 +0.3 Alberta 31.3 31.4 31.0 30.9r 30.6 -0.8 British Columbia 30.5 30.5 30.5 30.0 29.8 -1.0 Yukon 31.7 25.9 28.1 27.8r 26.4 -5.1 Northwest Territories 24.9 26.5 25.7 27.8 24.4 -12.4 Nunavut 28.0 28.6 24.0 27.3r 25.1 -7.8 Gender Men 17.3 16.5 16.6 16.1r 16.2 +1.0 Women 32.4 32.6 32.6 32.6 32.5 -0.1 Age 24 years old and under 31.7 31.8 31.6 31.4 31.3 -0.3 25 to 29 years old 31.2 31.2 31.4 31.2 31.0 -0.5 30 to 34 years old 30.4 30.6 30.5 30.3 30.2 -0.3 35 to 39 years old 29.3 29.4 29.4 29.2 28.9 -0.9 40 years old and over 26.9 26.2 26.0 25.5r 26.1 +2.3 Canada 30.3 30.4 30.4 30.1 30.0 -0.4 - Note: Percentage change is based on unrounded numbers. Includes claims for which at least $1 of EI parental benefits was paid. Based on completed claims which include those that are terminated and those that are dormant and remained inactive as of August the following fiscal year.
- 1 Starting December 3, 2017, parents can choose between receiving standard or extended parental benefits. Standard parental benefits are equivalent to the parental benefits offered in previous fiscal years, that is, up to 35 weeks of parental benefits paid at 55% of the average weekly insurable earnings. Extended parental benefits offer up to 61 weeks of benefits at 33% of the average weekly insurable earnings. Given the low number of completed extended parental claims in FY1718, duration estimates for those claims are not reported.
- 2 Since January 2006, Quebec has administered its own maternity benefits under the Quebec Parental Insurance Plan.
- p Preliminary.
- r Revised.
- Source: Employment and Social Development Canada, Employment Insurance (EI) administrative data. Data are based on a 10% sample of EI administrative data.
Annex 2.15.3 – Parental benefits (biological and adoptive): Average weekly benefit rate1 ($) Province or territory FY1314 FY1415 FY1516 FY1617 FY1718 Change (%)
FY1617 to FY1718 (standard)Standard2 Extended3 Newfoundland and Labrador 429 433 441 460 448 289 -2.7 Prince Edward Island 402 428 438 440 449 281 +2.1 Nova Scotia 413 411 427 432 446 277 +3.4 New Brunswick 406 418 425 434 442 261 +1.7 Quebec4 n/a n/a n/a n/a n/a n/a n/a Ontario 429 438 448 458 466 289 +1.8 Manitoba 401 419 427 444 435 286 -2.0 Saskatchewan 419 433 448 463 464 242 +0.1 Alberta 434 448 457 468 475 291 +1.3 British Columbia 420 434 440 450 462 280 +2.6 Yukon 460 469 483 498 520 328 c +4.4 Northwest Territories 490 498 503 513 502 -2.1 Nunavut 470 451 464 491 478 -2.6 Gender Men 467 480 491 503 507 310 +0.8 Women 419 430 439 449 455 285 +1.5 Age 24 years old and under 315 327 336 336 346 243 +3.2 25 to 29 years old 408 417 426 438 443 267 +1.3 30 to 34 years old 446 457 465 476 481 294 +1.0 35 to 39 years old 453 468 475 484 490 298 +1.4 40 years old and over 459 466 477 489 493 315 +0.9 Canada 426 437 446 457 464 286 +1.5 - Note: Percentage change is based on unrounded numbers. Includes claims for which at least $1 of EI parental benefits was paid.
- 1 Takes into account Family Supplement top-ups paid to claimants with parental benefits.
- 2 Starting December 3, 2017, parents can choose between receiving standard or extended parental benefits. Standard parental benefits are equivalent to the parental benefits offered in previous fiscal years, that is, up to 35 weeks of parental benefits paid at 55% of the average weekly insurable earnings.
- 3 Extended parental benefits offer up to 61 weeks of parental benefits paid at 33% of the average weekly insurable earnings.
- 4 Since January 2006, Quebec has administered its own parental benefits under the Quebec Parental Insurance Plan.
- c For confidentiality purposes, data for Yukon, Northwest Territories and Nunavut have been combined.
- Source: Employment and Social Development Canada, Employment Insurance (EI) administrative data. Data are based on a 10% sample of EI administrative data.
Annex 2.15.4 – Parental benefits (biological and adoptive): Amount paid1 ($ million) Province or territory FY1314 FY1415 FY1516 FY1617 FY1718 Change (%)
FY1617 to FY1718 (total)Standard2 Extended3 Total Newfoundland and Labrador 38.1 41.3 39.9 42.0 42.6 0.0 42.6 +1.4 Prince Edward Island 11.9 15.7 15.4 14.4 15.0 0.0 15.1 +4.8 Nova Scotia 67.0 72.4 77.0 79.4 77.1 0.0 77.1 -2.9 New Brunswick 61.0 59.0 61.8 62.5 59.8 0.0 59.8 -4.4 Quebec4 n/a n/a n/a n/a n/a n/a n/a n/a Ontario 1,216.3 1,258.4 1,297.7 1,328.0 1,374.9 0.5 1,375.4 +3.6 Manitoba 116.9 120.3 125.0 126.1 130.9 0.0 131.0 +3.9 Saskatchewan 111.5 110.3 121.1 127.8 133.6 0.0 133.6 +4.5 Alberta 420.3 446.7 497.7 501.7 495.1 0.2 495.3 -1.3 British Columbia 363.8 382.3 395.9 409.5 433.3 0.1 433.4 +5.8 Yukon 4.8 4.9 3.4 4.2 14.8 c 0.0 c 5.0 +19.4 Northwest Territories 6.4 5.3 4.6 6.6 5.7 -12.9 Nunavut 3.6 3.4 3.9 2.8 4.1 +48.0 Gender Men 195.9 205.1 213.5 233.7 251.8 0.6 252.4 +8.0 Women 2,225.7 2,314.9 2,430.0 2,471.4 2,525.4 0.4 2,525.7 +2.2 Age 24 years old and under 179.6 183.0 191.9 177.8 176.0 0.1 176.1 -1.0 25 to 29 years old 675.9 683.1 705.8 707.4 698.4 0.2 698.6 -1.2 30 to 34 years old 955.8 1,010.3 1,080.1 1,116.0 1,154.2 0.4 1,154.6 +3.5 35 to 39 years old 488.5 514.1 530.6 565.6 595.2 0.2 595.4 +5.3 40 years old and over 121.9 129.5 135.1 138.3 153.4 0.1 153.5 +11.0 Canada 2,421.6 2,520.1 2,643.5 2,705.1 2,777.1 1.0 2,778.1 +2.7 - Note: Data may not add up to the total due to rounding. Percentage change is based on unrounded numbers. Includes claims for which at least $1 of EI parental benefits was paid.
- 1 Takes into account Family Supplement top-ups paid to claimants with parental benefits.
- 2 Starting December 3, 2017, parents can choose between receiving standard or extended parental benefits. Standard parental benefits are equivalent to the parental benefits offered in previous fiscal years, that is, up to 35 weeks of parental benefits paid at 55% of the average weekly insurable earnings.
- 3 Extended parental benefits offer up to 61 weeks of parental benefits paid at 33% of the average weekly insurable earnings.
- 4 Since January 2006, Quebec has administered its own parental benefits under the Quebec Parental Insurance Plan.
- c For confidentiality purposes, data for Yukon, Northwest Territories and Nunavut have been combined.
- Source: Employment and Social Development Canada, Employment Insurance (EI) administrative data. Data are based on a 10% sample of EI administrative data.
-
Annex 2.16 Sickness benefits
Annex 2.16.1 – Sickness benefits: New claims established Province or territory FY1314 FY1415 FY1516 FY1617 FY1718 Change (%) FY1617 to FY1718 Newfoundland and Labrador 9,460 9,930 10,170 10,140 11,070 +9.2 Prince Edward Island 5,050 5,520 5,780 6,000 6,100 +1.7 Nova Scotia 16,530 16,570 18,500 19,070 21,060 +10.4 New Brunswick 20,440 21,080 22,800 24,830 29,440 +18.6 Quebec 104,120 105,880 111,420 119,210 131,510 +10.3 Ontario 92,650 93,470 99,060 105,010 111,480 +6.2 Manitoba 9,960 9,990 10,590 9,970 11,250 +12.8 Saskatchewan 7,070 6,910 7,640 7,060 7,670 +8.6 Alberta 24,680 25,430 29,240 26,520 27,750 +4.6 British Columbia 46,210 49,580 49,490 50,170 53,710 +7.1 Yukon 300 330 430 420 450 +7.1 Northwest Territories 220 250 250 200 250 +25.0 Nunavut 110 130 110 100 130 +30.0 Gender Men 144,300 149,630 160,580 163,870 179,810 +9.7 Women 192,500 195,440 204,900 214,830 232,060 +8.0 Age 24 years old and under 25,360 25,410 27,730 28,710 29,990 +4.5 25 to 34 years old 70,380 72,060 77,030 80,220 88,670 +10.5 35 to 44 years old 68,700 69,800 74,860 76,310 83,000 +8.8 45 to 54 years old 88,030 87,430 89,420 90,600 96,350 +6.3 55 to 64 years old 71,460 76,270 80,310 84,940 93,830 +10.5 65 years old and over 12,870 14,100 16,130 17,920 20,030 +11.8 Canada 336,800 345,070 365,480 378,700 411,870 +8.8 - Note: Includes claims for which at least $1 of EI sickness benefits was paid.
- Source: Employment and Social Development Canada, Employment Insurance (EI) administrative data. Data are based on a 10% sample of EI administrative data.
Annex 2.16.2 – Sickness benefits: Average actual duration (number of weeks) Province or territory FY1314 FY1415 FY1516 FY1617 FY1718p Change (%) FY1617 to FY1718 Newfoundland and Labrador 10.1 9.9 9.6 9.8r 9.7 -0.8 Prince Edward Island 8.1 7.9 7.8 7.8 8.2 +4.4 Nova Scotia 9.4 9.5 9.0 9.3 9.1 -2.8 New Brunswick 8.4 8.5 8.3 8.5 8.3 -2.0 Quebec 9.1 9.1 9.0 9.1r 9.0 -0.7 Ontario 10.5 10.5 10.6 10.7r 10.7 +0.3 Manitoba 10.1 10.5 10.2 10.6r 10.1 -4.5 Saskatchewan 10.3 10.1 10.4 10.8 10.3 -5.3 Alberta 10.7 10.8 10.7 10.8 10.5 -3.0 British Columbia 10.6 10.6 10.7 10.7r 10.6 -0.4 Yukon 10.0 9.1 10.0 8.9r 10.2 +14.3 Northwest Territories 10.3 10.5 9.9 10.3r 10.9 +5.3 Nunavut 10.2 11.2 13.3 10.1 14.7 +45.9 Gender Men 9.5 9.5 9.5 9.6r 9.5 -1.1 Women 10.1 10.1 10.1 10.2r 10.1 -1.2 Age 24 years old and under 8.8 9.1 8.8 8.9 9.0 +0.6 25 to 34 years old 9.2 9.2 9.1 9.1 9.1 -0.5 35 to 44 years old 9.8 9.8 9.7 9.9r 9.7 -1.4 45 to 54 years old 10.1 10.1 10.0 10.2r 10.1 -0.8 55 to 64 years old 10.4 10.4 10.4 10.5 10.3 -2.8 65 years old and over 11.0 11.0 10.9 10.8 10.8 -0.1 Canada 9.8 9.9 9.8 9.9r 9.8 -1.1 - Note: Percentage change is based on unrounded numbers. Includes claims for which at least $1 of EI sickness benefits was paid. Based on completed claims which include those that are terminated and those that are dormant and remained inactive as of August the following fiscal year.
- p Preliminary.
- r Revised.
- Source: Employment and Social Development Canada, Employment Insurance (EI) administrative data. Data are based on a 10% sample of EI administrative data
Annex 2.16.3 – Sickness benefits: Average weekly benefit rate1 ($) Province or territory FY1314 FY1415 FY1516 FY1617 FY1718 Change (%) FY1617 to FY1718 Newfoundland and Labrador 390 399 415 429 431 +0.5 Prince Edward Island 382 389 400 418 425 +1.7 Nova Scotia 383 391 400 408 417 +2.2 New Brunswick 390 400 416 417 430 +3.1 Quebec 380 390 398 405 416 +2.6 Ontario 386 397 408 420 430 +2.4 Manitoba 392 405 419 417 425 +1.8 Saskatchewan 401 417 428 438 442 +1.1 Alberta 420 436 448 446 454 +1.7 British Columbia 389 394 408 419 428 +2.2 Yukon 444 453 470 490 488 -0.4 Northwest Territories 483 449 502 517 497 -3.8 Nunavut 500 467 455 430 520 +20.9 Gender Men 427 438 448 455 464 +2.0 Women 359 368 379 388 397 +2.4 Age 24 years old and under 323 331 346 351 355 +1.1 25 to 34 years old 388 398 410 417 427 +2.5 35 to 44 years old 404 415 426 433 442 +2.2 45 to 54 years old 397 407 421 428 439 +2.5 55 to 64 years old 390 400 407 418 427 +2.2 65 years old and over 358 368 381 391 398 +1.9 Canada 388 398 409 417 426 +2.3 - Note: Percentage change is based on unrounded numbers. Includes claims for which at least $1 of EI sickness benefits was paid.
- 1 Takes into account Family Supplement top-ups paid to claimants with sickness benefits.
- Source: Employment and Social Development Canada, Employment Insurance (EI) administrative data. Data are based on a 10% sample of EI administrative data.
Annex 2.16.4 – Sickness benefits: Amount paid1 ($ million) Province or territory FY1314 FY1415 FY1516 FY1617 FY1718 Change (%) FY1617 to FY1718 Newfoundland and Labrador 37.8 38.7 43.0 45.1 49.0 +8.6 Prince Edward Island 15.7 17.0 17.3 20.2 21.1 +4.7 Nova Scotia 59.9 58.9 65.8 74.0 79.0 +6.8 New Brunswick 70.1 71.6 74.3 92.7 103.7 +11.8 Quebec 362.4 367.9 400.0 428.8 490.2 +14.3 Ontario 368.9 386.1 424.3 461.8 502.3 +8.8 Manitoba 38.0 41.6 44.9 43.7 47.3 +8.3 Saskatchewan 28.3 28.9 33.6 35.4 34.6 -2.1 Alberta 107.5 113.0 136.1 138.2 138.3 +0.1 British Columbia 184.6 204.7 212.9 223.9 242.3 +8.2 Yukon 1.5 1.3 1.8 2.1 1.9 -9.5 Northwest Territories 1.4 1.1 1.3 0.9 1.5 +57.7 Nunavut 0.6 0.7 0.5 0.7 0.9 +28.6 Gender Men 601.5 621.1 684.5 745.5 797.0 +6.9 Women 675.3 710.6 771.5 821.9 915.0 +11.3 Age 24 years old and under 73.9 75.2 81.9 91.5 98.6 +7.8 25 to 34 years old 245.2 256.4 283.9 307.8 340.3 +10.6 35 to 44 years old 268.1 278.2 308.2 327.3 353.2 +7.9 45 to 54 years old 353.4 357.4 375.7 396.9 425.7 +7.3 55 to 64 years old 285.9 308.5 341.5 370.0 407.1 +10.0 65 years old and over 50.4 55.9 64.8 74.0 87.2 +17.8 Canada 1,276.8 1,331.7 1,456.0 1,567.4 1,712.0 +9.2 - Note: Data may not add up to the total due to rounding. Percentage change is based on unrounded numbers. Includes claims for which at least $1 of EI sickness benefits was paid.
- 1 Takes into account Family Supplement top-ups paid to claimants with sickness benefits.
- Source: Employment and Social Development Canada, Employment Insurance (EI) administrative data. Data are based on a 10% sample of EI administrative data.
-
Annex 2.17 Sickness benefits (by industry)
Annex 2.17.1 – Sickness benefits (by industry): Employment (totals in thousands) Industry FY1314 Employment (000s) FY1314 Share (%) FY1718 Employment (000s) FY1718 Share (%) Goods-producing industries 3,913.8 22.1 3,904.0 21.1 Agriculture, forestry, fishing, hunting, mining and oil and gas extraction 685.2 3.9 610.7 3.3 Utilities 137.5 0.8 132.4 0.7 Construction 1,372.2 7.7 1,420.0 7.7 Manufacturing 1,718.8 9.7 1,741.0 9.4 Services-producing industries 13,812.9 77.9 14,583.6 78.9 Wholesale and retail trade 2,718.8 15.3 2,819.2 15.2 Transportation and warehousing 888.1 5.0 955.6 5.2 Finance, insurance, real estate, rental and leasing 1,083.3 6.1 1,172.1 6.3 Professional, scientific and technical services 1,323.5 7.5 1,454.6 7.9 Business, building and other support services1 741.7 4.2 756.2 4.1 Educational services 1,223.5 6.9 1,289.9 7.0 Health care and social assistance 2,192.9 12.4 2,389.2 12.9 Information, culture and recreation2 759.0 4.3 789.8 4.3 Accommodation and food services 1,177.3 6.6 1,212.2 6.6 Other services (except public administration) 796.6 4.5 786.0 4.3 Public administration 908.4 5.1 958.9 5.2 Unclassified n/a n/a n/a n/a Canada 17,726.6 100.0 18,487.7 100.0 - Note: Data may not add up to the total due to rounding.
- 1 This industry category comprises the industries with codes 55 (Management of companies and enterprises) and 56 (Administrative and support, waste management and mediation services) from the North American Industry Classification System.
- 2 This industry category comprises the industries with codes 51 (Information and cultural industries) and 71 (Arts, entertainment and recreation) from the North American Industry Classification System.
- Source: Statistics Canada, Labour Force Survey, Table 14-10-0022-01.
Annex 2.17.2 – Sickness benefits (by industry): Number of claims (totals in thousands) Industry FY1314 New claims (000s) FY1314 Share (%) FY1718 New claims (000s) FY1718 Share (%) Goods-producing industries 89.0 26.4 110.0 26.7 Agriculture, forestry, fishing, hunting, mining and oil and gas extraction 16.4 4.9 16.8 4.1 Utilities 0.5 0.2 0.5 0.1 Construction 32.6 9.7 41.6 10.1 Manufacturing 39.5 11.7 51.1 12.4 Services-producing industries 237.5 70.5 291.7 70.8 Wholesale and retail trade 55.0 16.3 67.9 16.5 Transportation and warehousing 18.1 5.4 22.4 5.4 Finance, insurance, real estate, rental and leasing 9.6 2.9 12.9 3.1 Professional, scientific and technical services 9.0 2.7 12.0 2.9 Business, building and other support services1 26.6 7.9 30.3 7.4 Educational services 9.8 2.9 11.6 2.8 Health care and social assistance 39.8 11.8 50.7 12.3 Information, culture and recreation2 7.6 2.3 8.5 2.1 Accommodation and food services 26.3 7.8 31.9 7.7 Other services (except public administration) 14.6 4.3 16.5 4.0 Public administration 21.1 6.3 27.2 6.6 Unclassified 10.4 3.1 10.1 2.5 Canada 336.8 100.0 411.9 100.0 - Note: Data may not add up to the total due to rounding. Percentage share is based on unrounded numbers. Includes claims for which at least $1 of EI sickness benefits was paid.
- 1 This industry category comprises the industries with codes 55 (Management of companies and enterprises) and 56 (Administrative and support, waste management and mediation services) from the North American Industry Classification System.
- 2 This industry category comprises the industries with codes 51 (Information and cultural industries) and 71 (Arts, entertainment and recreation) from the North American Industry Classification System.
- Source: Employment and Social Development Canada, Employment Insurance (EI) administrative data. Data are based on a 10% sample of EI administrative data.
Annex 2.17.3 – Sickness benefits (by industry): Amount paid ($ million) Industry FY1314 Amount paid FY1314 Share (%) FY1718 Amount paid FY1718 Share (%) Goods-producing industries 362.8 28.4 484.7 28.3 Agriculture, forestry, fishing, hunting, mining and oil and gas extraction 59.1 4.6 75.0 4.4 Utilities 2.0 0.2 2.6 0.2 Construction 148.9 11.7 193.9 11.3 Manufacturing 152.9 12.0 213.1 12.4 Services-producing industries 883.6 69.2 1,191.7 69.6 Wholesale and retail trade 182.8 14.3 249.6 14.6 Transportation and warehousing 81.1 6.4 106.5 6.2 Finance, insurance, real estate, rental and leasing 38.0 3.0 57.3 3.3 Professional, scientific and technical services 36.1 2.8 51.8 3.0 Business, building and other support services1 96.7 7.6 121.8 7.1 Educational services 33.1 2.6 44.8 2.6 Health care and social assistance 160.8 12.6 222.0 13.0 Information, culture and recreation2 27.3 2.1 35.2 2.1 Accommodation and food services 77.4 6.1 104.6 6.1 Other services (except public administration) 54.4 4.3 65.7 3.8 Public administration 95.9 7.5 132.4 7.7 Unclassified 30.4 2.4 35.7 2.1 Canada 1,276.8 100.0 1,712.0 100.0 - Note: Data may not add up to the total due to rounding. Percentage share is based on unrounded numbers. Includes claims for which at least $1 of EI sickness benefits was paid.
- 1 This industry sector comprises the industries with codes 55 (Management of companies and enterprises) and 56 (Administrative and support, waste management and remediation services) from the North American Industry Classification System.
- 2 This industry sector comprises industries with codes 51 (Information and cultural industries) and 71 (Arts, entertainment and recreation) from the North American Industry Classification System.
- Source: Employment and Social Development Canada, Employment Insurance (EI) administrative data. Data are based on a 10% sample of EI administrative data.
-
Annex 2.18 Compassionate care benefits
Annex 2.18.1 – Compassionate care benefits: New claims established Province or territory FY1314 FY1415 FY1516 FY1617 FY1718 Change (%) FY1617 to FY1718 Newfoundland and Labrador 64 76 92 106 129 +21.7 Prince Edward Island 36 33 51 55 66 +20.0 Nova Scotia 169 170 243 367 351 -4.4 New Brunswick 121 143 205 245 283 +15.5 Quebec 912 1,046 1,319 1,759 1,808 +2.8 Ontario 2,712 2,738 3,465 4,452 4,966 +11.5 Manitoba 245 229 297 391 397 +1.5 Saskatchewan 199 157 200 258 284 +10.1 Alberta 553 675 741 1,002 1,032 +3.0 British Columbia 947 948 1,238 1,523 1,658 +8.9 Yukon 23c 29c 20c 35c 36c +2.9 Northwest Territories Nunavut Gender Men 1,637 1,833 2,260 2,812 3,120 +11.0 Women 4,344 4,411 5,611 7,381 7,890 +6.9 Age 24 years old and under 99 118 138 176 167 -5.1 25 to 44 years old 1,982 2,099 2,450 3,259 3,494 +7.2 45 to 54 years old 2,189 2,172 2,758 3,461 3,641 +5.2 55 years old and over 1,711 1,855 2,525 3,297 3,708 +12.5 Canada 5,981 6,244 7,871 10,193 11,010 +8.0 - Note: Includes claims for which at least $1 of EI compassionate care benefits was paid.
- c For confidentiality purposes, data for Yukon, Northwest Territories and Nunavut have been combined.
- Source: Employment and Social Development Canada, Employment Insurance (EI) administrative data. Data are based on a 100% sample of EI administrative data.
Annex 2.18.2 – Compassionate care benefits: Average actual duration (number of weeks) Province or territory FY1314r FY1415r FY15161, r FY1617r FY1718p Change (%) FY1617 to FY1718 Newfoundland and Labrador 5.3 4.6 5.0 9.7 13.4 +37.6 Prince Edward Island 4.9 4.6 5.1 11.0 13.0 +18.1 Nova Scotia 4.7 4.9 5.0 10.8 13.4 +23.3 New Brunswick 4.7 4.6 4.5 10.3 13.4 +30.4 Quebec 4.5 4.4 4.4 8.6 10.8 +25.9 Ontario 4.7 4.7 4.6 9.8 11.8 +20.4 Manitoba 4.7 4.7 4.8 10.2 12.1 +18.7 Saskatchewan 4.8 5.1 5.0 11.7 12.5 +6.4 Alberta 5.0 5.0 5.0 10.0 12.9 +28.5 British Columbia 4.8 4.8 4.7 10.3 12.4 +20.3 Yukon 5.0c 4.8c 4.3c 11.1c 14.6c +31.4 Northwest Territories Nunavut Gender Men 4.7 4.8 4.7 9.7 12.1 +25.4 Women 4.7 4.7 4.6 9.9 11.9 +20.7 Age 24 years old and under 4.5 4.8 4.8 9.8 11.1 +13.5 25 to 44 years old 4.6 4.6 4.6 9.5 11.3 +19.8 45 to 54 years old 4.6 4.6 4.6 9.5 11.9 +24.7 55 years old and over 4.9 4.9 4.8 10.5 12.8 +21.4 Canada 4.7 4.7 4.6 9.8 12.0 +22.0 - Note: Percentage change is based on unrounded numbers. Includes claims for which at least $1 of EI compassionate care benefits was paid. Based on completed claims which include those that are terminated and those that are dormant and remained inactive as of August the following fiscal year.
- 1 Starting January 3, 2016, compassionate care benefits were enhanced to allow claimants to collect up to 26 weeks of benefits, an increase from the maximum of 6 weeks previously available.
- c For confidentiality purposes, data for Yukon, Northwest Territories and Nunavut have been combined.
- p Preliminary.
- r Revised. In the FY1617 Employment Insurance Monitoring and Assessment Report, previous year's statistics on the actual duration of compassionate care benefits were estimated using a 10% sample of EI administrative data. In the FY1718 report, those estimates are reported based on a 100% sample of EI administrative data.
- Source: Employment and Social Development Canada, Employment Insurance (EI) administrative data. Data are based on a 100% sample of EI administrative data.
Annex 2.18.3 – Compassionate care benefits: Average weekly benefit rate1 ($) Province or territory FY1314 FY1415 FY1516 FY1617 FY1718 Change (%) FY1617 to FY1718 Newfoundland and Labrador 407 410 421 433 448 +3.5 Prince Edward Island 373 405 411 417 450 +8.1 Nova Scotia 364 395 399 411 418 +1.5 New Brunswick 384 397 392 403 417 +3.4 Quebec 393 411 412 414 429 +3.5 Ontario 419 431 438 450 461 +2.5 Manitoba 398 415 425 448 454 +1.4 Saskatchewan 439 445 465 463 459 -0.7 Alberta 441 457 464 470 477 +1.6 British Columbia 421 427 439 453 459 +1.2 Yukon 451c 493c 460c 498c 521c +4.5 Northwest Territories Nunavut Gender Men 446 461 468 478 488 +2.1 Women 403 414 420 431 441 +2.3 Age 24 years old and under 351 361 364 380 386 +1.7 25 to 44 years old 427 440 448 457 466 +1.9 45 to 54 years old 418 432 439 454 464 +2.1 55 years old and over 401 412 417 423 436 +3.1 Canada 415 428 434 444 454 +2.3 - Note: Percentage change is based on unrounded numbers. Includes claims for which at least $1 of EI compassionate care benefits was paid.
- 1 Takes into account Family Supplement top-ups paid to claimants with compassionate care benefits.
- c For confidentiality purposes, data for Yukon, Northwest Territories and Nunavut have been combined.
- Source: Employment and Social Development Canada, Employment Insurance (EI) administrative data. Data are based on a 100% sample of EI administrative data.
Annex 2.18.4 – Compassionate care benefits: Amount paid1 ($ million) Province or territory FY13142 FY1415 FY1516 FY1617 FY1718 Change (%) FY1617 to FY1718 Newfoundland and Labrador 0.2 0.2 0.2 0.6 0.8 +29.1 Prince Edward Island 0.1 0.1 0.1 0.3 0.4 +13.8 Nova Scotia 0.3 0.3 0.6 2.1 2.0 -2.2 New Brunswick 0.3 0.3 0.5 1.4 1.5 +5.6 Quebec 1.7 1.9 2.8 7.7 8.5 +11.6 Ontario 5.4 5.5 8.0 23.0 27.3 +18.9 Manitoba 0.4 0.5 0.7 2.2 2.2 +2.8 Saskatchewan 0.4 0.4 0.5 1.7 1.8 +5.8 Alberta 1.3 1.5 2.0 6.1 6.7 +8.9 British Columbia 2.0 1.9 2.9 8.8 9.5 +8.1 Yukon 0.1 c 0.1 c 0.1 c 0.2 c 0.3 c +15.0 Northwest Territories Nunavut Gender Men 3.7 4.1 5.9 16.8 19.1 +13.5 Women 8.3 8.5 12.4 37.3 42.0 +12.5 Age 24 years old and under 0.2 0.2 0.3 0.7 0.8 +6.1 25 to 44 years old 4.1 4.2 5.8 17.0 18.9 +11.1 45 to 54 years old 4.4 4.4 6.4 18.5 20.5 +10.8 55 years old and over 3.4 3.8 5.9 17.9 21.0 +16.9 Canada 12.0 12.5 18.3 54.1 61.1 +12.8 - Note: Data may not add up to the total due to rounding. Percentage change is based on unrounded numbers. Includes claims for which at least $1 of EI compassionate care benefits was paid.
- 1 Takes into account Family Supplement top-ups paid to claimants with compassionate care benefits.
- 2 Amount paid for FY1314 are based on the province or territory where the claimant lived at the end of his/her claim, whereas, for other fiscal years, amount paid are based on the province or territory at the time the claim was established.
- c For confidentiality purposes, data for Yukon, Northwest Territories and Nunavut have been combined.
- Source: Employment and Social Development Canada, Employment Insurance (EI) administrative data. Data are based on a 100% sample of EI administrative data.
-
Annex 2.19 Family caregiver benefit for adults
Annex 2.19 – Family caregiver benefit for adults1, FY1718 Province or territory New claims established Average weekly benefit rate ($) Amount paid ($ thousand) Newfoundland and Labrador 49 406 134.1 Prince Edward Island 18 543 47.4 Nova Scotia 68 376 179.8 New Brunswick 67 398 210.9 Quebec 505 412 1,466.3 Ontario 1,199 457 3,487.7 Manitoba 82 438 235.6 Saskatchewan 61 479 181.1 Alberta 221 485 693.4 British Columbia and territories 338c 448c 988.0c Unknown 27 n/a 37.0 Gender Men 815 491 2,647.4 Women 1,820 429 5,013.9 Age 24 years old and under 36 428 76.1 25 to 44 years old 714 471 2,124.4 45 to 54 years old 830 461 2,438.6 55 years old and over 1,055 417 3,022.3 Canada 2,635 447 7,661.3 - Note: Data may not add up to the total due to rounding. Includes claims for which at least $1 of benefits for family caregiver for adults was paid.
- 1 The family caregiver benefit for adults have been available since December 3, 2017.
- c For confidentiality purposes, data for Yukon, Northwest Territories, and Nunavut have been combined with British Columbia.
- Source: Employment and Social Development Canada, Employment Insurance (EI) administrative data. Data are based on a 100% sample of EI administrative data from Service Canada's Manual Pay System.
-
Annex 2.20 Family caregiver benefit for children
Annex 2.20.1 – Family caregiver benefit for children1: New claims established Province or territory FY1314 FY1415 FY1516 FY1617 FY1718 Change (%)
FY1617 to FY1718Newfoundland and Labrador 11 32 58 44r 65 +47.7 Prince Edward Island 6 10 26 22 18 -18.2 Nova Scotia 41 64 73 86r 93 +8.1 New Brunswick 34 77 74 92r 96 +4.3 Quebec 297 642 822 889r 882 -0.8 Ontario 507 1,010 1,329 1,570r 1,936 +23.3 Manitoba 51 92 129 158r 181 +14.6 Saskatchewan 36 77 142 153 200 +30.7 Alberta 192 408 558 613r 747 +21.9 British Columbia 163 349 466 553r 633 +14.5 Yukon 5 c 5 c 13 c 16 c, r 12 c -25.0 Northwest Territories Nunavut Unknown 287 80 50 42 40 -4.8 Gender Men 367 567 751 818 1,007 +23.1 Women 1,263 2,279 2,989 3,420r 3,896 +13.9 Age 24 years old and under 95 180 216 225r 255 +13.3 25 to 44 years old 1,370 2,454 3,276 3,766r 4,268 +13.3 45 to 54 years old 156 194 226 227r 340 +49.8 55 years old and over 9 18 22 20 40 +100.0 Canada 1,630 2,846 3,740 4,238r 4,903 +15.7 - Note: Includes claims for which at least $1 of benefits for family caregiver for children was paid. All family caregiver benefits for children that are shared between two parents are considered as two separate claims.
- 1 As of December 3, 2017, EI Parents of Critically Ill Children benefits have been renamed family caregiver benefit for children as part of the Budget Implementation Act, 2017, No. 1. The benefits for Parents of Critically Ill Children started to be available on June 2013.
- c For confidentiality purposes, data for Yukon, Northwest Territories, and Nunavut have been combined.
- r Revised.
- Source: Employment and Social Development Canada, Employment Insurance (EI) administrative data. Data are based on a 100% sample of EI administrative data from Service Canada's Manual Pay System.
Annex 2.20.2 – Family caregiver benefit for children1: Average actual duration2 (number of weeks) Province or territory FY1314 FY1415 FY1516 FY1617 FY1718P Change (%)
FY1617 to FY1718Newfoundland and Labrador 26.6 21.4 17.8 17.1 21.7 +27.0 Prince Edward Island 11.6 10.8 11.0 24.7 20.2 -18.2 Nova Scotia 15.7 19.6 20.6 20.5 19.5 -4.8 New Brunswick 9.1 16.2 21.0 19.3 20.3 +5.3 Quebec 13.1 15.2 14.6 14.6 15.3 +4.3 Ontario 15.9 16.6 20.9 20.4r 17.8 -12.4 Manitoba 19.7 16.0 19.9 19.6 16.2 -17.2 Saskatchewan 10.4 15.1 21.4 18.7r 16.7 -10.9 Alberta 15.8 16.5 21.1 20.9 19.4 -7.5 British Columbia 15.3 16.3 20.2 17.8r 18.6 +4.2 Yukon 23.3 c 19.6 c 10.5 c 25.0 c 11.1c -55.4 Northwest Territories Nunavut Unknown 10.7 13.0 7.4 6.1r 5.9 -3.2 Gender Men 12.9 14.9 16.0 14.3 13.8 -3.7 Women 14.1 16.5 18.3 18.7 18.4 -2.0 Age 24 years old and under 12.7 15.0 15.8 16.2r 15.4 -5.0 25 to 44 years old 13.5 15.8 17.2 16.8r 16.3 -3.0 45 to 54 years old 16.9 22.1 21.5 21.7 20.0 -8.1 55 years old and over 17.5 11.9 12.7 21.9 19.2 -12.6 Canada 13.8 16.2 17.5 17.3r 16.7 -3.3 - Note: Percentage change is based on unrounded numbers. Includes claims for which at least $1 of benefits for family caregiver for children was paid.
- 1 As of December 3, 2017, EI Parents of Critically Ill Children benefits have been renamed family caregiver benefit for children as part of the Budget Implementation Act, 2017, No. 1. The benefits for Parents of Critically Ill Children started to be available on June 2013.
- 2 Results on the actual duration of benefits for family caregiver for children have been estimated using all claims established over the fiscal year.
- c For confidentiality purposes, data for Yukon, Northwest Territories, and Nunavut have been combined.
- p Preliminary.
- r Revised.
- Source: Employment and Social Development Canada, Employment Insurance (EI) administrative data. Data are based on a 100% sample of EI administrative data from Service Canada's Manual Pay System.
Annex 2.20.3 – Family caregiver benefit for children1: Average weekly benefit rate2 ($) Province or territory FY1314 FY1415 FY1516 FY1617 FY1718 Change (%)
FY1617 to FY1718Newfoundland and Labrador 323 431 422 447r 424 -5.3 Prince Edward Island 373 376 467 437 447 +2.3 Nova Scotia 436 396 403 441 423 -3.9 New Brunswick 450 415 435 385r 432 +12.2 Quebec 410 423 435 442 447 +1.0 Ontario 425 435 443 455r 467 +2.7 Manitoba 419 432 431 435 478 +9.9 Saskatchewan 431 452 477 442 444 +0.4 Alberta 455 452 457 461r 470 +2.0 British Columbia 417 434 447 444r 469 +5.6 Yukon 501 c 501 c 442 c 454 c 532 c +17.2 Northwest Territories Nunavut Gender Men 456 457 474 481 494 +2.6 Women 416 428 424 429r 437 +1.7 Age 24 years old and under 350 346 376 370r 381 +2.9 25 to 44 years old 433 441 445 451r 461 +2.2 45 to 54 years old 396 431 435 440r 466 +5.8 55 years old and over 371 409 418 458r 423 -7.7 Canada 425 433 440 446r 457 +2.5 - Note: Percentage change is based on unrounded numbers. Includes claims for which at least $1 of benefits for family caregiver for children was paid.
- 1 As of December 3, 2017, EI Parents of Critically Ill Children benefits have been renamed family caregiver benefit for children as part of the Budget Implementation Act, 2017, No. 1. The benefits for Parents of Critically Ill Children started to be available on June 2013.
- 2 Takes into account Family Supplement top-ups paid to claimants with benefits for family caregiver for children.
- c For confidentiality purposes, data for Yukon, Northwest Territories, and Nunavut have been combined.
- r Revised.
- Source: Employment and Social Development Canada, Employment Insurance (EI) administrative data. Data are based on a 100% sample of EI administrative data from Service Canada's Manual Pay System.
Annex 2.20.4 – Family caregiver benefit for children1: Amount paid2 ($ million) Province or territory FY1314 FY1415 FY1516 FY1617 FY1718 Change (%)
FY1617 to FY1718Newfoundland and Labrador 0.1 0.3 0.3 0.4r 0.4 +22.0 Prince Edward Island 0.0 0.0 0.2 0.1 0.1 -3.6 Nova Scotia 0.3 0.5 0.5 0.6 0.5 -5.5 New Brunswick 0.2 0.4 0.5 0.5 0.5 +2.9 Quebec 1.4 4.0 4.9 5.5 5.8 +4.3 Ontario 3.1 6.8 8.9 10.0r 12.0 +19.9 Manitoba 0.3 0.6 0.8 1.0 1.1 +14.0 Saskatchewan 0.2 0.5 0.9 0.9 1.2 +26.0 Alberta 1.2 2.9 3.7 4.3r 4.8 +12.4 British Columbia 0.9 2.4 2.8 3.1 3.7 +21.0 Yukon 0.0 c 0.1 c 0.1 c 0.1 c 0.1c -42.5 Northwest Territories Nunavut Unknown 1.2 0.5 0.1 0.1 0.1 +2.1 Gender Men 2.1 3.7 5.2 5.3 6.3 +20.0 Women 6.9 15.1 18.6 21.3r 24.0 +12.9 Age 24 years old and under 0.4 0.9 1.1 1.1 1.3 +23.1 25 to 44 years old 7.6 16.1 20.5 23.3 25.9 +11.1 45 to 54 years old 1.0 1.8 2.0 2.0 2.8 +37.7 55 years old and over 0.1 0.1 0.1 0.1 0.3 +145.0 Canada 8.9 18.9 23.8 26.6r 30.3 +14.3 - Note: Data may not add up to the total due to rounding. Percentage change is based on unrounded numbers. Includes claims for which at least $1 of benefits for family caregiver for children was paid.
- 1 As of December 3, 2017, EI Parents of Critically Ill Children benefits have been renamed family caregiver benefit for children as part of the Budget Implementation Act, 2017, No. 1. The benefits for Parents of Critically Ill Children started to be available on June 2013.
- 2 Takes into account Family Supplement top-ups paid to claimants with benefits for family caregiver for children.
- c For confidentiality purposes, data for Yukon, Northwest Territories, and Nunavut have been combined.
- r Revised.
- Source: Employment and Social Development Canada, Employment Insurance (EI) administrative data. Data are based on a 100% sample of EI administrative data from Service Canada's Manual Pay System.
-
Annex 2.21 Work-Sharing benefits
Annex 2.21.1 – Work-Sharing benefits: New claims established Province or territory FY1314 FY1415 FY1516 FY1617 FY1718 Change (%)
FY1617 to FY1718Newfoundland and Labrador 13 c 14 43 51 c 28 c -45.1 Prince Edward Island 82 12 Nova Scotia 151 20 c 205 145 181 +24.8 New Brunswick 67 42 16 22 +37.5 Quebec 4,759 3,580 4,451 2,737 941 -65.6 Ontario 4,512 2,255 2,849 2,017 1,737 -13.9 Manitoba 536 262 2,482 915 111 -87.9 Saskatchewan 68 742 1,035 577 85 -85.3 Alberta 1,024 631 7,939 4,872 403 -91.7 British Columbia 534 438 1,463 606 200 -67.0 Yukon 9 c 0 0 0 0 0 Northwest Territories 0 0 0 0 0 Nunavut 0 0 0 0 0 0 Gender Men 8,078 5,952 15,933 8,883 2,487 -72.0 Women 3,595 2,072 4,588 3,053 1,221 -60.0 Age 24 years old and under 546 497 1,425 718 151 -79.0 25 to 44 years old 5,689 5,130 3,475 9,463 1,403 -74.7 45 to 54 years old 4,584 3,702 2,403 5,539 1,075 -65.8 55 years old and over 2,858 2,295 1,649 4,094 1,079 -57.3 Canada 11,673 8,024 20,521 11,936 3,708 -68.9 - Notes: Includes claims for which at least $1 of EI Work-Sharing benefits was paid.
- c For confidentiality purposes, data for some provinces and territories in different years have been combined.
- Source: Employment and Social Development Canada, Employment Insurance (EI) administrative data. Data are based on a 100% sample of EI administrative data.
Annex 2.21.2 – Work-Sharing benefits: Average actual duration (number of weeks) Province or territory FY1314 FY1415 FY1516 FY1617 FY1718p Change (%)
FY1617 to FY1718Newfoundland and Labrador 20.3 c, r 17.3 18.5r 25.9 11.1 -57.1 Prince Edward Island 6.9 22.8r 16.8r 9.7 -42.3 Nova Scotia 13.5r 15.3 c 26.4r 18.5r 9.0 -51.4 New Brunswick 17.2 19.3r 11.2r 8.7 -22.3 Quebec 14.7r 13.9r 13.8r 17.6r 13.4 -23.9 Ontario 16.1r 14.7r 17.5r 12.4 11.8 -4.8 Manitoba 14.1r 16.9r 18.1r 14.7r 12.0 -18.4 Saskatchewan 11.2r 18.8r 19.5r 19.2r 15.4 -19.8 Alberta 5.3r 21.9r 25.1r 18.9r 15.3 -19.0 British Columbia 12.9r 14.8r 20.1r 12.3r 10.3 -16.3 Yukon 32.1 c n/a n/a n/a n/a n/a Northwest Territories n/a n/a n/a n/a n/a Nunavut n/a n/a n/a n/a n/a n/a Gender Men 13.9r 15.0r 19.6r 15.9r 12.0 -24.5 Women 15.2r 16.5r 21.9r 19.6r 13.4 -31.6 Age 24 years old and under 12.8r 13.1r 17.5r 16.2r 10.2 -37.0 25 to 44 years old 13.5r 15.2r 19.8r 16.6r 12.0 -27.7 45 to 54 years old 15.0r 15.7r 20.8r 17.2r 12.7 -26.2 55 years old and over 15.3r 16.0r 21.0r 17.3 13.1 -24.3 Canada 14.3r 15.4r 20.1r 16.9r 12.5 -26.0 - Note: Percentage change is based on unrounded numbers. Includes claims for which at least $1 of EI Work-Sharing benefits was paid. Based on completed claims which include those that are terminated and those that are dormant and remained inactive as of August the following fiscal year.
- p Preliminary.
- c For confidentiality purposes, data for some provinces and territories in different years have been combined.
- Source: Employment and Social Development Canada, Employment Insurance (EI) administrative data. Data are based on a 100% sample of EI administrative data.
Annex 2.21.3 – Work-Sharing benefits: Average weekly benefit rate1 ($) Province or territory FY1314 FY1415 FY1516 FY1617 FY1718 Change (%)
FY1617 to FY1718Newfoundland and Labrador 119 c 135 168 187 153 -18.1 Prince Edward Island 160 186 211 128 -39.1 Nova Scotia 117 196 c 136 137 113 -17.8 New Brunswick 127 128 176 71 -59.6 Quebec 107 120 116 113 109 -2.9 Ontario 103 118 117 118 102 -13.7 Manitoba 110 135 119 101 113 +12.4 Saskatchewan 194 196 142 142 160 +12.7 Alberta 222 146 142 137 124 -9.7 British Columbia 114 121 150 114 118 +3.0 Yukon 117 c n/a n/a n/a n/a n/a Northwest Territories n/a n/a n/a n/a n/a Nunavut n/a n/a n/a n/a n/a n/a Gender Men 123 135 136 131 115 -12.6 Women 103 112 115 107 99 -7.7 Age 24 years old and under 99 122 133 120 102 -14.8 25 to 44 years old 123 132 133 125 113 -9.3 45 to 54 years old 114 130 128 126 106 -16.0 55 years old and over 113 125 129 124 108 -13.0 Canada 117 129 131 125 109 -12.8 - Note: Percentage change is based on unrounded numbers. Includes claims for which at least $1 of EI Work-Sharing benefits was paid.
- 1 Takes into account Family Supplement top-ups paid to claimants with Work-Sharing benefits.
- c For confidentiality purposes, data for some provinces and territories in different years have been combined.
- Source: Employment and Social Development Canada, Employment Insurance (EI) administrative data. Data are based on a 100% sample of EI administrative data.
Annex 2.21.4 – Work-Sharing benefits: Amount paid1 ($ million) Province or territory FY1314 FY1415 FY1516 FY1617 FY1718 Change (%)
FY1617 to FY1718Newfoundland and Labrador 0.1 c 0.0 0.1 0.2 0.1 -41.8 Prince Edward Island 0.1 0.1 0.0 0.0 0.0 Nova Scotia 0.2 0.3 c 0.3 0.7 0.3 -52.1 New Brunswick 0.1 0.0 0.1 0.0 -99.7 Quebec 8.9 8.0 6.0 6.5 3.2 -50.5 Ontario 8.7 5.4 5.3 4.7 3.3 -30.5 Manitoba 1.0 0.5 3.3 3.3 0.4 -88.0 Saskatchewan 0.2 2.4 2.9 2.1 1.1 -48.3 Alberta 1.2 0.4 17.1 23.5 4.1 -82.4 British Columbia 0.9 0.8 3.8 2.4 0.6 -75.3 Yukon 0.0 c 0.0 0.0 0.0 0.0 0.0 Northwest Territories 0.0 0.0 0.0 0.0 0.0 Nunavut 0.0 0.0 0.0 0.0 0.0 0.0 Gender Men 15.0 14.1 30.5 32.3 10.1 -68.9 Women 6.3 3.6 8.3 11.1 3.0 -72.3 Age 24 years old and under 1.0 0.8 2.4 2.3 0.4 -81.1 25 to 44 years old 8.7 8.3 17.5 20.3 5.2 -74.6 45 to 54 years old 7.0 5.2 11.6 12.2 3.7 -69.6 55 years old and over 4.6 3.4 7.3 8.6 3.8 -55.6 Canada 21.3 17.7 38.8 43.4 13.1 -69.8 - Note: Data may not add up to the total due to rounding. Percentage change is based on unrounded numbers. Includes claims for which at least $1 of EI Work-Sharing benefits was paid.
- 1 Takes into account Family Supplement top-ups paid to claimants with Work-Sharing benefits.
- c For confidentiality purposes, data for some provinces and territories in different years have been combined.
- Source: Employment and Social Development Canada, Employment Insurance (EI) administrative data. Data are based on a 10% sample of EI administrative data.
-
Annex 2.22 Work-Sharing benefits (by industry)
Annex 2.22.1 – Work-Sharing benefits (by industry): New claims established Industry FY1314 FY1415 FY1516 FY1617 FY1718 Change (%)
FY1617 to FY1718Goods-producing industries 9,087 5,365 15,612 9,315 3,031 -67.5 Agriculture, forestry, fishing and hunting 94 75 40 10 18 c n/a Mining and oil and gas extraction 148 67 514 c 281 c Utilities 0 0 0 n/a Construction 324 208 627 550 158 -71.3 Manufacturing 8,521 5,015 14,431 8,474 2,855 -66.3 Service-producing industries 2,511 2,462 4,869 2,439 677 -72.2 Wholesale trade 722 849 2,026 1,017 180 -82.3 Retail trade 167 171 521 167 44 -73.6 Transportation and warehousing 155 c 71 c 220 c 78 c 14c -82.0 Finance and insurance Real estate and rental and leasing 895 c 25 131 203 283c n/a Professional, scientific and technical services 889 1,069 543 Business, building and support services1 141 114 170 175 39 -77.7 Educational services 16 49 45c 32c 24 -25.0 Health care and social assistance 192 66 Information, culture and recreation2 55 60 105 23 31 +34.8 Accommodation and food services 19 26 216 29 14 c n/a Other services (except public administration) 142 141 352 169 Public administration 82 c 198 c 54 c 185 c 48 c -74.0 Unclassified Canada 11,673 8,024 20,521 11,936 3,708 -68.9 - Note: Includes claims for which at least $1 of EI Work-Sharing benefits was paid.
- 1 This industry sector comprises the industries with codes 55 (Management of companies and enterprises) and 56 (Administrative and support, waste management and remediation services) from the North American Industry Classification System.
- 2 This industry sector comprises the industries with codes 51 (Information and cultural industries) and 71 (Arts, entertainment and recreation) from the North American Industry Classification System.
- c For confidentiality purposes, data for some industries in different years have been combined.
- Source: Employment and Social Development Canada, Employment Insurance (EI) administrative data. Data are based on a 100% sample of EI administrative data.
Annex 2.22.2 – Work-Sharing benefits (by industry): Average actual duration (number of weeks) Industry FY1314 FY1415 FY1516r FY1617r FY1718p Change (%)
FY1617 to FY1718Goods-producing industries 13.4r 14.7r 18.7 15.7 11.8 -24.8 Agriculture, forestry, fishing and hunting 14.2r 6.7r 7.7 11.3 11.4 c n/a Mining and oil and gas extraction 14.6r 20.3r 21.8 c 21.7 c Utilities 0.0 0.0 0 n/a Construction 12.6r 12.8r 16.9 19.3 10.8 -44.0 Manufacturing 13.4r 14.8r 18.7 15.3 11.9 -22.2 Service-producing industries 17.5r 16.9r 24.6 21.2 15.2 -28.3 Wholesale trade 17.4r 18.4r 23.6 21.6 15.5 -28.2 Retail trade 20.6r 14r 23.1 17.8 16.7 -6.2 Transportation and warehousing 17.4 c, r 22.7 c, r 22.5 c 26.2 c 17.9 c -31.7 Finance and insurance Real estate and rental and leasing 19.2 c, r 10.5r 11.2 22.7 15.2 c n/a Professional, scientific and technical services 19.2r 16.7 24.9 Business, building and support services1 15.5r 15.5r 29.9 17.5 14.6 -16.6 Educational services 20.4 15.0 21.7 c 22.7 c 23.0 c +1.3 Health care and social assistance 12.5r 19.2r Information, culture and recreation2 17.7r 17.5r 45.1 34.9 18.1 -48.1 Accommodation and food services 13.0r 18.1r 26.3 15.5 12.0 c n/a Other services (except public administration) 14.0r 13.8r 25.6 25.6 Public administration 15.8 c, r 10.1 c, r 17.2 c 14.0 c 7.0 c -50.0 Unclassified Canada 14.3r 15.4r 20.1 16.9 12.5 -26.0 - Note: Percentage change is based on unrounded numbers. Includes claims for which at least $1 of EI Work-Sharing benefits was paid. Based on completed claims which include those that are terminated and those that are dormant and remained inactive as of August the following fiscal year.
- 1 This industry sector comprises the industries with codes 55 (Management of companies and enterprises) and 56 (Administrative and support, waste management and remediation services) from the North American Industry Classification System.
- 2 This industry sector comprises the industries with codes 51 (Information and cultural industries) and 71 (Arts, entertainment and recreation) from the North American Industry Classification System.
- c For confidentiality purposes, data for some industries in different years have been combined.
- p Preliminary.
- Source: Employment and Social Development Canada, Employment Insurance (EI) administrative data. Data are based on a 100% sample of EI administrative data.
Annex 2.22.3 – Work-Sharing benefits (by industry): Average weekly benefit rate1 ($) Industry FY1314 FY1415 FY1516 FY1617 FY1718 Change (%)
FY1617 to FY1718Goods-producing industries 119 125 132 124 106 -14.5 Agriculture, forestry, fishing and hunting 99 153 142 116 110 c n/a Mining and oil and gas extraction 131 198 152 c 126 c Utilities 0 0 0 n/a Construction 112 113 153 148 112 -24.3 Manufacturing 119 124 130 122 106 -13.1 Service-producing industries 112 138 129 129 123 -4.6 Wholesale trade 92 169 109 111 113 +1.8 Retail trade 102 126 115 130 119 -8.5 Transportation and warehousing 95 c 155 c 135 c 158 c 157 c -0.6 Finance and insurance Real estate and rental and leasing 141 c 116 125 132 131 c n/a Professional, scientific and technical services 122 138 145 Business, building and support services2 97 111 140 139 100 -28.0 Educational services 103 144 126 c 124 c 128 c +3.2 Health care and social assistance 86 100 Information, culture and recreation3 101 124 179 152 136 -10.5 Accommodation and food services 86 103 211 125 108 c n/a Other services (except public administration) 118 114 158 151 Public administration 92 c 128 c 148 c 130 c 125 c -3.8 Unclassified Canada 117 129 131 125 109 -12.8 - Note: Percentage change is based on unrounded numbers. Includes claims for which at least $1 of EI Work-Sharing benefits was paid.
- 1 Takes into account Family Supplement top-ups paid to claimants with Work-Sharing benefits.
- 2 This industry sector comprises the industries with codes 55 (Management of companies and enterprises) and 56 (Administrative and support, waste management and remediation services) from the North American Industry Classification System.
- 3 This industry sector comprises the industries with codes 51 (Information and cultural industries) and 71 (Arts, entertainment and recreation) from the North American Industry Classification System.
- c For confidentiality purposes, data for some industries in different years have been combined.
- Source: Employment and Social Development Canada, Employment Insurance (EI) administrative data. Data are based on a 100% sample of EI administrative data.
Annex 2.22.4 – Work-Sharing benefits (by industry): Amount paid1 ($ million) Industry FY1314 FY1415 FY1516 FY1617 FY1718 Change (%)
FY1617 to FY1718Goods-producing industries 15.9 11.7 27.6 30.1 9.7 -67.8 Agriculture, forestry, fishing and hunting 0.2 0.1 0.1 0.0 0.1 c n/a Mining and oil and gas extraction 0.3 0.3 1.6 c 1.3 c Utilities 0.0 0.0 0.0 n/a Construction 0.6 0.3 0.8 1.4 0.7 -52.0 Manufacturing 14.8 11.1 25.1 27.4 8.9 -67.5 Service-producing industries 5.2 5.8 11.2 12.8 3.4 -73.7 Wholesale trade 1.0 2.4 3.9 3.8 1.1 -71.0 Retail trade 0.6 0.2 0.8 1.2 0.1 -93.8 Transportation and warehousing 0.3 c 0.1 c 0.4 c 0.9 c 0.3 c -71.5 Finance and insurance Real estate and rental and leasing 2.2 c 0.1 0.3 1.0 1.2 c n/a Professional, scientific and technical services 2.3 2.7 2.6 Business, building and support services2 0.3 0.2 0.2 0.8 0.3 -64.3 Educational services 0.0 0.1 0.1 c 0.1 c 0.1 c +4.5 Health care and social assistance 0.2 0.1 Information, culture and recreation3 0.1 0.2 0.5 0.4 0.1 -70.4 Accommodation and food services 0.0 0.0 1.3 0.7 0.2 c n/a Other services (except public administration) 0.4 0.1 1.1 1.4 Public administration 0.2 c 0.2 c 0.0 c 0.5 c 0.1 c -85.5 Unclassified Canada 21.3 17.7 38.8 43.4 13.1 -69.8 - Note: Data may not add up to the total due to rounding. Percentage change is based on unrounded numbers. Includes claims for which at least $1 of EI Work-Sharing benefits was paid.
- 1 Takes into account Family Supplement top-ups paid to claimants with Work-Sharing benefits.
- 2 This industry sector comprises the industries with codes 55 (Management of companies and enterprises) and 56 (Administrative and support, waste management and remediation services) from the North American Industry Classification System.
- 3 This industry sector comprises the industries with codes 51 (Information and cultural industries) and 71 (Arts, entertainment and recreation) from the North American Industry Classification System.
- c For confidentiality purposes, data for some industries in different years have been combined.
- Source: Employment and Social Development Canada, Employment Insurance (EI) administrative data. Data are based on a 10% sample of EI administrative data.
-
Annex 2.23 Family Supplement
Annex 2.23.1 – Family Supplement: New claims established Province or territory FY1314 FY1415 FY1516 FY1617 FY1718 Change (%)
FY1617 to FY1718Newfoundland and Labrador 2,770 2,390 2,490 2,500 2,530 +1.2 Prince Edward Island 1,060 930 990 1,020 930 -8.8 Nova Scotia 4,400 4,210 4,600 4,440 4,170 -6.1 New Brunswick 4,750 4,460 4,100 4,100 3,960 -3.4 Quebec 18,760 17,610 17,470 18,200 17,580 -3.4 Ontario 30,050 28,330 27,680 26,330 25,740 -2.2 Manitoba 4,250 4,260 4,390 4,070 4,010 -1.5 Saskatchewan 2,870 2,680 2,660 3,050 3,110 +2.0 Alberta 6,520 5,950 6,380 6,700 5,790 -13.6 British Columbia 10,420 9,930 9,030 8,780 7,980 -9.1 Yukon 60 40 20 40 50 +25.0 Northwest Territories 40 60 20 90 50 -44.4 Nunavut 50 60 80 90 50 -44.4 Gender Men 17,860 16,850 16,540 16,480 15,900 -3.5 Women 68,140 64,060 63,370 62,930 60,050 -4.6 Age 24 years old and under 11,670 10,640 10,420 9,820 9,580 -2.4 25 to 44 years old 60,330 56,930 57,080 57,040 54,100 -5.2 45 to 54 years old 12,280 11,760 10,840 10,980 10,580 -3.6 55 years old and over 1,720 1,580 1,570 1,570 1,690 +7.6 EI claimant category1 Long-tenured workers 6,460 4,120 7,300 6,290 5,870 -6.7 Occasional claimants 70,590 69,100 65,170 66,460 64,260 -3.3 Frequent claimants 8,950 7,690 7,440 6,660 5,820 -12.6 Canada 86,000 80,910 79,910 79,410 75,950 -4.4 - Note: Includes claims for which at least $1 in Family Supplement was paid.
- 1 See Annex 2.1 for definitions related to EI claimant categories.
- Source: Employment and Social Development Canada, Employment Insurance (EI) administrative data. Data are based on a 10% sample of EI administrative data.
Annex 2.23.2 – Family Supplement: Percentage of new claims established which included Family Supplement (%) Province or territory FY1314 FY1415 FY1516 FY1617 FY1718 Newfoundland and Labrador 3.4 2.9 2.9 3.4 3.1 Prince Edward Island 5.0 4.2 4.5 4.5 4.1 Nova Scotia 5.6 5.3 5.6 5.4 4.9 New Brunswick 5.5 5.2 4.6 4.6 4.3 Quebec 3.8 3.6 3.5 3.8 3.6 Ontario 5.2 5.0 4.9 4.8 4.6 Manitoba 7.5 7.5 6.8 6.9 6.5 Saskatchewan 6.5 5.6 4.7 6.1 6.1 Alberta 4.5 3.5 2.7 3.3 3.4 British Columbia 5.1 4.8 4.2 4.4 4.0 Yukon 2.3 1.6 0.8 1.7 2.3 Northwest Territories 1.7 2.7 0.9 3.8 2.1 Nunavut 4.0 6.1 6.5 7.0 3.7 Gender Men 1.8 1.7 1.5 1.7 1.6 Women 8.4 7.9 7.5 7.5 7.1 Age 24 years old and under 6.4 5.8 5.4 5.5 5.5 25 to 44 years old 7.0 6.5 6.1 6.5 6.2 45 to 54 years old 3.1 3.0 2.7 3.0 2.9 55 years old and over 0.5 0.4 0.4 0.4 0.4 EI claimant category1 Long-tenured workers 1.4 1.0 1.2 1.2 1.1 Occasional claimants 7.1 6.5 6.6 6.9 6.6 Frequent claimants 2.6 2.3 2.2 2.1 1.8 Canada 4.8 4.5 4.2 4.4 4.2 - Note: Includes claims for which at least $1 in Family Supplement was paid.
- 1 See Annex 2.1 for definitions related to EI claimant categories.
- Source: Employment and Social Development Canada, Employment Insurance (EI) administrative data. Data are based on a 10% sample of EI administrative data.
Annex 2.23.3 – Family Supplement: Average weekly Family Supplement ($) Province or territory FY1314 FY1415 FY1516 FY1617 FY1718 Change (%)
FY1617 to FY1718Newfoundland and Labrador 45 40 42 39 44 +14.2 Prince Edward Island 42 41 43 41 43 +5.6 Nova Scotia 43 41 43 45 42 -6.8 New Brunswick 40 36 39 41 40 -2.4 Quebec 41 43 43 42 42 0.0 Ontario 44 40 40 43 45 +4.2 Manitoba 50 46 49 55 55 -0.9 Saskatchewan 54 47 44 49 54 +11.0 Alberta 43 43 41 44 44 -2.0 British Columbia 41 38 39 43 40 -5.4 Yukon 31 44 60 30 25 -15.9 Northwest Territories 51 43 15 35 52 +48.6 Nunavut 52 35 61 44 39 -10.1 Gender Men 47 46 47 47 48 +1.5 Women 43 40 40 43 44 +1.6 Age 24 years old and under 38 35 35 38 37 -1.6 25 to 44 years old 46 43 44 47 47 +1.7 45 to 54 years old 37 36 37 36 38 +5.0 55 years old and over 35 36 36 34 36 +5.9 EI claimant category1 Long-tenured workers 36 36 34 38 40 +5.3 Occasional claimants 44 41 42 45 45 +0.7 Frequent claimants 38 38 39 38 40 +5.9 Canada 43 41 41 44 44 +1.4 - Note: Percentage change is based on unrounded numbers. Includes claims for which at least $1 in Family Supplement was paid.
- 1 See Annex 2.1 for definitions related to EI claimant categories.
- Source: Employment and Social Development Canada, Employment Insurance (EI) administrative data. Data are based on a 10% sample of EI administrative data.
Annex 2.23.4 – Family Supplement: Average weekly benefit rate1 ($) Province or territory FY1314 FY1415 FY1516 FY1617 FY1718 Change (%)
FY1617 to FY1718Newfoundland and Labrador 323 330 332 341 347 +1.8 Prince Edward Island 328 327 340 343 350 +2.0 Nova Scotia 322 328 329 324 331 +2.2 New Brunswick 331 330 338 340 353 +3.8 Quebec 340 347 353 360 363 +0.8 Ontario 320 326 336 341 350 +2.6 Manitoba 334 347 349 369 358 -3.0 Saskatchewan 343 356 359 359 361 +0.6 Alberta 337 348 357 366 374 +2.2 British Columbia 326 333 338 349 354 +1.4 Yukon 379 326 461 480 418 -12.9 Northwest Territories 372 343 500 432 359 -16.9 Nunavut 369 314 385 344 431 +25.3 Gender Men 373 384 393 397 404 +1.8 Women 318 323 330 337 343 +1.8 Age 24 years old and under 282 292 297 299 312 +4.4 25 to 44 years old 338 343 350 358 363 +1.4 45 to 54 years old 333 341 345 349 353 +1.1 55 years old and over 327 350 363 355 377 +6.2 EI claimant category2 Long-tenured workers 352 364 372 380 382 +0.5 Occasional claimants 324 331 337 344 351 +2.0 Frequent claimants 350 360 361 375 379 +1.1 Canada 329 336 343 350 355 +1.4 - Note: Percentage change is based on unrounded numbers. Includes claims for which at least $1 in Family Supplement was paid.
- 1 Averages include all claims which provided Family Supplement top-ups paid to Employment Insurance claimants.
- 2 See Annex 2.1 for definitions related to EI claimant categories.
- Source: Employment and Social Development Canada, Employment Insurance (EI) administrative data. Data are based on a 10% sample of EI administrative data.
Annex 2.23.5 – Family Supplement: Amount paid ($ million) Province or territory FY1314 FY1415 FY1516 FY1617 FY1718 Change (%)
FY1617 to FY1718Newfoundland and Labrador 3.7 3.6 3.5 3.2 4.0 +25.3 Prince Edward Island 1.3 1.3 1.2 1.3 1.2 -4.3 Nova Scotia 5.8 5.1 6.2 5.8 5.6 -3.8 New Brunswick 5.4 5.0 4.8 4.6 4.8 +4.0 Quebec 15.8 15.1 15.3 15.5 15.2 -2.1 Ontario 35.7 32.8 32.8 29.9 30.9 +3.2 Manitoba 5.6 5.4 5.5 6.1 6.1 +0.4 Saskatchewan 3.7 3.8 3.2 4.0 4.6 +14.8 Alberta 7.2 7.5 7.6 8.3 8.2 -0.6 British Columbia 10.8 10.3 10.3 9.8 8.9 -9.4 Yukon 0.0 0.1 0.0 0.0 0.0 +48.2 Northwest Territories 0.0 0.1 0.0 0.1 0.1 +20.6 Nunavut 0.1 0.0 0.1 0.1 0.1 -5.1 Gender Men 17.9 16.4 17.0 17.0 17.0 -0.3 Women 77.3 73.6 73.6 71.6 72.7 +1.5 Age 24 years old and under 13.8 13.6 13.5 12.1 12.1 +0.1 25 to 44 years old 70.6 66.8 67.5 67.0 67.4 +0.7 45 to 54 years old 9.6 8.4 8.3 8.5 8.8 +3.8 55 years old and over 1.1 1.2 1.3 1.1 1.3 +20.7 EI claimant category1 Long-tenured workers 5.6 3.9 5.3 6.0 4.9 -18.1 Occasional claimants 80.6 78.4 77.9 75.9 77.9 +2.6 Frequent claimants 8.9 7.7 7.4 6.8 6.9 +1.7 Canada 95.2 90.0 90.6 88.7 89.7 +1.2 - Note: Data may not add up to the total due to rounding. Percentage change is based on unrounded numbers. Includes claims for which at least $1 in Family Supplement was paid.
- 1 See Annex 2.1 for definitions related to EI claimant categories.
- Source: Employment and Social Development Canada, Employment Insurance (EI) administrative data. Data are based on a 10% sample of EI administrative data.
-
Annex 2.24 Working While on Claim
Annex 2.24.1 – Working While on Claim: Number of completed claims for regular Employment Insurance benefits with Working While on Claim1 Province or territory FY1314 FY1415 FY1516 FY1617 FY1718p Change (%)
FY1617 to FY1718Newfoundland and Labrador 38,990 38,000 36,560 34,480r 39,550 +14.7 Prince Edward Island 10,010 9,100 8,950 9,020r 9,240 +2.4 Nova Scotia 37,530 33,780 34,730 34,120r 36,650 +7.4 New Brunswick 45,680 44,010 43,590 44,660r 45,650 +2.2 Quebec 256,330 257,360 249,000 245,130r 252,640 +3.1 Ontario 177,100 180,650 182,430 163,780r 175,940 +7.4 Manitoba 15,940 17,750 15,790 17,920r 18,630 +8.3 Saskatchewan 11,790 12,590 14,650 15,180r 18,130 +19.7 Alberta 34,880 35,170 43,880 72,540r 72,650 +0.2 British Columbia 69,650 70,660 66,910 65,710r 67,130 +2.2 Yukon 1,190 920 870 760 680 -10.5 Northwest Territories 720 720 750 760 720 -5.3 Nunavut 320 270 230 240 310 +29.2 Gender Men 415,740 418,680 418,140 433,580r 439,740 +1.4 Women 284,390 282,300 280,200 270,720r 298,180 +10.1 Age 24 years old and under 70,010 67,960 67,700 72,600r 70,740 -3.2 25 to 44 years old 318,740 319,090 325,920 334,080r 346,840 +3.8 45 to 54 years old 199,200 198,710 188,990 182,110r 193,210 +6.1 55 years old and over 112,180 115,220 115,730 115,510r 127,600 +10.5 Canada 700,130 700,980 698,340 704,300r 737,920 +4.8 - Note: Includes claims for which at least $1 of regular benefit was paid. Includes only claims with at least $1 of employment income earned from Working While on Claim while claiming EI regular benefits. Based on completed claims which include those that are terminated and those that are dormant and remained inactive as of August the following fiscal year.
- 1 Starting with the FY1617 Employment Insurance Monitoring and Assessment Report, the number and the share of claims with Working While on Claim are reported based on completed claims for which at least $1 of regular benefit was paid. Estimates for the fiscal year covered by the report are preliminary and will be revised, if required, in next year's report.
- p Preliminary.
- Source: Employment and Social Development Canada, Employment Insurance (EI) administrative data. Data are based on a 10% sample of EI administrative data.
Annex 2.24.2 – Working While on Claim: Average number of weeks worked while on claim1 (number of weeks) Province or territory FY1314 FY1415 FY1516 FY1617 FY1718p Change (%)
FY1617 to FY1718Newfoundland and Labrador 15.8 15.6r 15.6r 15.2 17.6 +15.8 Prince Edward Island 14.5 13.7r 13.1r 13.9r 13.6 -2.2 Nova Scotia 14.9 14.5r 14.3r 14.0 13.7 -2.1 New Brunswick 15.9r 16.8 13.5r 16.4r 16.4 0.0 Quebec 13.8r 13.5r 13.4r 13.5 13.0 -3.7 Ontario 9.6 9.1r 8.3r 8.4r 7.9 -6.0 Manitoba 6.2r 5.7 6.0r 5.8 6.0 +3.4 Saskatchewan 6.2 5.7r 6.0r 7.0 8.6 +22.9 Alberta 6.1r 5.9r 6.0r 7.0r 10.0 +42.9 British Columbia 9.6r 8.9r 8.9r 9.0 9.4 +4.4 Yukon 7.6r 8.7r 7.6r 7.0 8.1 +15.7 Northwest Territories 4.8r 5.7r 7.0 7.1 5.8 -18.3 Nunavut 7.9r 5.8 7.3r 8.6r 7.7 -10.5 Gender Men 11.8r 11.6r 11.2r 11.0 11.4 +3.6 Women 12.2 11.5 11.1 11.3r 11.3 0.0 Age 24 years old and under 9.4r 9.3r 9.1r 8.8 8.7 -1.1 25 to 44 years old 11.2r 10.7 10.4r 10.4 10.6 +1.9 45 to 54 years old 13.7r 13.1r 12.8r 12.7 12.9 +1.6 55 years old and over 13.0 12.4r 12.0r 12.4r 12.6 +1.6 Canada 12.0r 11.5 11.2r 11.2 11.4 +1.8 - Note: Percentage change is based on unrounded numbers. Includes only weeks with at least $1 of employment income earned from Working While on Claim while claiming EI regular benefits. Based on completed claims which include those that are terminated and those that are dormant and remained inactive as of August the following fiscal year.
- 1 Starting with the FY1617 Employment Insurance Monitoring and Assessment Report, statistics on weeks worked while on claim are based on completed claims for which at least $1 of regular benefit was paid. Estimates for the fiscal year covered by the report are preliminary and will be revised, if required, in next year's report.
- r Revised.
- p Preliminary.
- Source: Employment and Social Development Canada, Employment Insurance (EI) administrative data. Data are based on a 10% sample of EI administrative data.
Annex 2.24.3 – Working While on Claim: Average weekly employment income earned from Working While on Claim1 ($) Province or territory FY1314 FY1415 FY1516 FY1617 FY1718p Change (%)
FY1617 to FY1718Newfoundland and Labrador 888r 965r 1,014r 993r 1,025 +3.2 Prince Edward Island 676r 664 743r 724r 692 -4.4 Nova Scotia 750r 803r 848r 851r 820 -3.6 New Brunswick 737r 764r 793 794 793 -0.1 Quebec 710 731r 750r 760r 779 +2.5 Ontario 596r 638r 631r 640r 655 +2.3 Manitoba 536r 569 574r 615r 612 -0.5 Saskatchewan 671r 699r 769r 728r 756 +3.8 Alberta 794r 841r 891r 825r 858 +3.9 British Columbia 649r 673r 735r 725r 726 +0.1 Yukon 672r 651r 663r 658r 587 -10.8 Northwest Territories 741r 819r 899r 805r 899 +11.7 Nunavut 818r 682 819r 628r 869 +38.4 Gender Men 841 878r 907r 903r 930 +3.0 Women 464r 485r 502r 501r 515 +2.8 Age 24 years old and under 563r 591r 603r 611r 588 -3.8 25 to 44 years old 690 725r 750r 762r 772 +1.3 45 to 54 years old 729 761r 793 788r 810 +2.8 55 years old and over 689r 707r 733 734r 761 +3.5 Canada 688 719 744 749r 762 +1.7 - Note: Percentage change is based on unrounded numbers. Includes employment income only (all amounts paid in Employment Insurance benefits are excluded from the calculation). Only weeks with at least $1 of employment income earned from Working While on Claim while claiming EI regular benefits are taken into account in the calculation.
- 1 Starting with the FY1617 Employment Insurance Monitoring and Assessment Report, statistics on average weekly employment earnings from working while on claim are based on completed claims for which at least $1 of regular benefit was paid. Estimates for the fiscal year covered by the report are preliminary and will be revised, if required, in next year's report.
- r Revised.
- p Preliminary.
- Source: Employment and Social Development Canada, Employment Insurance (EI) administrative data. Data are based on a 10% sample of EI administrative data.
Annex 2.24.4 – Working While on Claim: Percentage of completed claims for regular Employment Insurance benefits with employment income from Working While on Claim1 (%) Province or territory FY1314 FY1415 FY1516 FY1617 FY1718p Change
(% points)
FY1617 to FY1718Newfoundland and Labrador 61.4 59.5 60.1 60.2 60.9 +0.7 Prince Edward Island 56.4 55.0 55.6 53.2 53.0 -0.3 Nova Scotia 58.6 56.7 55.4 54.7 54.9 +0.2 New Brunswick 62.8 62.6 61.5 60.6 60.1 -0.5 Quebec 58.6 58.5 57.7 58.0 56.9 -1.1 Ontario 43.1 43.6 44.8 43.1 43.3 +0.2 Manitoba 43.3 45.8 42.8 44.3 44.8 +0.5 Saskatchewan 42.8 43.7 47.2 44.0 46.9 +2.9 Alberta 41.1 41.4 42.5 44.6 48.1 +3.5 British Columbia 47.9 48.2 48.0 47.9 48.4 +0.5 Yukon 53.8 42.4 48.3 41.3 36.2 -5.1 Northwest Territories 45.6 43.1 43.6 45.0 41.9 -3.1 Nunavut 34.0 36.5 41.8 32.9 36.9 +4.0 Gender Men 50.2 50.4 49.7 49.5 49.3 -0.2 Women 52.9 52.6 53.5 52.5 53.3 +0.9 Age 24 years old and under 50.7 51.2 50.8 51.4 51.2 -0.2 25 to 44 years old 53.1 53.5 53.6 53.5 54.1 +0.6 45 to 54 years old 58.6 58.6 58.5 57.6 58.9 +1.4 55 years old and over 39.0 38.5 38.6 37.2 37.1 -0.1 Canada 51.3 51.3 51.2 50.6 50.9 +0.3 - Note: Percentage change is based on unrounded numbers. Includes claims for which at least $1 of regular benefit was paid. Based on completed claims which include those that are terminated and those that are dormant and remained inactive as of August the following fiscal year.
- 1 Starting with the FY1617 Employment Insurance Monitoring and Assessment Report, the number and the share of claims with Working While on Claim are reported based on completed claims for which at least $1 of regular benefit was paid. Estimates for the fiscal year covered by the report are preliminary and will be revised, if required, in next year's report.
- r Revised.
- p Preliminary.
- Source: Employment and Social Development Canada, Employment Insurance (EI) administrative data. Data are based on a 10% sample of EI administrative data.
-
Annex 2.25 Completed pure and combined Employment Insurance claims, by types of benefits
Annex 2.25 – Completed pure and combined Employment Insurance claims, by types of benefits1, Canada Benefit type FY1516 FY1617 FY1718 Level of claims Combined claims (%) Level of claims Combined claims (%) Level of claims Combined claims (%) Regular 1,451,330 11.0 1,467,260 11.9 1,498,290 12.4 Fishing 26,390 11.1 27,280 13.2 30,570 13.1 Sickness 370,370 47.3 398,040 47.4 435,640 46.6 Maternity 171,150 98.4 175,170 98.4 173,960 98.5 Parental2 195,930 86.9 202,880 86.0 204,310 85.0 Compassionate care 6,730 46.2 9,690 41.6 12,300 41.1 Work-sharing 13,250 19.8 17,950 22.1 11,310 25.1 All claims3 1,879,050 17.3 1,922,010 18.0 1,976,800 18.0 - Note: Completed claims include those that are terminated and those that are dormant and remained inactive as of August the following fiscal year.
- 1 Excludes benefits for Parents of Critically Ill Children (PCIC).
- 2 Parental benefits for biological parents and parental benefits for adoptive parents are grouped together.
- 3 The total number of claims and of combined claims is lower than the sum of claims associated to each benefit type, because combined claims are only counted once even though they appear in more than one benefit type.
- Source: Employment and Social Development Canada, Employment Insurance (EI) administrative data. Data are based on a 10% sample of EI administrative data.
-
Annex 2.26 Employment Insurance benefit repayment
Annex 2.26.1 – Employment Insurance benefit repayment1: People who repaid benefits Province or territory 2012 2013 2014 2015 2016 Change (%)
2015 to 2016Newfoundland and Labrador 11,799 12,787 14,168 14,766 14,812 +0.3 Prince Edward Island 1,358 1,048 1,275 1,422 1,573 +10.6 Nova Scotia 7,712 7,722 8,738 8,625 7,952 -7.8 New Brunswick 6,488 6,499 7,220 6,869 6,038 -12.1 Quebec 47,748 40,948 40,567 37,645 39,941 +6.1 Ontario 42,376 38,373 43,716 45,100 36,921 -18.1 Manitoba 2,913 2,918 3,084 3,162 3,074 -2.8 Saskatchewan 4,621 4,585 4,690 4,982 5,230 +5.0 Alberta 23,918 22,813 23,415 28,296 33,926 +19.9 British Columbia 18,569 18,676 19,215 20,590 19,088 -7.3 Yukon 306 288 273 299 274 -8.4 Northwest Territories 317 275 259 264 310 +17.4 Nunavut 143 108 96 108 107 -0.9 Non-residents of Canada 70 69 61 97 83 -14.4 Gender Men 150,102 140,103 148,848 153,159 150,835 -1.5 Women 18,236 17,006 17,929 19,066 18,494 -3.0 Age 24 years old and under 6,629 6,098 6,328 5,408 4,879 -9.8 25 to 44 years old 72,133 68,297 72,948 77,047 78,828 +2.3 45 to 54 years old 45,694 41,376 43,660 44,369 41,292 -6.9 55 years old and over 43,882 41,338 43,841 45,401 44,330 -2.4 Canada 168,338 157,109 166,777 172,225 169,329 -1.7 - 1 As benefit repayments are administered through the tax system, the most recent data available are for the 2016 taxation year.
- Source: Employment and Social Development Canada, Employment Insurance (EI) administrative data. Data are based on a 100% sample of EI administrative data.
Annex 2.26.2 – Employment Insurance benefit repayment1: Amount repaid ($ million) Province or territory 2012 2013 2014 2015 2016 Change (%)
2015 to 2016Newfoundland and Labrador 19.5 21.0 26.9 28.7 31.6 +10.0 Prince Edward Island 2.9 1.9 2.7 3.8 4.7 +24.2 Nova Scotia 13.9 14.5 17.5 20.0 18.8 -5.8 New Brunswick 11.0 11.6 13.5 14.7 13.3 -9.6 Quebec 49.9 45.3 46.1 44.3 45.9 +3.6 Ontario 44.9 44.5 49.8 54.8 46.2 -15.7 Manitoba 3.6 3.7 4.2 4.4 4.2 -4.5 Saskatchewan 5.5 5.7 6.4 7.1 7.7 +7.7 Alberta 29.8 29.1 31.2 40.0 51.4 +28.5 British Columbia 23.0 23.3 24.9 28.6 25.9 -9.5 Yukon 0.4 0.4 0.4 0.4 0.4 -5.2 Northwest Territories 0.4 0.4 0.4 0.4 0.4 +9.8 Nunavut 0.2 0.1 0.1 0.2 0.2 -15.6 Non-residents of Canada 0.1 0.1 0.1 0.2 r 0.1 -25.0 Gender Men 186.1 182.9 203.8 224.4 227.7 +1.5 Women 19.0 18.8 20.2 23.1 23.0 -0.5 Age 24 years old and under 7.6 7.2 8.0 7.4 6.7 -10.7 25 to 44 years old 80.2 79.8 89.8 100.9 104.8 +3.9 45 to 54 years old 53.6 52.0 57.1 63.0 61.6 -2.2 55 years old and over 63.7 62.6 69.1 76.1 77.6 +1.9 Canada 205.1 201.7 224.0 247.5 250.6 +1.3 - Note: Data may not add up to the totals due to rounding. Percentage change is based on unrounded numbers.
- 1 As benefit repayments are administered through the tax system, the most recent data available are for the 2016 taxation year.
- r Revised.
- Source: Employment and Social Development Canada, Employment Insurance (EI) administrative data. Data are based on a 100% sample of EI administrative data.
-
Annex 2.27 Contributors to the Employment Insurance program
Annex 2.27.1 – Contributors to the Employment Insurance program1: EI premium ($ million) Province or territory Total % of total Paid by employers2 Paid by employees 2015 2016 2016 2016 2016 Newfoundland and Labrador 368.8 370.3 1.5 215.4 159.5 Prince Edward Island 90.5 94.7 0.4 54.8 40.6 Nova Scotia 599.1 614.7 2.6 352.6 266.0 New Brunswick 482.1 497.8 2.1 286.0 214.5 Quebec 4,307.9 4,375.5 18.3 2,485.2 1,920.0 Ontario 9,288.3 9,621.7 40.2 5,525.1 4,178.4 Manitoba 866.4 892.4 3.7 511.3 387.6 Saskatchewan 793.8 786.1 3.3 450.1 344.2 Alberta 3,549.1 3,399.7 14.2 1,965.0 1,483.1 British Columbia 3,050.1 3,188.3 13.3 1,838.4 1,380.1 Yukon 40.8 36.3 0.2 21.0 15.7 Northwest Territories 51.0 50.4 0.2 29.3 22.0 Nunavut 31.8 34.0 0.1 19.9 14.8 Gender Men 13,029.0 13,202.1 55.1 7,601.7 5,750.1 Women 10,489.3 10,758.6 44.9 6,151.6 4,675.8 Missing data 1.4 1.2 0.0 0.7 0.5 Age 24 years old and under 1,889.9 1,871.8 7.8 1,084.9 791.6 25 to 44 years old 11,043.6 11,271.5 47.0 6,481.0 4,912.6 45 to 54 years old 5,945.9 5,963.2 24.9 3,411.4 2,611.0 55 years old and over 4,635.1 4,850.3 20.2 2,773.7 2,108.9 Missing data 5.2 5.1 0.0 3.0 2.2 Industry Goods-producing industries 5,412.6 5,386.6 22.5 3,114.7 2,336.6 Agriculture, forestry, fishing and hunting 279.1 293.9 1.2 172.1 124.8 Mining, and oil and gas extraction 453.8 395.2 1.6 227.5 176.3 Utilities 220.4 221.4 0.9 123.9 99.3 Construction 1,858.7 1,841.1 7.7 1,088.4 788.2 Manufacturing 2,600.6 2,634.9 11.0 1,502.9 1,148.0 Service-producing industries 17,991.4 18,397.7 76.8 10,534.5 8,014.2 Wholesale trade 1,262.0 1,281.6 5.3 735.6 557.0 Retail trade 1,909.4 1,954.4 8.2 1,128.9 834.7 Transportation and warehousing 1,110.0 1,111.7 4.6 634.2 486.2 Finance and insurance 1,156.7 1,172.6 4.9 658.8 524.9 Real estate, and rental and leasing 400.8 403.0 1.7 234.4 172.6 Professional, scientific and technical services 1,414.3 1,465.1 6.1 848.1 637.9 Business, building and other support services3 1,323.2 1,313.0 5.5 759.3 564.9 Educational services 1,845.4 1,900.5 7.9 1,066.7 846.3 Health care and social assistance 2,102.9 2,170.1 9.1 1,245.9 947.9 Information, culture and recreation4 821.5 837.7 3.5 480.3 365.0 Accommodation and food services 945.3 975.0 4.1 567.8 409.8 Other services (except public administration) 788.4 802.8 3.4 467.3 341.9 Public administration 2,911.5 3,010.1 12.6 1,707.2 1,325.1 Unclassified 115.7 177.6 0.7 104.8 75.7 Canada 23,519.7 23,962.0 100.0 13,754.0 10,426.4 - Note: Data may not add up to the totals due to rounding. Percentage share is based on unrounded numbers.
- 1 As Employment Insurance premium payments are administered through the tax system, the most recent data available are for the 2016 taxation year.
- 2 Employer contributions are 1.4 times the level of employee contributions. However, employers who participate in the Premium Reduction Program may contribute less than 1.4 times their employees' contributions. See Chapter 2, Section 2.7 for more information.
- 3 This industry category comprises the industries with codes 55 (Management of Companies and Enterprises) and 56 (Administrative and Support, Waste Management and Mediation services) from the North American Industry Classification System.
- 4 This industry category comprises the industries with codes 51 (Information and Cultural Industries) and 71 (Arts, Entertainment and Recreation) from the North American Industry Classification System.
- Source: Canada Revenue Agency, T4 slips with employment income. Data are based on a 10% sample of T4 slips with employment income.
Annex 2.27.2 – Contributors to the Employment Insurance program1: Employment income Province or territory Total employment income ($ million) Total insurable earnings ($ million) Number of workers with employment income Employment income per worker ($ per year) Insurable earnings per worker ($ per year) 2015 2016 % of total 2016 2015 2016 2015 2016 % of total 2016 2015 2016 2015 2016 Newfoundland and Labrador 12,954.7 12,634.5 1.4 8,461.5 8,480.7 280,610 276,450 1.5 46,166.1 45,702.5 30,153.9 30,677.3 Prince Edward Island 2,697.5 2,776.2 0.3 2,057.3 2,156.4 79,340 80,420 0.4 33,999.7 34,521.4 25,930.8 26,813.7 Nova Scotia 18,853.1 18,948.3 2.1 13,798.0 14,147.4 480,900 480,370 2.5 39,203.8 39,445.2 28,692.0 29,451.0 New Brunswick 14,681.3 15,002.7 1.7 11,042.7 11,406.6 392,960 393,650 2.1 37,360.8 38,111.8 28,101.4 28,976.6 Quebec 170,285.9 173,833.1 19.7 122,539.1 126,262.6 4,195,210 4,204,180 22.2 40,590.6 41,347.7 29,209.3 30,032.6 Ontario 347,030.4 352,225.5 39.9 214,580.4 222,248.7 7,124,140 7,191,750 38.0 48,711.9 48,976.3 30,120.2 30,903.3 Manitoba 28,750.5 28,950.3 3.3 19,995.7 20,611.3 675,480 685,070 3.6 42,563.0 42,258.9 29,602.2 30,086.5 Saskatchewan 28,011.3 27,130.3 3.1 18,504.3 18,294.9 598,740 591,870 3.1 46,783.8 45,838.3 30,905.5 30,910.3 Alberta 150,262.6 133,969.4 15.2 82,837.7 78,890.4 2,529,530 2,406,620 12.7 59,403.4 55,667.0 32,748.3 32,780.6 British Columbia 108,441.5 111,651.7 12.7 70,231.3 73,416.5 2,454,390 2,510,010 13.3 44,182.7 44,482.6 28,614.5 29,249.5 Yukon 1,512.5 1,220.5 0.1 1,028.5 833.6 24,620 25,110 0.1 61,432.4 48,605.5 41,774.2 33,198.3 Northwest Territories 2,166.8 2,110.6 0.2 1,194.4 1,172.1 33,350 32,340 0.2 64,970.5 65,263.7 35,815.0 36,243.9 Nunavut 1,313.3 1,387.5 0.2 741.6 791.2 23,930 24,500 0.1 54,880.3 56,634.4 30,989.5 32,295.4 Gender Men 544,959.9 533,908.4 60.5 314,378.7 319,151.7 9,767,820 9,769,570 51.7 55,791.4 54,650.1 32,185.1 32,667.9 Women 341,739.0 347,697.1 39.4 252,603.1 259,532.9 9,110,730 9,124,560 48.3 37,509.5 38,105.6 27,725.9 28,443.3 Missing data 262.5 235.0 0.0 30.8 27.9 14,650 8,210 0.0 17,918.6 28,627.6 2,099.5 3,399.5 Age 24 years old and under 47,257.3 46,628.2 5.3 44,250.1 43,863.4 3,154,740 3,145,600 16.6 14,979.8 14,823.3 14,026.5 13,944.4 25 to 44 years old 386,888.9 388,047.3 44.0 266,714.0 272,671.7 7,889,770 7,936,370 42.0 49,036.8 48,894.8 33,805.0 34,357.2 45 to 54 years old 251,209.4 246,069.6 27.9 144,324.7 145,046.4 3,986,680 3,918,440 20.7 63,012.2 62,797.8 36,201.7 37,016.4 55 years old and over 201,228.3 200,743.5 22.8 111,601.4 117,009.2 3,843,580 3,889,940 20.6 52,354.4 51,605.8 29,035.8 30,080.0 Missing data 377.5 352.0 0.0 122.4 121.9 18,430 11,990 0.1 20,484.4 29,357.1 6,641.0 10,164.9 Industry Goods-producing industries 212,151.0 204,589.3 23.2 130,129.1 129,749.8 3,775,190.0 3,722,260.0 19.7 56,196.1 54,963.7 34,469.6 34,857.8 Agriculture, forestry, fishing and hunting 9,360.1 9,811.4 1.1 6,527.6 6,887.3 335,310 343,520 1.8 27,914.7 28,561.2 19,467.3 20,049.1 Mining, and oil and gas extraction 26,716.5 21,957.8 2.5 10,970.8 9,568.4 249,760 216,210 1.1 106,968.5 101,557.7 43,925.4 44,255.1 Utilities 11,427.7 11,557.3 1.3 5,457.0 5,503.1 120,970 119,150 0.6 94,467.6 96,997.8 45,110.5 46,186.5 Construction 69,109.9 66,509.7 7.5 43,843.1 43,424.3 1,328,240 1,306,280 6.9 52,031.2 50,915.3 33,008.4 33,242.7 Manufacturing 95,536.8 94,753.1 10.7 63,330.6 64,366.6 1,740,910 1,737,100 9.2 54,877.5 54,546.7 36,377.9 37,054.1 Service-producing industries 669,999.1 670,685.7 76.1 434,169.9 444,757.1 14,972,400.0 14,969,360.0 79.2 44,748.9 44,803.9 28,998.0 29,711.2 Wholesale trade 52,729.6 51,694.6 5.9 30,454.5 30,988.8 879,610 876,750 4.6 59,946.6 58,961.6 34,622.7 35,345.1 Retail trade 59,528.8 60,197.2 6.8 45,215.8 46,418.2 2,119,840 2,135,840 11.3 28,081.8 28,184.3 21,329.8 21,733.0 Transportation and warehousing 40,650.0 39,968.0 4.5 26,835.9 26,974.1 809,830 805,660 4.3 50,195.8 49,609.0 33,137.7 33,480.8 Finance and insurance 60,241.2 59,075.9 6.7 28,517.8 29,021.8 766,680 758,180 4.0 78,574.1 77,918.1 37,196.5 38,278.2 Real estate, and rental and leasing 16,440.6 15,798.2 1.8 9,473.7 9,531.8 345,810 339,030 1.8 47,542.2 46,598.4 27,395.7 28,114.9 Professional, scientific and technical services 66,715.4 66,494.7 7.5 34,154.7 35,453.3 1,056,360 1,064,390 5.6 63,155.9 62,472.1 32,332.4 33,308.5 Business, building and other support services2 50,218.0 47,604.8 5.4 31,376.8 31,188.1 1,243,080 1,218,450 6.4 40,398.0 39,070.0 25,241.1 25,596.5 Educational services 65,265.9 67,204.4 7.6 45,519.5 47,095.5 1,358,720 1,380,110 7.3 48,034.8 48,695.0 33,501.7 34,124.4 Health care and social assistance 69,298.3 71,116.7 8.1 51,621.3 53,444.3 1,606,940 1,637,510 8.7 43,124.4 43,429.8 32,124.0 32,637.5 Information, culture and recreation3 32,014.2 32,221.8 3.7 19,935.1 20,287.8 680,660 686,600 3.6 47,034.1 46,929.5 29,287.9 29,548.2 Accommodation and food services 25,324.0 26,055.3 3.0 21,937.0 22,682.6 1,460,730 1,487,310 7.9 17,336.5 17,518.4 15,017.8 15,250.8 Other services (except public administration) 25,905.9 26,091.4 3.0 18,530.5 18,912.7 729,190 730,140 3.9 35,526.9 35,734.8 25,412.5 25,902.9 Public administration 105,667.1 107,162.6 12.2 70,597.3 72,758.1 1,914,950 1,849,390 9.8 55,180.1 57,944.8 36,866.4 39,341.7 Unclassified 4,811.3 6,565.6 0.7 2,713.6 4,205.7 145,610 210,720 1.1 33,042.6 31,158.1 18,635.8 19,958.8 Canada 886,961.4 881,840.6 100.0 567,012.6 578,712.5 18,893,200.0 18,902,340.0 100.0 46,946.1 46,652.5 30,011.5 30,615.9 - Note: Data may not add up to the totals due to rounding. Percentage share is based on unrounded numbers.
- 1 As Employment Insurance premium payments are administered through the tax system, the most recent data available are for the 2016 taxation year.
- 2 This industry category comprises the industries with codes 55 (Management of Companies and Enterprises) and 56 (Administrative and Support, Waste Management and Mediation services) from the North American Industry Classification System.
- 3 This industry category comprises the industries with codes 51 (Information and Cultural Industries) and 71 (Arts, Entertainment and Recreation) from the North American Industry Classification System.
- Source: Canada Revenue Agency, T4 slips with employment income. Data are based on a 10% sample of T4 slips with employment income.
-
Annex 2.28 Adjusted benefits-to-contributions ratios
Annex 2.28 – Adjusted benefits-to-contributions (B/C) ratios1 Province or territory4 EI premium EI regular benefits Total EI benefits Adjusted regular B/C ratio2,3
(Canada=1)Adjusted total B/C ratio3
(Canada = 1)2016 ($ million) % of total 2016 2016 ($ million) % of total 2016 2016 ($ million) % of total 2016 2016 2016 Newfoundland and Labrador 370.3 1.5 813.9 6.7 1,063.3 5.7 4.56 3.71 Prince Edward Island 94.7 0.4 148.5 1.2 227.1 1.2 3.27 3.10 Nova Scotia 614.7 2.6 570.5 4.7 835.9 4.5 1.92 1.76 New Brunswick 497.8 2.1 669.1 5.5 923.1 5.0 2.79 2.40 Quebec 4,375.5 18.3 2,959.8 24.3 3,525.7 19.0 1.11 1.04 Ontario 9,621.7 40.2 3,016.5 24.8 5,486.3 29.6 0.65 0.74 Manitoba 892.4 3.7 324.7 2.7 591.5 3.2 0.75 0.86 Saskatchewan 786.1 3.3 378.4 3.1 621.3 3.3 0.98 1.02 Alberta 3,399.7 14.2 2,088.5 17.2 3,136.0 16.9 1.26 1.19 British Columbia 3,188.3 13.3 1,154.6 9.5 2,056.5 11.1 0.75 0.83 Yukon 36.3 0.2 16.6 0.1 24.8 0.1 0.95 0.88 Northwest Territories 50.4 0.2 16.7 0.1 28.6 0.2 0.68 0.73 Nunavut 34.0 0.1 9.9 0.1 16.6 0.1 0.59 0.63 Outside Canada 0.0 0.0 3.0 0.0 10.0 0.1 0.00 0.00 Gender Men 13,202.1 55.1 8,281.4 68.0 9,967.6 53.7 1.23 0.98 Women 10,758.6 44.9 3,889.1 32.0 8,579.3 46.3 0.71 1.03 Missing data 1.2 0.0 0.0 0.0 0.0 0.0 0.00 0.00 Age 24 years old and under 1,871.8 7.8 1,031.4 8.5 1,599.6 8.6 1.12 1.10 25 to 44 years old 11,271.5 47.0 5,285.0 43.4 9,915.7 53.5 0.92 1.14 45 to 54 years old 5,963.2 24.9 2,884.5 23.7 3,469.1 18.7 0.95 0.75 55 years old and over 4,850.3 20.2 2,969.6 24.4 3,562.4 19.2 1.21 0.95 Missing data 5.1 0.0 0.0 0.0 0.0 0.0 0.00 0.00 Industry Goods-producing industries 5,386.6 22.5 5,366.8 44.1 6,780.4 36.6 1.97 1.63 Agriculture, forestry, fishing and hunting 293.9 1.2 515.5 4.2 877.6 4.7 3.56 3.86 Mining, and oil and gas extraction 395.2 1.6 466.1 3.8 542.1 2.9 2.32 1.77 Utilities 221.4 0.9 40.3 0.3 67.1 0.4 0.35 0.39 Construction 1,841.1 7.7 2,960.2 24.3 3,437.1 18.5 3.24 2.41 Manufacturing 2,634.9 11.0 1,384.7 11.4 1,856.5 10.0 1.02 0.91 Service-producing industries 18,397.7 76.8 6,565.8 53.9 11,443.0 61.7 0.70 0.80 Wholesale trade 1,281.6 5.3 489.3 4.0 702.9 3.8 0.75 0.71 Retail trade 1,954.4 8.2 680.3 5.6 1,179.9 6.4 0.70 0.78 Transportation and warehousing 1,111.7 4.6 572.0 4.7 773.1 4.2 1.01 0.90 Finance and insurance 1,172.6 4.9 339.7 2.8 450.7 2.4 0.28 0.50 Real estate and rental and leasing 403.0 1.7 170.9 1.4 304.1 1.6 1.04 0.97 Professional, scientific and technical services 1,465.1 6.1 208.4 1.7 956.3 5.2 0.86 0.84 Business, building and other support5 1,313.0 5.5 639.0 5.3 1,224.3 6.6 1.32 1.20 Educational services 1,900.5 7.9 868.5 7.1 1,208.4 6.5 0.69 0.82 Health care and social assistance 2,170.1 9.1 688.1 5.7 1,226.4 6.6 0.34 0.73 Information, culture and recreation6 837.7 3.5 383.3 3.1 498.4 2.7 0.80 0.77 Accommodation and food services 975.0 4.1 507.8 4.2 827.4 4.5 1.06 1.10 Other services (except public administration) 802.8 3.4 414.5 3.4 663.9 3.6 1.04 1.07 Public administration 3,010.1 12.6 604.0 5.0 1,427.2 7.7 0.39 0.61 Unclassified7 177.6 0.7 237.9 2.0 323.5 1.7 2.69 2.35 Canada 23,962.0 100.0 12,170.5 100.0 18,546.9 100.0 1.00 1.00 - Note: Data may not add up to the total due to rounding. Percentage share is based on unrounded numbers.
- 1 As Employment Insurance premium payments are administered through the tax system, the most recent data available are for the 2016 taxation year.
- 2 To factor in the Quebec Parental Insurance Program (QPIP), which reduced the premiums paid by employers and employees in Quebec, and the Premium Reduction Program (PRP), which reduces the premiums paid by employers who offer their employees a short-term disability plan, the regular benefits-to-contributions ratios (adjusted and non-adjusted) have been calculated based on an estimate of the Employment Insurance premiums that would have been paid by employees and employers in the absence of QPIP and PRP, rather than on premiums that were actually paid.
- 3 For ease of analysis, the benefits-to-contributions ratios have been adjusted (i.e., standardized) so that the figure for Canada equals one.
- 4 The benefits-to-contributions ratios for the provinces and territories are determined by the location of employers for premiums and by the residence of claimants for benefits. As a result, it is possible that the ratio for some provinces and territories may be under or overstated if contributions are being accredited to a province or territory, while the employment is actually situated in another province or territory.
- 5 This industry comprises the industries with codes 55 (management of companies and enterprises) and 56 (administrative and support, waste management and mediation services) from the North American Industry Classification System.
- 6 This industry comprises the industries with codes 51 (information and cultural industries) and 71 (arts, entertainment and recreation) from the North American Industry Classification System.
- 7 People who have not worked in the last year or who have never worked are not classified as belonging to any industry.
- Source: Canada Revenue Agency (CRA), T4 slips with employment income (for data on Employment Insurance contributions); and Employment and Social Development Canada (ESDC), Employment Insurance (EI) administrative data (for data on Employment Insurance benefits). CRA data are based on a 10% sample of T4 slips with employment income, and ESDC data are based on a 10% sample of EI administrative data.
-
Annex 2.29 Unemployment rates used for the purpose of the Employment Insurance program (by Employment Insurance economic region)
Annex 2.29 – Unemployment rates used for the purpose of the Employment Insurance program (by Employment Insurance economic region)1 Effective date3 Regional rate of unemployment2 April 09, 2017 to May 06, 2017 May 07, 2017 to June 10, 2017 June 11, 2017 to July 08, 2017 July 09, 2017 to August 05, 2017 August 06, 2017 to Sept. 09, 2017 Sept. 10, 2017 to Oct. 07, 2017 Oct. 08, 2017 to Nov. 04, 2017 Nov. 05, 2017 to Dec. 02, 2017 Dec. 03, 2017 to January 06, 2018 January 07, 2018 to February 10, 2018 February 11, 2018 to March 10, 2018 March 11, 2018 to April 07, 2018 Minimum of the 12 months Average of the 12 months Maximum of the 12 months Unemployment rate moving average ending on the month of …4 March 2017
(%)April 2017
(%)May 2017 (%) June 2017
(%)July 2017 (%) August 2017 (%) Sept. 2017
(%)Oct. 2017 (%) Nov. 2017 (%) Dec. 2017 (%) January 2018
(%)February 2018
(%)FY1718 (%) FY1718 (%) FY1718 (%) Newfoundland and Labrador St. John’s 9.1 8.3 8.4 7.7 8.2 8.2 8.9 8.8 8.6 8.1 7.9 8.1 7.7 8.4 9.1 Newfound-land-Labrador 19.0 19.5 19.5 19.7 20.3 20.3 19.9 19.3 19.3 19.7 19.6 19.1 19.0 19.6 20.3 Prince Edward Island Charlottetown 7.0 6.7 6.7 6.0 6.2 5.7 6.1 6.4 6.9 6.7 6.6 6.5 5.7 6.5 7.0 Prince Edward Island 12.8 12.8 12.9 13.6 14.1 14.3 13.9 13.7 13.1 13.0 12.9 13.7 12.8 13.4 14.3 Nova Scotia Eastern Nova Scotia 14.3 14.1 13.6 14.3 14.7 15.5 15.3 15.5 15.2 14.8 14.6 14.3 13.6 14.7 15.5 Western Nova Scotia 8.6 8.6 8.6 8.7 8.7 8.6 8.8 9.2 9.4 9.0 8.6 8.4 8.4 8.8 9.4 Halifax 6.6 6.9 7.1 6.9 6.8 7.1 7.3 7.3 7.2 6.9 6.9 6.5 6.5 7.0 7.3 New Brunswick Fredericton-Moncton-Saint-John 6.9 6.5 6.0 6.0 5.8 5.9 5.9 6.2 6.5 6.5 7.0 6.7 5.8 6.3 7.0 Madawaska-Charlotte 8.2 8.4 8.6 8.9 8.0 7.2 6.7 7.7 8.2 8.2 8.4 8.5 6.7 8.1 8.9 Restigouche-Albert 13.6 13.7 13.6 12.8 11.5 11.5 11.6 11.8 11.6 11.7 11.9 11.9 11.5 12.3 13.7 Quebec Gaspésie - Îles-de-la-Madeleine 12.7 12.2 13.3 13.6 14.2 14.4 14.5 14.3 13.5 13.2 12.7 12.9 12.2 13.5 14.5 Québec 4.2 4.5 4.9 4.7 4.3 4.1 4.3 4.7 4.6 4.1 3.4 3.3 3.3 4.3 4.9 Trois-Rivières 6.7 6.5 6.5 6.2 6.1 6.1 5.6 5.1 4.6 4.2 4.2 4.8 4.2 5.6 6.7 South Central Québec 4.9 5.0 4.6 3.6 2.8 2.5 2.6 2.7 2.6 2.4 2.4 2.7 2.4 3.2 5.0 Sherbrooke 5.9 6.2 6.3 5.8 5.6 4.9 4.9 5.4 5.8 6.2 6.1 6.0 4.9 5.8 6.3 Montérégie 6.5 6.0 5.3 5.3 5.4 5.4 4.9 4.7 5.0 5.4 5.4 5.3 4.7 5.4 6.5 Montréal 6.8 6.9 6.7 6.7 6.6 6.7 6.8 7.0 6.7 6.2 6.0 6.1 6.0 6.6 7.0 Central Quebec 7.0 7.5 6.6 6.5 5.9 6.7 6.8 6.8 6.3 6.0 5.9 6.0 5.9 6.5 7.5 North Western Quebec 7.3 7.5 7.6 7.8 7.9 8.2 8.4 7.7 7.1 6.5 6.6 6.9 6.5 7.5 8.4 Bas-Saint-Laurent – Côte-Nord 9.1 8.9 8.7 9.0 9.0 8.7 7.7 6.9 6.7 6.4 5.9 5.3 5.3 7.7 9.1 Hull 5.7 5.7 5.5 5.4 5.4 5.7 5.7 5.5 5.1 4.9 4.9 4.6 4.6 5.3 5.7 Chicoutimi-Jonquière 6.8 6.7 7.1 7.1 7.0 6.8 6.8 6.4 6.4 6.2 6.4 6.0 6.0 6.6 7.1 Ontario Ottawa 4.9 5.0 5.7 6.0 6.4 5.9 5.7 5.8 5.8 5.7 5.5 5.4 4.9 5.7 6.4 Eastern Ontario 6.1 6.6 6.9 7.2 7.2 7.4 7.4 6.8 6.3 6.0 6.6 6.8 6.0 6.8 7.4 Kingston 6.1 5.6 5.3 5.2 5.5 5.4 5.4 5.5 5.6 5.5 5.5 5.4 5.2 55 6.1 Central Ontario 6.5 6.0 6.0 6.4 6.4 6.6 6.3 6.3 6.2 5.8 5.8 5.6 5.6 6.2 6.6 Oshawa 6.2 6.3 6.1 6.0 6.0 5.3 4.9 5.1 5.6 5.8 5.5 5.0 4.9 5.7 6.3 Toronto 7.2 7.0 7.0 6.8 6.8 6.3 5.9 5.8 5.9 6.0 5.9 5.9 5.8 6.4 7.2 Hamilton 6.0 5.5 5.3 5.2 5.3 4.6 4.2 4.0 4.2 4.6 4.8 5.5 4.0 4.9 6.0 St. Catharines 6.5 6.8 7.1 7.4 6.8 6.5 6.2 6.8 7.1 6.9 6.0 5.2 5.2 6.6 7.4 London 6.3 5.5 6.2 6.0 5.7 5.3 5.2 6.0 6.1 6.2 6.4 6.6 5.2 6.0 6.6 Niagara 6.6 6.7 6.8 7.0 7.2 7.3 7.3 7.3 7.2 7.3 7.5 7.5 6.6 7.1 7.5 Windsor 5.7 5.6 5.9 6.0 6.7 6.7 6.2 7.3 6.6 6.7 5.6 5.9 5.6 6.2 7.3 Kitchener 5.6 5.3 5.3 5.2 4.8 4.4 4.6 5.3 5.2 5.0 4.7 5.0 4.4 5.0 5.6 Huron 6.8 6.9 6.9 6.5 6.3 6.7 6.8 6.6 6.1 5.4 4.7 4.5 4.5 6.2 6.9 South Central Ontario 4.6 4.5 4.4 4.7 4.5 4.4 4.3 4.4 5.0 5.2 5.4 5.2 4.3 4.7 5.4 Sudbury 7.1 6.5 6.3 6.4 6.5 6.3 6.0 6.1 6.2 6.6 6.5 6.5 6.0 6.4 7.1 Thunder Bay 5.6 5.6 5.3 5.4 5.2 4.9 4.9 5.5 5.8 5.8 5.4 5.4 4.9 5.4 5.8 Northern Ontario 12.2 12.0 11.6 11.3 11.3 11.7 11.9 11.7 11.1 10.8 11.1 11.2 10.8 11.5 12.2 Manitoba Winnipeg 6.4 6.2 5.9 5.7 5.6 5.5 5.5 5.6 5.7 5.7 5.7 6.0 5.5 5.8 6.4 Southern Manitoba 6.3 6.0 6.0 6.1 6.0 6.0 6.2 6.3 6.6 6.8 6.9 6.5 6.0 6.3 6.9 Northern Manitoba 30.9 31.5 32.4 32.7 32.8 32.0 31.3 31.2 32.4 32.9 33.6 33.8 30.9 32.3 33.8 Saskatchewan Regina 5.0 4.8 4.8 5.1 5.3 5.5 5.6 5.4 4.9 4.7 4.4 5.0 4.4 5.0 5.6 Saskatoon 7.5 7.8 8.3 8.4 8.4 8.3 8.0 7.6 7.6 7.6 7.4 6.9 6.9 7.8 8.4 Southern Saskatchewan 6.8 7.2 7.4 7.5 7.3 7.2 7.2 7.2 7.3 7.9 8.3 8.5 6.8 7.5 8.5 Northern Saskatchewan 20.2 19.8 19.2 18.8 18.9 19.2 18.9 18.4 18.2 18.6 18.2 17.7 17.7 18.8 20.2 Alberta Calgary 9.1 9.0 9.2 8.9 8.6 8.6 8.6 8.4 7.9 7.6 7.7 7.9 7.6 8.5 9.2 Edmonton 8.5 8.0 7.7 7.7 8.4 8.8 8.8 8.4 8.0 7.5 7.3 7.0 7.0 8.0 8.8 Northern Alberta 12.7 12.0 11.8 11.4 11.2 11.2 11.3 11.5 11.6 11.6 11.5 11.3 11.2 11.6 12.7 Southern Alberta 9.0 8.7 8.3 7.4 7.1 7.1 7.6 7.8 7.7 7.5 7.0 6.5 6.5 7.6 9.0 British Columbia Southern Interior British Columbia 8.4 8.0 8.0 7.9 8.0 8.4 9.0 9.6 9.0 8.5 8.1 8.0 7.9 8.4 9.6 Abbotsford 6.5 5.8 5.6 5.3 5.5 5.6 5.6 5.4 5.3 5.0 4.5 4.1 4.1 5.4 6.5 Vancouver 4.8 4.8 5.2 5.1 5.1 4.8 4.6 4.3 4.3 4.2 4.1 4.0 4.0 4.6 5.2 Victoria 4.7 4.5 4.7 4.8 5.5 5.5 5.4 4.6 4.1 4.2 4.7 5.3 4.1 4.8 5.5 Southern Coastal British Columbia 6.7 6.5 6.2 5.8 5.6 5.8 6.0 6.3 6.5 6.6 6.7 6.8 5.6 6.3 6.8 Northern British Columbia 12.2 11.4 10.8 10.5 10.2 9.9 9.9 10.0 9.9 9.9 9.8 10.0 9.8 10.4 12.2 Territories Whitehorse 5.4 5.0 5.2 4.8 4.4 3.8 3.8 3.8 3.6 3.5 3.4 3.1 3.1 4.2 5.4 Yukon 6.6 7.3 7.8 7.3 7.4 7.4 7.5 7.5 6.6 6.7 6.5 6.5 6.5 7.1 7.8 Yellowknife 4.6 4.1 3.6 3.4 3.4 3.2 3.1 3.0 3.0 3.0 2.7 3.2 2.7 3.4 4.6 Northwest Territories 9.8 9.9 10.3 9.9 10.2 10.0 12.2 11.7 11.4 11.4 14.8 13.3 9.8 11.2 14.8 Iqaluit 8.9 9.8 7.9 9.6 11.3 10.4 8.6 8.0 8.6 8.7 8.9 7.8 7.8 9.0 11.3 Nunavut 18.2 19.9 19.1 19.3 18.4 18.9 18.3 17.7 17.8 17.4 17.8 17.9 17.4 18.4 19.9 - 1 The unemployment rates in this annex are those used in the administration of the EI program. These rates come from Statistics Canada but may differ from the official unemployment rates due to differences in methodology, as explained below.
- 2 To obtain the monthly unemployment rates used for the purposes of the Employment Insurance program relating to periods before April 9 2017, please refer to the Web page Monthly Seasonal Adjusted Unemployment Rates by EI Economic Region [http://srv129.services.gc.ca/ei_regions/eng/rates.aspx?id=2017]
- 3 Effective for new claims established between the dates indicated.
- 4 The regional unemployment rates are calculated using a 3-month moving average (or, in the case of the territories, a 12-month moving average if this is larger) of seasonally adjusted unemployment rates for the period ending in the month indicated. These regional rates come from Statistics Canada's Labour Force Survey (LFS). The regional unemployment rates in the provinces incorporate an estimate of the rates of unemployment for status Indians living on reserves, as per section 17 of the Employment Insurance Regulations. Conversely, the regional unemployment rates in the territories are representative of the population, as LFS data cover persons living on and off reserves. A monthly regional unemployment rate substitute is used if Statistics Canada is not able to publish a monthly unemployment rate for reasons of confidentiality.
- Source: Statistics Canada, Labour Force Survey (for data on unemployment rate); and Employment and Social Development Canada, Employment Insurance administrative data (for information on effective dates).
-
Annex 2.30 Employment Insurance economic regions map – FY1718
Employment Insurance economic regions map – FY1718 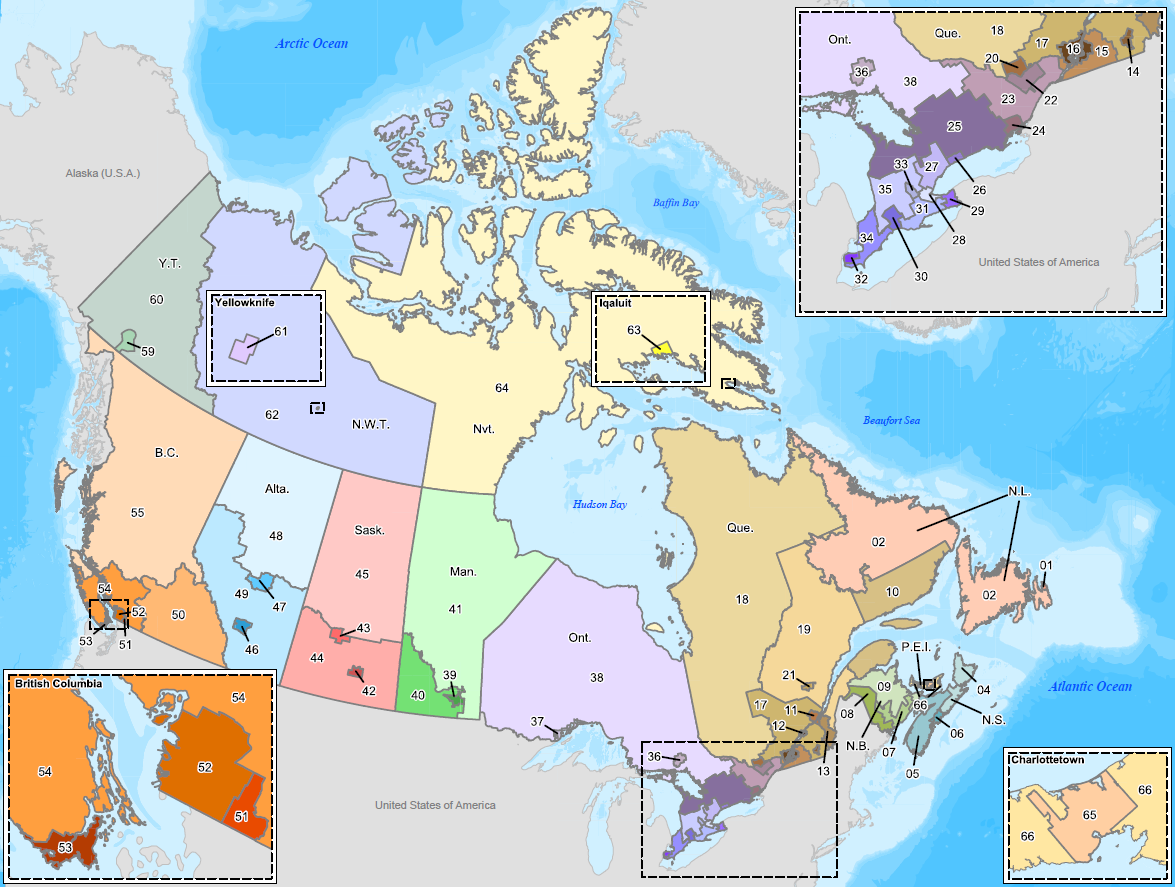
Text description of Employment Insurance economic regions map
- Newfoundland and Labrador:
- 01 St-John’s
- 02 Newfoudland/Labrador
- Prince Edward Island:
- 65 Charlottetown
- 66 Prince Edward Island
- Nova Scotia:
- 04 Eastern Nova Scotia
- 05 Western Nova Scotia
- 06 Halifax
- New Brunswick:
- 07 Fredericton–Moncton–Saint John
- 08 Madawaska–Charlotte
- 09 Restigouche–Albert
- Quebec:
- 10 Gaspésie–Îles-de-la-Madeleine
- 11 Québec
- 12 Trois-Rivières
- 13 South Central Quebec
- 14 Sherbrooke
- 15 Montérégie
- 16 Montréal
- 17 Central Quebec
- 18 North Western Quebec
- 19 Bas-St-Laurent–Côte-Nord
- 20 Hull
- 21 Chicoutimi–Jonquière
- Ontario:
- 22 Ottawa
- 23 Eastern Ontario
- 24 Kingston
- 25 Central Ontario
- 26 Oshawa
- 27 Toronto
- 28 Hamilton
- 29 St. Catherines
- 30 London
- 31 Niagara
- 32 Windsor
- 33 Kitchener
- 34 Huron
- 35 South Central Ontario
- 36 Sudbury
- 37 Thunder Bay
- 38 Northern Ontario
- Manitoba:
- 39 Winnipeg
- 40 Southern Manitoba
- 41 Northern Manitoba
- Saskatchewan:
- 42 Regina
- 43 Saskatoon
- 44 Southern Saskatchewan
- 45 Northern Saskatchewan
- Alberta:
- 46 Calgary
- 47 Edmonton
- 48 Northern Alberta
- 49 Southern Alberta
- British Columbia:
- 50 Southern Interior British Columbia
- 51 Abbotsford
- 52 Vancouver
- 53 Victoria
- 54 Southern Coastal British Columbia
- 55 Northern British Columbia
- Yukon:
- 59 Whitehorse
- 60 Yukon
- Northwest Territories:
- 61 Yellowknife
- 62 Northwest Territories
- Nunavut:
- 63 Iqaluit
- 64 Nunavut
- Newfoundland and Labrador: