
Employment Insurance Monitoring and Assessment Report for the fiscal year beginning April 1, 2017 and ending March 31, 2018
Chapter 2 - 4 Employment Insurance fishing benefits
From: Employment and Social Development Canada
On this page
2.4. Employment Insurance fishing benefits
Employment Insurance (EI) provides fishing benefits to eligible self-employed fishers who are actively seeking work. A self-employed fisher is defined as a self-employed person engaged in the following activities (other than under a contract of service or as a sport):
- making a catch;
- doing any work incidental to making or handling catch, whether the work consists of loading, unloading, transporting or curing the catch made by the crew of which the person is a member, or of preparing, repairing, dismantling or laying up the fishing vessel or fishing gear used by that crew in making or handling the catch, where the person engaged in any such incidental work is also engaged in making the catch; or
- the construction of a fishing vessel for his or her own use or for the use of a crew of which the person is a member in making a catch.
To be entitled to receive fishing benefits, applicants must meet the definition of self-employed fishers, must be unemployed and available for work with respect to their fishing activities, and must pay EI premiums during their qualifying period. Unlike EI regular benefits, eligibility is based on insurable earnings obtained from fishing activities, rather than hours of insurable employment. Claimants must be ineligible for EI regular benefits and must have earned, during their qualifying period, the minimum insurable earnings as determined by the regional unemployment rate where the claimant lives (see Table 37).Footnote 73 These income thresholds have remained the same since 1996. Claimants who qualify for fishing benefits are eligible to receive a maximum entitlement of 26 weeks of EI benefits per claim within the benefit period. Claimants may establish two claims per year.
| Regional unemployment rate | Required insurable earnings | Earnings divisor |
|---|---|---|
| 0.1% to 6.0% | $4,200 | 22 |
| 6.1% to 7.0% | $4,000 | 21 |
| 7.1% to 8.0% | $3,800 | 20 |
| 8.1% to 9.0% | $3,600 | 19 |
| 9.1% to 10.0% | $3,400 | 18 |
| 10.1% to 11.0% | $3,200 | 17 |
| 11.1% to 12.0% | $2,900 | 16 |
| 12.1% to 13.0% | $2,700 | 15 |
| 13.1% or higher | $2,500 | 14 |
- Note: Divisor is applied to the insurable earnings during the qualifying period to determine the equivalent weekly earnings that will be subject to the standard 55% replacement rate.
There are two separate benefit periods for fishing benefits corresponding to each of the fishing seasons (winter and summer). Claims associated with the winter qualifying period may be established from the week of April 1 to the week of December 15 and claims associated with the summer qualifying period may be established from the week of October 1 to the week of June 15.Footnote 74 These weeks of benefits may be received consecutively or intermittently, but are limited by the fixed start and end dates of the benefit period.
For the purposes of this section, EI fishing claims refer to EI claims for which at least one dollar of EI fishing benefits were paid.
2.4.1 Employment Insurance fishing claims and benefits paid
The number of new fishing claims increased to 30,100 in FY1718, up by 3.9% from FY1617. This was the fourth consecutive year-over-year increase since the 14-year low registered in FY1314 in which there were 27,200 new claims.
Along with the increase in the number of fishing claims established, the amount paid in fishing benefits increased by 6.1% to $300.2 million in FY1718. The amount paid in fishing benefits represent around 1.6% of the total benefits paid for all EI benefit types.
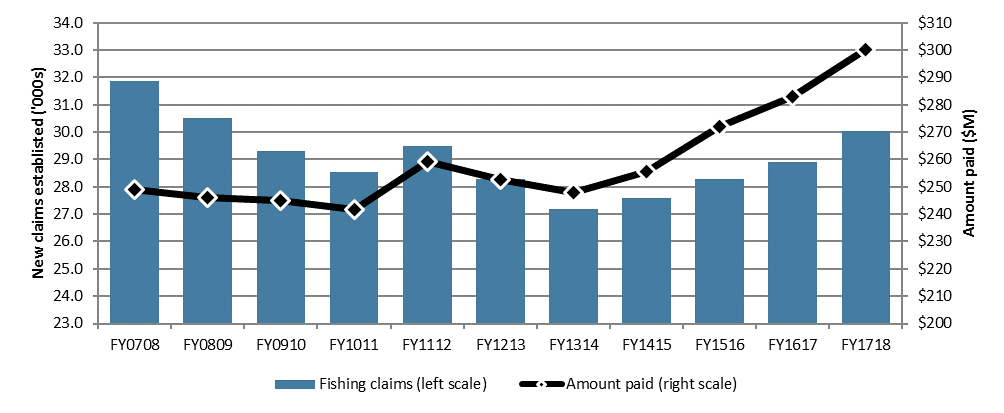
Chart 28 – Text version
| FY0708 | FY0809 | FY0910 | FY1011 | FY1112 | FY1213 | FY1314 | FY1415 | FY1516 | FY1617 | FY1718 | |
|---|---|---|---|---|---|---|---|---|---|---|---|
| Fishing claims (in thousands) (left scale) | 31.9 | 30.5 | 29.3 | 28.5 | 29.5 | 28.3 | 27.2 | 27.6 | 28.3 | 28.9 | 30.1 |
| Amount paid ($ millions) (right scale) | $248.9 | $246.2 | $245.1 | $241.7 | $259.2 | $252.8 | $247.9 | $255.6 | $272.3 | $282.9 | $300.2 |
- Note: Includes claims for which at least $1 of fishing benefits were paid.
- Source: Employment and Social Development Canada, Employment Insurance (EI) administrative data. Data on claims established are based on a 100% sample of EI administrative data, data on amount paid are based on a 10% sample.
During FY1718, the number of new fishing claims increased in all provinces with a significant fishing industry, except Quebec, where there was a slight decrease of 0.9% in new fishing claims (see Table 38). In line with FY1617, Atlantic Canada accounted for the largest share of new fishing claims at 81.4%, with Newfoundland and Labrador at 40.9%, followed by Nova Scotia at 18.7%, Prince Edward Island at 10.8% and New Brunswick at 11.0%. They were followed by British Columbia (9.8%) and Quebec (4.7%). Claimants in the Atlantic Provinces received 81.7% of fishing benefits paid to self-employed fishers in Canada, with Newfoundland and Labrador accounting for 40.4% of the benefits paid. The amount of fishing benefits paid increased in all provinces with a significant fishing industry, except Quebec, with a decrease of -7.2%.
As in previous years, fishing claims were predominantly established by men (79.9%), with women accounting for 20.1% of fishing claims in FY1718, although the number of claims established and the amount paid has increased at a faster rate for women.
| Claims established | Amount paid ($ millions) | |||||
|---|---|---|---|---|---|---|
| FY1617 | FY1718 | Change (%) | FY1617 | FY1718 | Change (%) | |
| Region | ||||||
| Newfoundland and Labrador | 11,819 | 12,278 | +3.9% | $111.4 | $121.4 | +9.0% |
| Prince Edward Island | 3,108 | 3,258 | +4.8% | $28.4 | $29.5 | +3.6% |
| Nova Scotia | 5,448 | 5,633 | +3.4% | $57.2 | $59.8 | +4.5% |
| New Brunswick | 3,066 | 3,310 | +8.0% | $31.1 | $34.7 | +11.4% |
| Quebec | 1,425 | 1,412 | -0.9% | $12.0 | $11.2 | -7.2% |
| British Columbia | 2,919 | 2,942 | +0.8% | $29.9 | $30.4 | +1.7% |
| Other provinces and territories | 1,149 | 1,222 | +6.4% | $12.9 | $13.3 | +3.1% |
| Gender | ||||||
| Male | 23,502 | 24,015 | +2.2% | $229.5 | $241.0 | +5.0% |
| Female | 5,432 | 6,040 | +11.2% | $53.4 | $59.2 | +10.9% |
| Age | ||||||
| 24 years old and under | 1,460 | 1,564 | +7.1% | $14.0 | $14.8 | +5.7% |
| 25 to 44 years old | 8,335 | 8,683 | +4.2% | $82.1 | $90.1 | +9.7% |
| 45 to 54 years old | 8,171 | 8,217 | +0.6% | $79.9 | $82.0 | +2.7% |
| 55 years old and over | 10,968 | 11,591 | +5.7% | $106.9 | $113.3 | +6.0% |
| EI claimant category | ||||||
| Long tenured worker | 279 | 302 | +8.2% | $2.0 | $3.1 | 58.3% |
| Occasional claimant | 3,543 | 4,001 | +12.9% | $35.3 | $42.0 | 19.1% |
| Frequent claimant | 25,109r | 25,750 | +2.6% | $245.7 | $255.0 | 3.8% |
| Canada | 28,934 | 30,055 | +3.9% | $282.9 | $300.2 | +6.1% |
- Note: Data may not add up to the total due to rounding. Percentage change is based on unrounded numbers. Includes all claims for which at least $1 in EI fishing benefits was paid.
- r Revised
- Source: Employment and Social Development Canada, Employment Insurance (EI) administrative data. Data are based on a 100% sample of EI administrative data, except for amount paid which is based on a 10% sample.
The number of new fishing claims established has increased for every age category. The share of fishers 55 years old and over has consistently increased since 2007, representing an aging labour force in regions where fishing is a significant industry.
The number of new fishing claims established has also increased in each claimant category. The majority of new fishing claims (85.7%) were established by frequent claimants, 13.3% were by occasional claimants and only 1.0% by long-tenured workers. This distribution is similar to that for fishing benefits paid, where frequent claimants collected 85.0% of fishing benefits paid.
The average weekly fishing benefit rate increased by 0.9%, from $505 in FY1617 to $510 during the reporting period (See Annex 2.10.3).This rate continues to be above the average weekly regular benefit rate of $454. The average weekly benefit rate increased in every province with a significant fishing industry other than British Columbia, where there was a decrease of -1.8%. The average weekly rates tend to be highest in Prince Edward Island, Quebec, Nova Scotia and New Brunswick.
The proportion of fishing claimants who received the maximum benefit rate has decreased slightly from 75.5% during FY1617 to 74.2% during the reporting period, but typically remains higher than the proportion of EI regular claimants at the maximum benefit rate (47.3% in FY1718). This is partly attributable to the fact that 66.5% of fishers who established a new fishing claim in FY1718 resided in an EI economic region with an unemployment rate higher than 13% (minimum divisor of 14) and only required $13,924 in insurable earnings over their qualifying period to receive the maximum weekly benefit rate of $547. Chart 29 shows that there is a significant concentration of fishing claims established with an amount of insurable earnings at, or very close to, the value required to obtain the maximum benefit rate in fishing regions.
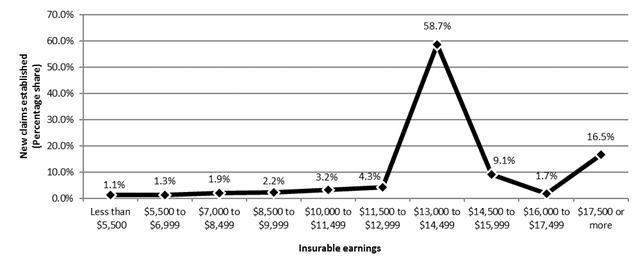
Chart 29 – Text version
| Insurable earnings | New claims established (percentage share) |
|---|---|
| Less than $5,500 | 1.1% |
| $5,500 to $6,999 | 1.3% |
| $7,000 to $8,499 | 1.9% |
| $8,500 to $9,999 | 2.2% |
| $10,000 to $11,499 | 3.2% |
| $11,500 to $12,999 | 4.3% |
| $13,000 to $14,499 | 58.7% |
| $14,500 to $15,999 | 9.1% |
| $16,000 to $17,499 | 1.7% |
| $17,500 or more | 16.5% |
| Total | 100.0% |
- Note: Includes claims for which at least $1 of fishing benefits were paid.
- Source: Employment and Social Development Canada, Employment Insurance (EI) administrative data. Data are based on a 100% sample of EI administrative data.
2.4.2 Seasonal component of Employment Insurance fishing benefits
Of the 30,100 new fishing claims established during the reporting period, there were only 21,400 fishers, reflecting the fact that fishing benefits are available for two fishing seasons per year (winter and summer). The number of fishers who established at least one claim during the reporting period has increased for the fourth year in a row (+711 or +3.4%), compared to a low of 19,300 fishers in FY1314.
Most self-employed fishers who established only one new fishing claim in FY1718 did so for earnings during the summer qualifying period (9,700) compared to the winter qualifying period (3,000) (see Table 39). Around 40% of fishers who established a new fishing claim in FY1718 did so during both seasons. Atlantic Canada and Quebec accounted for 97.8% of all fishers who established multiple fishing claims.
| Season of establishment | FY1314 | FY1415 | FY1516 | FY1617 | FY1718 |
|---|---|---|---|---|---|
| One season | 11,460 | 11,880 | 11,996 | 12,398 | 12,709 |
| Winter | 2,559 | 2,596 | 2,605 | 2,720 | 3,031 |
| Summer | 8,901 | 9,284 | 9,391 | 9,678 | 9,678 |
| Two seasons | 7,856 | 7,852 | 8,132 | 8,267 | 8,667 |
| Canada | 19,316 | 19,732 | 20,128 | 20,665 | 21,376 |
- Source: Employment and Social Development Canada, Employment Insurance (EI) administrative data. Data are based on a 100% sample of EI administrative data.
In FY1718, fishers who established a claim received an average of $11,077 in fishing benefits, while fishers who established two claims during the year received an average of $9,646 for the first claim and $8,449 for the second claim, averaging a total of $18,095. This compares to $7,028 in EI regular benefits paid to the average EI regular benefit claimant.
2.4.3 Duration of Employment Insurance fishing benefits
Regardless of a claimant’s region of residence or local labour market conditions, the maximum duration for fishing benefits is 26 weeks per claim. The actual average duration of fishing benefit periods varies very little over time. During the FY1718 reporting period, the average duration for all provinces with a significant fishing industry was 19.9 weeks, a decrease of 0.9 weeks from the previous year. Among these provinces, British Columbia has historically had the highest average fishing benefit duration at 23.1 weeks. The average weeks of fishing benefits used by the Atlantic Provinces and Quebec varied between 17.1 and 19.8 per claim.
Fishers who established a single claim in FY1718 received an average of 23.1 weeks of fishing benefits, unchanged from the previous year. Fishers who established two claims received an average of 18.7 weeks for their first claim and 16.4 weeks for their second claim, for a total average of 35.1 weeks.
| Season | Average duration (weeks) | |
|---|---|---|
| FY1617 | FY1718 | |
| One season / one claim | 22.9 | 23.1 |
| Two seasons / two claims | 38.5r | 35.1 |
| First claim | 19.9 | 18.7 |
| Second claim | 18.5 | 16.4 |
- r Revised data
- Source: Employment and Social Development Canada, Employment Insurance (EI) administrative data. Data are based on a 100% sample of EI administrative data.