
Chapter 1: Labour market context
From: Employment and Social Development Canada
Official title: Employment Insurance Monitoring and Assessment Report for the fiscal year beginning April 1, 2019 and ending March 31, 2020: Chapter 1: Labour market context
On this page
List of abbreviations
This is the complete list of abbreviations for the Employment Insurance Monitoring and Assessment Report for the fiscal year beginning April 1, 2019 and ending March 31, 2020.
Abbreviations
- ADR
- Alternative Dispute Resolution
- ASETS
- Aboriginal Skills and Employment Training Strategy
- B/C Ratio
- Benefits-to-Contributions ratio
- B/U Ratio
- Benefits-to-Unemployed ratio
- B/UC Ratio
- Benefits-to-Unemployed Contributor ratio
- BDM
- Benefit Delivery Modernization
- CAWS
- Citizen Access Workstation Services
- CCAJ
- Connecting Canadians with Available Jobs
- CCDA
- Canadian Council of Directors of Apprenticeship
- CCIS
- Call Centre Improvement Strategy
- CEIC
- Canada Employment Insurance Commission
- CERB
- Canada Emergency Response Benefit
- COLS
- Community Outreach and Liaison Service
- CPI
- Consumer Price Index
- CPP
- Canada Pension Plan
- CRA
- Canada Revenue Agency
- CRF
- Consolidated Revenue Fund
- CX
- Client Experience
- EBSMs
- Employment Benefits and Support Measures
- ECC
- Employment Contact Centre
- EI
- Employment Insurance
- EICS
- Employment Insurance Coverage Survey
- EIR
- Employment Insurance Regulations
- EI SQR
- Employment Insurance Service Quality Review
- eROE
- Electronic Record of Employment
- ESDC
- Employment and Social Development Canada
- FLMM
- Forum of Labour Market Ministers
- FY
- Fiscal Year
- FY *
- Fiscal Year excluding the month of March
- G7
- Group of Seven
- GDP
- Gross Domestic Product
- HCCS
- Hosted Contact Centre Solution
- HRSDC
- Human Resources and Social Development Canada
- IQF
- Individual Quality Feedback
- IQP
- Integrated Quality Platform
- ISET
- Indigenous Skills and Employment Training
- IVR
- Interactive Voice Response
- LFS
- Labour Force Survey
- LMDA
- Labour Market Development Agreements
- LMI
- Labour Market Information
- LMP
- Labour Market Partnerships
- MAEST
- Ministry of Advanced Education, Skills and Training
- MIE
- Maximum Insurable Earnings
- MSCA
- My Service Canada Account
- MTESS
- Ministère du Travail, de l'Emploi et de la Solidarité sociale
- NAICS
- North American Industry Classification System
- NESI
- National Essential Skills Initiative
- NIS
- National Investigative Services
- NOS
- National Occupational Standards
- NWS
- National Workload System
- OAS
- Old Age Security
- OECD
- Organization for Economic Co-operation and Development
- PAAR
- Payment Accuracy Review
- PPEs
- Clients who are Premiums Paid Eligible
- P/Ts
- Provinces and Territories
- PRAR
- Processing Accuracy Review
- PRP
- Premium Reduction Program
- QPIP
- Quebec Parental Insurance Plan
- R&I
- Research and Innovation
- RAIS
- Registered Apprenticeship Information System
- ROE
- Record of Employment
- RSOS
- Red Seal Occupational Standards
- SA
- Social Assistance
- SCC
- Service Canada Centres
- SDP
- Service Delivery Partner
- SEPH
- Survey of Employment, Payrolls and Hours
- SIN
- Social Insurance Number
- SIR
- Social Insurance Registry
- SLAP
- Softwood Lumber Action Plan
- SME
- Small and medium sized enterprises
- SST
- Social Security Tribunal
- STDP
- Short-term disability plan
- SUB
- Supplemental Unemployment Benefit
- TRF
- Targeting, Referral and Feedback
- UV ratio
- Unemployment-to-vacancy ratio
- VBW
- Variable Best Weeks
- VER
- Variable Entrance Requirement
- WWC
- Working While on Claim
Introduction
This chapter outlines the overall economic situation and key labour market developments in Canada during the fiscal year of the Government of Canada beginning on April 1, 2019 and ending on March 31, 2020 (FY1920).Footnote 1 This is the same period for which this Report assesses the Employment Insurance (EI) program. Section 1.1 provides a general overview and historical context of the economic situation for FY1920. Section 1.2 summarizes key labour market developments in the Canadian economy during the reporting period.Footnote 2 Section 1.3 discusses the evolution of the composition of the unemployed population over the past decades. Definitions and more detailed statistical tables related to key labour market concepts discussed in this chapter can be found in Annex 1.
1.1 Economic overview
The Canadian economy experienced low growth in FY1920 as real Gross Domestic Product (GDP) increased by 1.4% compared to the previous year (consult chart 1). The real GDP growth slowed down for the second consecutive fiscal year after reaching the highest year-over-year rise in FY1718 since FY1011.
Real GDP growth was strong in the first quarter (+1.1%) of the reporting period. It then remained almost flat for the following 2 quarters (+0.5% and +0.1%), mostly due to continued global trade tensions and market uncertainty. However, the slow growth observed in FY1920 was mainly attributable to the sharp decline in real GDP (-1.9%) observed in the last quarter owing to the measures imposed to contain the COVID-19 pandemic.
In March 2020,Footnote 3 unprecedented government interventions related to the COVID-19 pandemic were put in place, such as the closure of non-essential businesses, travel restrictions, and public health measures directing Canadians to limit social interactions. These interventions resulted in a substantial slowdown in economic activity and a sudden shock to the Canadian labour market. The pandemic brought about the deepest and fastest recession since the Great Depression, causing a 13.4% drop in Canada’s real GDP over the first half of 2020.Footnote 4

Chart 1 – Text description
| Fiscal year | Gross domestic product (left scale) | Gross domestic product growth (right scale) |
|---|---|---|
| FY0708 | 1.73 | 2.1% |
| FY0809 | 1.73 | 0.0% |
| FY0910 | 1.70 | -2.0% |
| FY1011 | 1.75 | 3.4% |
| FY1112 | 1.81 | 3.0% |
| FY1213 | 1.83 | 1.5% |
| FY1314 | 1.88 | 2.6% |
| FY1415 | 1.93 | 2.7% |
| FY1516 | 1.94 | 0.3% |
| FY1617 | 1.97 | 1.4% |
| FY1718 | 2.03 | 3.1% |
| FY1819 | 2.07 | 2.2% |
| FY1920 | 2.10 | 1.4% |
- Note: Shaded area(s) corresponds to recessionary period(s) in Canada's economy.
- Source: Statistics Canada, Table 36-10-0104-01.
Similar to Canada, other Group of Seven (G7) countries—a group consisting of the world’s major industrialized and advanced countries—experienced lower, or even negative, economic growth in FY1920 relative to the previous year.Footnote 5
Almost all Canadian industries were affected by the COVID-19 economic shutdown in March 2020. This is shown by the widespread declines in terms of real GDP recorded between the third and last quarters of FY1920 (consult chart 2). Three industries recorded a notable year-over-year decrease in real GDP during the full reporting period compared to FY1819. The Manufacturing industry (-1.7%) and the Business, building and other support services industry (-1.6%) went down during most of FY1920. Conversely, the drop in the Accommodation and food services industry (-1.2%) resulted from the mandatory closures of all non-essential businesses in March 2020 which significantly affected this industry.Footnote 6
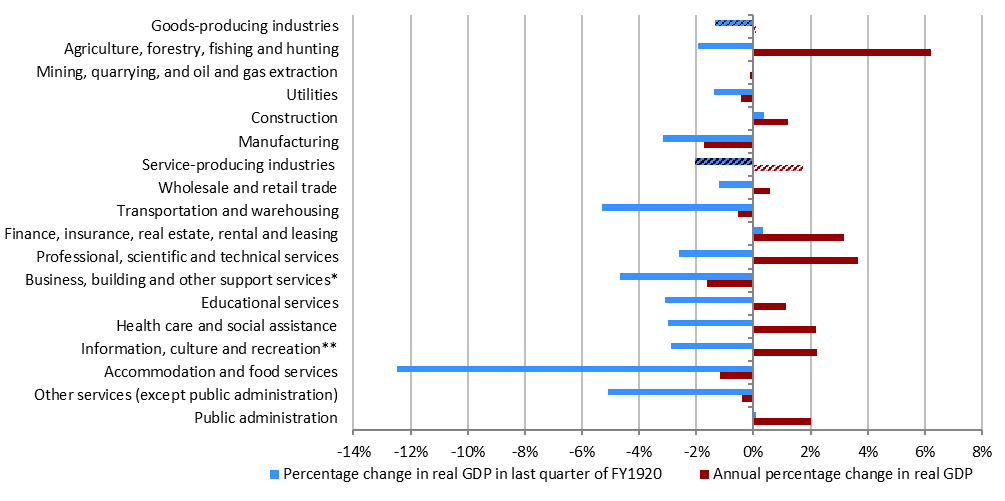
Chart 2 – Text description
| Industry | Percentage change in real gross domestic product in last quarter of FY1920 | Annual percentage change in real gross domestic product |
|---|---|---|
| Goods-producing industries | -1.3% | 0.1% |
| Agriculture, forestry, fishing and hunting | -1.9% | 6.2% |
| Mining, quarrying, and oil and gas extraction | -0.1% | -0.1% |
| Utilities | -1.4% | -0.4% |
| Construction | 0.4% | 1.2% |
| Manufacturing | -3.2% | -1.7% |
| Service-producing industries | -2.1% | 1.7% |
| Wholesale and retail trade | -1.2% | 0.6% |
| Transportation and warehousing | -5.3% | -0.5% |
| Finance, insurance, real estate, rental and leasing | 0.3% | 3.2% |
| Professional, scientific and technical services | -2.6% | 3.7% |
| Business, building and other support services | -4.7% | -1.6% |
| Educational services | -3.1% | 1.1% |
| Health care and social assistance | -3.0% | 2.2% |
| Information, culture and recreation | -2.9% | 2.2% |
| Accommodation and food services | -12.5% | -1.2% |
| Other services (except public administration) | -5.1% | -0.4% |
| Public administration | 0.1% | 2.0% |
- * Includes management of companies and enterprises and administrative and support, waste management and remediation services.
- ** Includes information and cultural industries and arts, entertainment and recreation industries.
- Source: Statistics Canada, Table 36-10-0434-01.
1.2 The Canadian labour market in FY1920
Most of this section presents the labour market conditions prevailing in Canada for the period beginning on April 1, 2019 and ending on February 29, 2020 (identified with an asterisk as FY1920*) separately from those observed in March 2020.
This section highlights key labour market developments in CanadaFootnote 7 during the reporting period, including some labour market elements linked to the EI program. Overall, the Canadian labour market was characterized by strong employment growth and a low unemployment rate. However, physical distancing measures and economic shutdowns intended to contain the spread of COVID-19 resulted in sharp declines in labour market activity in March 2020. For this reason, the reporting fiscal year was split to present labour market indicators for the pre-pandemic period separately from March 2020. For most of the indicators, results are reported for the period from April 1, 2019 to February 29, 2020 ─ identified with an asterisk as FY1920* ─ and for March 2020.Footnote 8
The size of Canada’s labour forceFootnote 9 increased by 1.9% (+372,200) to 20.2 million in FY1920*, which was above the rate recorded in FY1819* (+1.3%). All provinces experienced a positive growth in labour force relative to the previous reporting period, except for Newfoundland and Labrador (-1.2%) and Manitoba where it remained unchanged. The national labour force participation rate increased from 65.3% in FY1819* to 65.6% in FY1920*. It has nonetheless trended downward over the past decade, mainly due to the aging of the population.Footnote 10 Nova Scotia, Ontario, Quebec, Prince Edward Island, British Columbia and Saskatchewan registered higher labour force participation rates compared to FY1819*. Growth in their labour force outpaced growth in their working-age population. The remaining provinces posted lower rates.
Employment growth
During the reporting period, Canadian employment increased by 2.1%, surpassing the growth (+1.6%) recorded in FY1819*. Job creation in FY1920* was a bit higher in part-time work (+2.3%) than full-time work (+2.1%). In addition, the number of employees grew at a relatively higher pace in the public sector (+2.5%) than the private sector (+2.1%).Footnote 11
Employment growth was unevenly spread across enterprises of all sizes over the period examined.Footnote 12 Medium-large-sized firms and large-sized firms registered the highest increases in number of employees in the first 3 quarters of FY1920 (+2.8% and +2.3%, respectively), whereas small-sized firms recorded the lowest (+1.0%).Footnote 13 Small-medium-sized firms observed a +2.1% rise over the same period. On the other hand, the distribution of employees by enterprise size has stayed relatively constant over recent years. Large-sized firms employed 45.1% of workers in the first 3 quarters of FY1920, while the share of workers in the 3 other firm size categories ranged from 15.6% to 19.7%.
As a result of the measures related to COVID-19, employment fell by almost 1 million (‑5.2%) in March 2020. Some businesses and organizations had to reduce their activities resulting in a combination of reduced work hours, temporary layoffs or permanent reductions in employment. Largest employment losses in March were in part-time work (-14.7%), among private sector employees (-6.6%), youth 15 to 24 years old (-16.0%), women (-6.9%) and workers in temporary jobs (-14.5%). Largest employment declines during that month were also recorded in industries which involve public-facing activities or limited ability to work from home. The most affected were Accommodation and food services (‑23.8%), Information, culture and recreation (‑13.2%), Educational services (-8.8%) and Wholesale and retail trade (-7.1%) industries.Footnote 14 However, the cumulative effect of the COVID-19 pandemic on employment was most markedly felt in April 2020. Employment started to rebound in May 2020 with the gradual easing of restrictions and re-opening of the economy (consult the box titled Impact of the COVID-19 pandemic on the labour market in 2020).
Employment rates
The indicator of employment growth presented above does not take into consideration the working-age population growth (which could be higher, thus resulting in a negative net job creation). The measure of employment rate, which is the proportion of people aged 15 years and over who were employed, accounts for that.
The employment rate increased by 0.3 percentage points to reach 61.8% in FY1920* compared to FY1819*, but was still below its highest level of 63.2%, recorded in FY0708*. Both men and women recorded higher employment rates in FY1920* compared to the previous period. Higher rates were also registered for youth aged 15 to 24 years, individuals aged 25 to 54 years, and individuals aged 55 years and over. However, in response to the COVID-19 crisis, the overall employment rate dropped by 3.3 percentage points in March 2020, to reach 58.5%. The declines in employment rates were sharper for youth and women during that month (‑9.3 and ‑4.0 percentage points, respectively).
Compared to other G7 countries, Canada ranked first in terms of employment rate in the first 3 quarters of FY1920. However, Germany, Japan and Italy reported higher relative increases in their employment rate compared to Canada over the period examined.Footnote 15
Employment among self-employed workers
The number of self-employed workers grew by +1.7% in FY1920*. This was lower than the overall employment growth (+2.1%) for the same period. As a result, the share of self-employed among total employed declined slightly to 15.1% over the reporting period (-0.1 percentage points from FY1819*).Footnote 16 Employment losses associated with the COVID-19 pandemic were less pronounced for self-employed than employees in March 2020 (-1.5% and -5.9%, respectively). However, this situation reversed in the subsequent months, as the number of self-employed was farther from its pre-pandemic level than for employees at the end of 2020.Footnote 17
Self-employed workers are not eligible for EI regular benefits, but they can opt in to EI special benefits (consult subsection 2.6.7 for detailed discussion). Nonetheless, they were eligible for the Canada Emergency Response Benefit if they met the eligibility criteria.
Unemployment rates
For the fourth consecutive year, the number of unemployed individuals in Canada declined. It decreased by 1.9% between FY1819* and FY1920*. Combined with the increase in the size of the Canadian labour force during the same period, the unemployment rate decreased from 5.9% in FY1819* to 5.7% in FY1920*. It was the lowest annual unemployment rate since the beginning of the current series in FY7677.
In contrast, due to the COVID-19 economic shutdown, the number of unemployed individuals jumped by 35.6% (+408,100) from February to March 2020. The unemployment rate reached 7.9% in March, a 2.2 percentage point increase compared to the previous month. The unemployment rates for youth 15 to 24 years old and women went up the most in March, increasing by 6.6 and 3.2 percentage points, respectively.
As in recent years, Canada continued to register the third highest unemployment rate among the G7 countries in the first 3 quarters of FY1920, behind France and Italy.Footnote 18 Changes in unemployment rates at the onset of the COVID-19 crisis varied greatly across G7 countries. The unemployment rates rose sharply in Canada and in the United States, whereas they posted relatively small increases in the remaining G7 countries. As noted by the Organization for Economic Co-Operation and Development (OECD), the heterogeneity of the impact on unemployment across OECD countries reflected fundamental differences in countries’ policy mix to cushion the economic and social effects of the crisis.Footnote 19
The unemployment rate is a key labour market element with respect to the EI program. A lower unemployment rate in an EI economic region translates into a higher required number of hours of insurable employment within the qualifying period to qualify for EI regular benefits. This is one of the core eligibility requirements for EI regular benefits in FY1920* (consult section 2.2). The unemployment rate in an EI economic region also plays a role in determining the EI regular benefit entitlement available to a claimant in FY1920*. Regional variations of the unemployment rate are discussed in subsection 1.2.1.
Impact of the COVID-19 pandemic on the labour market in 2020
In mid-March 2020, a number of government interventions were put in place to limit the spread of the COVID-19, which resulted in a shutdown of the Canadian economy. Most of the measures taken by various jurisdictions to protect public health continued to be in place in April. Starting in May, some jurisdictions gradually eased public health restrictions and re-opened parts of their economies. Over the summer months of 2020, businesses and workplaces continued to re-open, while physical distancing measures remained in place. In the fall, several provinces tightened public health measures in response to spikes in COVID-19 cases. These measures were generally targeted at businesses where the risk of COVID transmission was considered to be higher, such as restaurants, and recreational and cultural facilities.
As a result of the measures related to COVID-19, employment fell by almost 3 million (-15.6%) between February and April (consult the chart below). With the gradual resumption of economic activities, employment started to increase in May, jumped in June, and continued to rise at a moderate pace over the summer months. During the fall, as new COVID-19 restrictions were implemented, employment grew more slowly and declined slightly in December. As of December 2020, about 2.3 million of jobs (3.4% below pre-pandemic levels) had been recovered from the February to April employment losses.
In the meantime, the unemployment rate had more than doubled from 5.7% in February to a record high of 13.7% in May (consult the chart below). By way of comparison, during the FY0809 recession the unemployment rate reached a peak of 8.7% in June 2009. With the COVID-19 restrictions starting to ease in May and the gradual re-opening of the economy, the unemployment rate began to steadily decline over the summer months of 2020. It continued to decrease during the fall but at a slower pace and increased slightly in December. In December, the unemployment rate stood at 8.8%, which was 4.9 percentage points below the May’s record high, but still 3.1 percentage points higher than the February level.
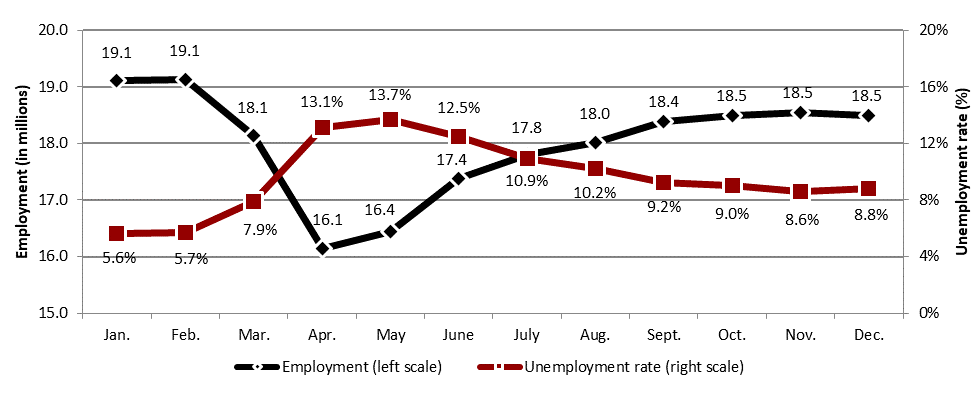
Text description of chart
| Month | Employment (left scale) | Unemployment rate (right scale) |
|---|---|---|
| January | 19.1 | 5.6% |
| February | 19.1 | 5.7% |
| March | 18.1 | 7.9% |
| April | 16.1 | 13.1% |
| may | 16.4 | 13.7% |
| June | 17.4 | 12.5% |
| July | 17.8 | 10.9% |
| August | 18.0 | 10.2% |
| September | 18.4 | 9.2% |
| October | 18.5 | 9.0% |
| November | 18.5 | 8.6% |
| December | 18.5 | 8.8% |
- Source: Statistics Canada, Labour Force Survey, Table 14-10-0287-01, seasonally adjusted data.
In addition to employment, hours worked were also affected by the COVID-19 economic shutdown. The number of people who were employed but worked less than half of their usual hours for reasons related to COVID-19 increased by 2.5 million from February to April. By December, this number was down to 485,000, but still higher than the February level.*
Some groups of workers were more severely impacted by the economic downturn. They experienced, on average, larger employment losses and greater increases in unemployment than their counterparts. These included women, youth 15 to 24 years old, workers in low-wage jobs, workers in temporary jobs and people designated as visible minorities. Moreover, certain industries, such as Accommodation and food services, were disproportionally impacted compared to others. This was partly attributable to the varying degree of physical distancing and remote work possibilities across industries.
* Statistics Canada, Labour Force Survey (custom tabulation)
Duration of unemployment
Along with the decrease in the national unemployment rate in FY1920*, 2 indicators related to unemployment duration posted declines. For the third consecutive reporting period, the average duration of unemployment spells (continuous periods of unemployment where an individual is looking for work) decreased compared to the previous period. It fell by 1.6 weeks between FY1819* and FY1920*, to 16.5 weeks (consult chart 3).
Similarly, the share of long-term unemployment (that is, unemployed individuals who have been searching for a job for a period of at least 12 consecutive months as a proportion of all unemployed individuals) fell for the third year in a row. It went from 9.9% in FY1819* to 8.2% in FY1920*. Moreover, Canada continued to report the lowest proportion of long-term unemployment among G7 countries in 2019.Footnote 20 Despite those declines, both indicators were still above their levels recorded just prior to the recession in FY0809* (consult chart 3).Footnote 21
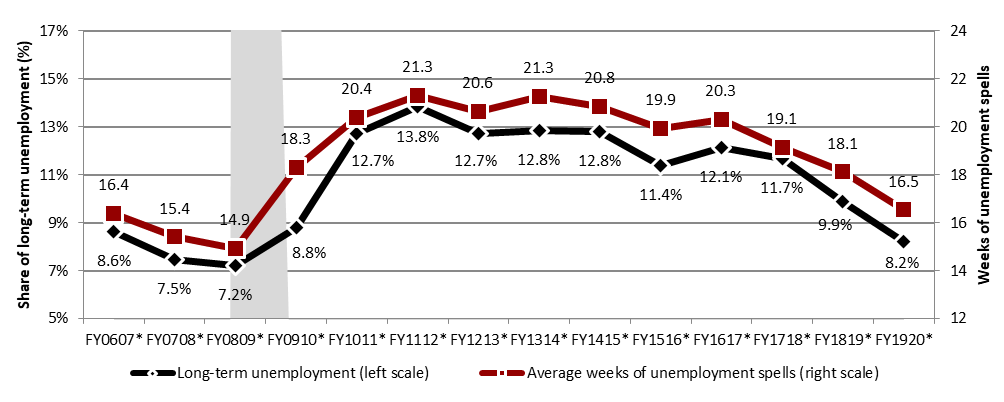
Text description of chart 3
| Reporting period | Long-term unemployment (left scale) | Average weeks of unemployment (right scale) |
|---|---|---|
| FY0607* | 8.6% | 16.4 |
| FY0708* | 7.5% | 15.4 |
| FY0809* | 7.2% | 14.9 |
| FY0910* | 8.8% | 18.3 |
| FY1011* | 12.7% | 20.4 |
| FY1112* | 13.8% | 21.3 |
| FY1213* | 12.7% | 20.6 |
| FY1314* | 12.8% | 21.3 |
| FY1415* | 12.8% | 20.8 |
| FY1516* | 11.4% | 19.9 |
| FY1617* | 12.1% | 20.3 |
| FY1718* | 11.7% | 19.1 |
| FY1819* | 9.9% | 18.8 |
| FY1920* | 8.2% | 16.5 |
- † Long-term unemployment is defined as unemployed individuals who have been searching for a job for a period of at least 12 consecutive months. The percentages presented in this chart are the long-term unemployed as a proportion of all unemployed individuals.
- Note: Shaded area(s) corresponds to recessionary period(s) in Canada's economy.
- Source: Statistics Canada, Labour Force Survey, Table 14-10-0342-01, seasonally adjusted data.
Both indicators of unemployment duration reached lower levels on average in March 2020 compared to FY1920* due to the COVID-19 crisis. The average duration of unemployment spells was 12.6 weeks in March, while the share of long-term unemployment stood at 6.0%. This was mainly due to the large inflow of unemployed individuals who had very low unemployment spells and who contributed to lowering the average unemployment duration during that month.
Reasons for unemployment
Unemployment can result from a number of factors and the reasons for a person’s unemployment are another key factor in determining eligibility for EI benefits.Footnote 22 Generally, EI regular benefits are only available to individuals who have lost their job for reasons outside their control or who left their job with just cause.
As in previous years, individuals who became unemployed because they lost their job accounted for the largest share (41.5%) of the unemployed population in Canada in FY1920*. Generally, 9 out of 10 of those individuals became unemployed because of a permanent layoff. Individuals who became unemployed because they left their job (job leavers) accounted for 21.0% over the same reporting period. Lastly, unemployed individuals with no recent work experience (that is, those who have not worked in the last year or have never worked) accounted for 37.5% of the unemployed population in FY1920*. These proportions remained roughly the same as FY1819*.Footnote 23
However, the large inflow of unemployment caused by the economic shutdown in March 2020 resulted in an increase in the share of job losers among the unemployed population. Compared to the same month in 2019, this share rose by 20.3 percentage points in March 2020 (consult chart 4). Almost all of the inflow in unemployment in March 2020 was due to temporary layoffs (that is, individuals who expected to return to their job within 6 months).Footnote 24 Consequently, in March 2020, half of job losers were unemployed because of temporary layoffs compared to 1 out of 10 in March 2019.
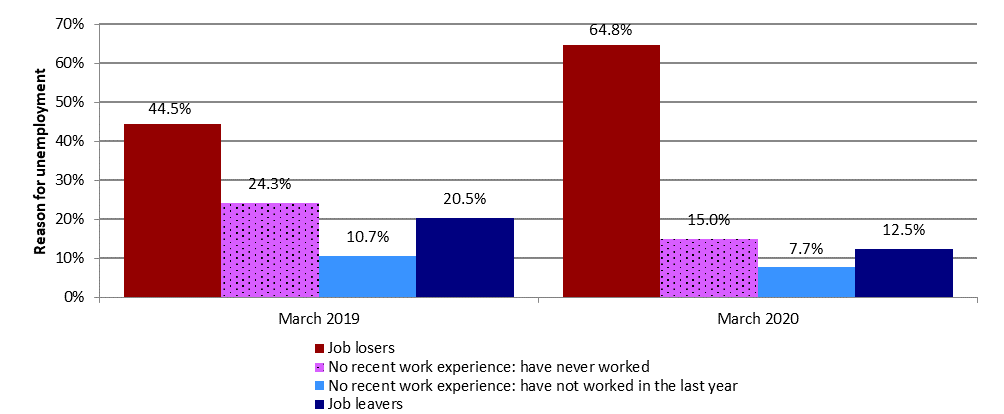
Text description of chart 4
| Month | Job losers | No recent work experience: have never worked | No recent work exprience: have not worked in the last year | Job leavers |
|---|---|---|---|---|
| March 2019 | 44.5% | 24.3% | 10.7% | 20.5% |
| March 2020 | 64.8% | 15.0% | 7.7% | 12.5% |
- Source: Statistics Canada, Labour Force Survey, Table 14-10-0125-01, seasonally unadjusted data.
From an EI perspective, eligibility for EI regular benefits is largely based on the number of hours of insurable employment that an individual has accumulated in the previous 52 weeks. The COVID-19 crisis led to more individuals with recent job experience among the unemployed population than in previous years. However, as previously mentioned, employment losses were larger for youth 15 to 24 years old, women and workers in temporary jobs. These workers tend to be less covered by, and eligible for, EI regular benefits (consult subsection 2.2.2). This would likely impact the indicators of access and coverage of the EI program in 2020.
Job vacancies
Following 2 years of significant increases, the number of job vacancies (unoccupied positions for which employers are actively seeking workers) barely increased during the first 3 quarters of FY1920 (+0.5%) compared to the previous period. Likewise, the job vacancy rate (the number of job vacancies expressed as a percentage of all occupied and vacant jobs) held constant at 3.3% during the reporting period. The duration of job vacancies, however, continued to rise slightly. This suggests that, in general, it took employers more time to fill their vacant positions during the period examined compared to the previous one.Footnote 25
Job vacancies usually become more difficult to fill when the available labour force, primarily the unemployed individuals, declines relative to the number of vacant positions. The labour market is tightening in this case. An indicator of labour market tightness is the unemployment-to-vacancy (UV) ratio. It measures the number of unemployed people for every vacant position and describes how tight or slack the labour market is. A low UV ratio corresponds to a lower number of unemployed people relative to the total job vacancies, which indicates a tighter labour market.Footnote 26
The UV ratio stayed virtually unchanged at 2.0 in the first 3 quarters of FY1920, compared to 2.1 during the same period in FY1819. This means that the labour market tightness appeared to have reached a plateau in Canada over that period.Footnote 27
Job vacancies and Employment Insurance utilization
One would expect a negative relationship between availability of jobs and the use of the EI program. That means the use of EI would decrease with increases in job availability as unemployed individuals could find jobs from more vacant positions. However, this does not necessarily reflect labour market imbalances between the labour supply and demand.
A recent departmental study* examined this relationship between the availability of jobs and various measures of EI utilization in Canada from 2004 to 2019. At the national level, the study found an unstable negative relationship between job vacancy rates and EI utilization rates** over the short-term. This indicates that the nature and degree of the relationship may have changed over time due, for example, to changes in the composition of the unemployed population, in the demand for labour or in the EI program.
The study also showed that the relationship varied substantially across provinces and industries. Larger provinces like Ontario, Quebec, British Columbia and Alberta had negative relationships while Atlantic provinces had no clear relationship between job vacancy rates and EI utilization rates. These mixed results could be partly explained by provincial differences in the degree of skills mismatch and in the composition of employment (e.g. seasonal employment).
At an industry level, no stable negative linear relationship between job vacancy rates and EI utilization rates was found. Inversely, the relationship was slightly positive at higher level of job vacancy rates. This may suggest higher chances of skills mismatch in these industries. The construction industry and the agriculture industry had among the highest job vacancy rates and EI utilization rates over the study period.
- * ESDC, Job Vacancies and Employment Insurance Utilization (Ottawa: ESDC, Labour Market Information Directorate, 2021).
- ** EI utilization rates are defined using two measures: the number of EI beneficiaries over the total number of unemployed individuals (which is sensitive to changes in the composition of the unemployed population) and the number of EI beneficiaries over the labour force (which takes into account both unemployment and employment).
Hours of work
Other indicators, such as hours of work and wages, are also widely used to describe conditions in the labour market. They are also closely linked to the administration of the EI program.
The number of hours of insurable employment is a key eligibility criterion of the EI program, as claimants must have worked a minimum number of insurable hours in the previous year to qualify for EI benefits. It also determines, along with the regional unemployment rate, the maximum number of weeks of EI regular benefits a claimant is entitled to receive.
The average number of hours usually worked by Canadians—hours usually worked in a typical week, not including any overtime—held constant at 36.6 per week in FY1920*. It has been flat in recent years and below the FY0809* pre-recession level. In contrast, the average actual hours worked decreased by 2.0%, from 33.5 in FY1819* to 32.8 in FY1920*. This latter measure of work hours reflects temporary decreases or increases in work hours (for example, hours lost due to illness or vacation, or more hours worked due to overtime).
In addition to employment, hours worked were also impacted by the COVID-19 economic shutdown. A year-over-year comparison indicated a drop of 11.9% in the average actual hours worked recorded in March 2020 compared to March 2019.Footnote 28 Moreover, of those who were employed in March 2020, the number who did not work any hours during the week the Labour Force Survey was conducted increased by 1.5 million compared with February. For the same period, the number who worked less than half of their usual hours increased by 700,000.Footnote 29 Overall, the total number of actual hours worked was 15.7% lower in March 2020 than in March 2019.
Wages
Earnings are also an important element for the administration of the EI program. They determine the EI premiums paid by employers and employees, as well as the level of benefits that claimants can receive. Earnings can be a combination of hourly wages and hours worked, a fixed amount paid for a specific period (for example, a week) or in the form of commissions, tips or bonuses.Footnote 30 Indicators of average hourly wages and average weekly earnings are therefore examined.
Average nominal hourly wages grew faster in FY1920* compared to the previous reporting period. The growth ranged from +2.7% to +4.0% in FY1920*, depending on the data sources examined, as opposed to a range of +1.8% to +2.6% in FY1819*.Footnote 31 Average nominal hourly wages also registered a rise relative to the increase in the consumer price index (CPI) (+2.1%) in FY1920*, resulting in higher real hourly wages.Footnote 32
Along with hourly wages, the average nominal weekly earnings increased by 3.2% in FY1920* to reach $1,036, surpassing the growth (+2.3%) observed in the previous period. In real terms, the average weekly earnings went up by 1.1% in FY1920*. In contrast, it remained virtually unchanged in FY1819*, as the CPI grew by 2.2% during that period.Footnote 33
Wage growth dynamics are linked to a variety of factors, notably labour productivity, labour market tightness, inflation expectations, demographic shifts, structural changes and minimum wages increases. Compared with 1 year earlier, average nominal hourly wages rose by 6.4% in March 2020. This increase was mainly attributable to larger employment declines in relatively low-paying industries (such as Accommodation and food services and Wholesale and retail trade industries) associated with the COVID-19 crisis. Half of the decline in employment among employees in March was accounted for by those earning less than two-thirds of the 2019 median hourly wage.Footnote 34 This caused a shift in the wage distribution that resulted in higher average hourly wages in March.
1.2.1 Canada’s regional labour market
Canada’s strong labour market performance in FY1920* was essentially driven by British Columbia, Quebec and Ontario. These provinces had among the highest rates of employment growth combined with some of the lowest unemployment rates. In contrast, Newfoundland and Labrador and Alberta, which have economies more dependent on oil production, underperformed the national average in terms of both job creation and unemployment during the reporting period.Footnote 35
Employment growth was at or above the national average in Prince Edward Island, Ontario, British Columbia, Quebec, as well as Yukon in FY1920* (consult table 1). Conversely, the Northwest Territories saw a decline in employment over the same period. The remaining provinces and territories posted relatively small increases over the reporting period.
However, all provinces experienced a drop in employment in March 2020 related to the COVID-19 pandemic. Relative job losses during that month were the largest in Quebec (-6.0%), Nova Scotia (‑5.6%), Ontario (-5.2%), and British Columbia (-5.1%) (consult table 1). The impact of the COVID-19 crisis on employment continued to be felt in April 2020 as most of the measures taken by various jurisdictions to protect public health continued to be in effect. Employment started to rebound in most provinces in May 2020 with the gradual easing of restrictions and re-opening of the economies.
| Province or territory | Change in labour force FY1819* to FY1920* |
Labour force participation rate (%) FY1920* | Change in employment FY1819* to FY1920* |
Change in employment February to March 2020† |
|---|---|---|---|---|
| Newfoundland and Labrador | -1.2% | 57.8% | +0.1% | -2.8% |
| Prince Edward Island | +3.1% | 66.8% | +4.3% | -3.9% |
| Nova Scotia | +2.2% | 61.9% | +2.0% | -5.6% |
| New Brunswick | +0.7% | 61.1% | +0.7% | -4.5% |
| Quebec | +1.7% | 64.9% | +2.1% | -6.0% |
| Ontario | +2.6% | 64.9% | +2.9% | -5.2% |
| Manitoba | 0.0% | 66.5% | +0.7% | -4.0% |
| Saskatchewan | +1.1% | 68.5% | +1.7% | -3.8% |
| Alberta | +0.8% | 70.7% | +0.5% | -4.6% |
| British Columbia | +2.2% | 65.7% | +2.2% | -5.1% |
| Yukon | +3.0% | 76.1% | +2.3% | not available† |
| Northwest Territories | 0.0% | 72.6% | -1.7% | not available† |
| Nunavut | -2.0% | 61.9% | +0.3% | not available† |
| Canada | +1.9% | 65.6% | +2.1% | -5.2% |
- Note: Figures for Canada’s labour force, participation rate and employment exclude the territories. Percentage change is based on unrounded numbers.
- † Comparable month-over-month differences are not available for the territories because their data are based on three-month moving average.
- Sources: Statistics Canada; Labour Force Survey, Table 14-10-0287-01 and 14-10-0292-01, seasonally adjusted data.
In FY1920*, the unemployment rate decreased or remained unchanged in 9 jurisdictions compared to FY1819*, while it increased in 4 regions (consult table 2). Nunavut and Newfoundland and Labrador registered the largest declines in the unemployment rate, which reflected stronger drops in the labour force than changes in employment in both jurisdictions. In comparison, the decreases in unemployment rates in the other regions were all associated with a stronger growth in employment than in labour force.
Similarly, the increases in unemployment rates in Nova Scotia, Alberta and Yukon resulted from a higher boost in labour force than in employment. In contrast, the increase in unemployment rate in Northwest Territories was associated with a decline in employment.
Among the provinces, British Columbia continued to record the lowest unemployment rate (4.8%) for the fourth consecutive year in FY1920*, despite posting no change compared to FY1819* (consult table 2). Quebec, Manitoba, Ontario and Saskatchewan also posted unemployment rates at or below the national average. The unemployment rate in Alberta increased to 7.1%, well above the level observed prior to the downturn in crude oil prices in FY1415. That said, Alberta continued to record the highest labour force participation rate among the provinces. The Atlantic provinces still had much higher unemployment rates than the national average. In the territories, Yukon registered the lowest unemployment rate, whereas Nunavut posted the highest.
| Province or territory | Unemployment rate FY1819* |
Unemployment rate FY1920* |
Change in unemployment rate (% points) FY1819* to FY1920* |
Unemployment rate March 2020 |
Change in unemployment rate (% points) February to March 2020† |
|---|---|---|---|---|---|
| Newfoundland and Labrador | 13.5% | 12.3% | -1.2 | 11.6% | -0.8 |
| Prince Edward Island | 9.3% | 8.2% | -1.1 | 8.9% | +0.9 |
| Nova Scotia | 7.4% | 7.6% | +0.2 | 9.4% | +1.4 |
| New Brunswick | 8.0% | 8.0% | 0.0 | 9.1% | +1.8 |
| Quebec | 5.4% | 5.0% | -0.4 | 8.2% | +3.7 |
| Ontario | 5.8% | 5.5% | -0.2 | 7.4% | +1.9 |
| Manitoba | 5.9% | 5.3% | -0.6 | 6.7% | +1.6 |
| Saskatchewan | 6.2% | 5.7% | -0.5 | 7.4% | +1.1 |
| Alberta | 6.8% | 7.1% | +0.3 | 9.1% | +1.6 |
| British Columbia | 4.8% | 4.8% | 0.0 | 7.2% | +2.1 |
| Yukon | 3.2% | 3.6% | +0.4 | 3.4% | not available† |
| Northwest Territories | 6.7% | 8.0% | +1.4 | 8.5% | not available† |
| Nunavut | 14.5% | 13.0% | -1.6 | 15.6% | not available† |
| Canada | 5.9% | 5.7% | -0.2 | 7.9% | +2.2 |
- Note: Figures for Canada’s unemployment rate exclude the territories. Percentage change is based on unrounded numbers.
- † Comparable month-over-month differences are not available for the territories because their data are based on three-month moving average.
- Sources: Statistics Canada, Labour Force Survey, Table 14-10-0287-01 and 14-10-0292-01, seasonally adjusted data.
Because of the notable slowdown in economic activity in March 2020, the unemployment rate rose in most provinces from February to March 2020. The increases ranged from +0.9 percentage points in Prince Edward Island to +3.7 percentage points in Quebec. Unemployment rates generally continued to increase in April and May 2020, and then started to decrease at different paces across the provinces over the following months.
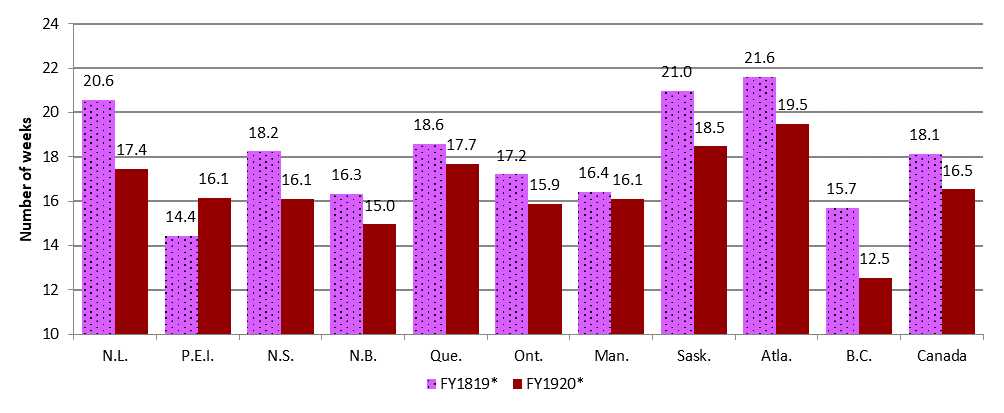
As opposed to the contrasting regional evolution of unemployment rates, the average duration of unemployment spells went down in all provinces in FY1920*, with the exception of Prince Edward Island (consult chart 5). For the fourth consecutive year, Alberta posted the highest average unemployment duration (19.5 weeks), while the lowest was observed in British Columbia (12.5 weeks). As explained by the substantial inflow of unemployed individuals due to the COVID-19 crisis, the average unemployment duration decreased in almost all provinces in March 2020.Footnote 36
Text description of chart 5
| Province | FY1819* | FY1920* |
|---|---|---|
| Newfoundland and Labrador | 20.6 | 17.4 |
| Prince Edward Island | 14.4 | 16.1 |
| Nova Scotia | 18.2 | 16.1 |
| New Brunswick | 16.3 | 15.0 |
| Quebec | 18.6 | 17.7 |
| Ontario | 17.2 | 15.9 |
| Manitoba | 16.4 | 16.1 |
| Saskatchewan | 21.0 | 18.5 |
| Alberta | 21.6 | 19.5 |
| British Columbia | 15.7 | 12.5 |
| Canada | 18.1 | 16.5 |
- Note: The average unemployment spells for Canada exclude the territories.
- Sources: Statistics Canada, Labour Force Survey, Table 14-10-0342-01, seasonally adjusted data.
In terms of vacant positions, growth in job vacancies varied greatly across provinces between the first 3 quarters of FY1819 and the same period in FY1920 (consult table 3). Quebec, Newfoundland and Labrador, Nova Scotia and Saskatchewan recorded notable increases in job vacancies and posted a higher job vacancy rate compared to the previous reporting period. Among the provinces, British Columbia and Quebec posted the highest job vacancy rates in the first 3 quarters of FY1920. As these provinces also reported the lowest unemployment rates, data suggest that they had the tightest labour markets across Canada over the reporting period. This was also reflected in the unemployment-to-vacancy (UV) ratio, as British Columbia and Quebec had the lowest UV ratios (1.3 and 1.6, respectively) in the country during this period.
| Province | Change in job vacancies First 3 quarters - FY1819 to FY1920 |
Job vacancy rate (%) First 3 quarters of FY1920 |
Unemployment-to-vacancy ratio First 3 quarters of FY1920 |
|---|---|---|---|
| Newfoundland and Labrador | +14.0% | 2.3 | 6.4 |
| Prince Edward Island | -13.3% | 3.2 | 3.1 |
| Nova Scotia | +11.0% | 3.1 | 2.9 |
| New Brunswick | +0.4% | 3.1 | 3.0 |
| Quebec | +14.8% | 3.6 | 1.6 |
| Ontario | -3.2% | 3.1 | 2.1 |
| Manitoba | +0.9% | 2.6 | 2.4 |
| Saskatchewan | +6.5% | 2.3 | 3.0 |
| Alberta | -8.8% | 2.6 | 3.2 |
| British Columbia | -5.1% | 4.3 | 1.3 |
| Canada | +0.5% | 3.3 | 2.0 |
- Note: Figures for Canada’s job vacancy growth, job vacancy rate and unemployment-to-job vacancy ratio include all provinces and territories. Percentage change is based on unrounded numbers.
- Sources: Statistics Canada, Labour Force Survey, Table 14-10-0287-01, seasonally unadjusted data (for data on unemployment) and Statistics Canada, Job Vacancy and Wage Survey, Table 14-10-0325-01, seasonally unadjusted data (for data on job vacancies).
In comparison, Ontario had a UV ratio of 2.1 in the reporting period, indicating that labour market tightness in this province was more in line with the national average (2.0). All other provinces registered UV ratios above the national average, suggesting some labour market slack relative to the Canadian average.
Regarding weekly hours worked, Saskatchewan, Alberta and most Atlantic provinces generally recorded higher actual hours worked than the Canadian average in FY1920* (consult table 4).Footnote 37 Conversely, those worked in Quebec and British Columbia were lower on average. The number of hours worked is a key eligibility criterion of the EI program. In general, provinces with above-average number of hours worked record high EI eligibility rates (see subsection 2.2.2). However, eligibility to the EI program is sensitive to economic and employment conditions in a given region, and could also vary within a province.
All jurisdictions experienced an increase in their average nominal weekly earnings in FY1920* compared to the previous reporting period (consult table 4). In real terms, they also all recorded a greater rise in weekly earnings relative to the increase in the consumer price index, except for Manitoba.Footnote 38 This generally indicates an increase in the purchasing power of workers in those jurisdictions in FY1920*.Footnote 39
| Province or territory | Average weekly hours worked‡ FY1920* |
Average nominal weekly earnings ($)† FY1920* |
Change in nominal weekly earnings (%) FY1819* to FY1920* |
Change in consumer price index (%) FY1819* to FY1920* |
|---|---|---|---|---|
| Newfoundland and Labrador | 34.0 | 1,064 | +2.4% | +1.3% |
| Prince Edward Island | 34.5 | 873 | +3.7% | +1.6% |
| Nova Scotia | 32.9 | 913 | +4.1% | +1.9% |
| New Brunswick | 34.0 | 949 | +3.7% | +2.0% |
| Quebec | 31.8 | 974 | +3.9% | +2.3% |
| Ontario | 33.1 | 1,056 | +3.1% | +2.0% |
| Manitoba | 33.2 | 953 | +1.2% | +2.4% |
| Saskatchewan | 34.0 | 1,046 | +3.1% | +1.9% |
| Alberta | 33.8 | 1,171 | +2.3% | +1.9% |
| British Columbia | 32.1 | 1,008 | +3.8% | +2.3% |
| Yukon | not available | 1,173 | +3.7% | +2.5% |
| Northwest Territories | not available | 1,469 | +3.4% | +1.9% |
| Nunavut | not available | 1,466 | +5.7% | +1.7% |
| Canada | 32.8 | 1,036 | +3.2% | +2.1% |
- † Earnings include overtime and apply to employees paid by the hour, salaried employees and other employees.
- ‡ Average hours worked per week reflects the number of hours actually worked in the reference week of the Labour Force Survey at all jobs.
- Sources: Statistics Canada, Labour Force Survey, Table 14-10-0042-01, seasonally unadjusted data (for data on hours worked), Statistics Canada, Survey of Employment, Payrolls and Hours, Table 14-10-0203-01, seasonally unadjusted data (for data on nominal earnings), and Statistics Canada, Consumer Price Index Measures, Table 18-10-0004-01 (for data on CPI).
1.2.2 Interprovincial mobility trends
A substantial number of people in Canada relocate across provincial and territorial borders each year. Between July 1, 2019 and June 30, 2020, an estimated 278,000 individuals relocated within Canada. Several factors can influence an individual’s decision to move across provinces and territories, including but not limited to, job opportunities, education/school or family reasons. Interprovincial mobility attributable to emerging employment opportunities or declines in labour demand gives workers the possibility to access labour markets in other jurisdictions and find a job that may be better suited for their particular skillset. From a national perspective, interprovincial mobility can increase real GDP and aggregate labour productivity growth. It can also improve individual outcomes in terms of finding suitable employment. This occurs when workers from provinces with high unemployment and an excess of labour supply move to provinces with lower unemployment and labour shortages.
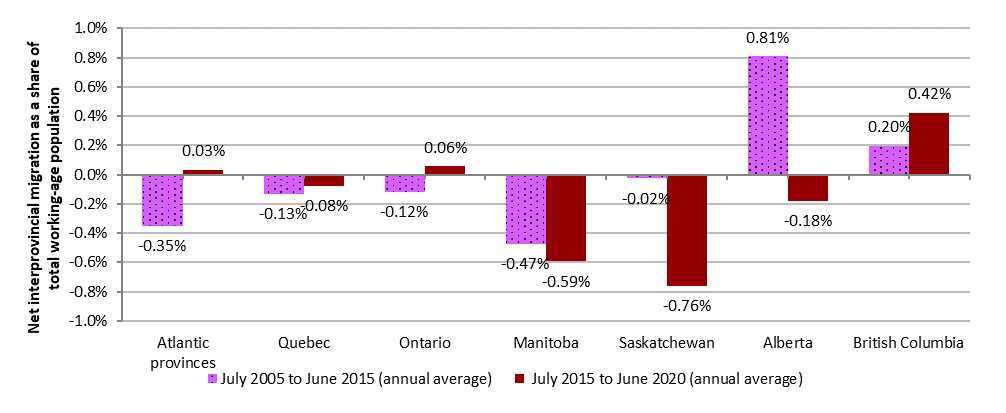
Since the mid-1990s, Western Canada, in particular Alberta, was the destination of choice for a majority of working-age Canadian interprovincial migrants (aged 15 to 64 years). However, with the downturn in crude oil prices in FY1415 and less favourable labour market conditions in Alberta, trends have somewhat shifted to Ontario and British Columbia in recent years. In Alberta, the net migration was on average 21,400 each year from July 2005 to June 2015 (representing 0.81% of its working-age population) (consult chart 6). This trend has reversed since July 2015, with a net migration of -5,200 on average per year or ‑0.18% of the working-age population in that province. Saskatchewan, another oil-producing province, also recorded a substantial negative average annual net migration since July 2015. Conversely, labour market developments in Ontario and British Columbia have made these provinces the preferred destination of interprovincial migrants since July 2015 (+5,500 and +14,400 of net migration on average per year, respectively).
Text description of chart 6
| Region | July 2005 to June 2015 (annual average) | July 2015 to June 2020 (annual average) |
|---|---|---|
| Atlantic provinces | -0.35% | 0.03% |
| Quebec | -0.13% | -0.08% |
| Ontario | -0.12% | 0.06% |
| Manitoba | -0.47% | -0.59% |
| Saskatchewan | -0.02% | -0.76% |
| Alberta | 0.81% | -0.18% |
| British Columbia | 0.20% | 0.42% |
- Note: Annual is defined as the period from July 1 to June 30.
- P Preliminary data for July 1, 2019 to June 30, 2020.
- Source: Statistics Canada, Table 17-10-0015-01 (for interprovincial migration) and 17-10-0005-01 (for population estimates).
1.3 Composition of the unemployed population
Along with the developments observed in the last year, the Canadian labour market is characterised by long-term demographic and economic trends that have reshaped its labour force over the past 40 years. For instance, population aging and the increase in women’s labour market participation have affected the labour supply. During the same period, the demand for skilled workers and the growing share of employment in services-producing industries have changed the labour demand. This section highlights how the unemployed population has evolved over the past decades as a result of those changes and of economic cycles.Footnote 40
As mentioned in the previous sections, the Canadian labour market experienced a shock caused by the COVID-19 pandemic at the end of FY1920, which continued to be felt in FY2021. The composition of the unemployed population was affected by this situation starting in mid-March 2020. However, those effects are not apparent in this section, as it covers a predating period from FY7677 to FY1920. For a first glance at those effects, consult the box titled Changes in the composition of the unemployed population in 2020.
Unemployment can result from temporary transitions in employment. This includes, for instance, new people who are entering the workforce, anyone who moves to find work in a different city, or people who quit their jobs to find other work. This frictional unemployment is usually present in an economic system because some people are always searching for new jobs. Unemployment can also result from a mismatch between the skills of job seekers and available jobs or from persistent shifts in the economy caused, for example, by technological changes. This type of structural unemployment is more likely to be of longer duration. Unemployment can also be cyclical as the result of a general decline in production and economic activity, leading sometimes to recessions.
Fluctuations in the age and gender composition of the labour force over time have greatly affected the profile of the unemployed population. Changes in social norms regarding gender roles, public policies such as affordable public day cares and educational attainment are key factors that have contributed to the increase in women’s labour market participation.Footnote 41 The participation rate of women has increased by 15.2 percentage points since FY7677, to reach 61.1% in FY1920. However, it remained below the participation rate for men (69.9%) in FY1920.
Chart 7 presents the distribution of the labour force (solid lines) and of the unemployed population (dotted lines) by gender. Its shows that the shares of men in the labour force and the unemployed population were constantly higher than that of women over the period examined. However, starting in the 1990s, women began to account for a smaller portion of the unemployed population than their weight in the labour force (illustrated by the dotted line below the solid line), while the situation reversed for men.
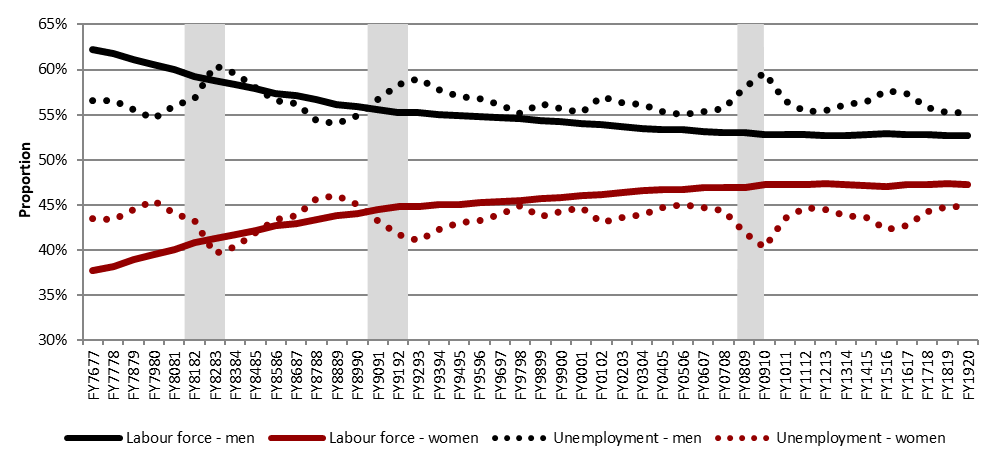
Text description of chart 7
| Fiscal year | Labour force - men | Labour force - women | Unemployment - men | Unemployment - women |
|---|---|---|---|---|
| FY7677 | 62.3% | 37.7% | 56.6% | 43.4% |
| FY7778 | 61.8% | 38.2% | 56.6% | 43.4% |
| FY7879 | 61.1% | 38.9% | 55.6% | 44.4% |
| FY7980 | 60.5% | 39.5% | 54.5% | 45.5% |
| FY8081 | 60.0% | 40.0% | 56.0% | 44.0% |
| FY8182 | 59.2% | 40.8% | 56.8% | 43.2% |
| FY8283 | 58.8% | 41.2% | 60.4% | 39.6% |
| FY8384 | 58.3% | 41.7% | 59.6% | 40.4% |
| FY8485 | 57.9% | 42.1% | 58.0% | 42.0% |
| FY8586 | 57.3% | 42.7% | 56.6% | 43.4% |
| FY8687 | 57.1% | 42.9% | 56.2% | 43.8% |
| FY8788 | 56.7% | 43.3% | 54.4% | 45.6% |
| FY8889 | 56.2% | 43.8% | 54.0% | 46.0% |
| FY8990 | 55.9% | 44.1% | 54.9% | 45.1% |
| FY9091 | 55.5% | 44.5% | 56.7% | 43.3% |
| FY9192 | 55.2% | 44.8% | 58.3% | 41.7% |
| FY9293 | 55.2% | 44.8% | 59.0% | 41.0% |
| FY9394 | 55.0% | 45.0% | 57.8% | 42.2% |
| FY9495 | 54.9% | 45.1% | 57.0% | 43.0% |
| FY9596 | 54.8% | 45.2% | 56.8% | 43.2% |
| FY9697 | 54.7% | 45.3% | 56.1% | 43.9% |
| FY9798 | 54.6% | 45.4% | 55.1% | 44.9% |
| FY9899 | 54.3% | 45.7% | 56.3% | 43.7% |
| FY9900 | 54.2% | 45.8% | 55.7% | 44.3% |
| FY0001 | 54.0% | 46.0% | 55.3% | 44.7% |
| FY0102 | 53.9% | 46.1% | 57.0% | 43.0% |
| FY0203 | 53.6% | 46.4% | 56.4% | 43.6% |
| FY0304 | 53.4% | 46.6% | 56.1% | 43.9% |
| FY0405 | 53.3% | 46.7% | 55.3% | 44.7% |
| FY0506 | 53.3% | 46.7% | 55.0% | 45.0% |
| FY0607 | 53.1% | 46.9% | 55.3% | 44.7% |
| FY0708 | 53.1% | 46.9% | 55.7% | 44.3% |
| FY0809 | 53.0% | 47.0% | 58.1% | 41.9% |
| FY0910 | 52.8% | 47.2% | 59.7% | 40.3% |
| FY1011 | 52.7% | 47.3% | 56.5% | 43.5% |
| FY1112 | 52.8% | 47.2% | 55.3% | 44.7% |
| FY1213 | 52.7% | 47.3% | 55.5% | 44.5% |
| FY1314 | 52.7% | 47.3% | 56.2% | 43.8% |
| FY1415 | 52.8% | 47.2% | 56.4% | 43.6% |
| FY1516 | 52.9% | 47.1% | 57.7% | 42.3% |
| FY1617 | 52.8% | 47.2% | 57.3% | 42.7% |
| FY1718 | 52.8% | 47.2% | 55.7% | 44.3% |
| FY1819 | 52.7% | 47.3% | 55.2% | 44.8% |
| FY1920 | 52.7% | 47.3% | 55.2% | 44.8% |
- Note: Shaded area(s) corresponds to recessionary period(s) in Canada's economy.
- Source: Statistics Canada, Labour Force Survey, Table 14-10-0287-01, seasonally unadjusted data.
The difference between the proportion of a group in the unemployed population relative to its share in the labour force can be expressed by an unemployed/labour force ratio. A ratio higher than 1.0 means that the underlying group is overrepresented among the unemployed population compared to its weight in the labour force. On the other hand, a ratio lower than 1.0 indicates that the group is underrepresented. Since FY9091, the average ratio for women was 0.94, while it was 1.05 for men.
Changes in the composition of the unemployed population in 2020
The number of unemployed individuals jumped by 127.8% between February and May 2020, to reach 2.6 million in May. In December, the level of unemployment stood at 1.8 million, still 54.8% higher than its pre-COVID-19 level in February. In addition to its impact on the unemployment level, the COVID-19 crisis also affected the composition of the unemployed population.
In general, women were more impacted by the COVID-19 crisis than men. At the onset of the crisis, women became overrepresented in the unemployed population compared to their share in the labour force. Their average unemployed/labour force ratio went above 1.0 from March to June 2020. This can be partly attributable to the fact that a greater proportion of women than men work in part-time jobs and in services-producing industries, where employment declined significantly during that period. The relative weight of women in the unemployed population went back to its pre-COVID-19 level afterwards, as more public health restrictions were lifted and more businesses and workplaces continued to re-open (consult the table below).
Youth aged 15 to 24 years were also disproportionally affected by the COVID-19 crisis, notably because they are more likely to work in hard-hit sectors such as the Accommodation and food services industry. As shown in the table below, this age group was already overrepresented in the unemployed population prior to the arrival of COVID-19. This situation was further amplified in the summer months when students entered the labour market.
The largest employment declines due to the COVID-19 were generally recorded in industries which involve public-facing activities or limited ability to work from home. For example, in the Accommodation and food services industry and the Information, culture and recreation industry. As such, the unemployed/labour force ratio of former employees from the services-producing industries increased during the COVID-19 crisis, while the ratio of those from the goods-producing industries decreased.
| Category | January 2020 | April 2020 | July 2020 | October 2020 |
|---|---|---|---|---|
| Men | 1.03 | 0.97 | 1.04 | 1.04 |
| Women | 0.96 | 1.04 | 0.95 | 0.96 |
| 15 to 24 years old | 1.85 | 2.08 | 2.19 | 2.05 |
| 25 to 54 years old | 0.86 | 0.84 | 0.80 | 0.80 |
| 55 years old and over | 0.85 | 0.85 | 0.80 | 0.89 |
| Goods-producing industries | 1.46 | 1.13 | 1.07 | 1.11 |
| Services-producing industries | 0.88 | 0.97 | 0.98 | 0.97 |
- † Excludes the category unclassified industries.
- Source: Statistics Canada, Labour Force Survey, Tables 14-10-0287-01 and 14-10-0291-01, seasonally adjusted data.
Meanwhile, Canada’s population has experienced a sizeable increase in the median age, going from 27.7 years in 1976 to 40.9 years in 2020.Footnote 42 Population aging, in part driven by lower fertility rates and longer life expectancies, has affected the supply of labour, notably by changing the distribution of the workforce across different age groups. For instance, the share of individuals aged 55 years old and over in the labour force went up from 11.3% in FY7677 to 21.6% in FY1920. The proportion of youth aged 15 to 24 years in the labour force decreased from 27.6% to 14.3% over the same period.
The distribution of the unemployed population by age group over time followed somewhat similar trajectories to those of the labour force. However, the relative weight of youth aged 15 to 24 years in the unemployed population did not decline as much as in the labour force. This is indicated in chart 8 by the increasing unemployed/labour force ratio of youth, notably at the end of the 1990s. Moreover, the proportion of youth in the unemployed population was nearly twice their share of the labour force in FY1920.
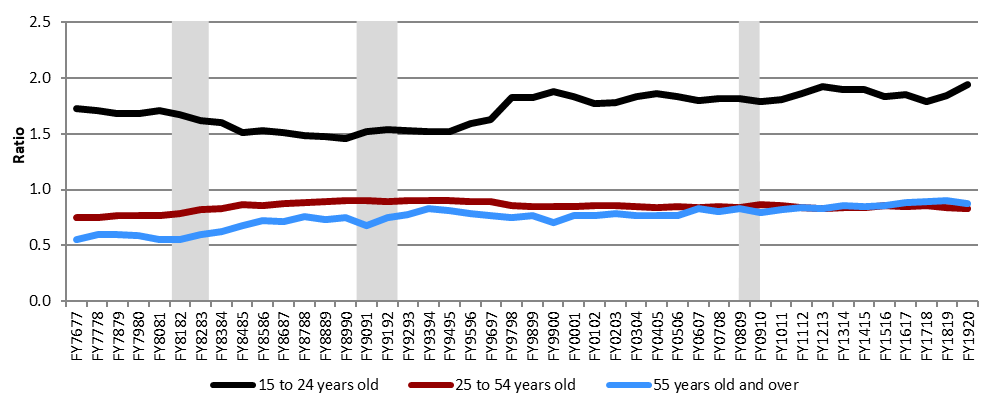
Text description of chart 8
| Fiscal year | 15 to 24 years old | 25 to 54 years old | 55 years old and over |
|---|---|---|---|
| FY7677 | 1.73 | 0.75 | 0.55 |
| FY7778 | 1.71 | 0.75 | 0.60 |
| FY7879 | 1.68 | 0.77 | 0.60 |
| FY7980 | 1.68 | 0.77 | 0.59 |
| FY8081 | 1.71 | 0.76 | 0.56 |
| FY8182 | 1.67 | 0.79 | 0.56 |
| FY8283 | 1.62 | 0.82 | 0.60 |
| FY8384 | 1.60 | 0.83 | 0.63 |
| FY8485 | 1.51 | 0.87 | 0.68 |
| FY8586 | 1.53 | 0.86 | 0.72 |
| FY8687 | 1.51 | 0.87 | 0.71 |
| FY8788 | 1.48 | 0.88 | 0.76 |
| FY8889 | 1.48 | 0.89 | 0.74 |
| FY8990 | 1.46 | 0.90 | 0.75 |
| FY9091 | 1.52 | 0.90 | 0.68 |
| FY9192 | 1.53 | 0.90 | 0.75 |
| FY9293 | 1.53 | 0.90 | 0.78 |
| FY9394 | 1.52 | 0.90 | 0.83 |
| FY9495 | 1.52 | 0.90 | 0.82 |
| FY9596 | 1.59 | 0.89 | 0.78 |
| FY9697 | 1.62 | 0.89 | 0.77 |
| FY9798 | 1.82 | 0.85 | 0.75 |
| FY9899 | 1.82 | 0.85 | 0.77 |
| FY9900 | 1.88 | 0.84 | 0.70 |
| FY0001 | 1.83 | 0.84 | 0.76 |
| FY0102 | 1.77 | 0.86 | 0.76 |
| FY0203 | 1.78 | 0.85 | 0.78 |
| FY0304 | 1.83 | 0.85 | 0.77 |
| FY0405 | 1.86 | 0.84 | 0.77 |
| FY0506 | 1.83 | 0.85 | 0.77 |
| FY0607 | 1.80 | 0.84 | 0.83 |
| FY0708 | 1.82 | 0.84 | 0.81 |
| FY0809 | 1.81 | 0.84 | 0.83 |
| FY0910 | 1.79 | 0.86 | 0.79 |
| FY1011 | 1.80 | 0.86 | 0.82 |
| FY1112 | 1.86 | 0.84 | 0.84 |
| FY1213 | 1.92 | 0.83 | 0.83 |
| FY1314 | 1.89 | 0.84 | 0.86 |
| FY1415 | 1.90 | 0.84 | 0.85 |
| FY1516 | 1.83 | 0.86 | 0.86 |
| FY1617 | 1.85 | 0.85 | 0.88 |
| FY1718 | 1.79 | 0.86 | 0.90 |
| FY1819 | 1.84 | 0.84 | 0.90 |
| FY1920 | 1.94 | 0.83 | 0.87 |
- Note: Shaded area(s) corresponds to recessionary period(s) in Canada's economy.
- Source: Statistics Canada, Labour Force Survey, Table 14-10-0287-01, seasonally unadjusted data.
The unemployment rate of youth aged 15 to 24 years has historically been much higher than that for older age groups. In FY1920, it was 11.4% compared to 4.9% for individuals aged 25 to 54 years and 5.1% for individuals aged 55 years and over. Youth’s overrepresentation in unemployment can partly be explained by their inherent lack of work experience and/or educational attainment, and by their greater employment and unemployment dynamics.Footnote 43
From an EI perspective, the share of youth aged 15 to 24 years among EI regular benefit claimants (9.0%) was closer to their share in the labour force (14.3%) than in the unemployed population (27.8%) in FY1920. Unemployed youth are usually less covered by, and eligible to, EI regular benefits. This is because they are more likely to have never worked, left their job to return to school or had not accumulated enough hours of insurable employment to qualify for EI regular benefits (consult subsection 2.2.2).
As for individuals aged 55 years and over, they were underrepresented in the unemployed population relative to their share of the labour force. Their unemployed/labour force ratio was below 1.0 for the whole period (consult chart 8). On the other hand, their ratio gradually increased to equal, in the 2010s, those of individuals aged 25 to 54 years. Older individuals might face particular challenges when looking for work. For example, they are generally less-educated and less likely to have recently attended school or taken job-related training than their younger counterparts.Footnote 44 In terms of EI, the share of regular benefit claims established by claimants aged 55 years and over has increased slowly but steadily over the past several years (consult subsection 2.2.1), such as their share in unemployment.
Individuals aged 25 to 54 years, for their part, experienced a fairly constant relationship in their share of unemployment relative to their share of the labour force. They posted an average ratio of 0.85 for the overall period examined (consult chart 8).
Along with demographic shifts, Canada, as other advanced economies, has been marked by ongoing technological change and globalisation over the past decades. These have increased the demand for high-skilled workers or workers with higher educational attainment.Footnote 45 As a result, the composition of the labour force by educational attainment has changed significantly over the years. The share of the labour force aged 25 years and over holding a university degree more than doubled between FY9091 and FY1920 (from 16.2% to 35.2%). Conversely, the proportion having a high school diploma or less declined by almost half (from 55.9% to 27.1%) over the same period.Footnote 46
The composition of the unemployed population aged 25 years and over by educational attainment followed similar trends as those observed in the labour force. As shown in chart 9, the unemployed/labour force ratio for the 3 lowest levels of educational attainment either stayed unchanged or rose slightly from FY9091 to FY1920. In comparison, the ratio for university graduates recorded a stronger increase over the period examined. This rise may be partly attributable to the fact that university graduates generally have specialized skills and knowledge that are not always easily transferable to jobs outside their field of study.
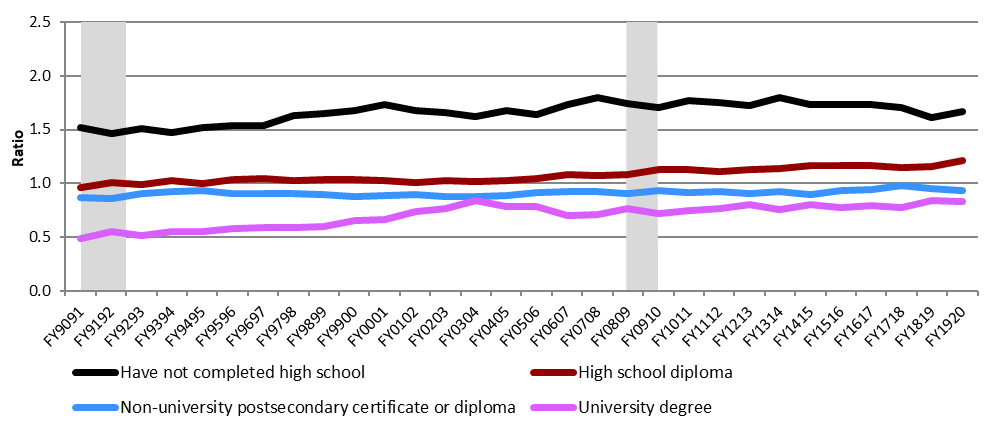
Text description of chart 9
| Fiscal year | Have not completed high school | High school diploma | Non-university postsecondary certificate or diploma | University graduate |
|---|---|---|---|---|
| FY9091 | 1.52 | 0.96 | 0.87 | 0.49 |
| FY9192 | 1.46 | 1.00 | 0.86 | 0.55 |
| FY9293 | 1.51 | 0.99 | 0.90 | 0.51 |
| FY9394 | 1.47 | 1.02 | 0.92 | 0.55 |
| FY9495 | 1.52 | 0.99 | 0.94 | 0.56 |
| FY9596 | 1.54 | 1.03 | 0.91 | 0.58 |
| FY9697 | 1.54 | 1.04 | 0.91 | 0.59 |
| FY9798 | 1.63 | 1.02 | 0.91 | 0.59 |
| FY9899 | 1.65 | 1.04 | 0.89 | 0.60 |
| FY9900 | 1.68 | 1.03 | 0.88 | 0.65 |
| FY0001 | 1.73 | 1.02 | 0.88 | 0.66 |
| FY0102 | 1.67 | 1.01 | 0.90 | 0.73 |
| FY0203 | 1.66 | 1.03 | 0.88 | 0.77 |
| FY0304 | 1.62 | 1.01 | 0.87 | 0.84 |
| FY0405 | 1.68 | 1.02 | 0.89 | 0.78 |
| FY0506 | 1.64 | 1.04 | 0.92 | 0.78 |
| FY0607 | 1.73 | 1.08 | 0.93 | 0.70 |
| FY0708 | 1.80 | 1.07 | 0.93 | 0.71 |
| FY0809 | 1.74 | 1.08 | 0.91 | 0.76 |
| FY0910 | 1.70 | 1.12 | 0.93 | 0.72 |
| FY1011 | 1.77 | 1.12 | 0.92 | 0.75 |
| FY1112 | 1.75 | 1.11 | 0.92 | 0.76 |
| FY1213 | 1.72 | 1.13 | 0.90 | 0.80 |
| FY1314 | 1.80 | 1.13 | 0.93 | 0.76 |
| FY1415 | 1.73 | 1.17 | 0.90 | 0.80 |
| FY1516 | 1.74 | 1.17 | 0.94 | 0.78 |
| FY1617 | 1.73 | 1.16 | 0.94 | 0.79 |
| FY1718 | 1.71 | 1.15 | 0.98 | 0.77 |
| FY1819 | 1.61 | 1.15 | 0.95 | 0.84 |
| FY1920 | 1.67 | 1.22 | 0.93 | 0.83 |
- Note: Shaded area(s) corresponds to recessionary period(s) in Canada's economy.
- Source: Statistics Canada, Labour Force Survey, Table 14-10-0019-01, seasonally unadjusted data.
Nevertheless, university graduates aged 25 years and over still presented a lower unemployment rate in FY1920 (4.1%) when compared with non-university postsecondary graduates (4.6%), high school graduates (6.0%) or those who have not graduated high school (8.2%). Moreover, the latter 2 groups were overrepresented in the unemployed population compared to their weight in the labour force. This is shown in chart 9 by their respective ratio higher than 1.0. This may be partly explained by the fact that, in recent years, individuals with lower educational attainment are generally older and tend to work in industries with more temporary employment. They are also more likely to be affected by less favorable labour market conditions.
In addition to the rising demand for high-skilled workers, the services-producing industries have been growing in importance between FY7677 and FY1920. They recorded an average annual employment growth of +2.0% compared to +0.4% for the goods-producing industries. As presented in chart 10, using a four-year average unemployed/labour force ratio for 3 different periods, unemployed individuals who previously worked in the goods-producing industries were overrepresented in the unemployed population for the overall period examined (as shown by the ratios higher than 1.0). In contrast, those who had worked in the services-producing industries were underrepresented. Moreover, the relative proportion among the unemployed population of former employees of the goods-producing industries gradually increased over time, while the one of the services-producing industries remained stable.Footnote 47
Chart 10 also shows that the overrepresentation or underrepresentation status of an industry in the unemployed population relative to its share of the labour force was usually steady over time. However, a few industries changed status over the period examined. For instance, at the end of the 1970s, workers from the Agriculture industry were underrepresented in the unemployed population (as shown by the ratio lower than 1.0). This situation was reversed at the end of the 1990s, which may be attributable, in part, to the shift away from family farms toward larger farms with non-family employees. The Information, culture and recreation industry and Other services industry also registered changes in their status over time.
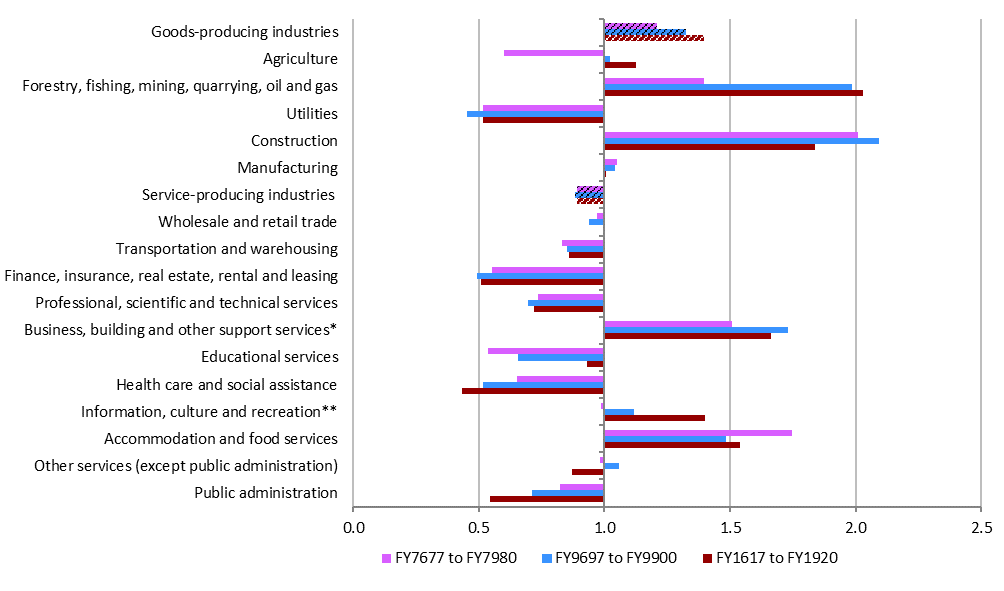
Text description of chart 10
| Industry | FY7677 to FY7980 | FY9697 to FY9900 | FY1617 to FY1920 |
|---|---|---|---|
| Goods-producing industries | 1.21 | 1.32 | 1.39 |
| Agriculture | 0.60 | 1.02 | 1.13 |
| Forestry, fishing, mining, quarrying, oil and gas | 1.40 | 1.98 | 2.03 |
| Utilities | 0.52 | 0.45 | 0.52 |
| Construction | 2.01 | 2.09 | 1.84 |
| Manufacturing | 1.05 | 1.04 | 1.01 |
| Service-producing industries | 0.89 | 0.88 | 0.89 |
| Wholesale and retail trade | 0.97 | 0.94 | 1.00 |
| Transportation and warehousing | 0.83 | 0.85 | 0.86 |
| Finance, insurance, real estate, rental and leasing | 0.55 | 0.49 | 0.51 |
| Professional, scientific and technical services | 0.73 | 0.70 | 0.72 |
| Business, building and other support services | 1.51 | 1.73 | 1.66 |
| Educational services | 0.54 | 0.66 | 0.93 |
| Health care and social assistance | 0.65 | 0.51 | 0.43 |
| Information, culture and recreation | 0.99 | 1.12 | 1.40 |
| Accommodation and food services | 1.75 | 1.48 | 1.54 |
| Other services (except public administration) | 0.98 | 1.06 | 0.87 |
| Public administration | 0.82 | 0.71 | 0.54 |
- * Includes management of companies and enterprises and administrative and support, waste management and remediation services.
- ** Includes information and cultural industries and arts, entertainment and recreation industries.
- Source: Statistics Canada, Labour Force Survey, Table 14-10-0022-01, seasonally unadjusted data.
From an EI perspective, claims established by former workers from the services-producing industries accounted for a smaller share (58.6%) of all EI regular benefit claims compared to the weight of those workers in the unemployed population (71.5%) in FY1920. Conversely, the good-producing industries accounted for a larger share (38.3%) of regular benefit claims versus 28.5% of unemployment in FY1920. The greater representation of the goods-producing industries among EI regular benefit claims relative to their share of unemployment may be partly attributable to the higher proportion of seasonal employment in these industries.
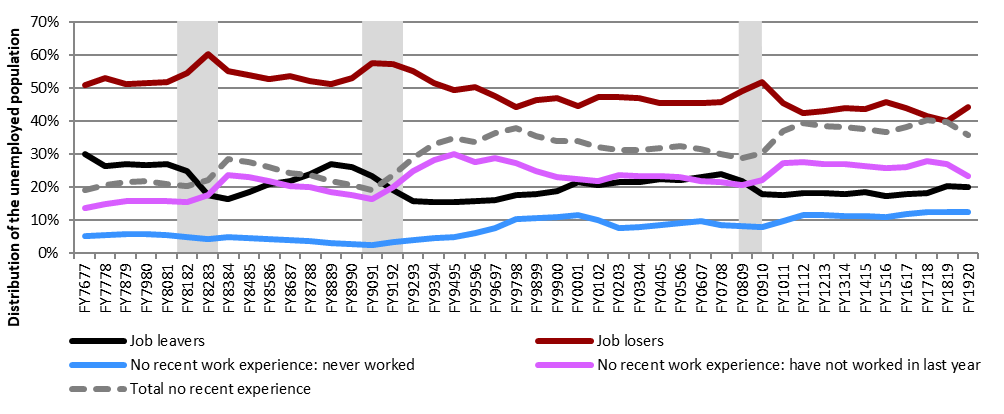
The profile of the unemployed population is also affected by economic cycles. Canada experienced 3 major recessions between 1970 and FY1920: in the early 1980s (1981 to 1982), in the early 1990s (1990 to 1992), and in FY0809 (2008 to 2009). How employment and unemployment changed during those cycles differed across recessions. For instance, employers relied mostly on job cuts to lower their labour inputs in the first 2 recessions, whereas they relied almost equally on shorter workweek and job cuts in the FY0809 recession.Footnote 48 As a result, workers were more likely to be laid-off during the early 1980s and 1990s downturns than in the FY0809 recession.Footnote 49 Permanent layoffs accounted for much of the inflow into unemployment during the first 2 recessions. This is in contrast to the FY0809 recession, where a larger part of the increase in unemployment was due to individuals not previously in the labour force who were looking for jobs.Footnote 50
These differences across cycles are partly reflected in chart 11 that shows the distribution of the unemployed population by the reason of unemployment since FY7677. The share of individuals who became unemployed because they lost their job (job losers) among the unemployed population went up during each recession period, albeit being lower during the FY0809 recession. Conversely, the share of the unemployed population with no recent work experience was higher in the FY0809 downturn than in the previous 2 recessions. As for individuals who were unemployed because they left their job (job leavers), their proportions tend to decline in times of recession.Footnote 51
Text description of chart 11
| Fiscal year | Job leavers | Job losers | No recent work experience: have never worked | No recent work experience: have not worked in the last year | Total - no recent work experience |
|---|---|---|---|---|---|
| FY7677 | 30.1% | 50.9% | 5.3% | 13.7% | 19.0% |
| FY7778 | 26.4% | 53.0% | 5.6% | 15.0% | 20.6% |
| FY7879 | 27.0% | 51.3% | 5.9% | 15.8% | 21.7% |
| FY7980 | 26.7% | 51.5% | 5.9% | 15.9% | 21.8% |
| FY8081 | 27.2% | 51.7% | 5.4% | 15.7% | 21.1% |
| FY8182 | 25.0% | 54.5% | 4.9% | 15.6% | 20.5% |
| FY8283 | 17.6% | 60.3% | 4.3% | 17.7% | 22.1% |
| FY8384 | 16.5% | 55.0% | 4.9% | 23.6% | 28.5% |
| FY8485 | 18.6% | 53.8% | 4.5% | 23.0% | 27.5% |
| FY8586 | 21.1% | 52.8% | 4.2% | 21.9% | 26.1% |
| FY8687 | 21.9% | 53.8% | 4.1% | 20.3% | 24.4% |
| FY8788 | 24.1% | 52.2% | 3.8% | 19.9% | 23.7% |
| FY8889 | 27.0% | 51.2% | 3.2% | 18.6% | 21.8% |
| FY8990 | 26.2% | 53.1% | 2.9% | 17.7% | 20.7% |
| FY9091 | 23.4% | 57.6% | 2.5% | 16.5% | 19.0% |
| FY9192 | 19.1% | 57.3% | 3.4% | 20.2% | 23.6% |
| FY9293 | 15.9% | 55.3% | 4.0% | 24.8% | 28.8% |
| FY9394 | 15.5% | 51.5% | 4.8% | 28.3% | 33.0% |
| FY9495 | 15.7% | 49.4% | 4.9% | 30.0% | 35.0% |
| FY9596 | 15.9% | 50.4% | 6.0% | 27.6% | 33.6% |
| FY9697 | 16.2% | 47.5% | 7.6% | 28.8% | 36.4% |
| FY9798 | 17.7% | 44.4% | 10.5% | 27.4% | 37.9% |
| FY9899 | 18.0% | 46.5% | 10.6% | 24.9% | 35.5% |
| FY9900 | 19.0% | 46.9% | 10.9% | 23.2% | 34.1% |
| FY0001 | 21.5% | 44.4% | 11.5% | 22.6% | 34.1% |
| FY0102 | 20.8% | 47.2% | 10.2% | 21.8% | 32.0% |
| FY0203 | 21.5% | 47.3% | 7.5% | 23.6% | 31.2% |
| FY0304 | 21.7% | 47.0% | 7.9% | 23.4% | 31.2% |
| FY0405 | 22.5% | 45.6% | 8.6% | 23.4% | 32.0% |
| FY0506 | 22.2% | 45.5% | 9.3% | 23.1% | 32.4% |
| FY0607 | 23.0% | 45.5% | 9.7% | 21.8% | 31.5% |
| FY0708 | 24.1% | 45.8% | 8.6% | 21.5% | 30.1% |
| FY0809 | 22.0% | 49.1% | 8.2% | 20.7% | 28.9% |
| FY0910 | 17.9% | 51.8% | 8.0% | 22.3% | 30.3% |
| FY1011 | 17.6% | 45.4% | 9.7% | 27.3% | 37.0% |
| FY1112 | 18.2% | 42.5% | 11.5% | 27.7% | 39.3% |
| FY1213 | 18.4% | 43.0% | 11.6% | 27.1% | 38.6% |
| FY1314 | 17.8% | 43.9% | 11.2% | 27.0% | 38.2% |
| FY1415 | 18.5% | 43.7% | 11.4% | 26.3% | 37.8% |
| FY1516 | 17.4% | 45.7% | 10.9% | 25.9% | 36.8% |
| FY1617 | 17.9% | 43.9% | 12.0% | 26.2% | 38.2% |
| FY1718 | 18.3% | 41.5% | 12.4% | 27.8% | 40.2% |
| FY1819 | 20.4% | 40.0% | 12.6% | 27.0% | 39.6% |
| FY1920 | 20.0% | 44.2% | 12.4% | 23.4% | 35.8% |
- Note: Shaded area(s) corresponds to recessionary period(s) in Canada's economy.
- Source: Statistics Canada, Labour Force Survey, Table 14-10-0125-01, seasonally unadjusted data.
Aside from changes resulting from economic downturns, the profile of the unemployed population has also been modified by shifts in the reasons leading to unemployment over the years. As presented in chart 11, more than half of the individuals who became unemployed at the end of the 1970s and in the 1980s had lost their job (job losers). This proportion slightly decreased afterwards but remained over 40%. Meanwhile, the share of individuals with no recent work experience—those who have not worked in the last year or even for a longer period, or have never worked—among the unemployed population almost doubled over the same period. That share also nearly equaled the proportion of job losers at the end of the 2010s. The growing proportion of unemployed individuals with no recent work experience from the end of the 1970s to the mid-1990s was due to those who have not worked in the last year. However, most of the increase observed from the mid-1990s until the FY0809 recession was due to those looking for their first job. The increased proportion of unemployed individuals with no recent work experience has an impact on the indicators of access and coverage of the EI program measured in subsection 2.2.2.
Altogether, the composition of the unemployed population has been affected by long-term trends in labour supply and labour demand over the past decades. In general, men, youth aged 15 to 24 years, individuals with a high school diploma or less, and former workers from the goods-producing industries have been overrepresented in unemployment during this period. Whereas, the relative weight in the unemployed population of individuals aged 55 years and over, university graduates and individuals with no recent work experience has increased over the years.
1.4 Summary
In FY1920, the Canadian economy was characterized by a low growth in real GDP (+1.4%). This was mainly attributable to the unprecedented government interventions, starting in mid-March 2020, to contain the COVID-19 pandemic. These interventions resulted in a substantial slowdown in economic activity and a sudden shock to the Canadian labour market at the end of the reporting period.
The national labour market recorded a strong performance during most of the FY1920, notably by posting the lowest annual unemployment rate (5.7%) since FY7677. However, as a result of the COVID-19 crisis, employment fell sharply and the unemployment rate jumped in March 2020.
There were important regional variations in labour market conditions during FY1920. The oil-producing provinces (Newfoundland and Labrador and Alberta) continued to be affected by the weakness in crude oil prices. On the other hand, British Columbia, Ontario and Quebec’s economies posted strong overall labour market performances. The impact of the changing economic situation in many of these regions on the EI program is seen in this report.
Finally, over the past decades, long-term demographic and economic trends have reshaped the Canadian labour force, and so, the composition of the unemployed population. Unemployed individuals are now on average older, more educated, and are less likely to have recent work experience. These changes in the unemployed population, together with the recent labour market developments, have affected the EI program.