
Chapter 3: Impact and effectiveness of Employment Benefits and support to workers and employers (Part II of the Employment Insurance Act)
Official Title: Employment Insurance Monitoring and Assessment Report for the fiscal year beginning April 1, 2023 and ending March 31, 2024 – Chapter 3: Impact and effectiveness of Employment Benefits and Support Measures to workers and employers (Part II of the Employment Insurance Act)
On this page
List of abbreviations
This is the complete list of abbreviations for the Employment Insurance Monitoring and Assessment Report for the fiscal year beginning April 1, 2023 and ending March 31, 2024.
- B/C
- Benefits-to-Contributions
- B/U
- Beneficiary-to-Unemployed (rate)
- B/UC
- Beneficiary-to-Unemployed Contributor (rate)
- CAWS
- Client Access Work Station
- CCB
- Compassionate Care Benefits
- CCDA
- Canadian Council of Directors of Apprenticeship
- CCIS
- Corporate Client Information Service
- CEEDD
- Canadian Employer-Employee Dynamics Database
- CEGEP
- College of General and Professional Teaching
- CEIC
- Canada Employment Insurance Commission
- CEIFB
- Canada Employment Insurance Financing Board
- CERB
- Canada Emergency Response Benefit
- CF
- Canadian Forces
- CFP
- Call for Proposals
- CPI
- Consumer Price Index
- CPP
- Canada Pension Plan
- CRA
- Canada Revenue Agency
- CRF
- Consolidated Revenue Fund
- EAS
- Employment Assistance Services
- EBSM
- Employment Benefits and Support Measures
- EDI
- Equity, Diversity and Inclusion
- EI
- Employment Insurance
- EI-ERB
- Employment Insurance Emergency Response Benefit
- EIACC
- Employment Insurance Appeals Consultative Committee
- EICS
- Employment Insurance Coverage Survey
- eROE
- Electronic Record of Employment
- ESDC
- Employment and Social Development Canada
- FS
- Family Supplement
- G7
- Group of Seven
- GC
- Government of Canada
- GDP
- Gross Domestic Product
- HR
- Human Resources
- IC
- Individual Counselling
- ID
- Identification
- IMP
- International Mobility Program
- ISET
- Indigenous Skills and Employment Training
- JCP
- Job Creation Partnership
- LFS
- Labour Force Survey
- LMDA
- Labour Market Development Agreements
- LMI
- Labour Market Information
- LMP
- Labour Market Partnerships
- LTU
- Long-Term Unemployed
- MSCA
- My Service Canada Account
- MIE
- Maximum Insurable Earnings
- NERE
- New Entrant and Re-Entrant
- NESI
- National Essential Skills Initiative
- NHQ
- National Headquarters
- NOC
- National Occupation Classification
- OAS
- Old Age Security
- OASIS
- Occupational and Skills Information System
- p.p.
- Percentage point
- PCIC
- Parents of Critically Ill Children
- PCS
- Post Call Survey
- PPE
- Premium Paid Eligible
- PRP
- Premium Reduction Program
- PTs
- Provinces and Territories
- QPIP
- Quebec Parental Insurance Plan
- RAIS
- Registered Apprenticeship Information System
- R&I
- Research and Innovation
- ROE
- Record of Employment
- SAT
- Secure Automated Transfer
- SCT
- Skills and Competency Taxonomy
- SD
- Skills Development
- SD-A
- Skills Development - Apprentices
- SD-R
- Skills Development - Regular
- SE
- Self-Employment
- SEAQ
- Service, Excellence, Accuracy and Quality
- SEPH
- Survey of Employment, Payrolls and Hours
- SFS
- Skills for Success
- SIN
- Social Insurance Number
- SIP
- Sectoral Initiatives Program
- SME
- Small and medium-sized enterprise
- SST
- Social Security Tribunal
- STVC
- Status Vector
- SUB
- Supplemental Unemployment Benefit
- SWSP
- Sectoral Workforce Solutions Program
- TES
- Targeted Earning Supplements
- TR
- Temporary Resident
- TRF
- Targeting, Referral and Feedback
- TFWP
- Temporary Foreign Worker Program
- TWS
- Targeted Wage Subsidies
- UV
- Unemployment-to-job-vacancy
- VBW
- Variable Best Weeks
- VER
- Variable Entrance Requirement
- WISE
- Work Integration Social Enterprises
- WWC
- Working While on Claim
List of figures
- Chart 3.1.2.1 – Canada, 2014-15 to 2023-24, key performance indicators
- Chart 3.1.2.2 – Canada, 2023-24, total EBSM expenditures, by service type
- Chart 3.1.3.1 – Canada, 2023-24, Labour Market Development Agreements at-a-glance, by service type
- Chart 3.1.4.1 – Canada, 2014-15 to 2023-24, clients served, by client type
- Chart 3.1.4.2 – Canada, 2014-15 to 2023-24, clients served, by client age
- Chart 3.2.1.1 – Newfoundland and Labrador, 2014-15 to 2023-24, relative client share, by client age
- Chart 3.2.1.2 – Newfoundland and Labrador, 2014-15 to 2023-24, clients served, by client type
- Chart 3.2.1.3 – Newfoundland and Labrador, 2014-15 to 2023-24, key performance indicators
- Chart 3.2.2.1 – Prince Edward Island, 2014-15 to 2023-24, relative client share, by client age
- Chart 3.2.2.2 – Prince Edward Island, 2014-15 to 2023-24, clients served, by client type
- Chart 3.2.2.3 – Prince Edward Island, 2014-15 to 2023-24, key performance indicators
- Chart 3.2.3.1 – Nova Scotia, 2014-15 to 2023-24, relative client share, by client age
- Chart 3.2.3.2 – Nova Scotia, 2014-15 to 2023-24, clients served, by client type
- Chart 3.2.3.3 – Nova Scotia, 2014-15 to 2023-24, key performance indicators
- Chart 3.2.4.1 – New Brunswick, 2014-15 to 2023-24, relative client share, by client age
- Chart 3.2.4.2 – New Brunswick, 2014-15 to 2023-24, clients served, by client type
- Chart 3.2.4.3 – New Brunswick, 2014-15 to 2023-24, key performance indicators
- Chart 3.2.5.1 – Quebec, 2014-15 to 2023-24, relative client share, by client age
- Chart 3.2.5.2 – Quebec, 2014-15 to 2023-24, clients served, by client type
- Chart 3.2.5.3 – Quebec, 2014-15 to 2023-24, key performance indicators
- Chart 3.2.6.1 – Ontario, 2014-15 to 2023-24, relative client share, by client age
- Chart 3.2.6.2 – Ontario, 2014-15 to 2023-24, clients served, by client type
- Chart 3.2.6.3 – Ontario, 2014-15 to 2023-24, key performance indicators
- Chart 3.2.7.1 – Manitoba, 2014-15 to 2023-24, relative client share, by client age
- Chart 3.2.7.2 – Manitoba, 2014-15 to 2023-24, clients served, by client type
- Chart 3.2.7.3 – Manitoba, 2014-15 to 2023-24, key performance indicators
- Chart 3.2.8.1 – Saskatchewan, 2014-15 to 2023-24, relative client share, by client age
- Chart 3.2.8.2 – Saskatchewan, 2014-15 to 2023-24, clients served, by client type
- Chart 3.2.8.3 – Saskatchewan, 2014-15 to 2023-24, key performance indicators
- Chart 3.2.9.1 – Alberta, 2014-15 to 2023-24, relative client share, by client age
- Chart 3.2.9.2 – Alberta, 2014-15 to 2023-24, clients served, by client type
- Chart 3.2.9.3 – Alberta, 2014-15 to 2023-24, key performance indicators
- Chart 3.2.10.1 – British Columbia, 2014-15 to 2023-24, relative client share, by client age
- Chart 3.2.10.2 – British Columbia, 2014-15 to 2023-24, clients served, by client type
- Chart 3.2.10.3 – British Columbia, 2014-15 to 2023-24, key performance indicators
- Chart 3.2.11.1 – Yukon, 2014-15 to 2023-24, relative client share, by client age
- Chart 3.2.11.2 – Yukon, 2014-15 to 2023-24, clients served, by client type
- Chart 3.2.11.3 – Yukon, 2014-15 to 2023-24, key performance indicators
- Chart 3.2.12.1 – Northwest Territories, 2014-15 to 2023-24, relative client share, by client age
- Chart 3.2.12.2 – Northwest Territories, 2014-15 to 2023-24, clients served, by client type
- Chart 3.2.12.3 – Northwest Territories, 2014-15 to 2023-24, key performance indicators
- Chart 3.2.13.1 – Nunavut, 2014-15 to 2023-24, relative client share, by client age
- Chart 3.2.13.2 – Nunavut, 2014-15 to 2023-24, clients served, by client type
- Chart 3.2.13.3 – Nunavut, 2014-15 to 2023-24, key performance indicators
- Chart 3.4 – Canada, 2023-24, EI Part II program expenditures for the Pan-Canadian activities, by program
- Chart 3.4.1.1 – Canada, 2023-24, clients served by the Indigenous Skills and Employment Training program and performance indicator
List of tables
- Table 3.1.2.1 – Canada, 2022-23 and 2023-24, year-over-year change in services delivered, by service type
- Table 3.1.2.2 – Canada, 2023-24, final EBSM expenditures, by province or territory
- Table 3.1.3.1 – Canada, 2023-24, services delivered, by service type
- Table 3.1.3.2 – Canada, 2023-24, Employment Benefits key facts, by service type
- Table 3.1.3.3 – Canada, 2023-24, Support Measures key facts, by service type
- Table 3.1.3.4 – Canada, 2023-24, supplemental indicators, by province or territory
- Table 3.1.4.1 – Canada, 2022-23 and 2023-24, year-over-year change in client volumes, by client type
- Table 3.1.4.2 – Canada, 2023-24, clients served and relative share, by client type
- Table 3.1.4.3 – Canada, 2023-24, clients served, by client age
- Table 3.1.4.4 – Canada, 2023-24, relative client share, by client age
- Table 3.1.4.5 – Canada, 2022-23 and 2023-24, year-over-year change in clients served, by client age
- Table 3.1.4.6 – Canada, 2022-23 and 2023-24, year-over-year change in total services provided, by client's designated group
- Table 3.1.4.7 – Canada, 2023-24, service delivered, by client's designated group
- Table 3.1.4.8 – Canada, 2023-24, official language (OL) preference for service interaction, by province and territory
- Table 3.1.4.9 – Canada, 2023-24, official Language (OL) of service delivered, by province and territory
- Table 3.1.4.10 – Canada, 2023-24,Targeting, Referral and Feedback (TRF), by province and territory
- Table 3.1.4.11 – Canada, 2023-24, clients served, by client type and province or territory
- Table 3.2 – Canada, 2023-24, Final LMDA allocation, by province and territory
- Table 3.2.1.1 – Newfoundland and Labrador, 2023-24, clients served and relative share, by client type
- Table 3.2.1.2 – Newfoundland and Labrador, 2023-24, services delivered key facts, by service type
- Table 3.2.1.3 – Newfoundland and Labrador, 2023-24, Employment Benefits key facts, by service type
- Table 3.2.1.4 – Newfoundland and Labrador, 2023-24, Support Measures key facts, by service type
- Table 3.2.2.1 – Prince Edward Island, 2023-24, clients served and relative share, by client type
- Table 3.2.2.2 – Prince Edward Island, 2023-24, services delivered key facts, by service type
- Table 3.2.2.3 – Prince Edward Island, 2023-24, Employment Benefits key facts, by service type
- Table 3.2.2.4 – Prince Edward Island, 2023-24, Support Measures key facts, by service type
- Table 3.2.3.1 – Nova Scotia, 2023-24, clients served and relative share, by client type
- Table 3.2.3.2 – Nova Scotia, 2023-24, services delivered key facts, by service type
- Table 3.2.3.3 – Nova Scotia, 2023-24, Employment Benefits key facts, by service type
- Table 3.2.3.4 – Nova Scotia, 2023-24, Support Measures key facts, by service type
- Table 3.2.4.1 – New Brunswick, 2023-24, clients served and relative share, by client type
- Table 3.2.4.2 – New Brunswick, 2023-24, services delivered key facts, by service type
- Table 3.2.4.3 – New Brunswick, 2023-24, Employment Benefits key facts, by service type
- Table 3.2.4.4 – New Brunswick, 2023-24, Support Measures key facts, by service type
- Table 3.2.5.1 – Quebec, 2023-24, clients served and relative share, by client type
- Table 3.2.5.2 – Quebec, 2023-24, services delivered key facts, by service type
- Table 3.2.5.3 – Quebec, 2023-24, Employment Benefits key facts, by service type
- Table 3.2.5.4 – Quebec, 2023-24, Support Measures key facts, by service type
- Table 3.2.6.1 – Ontario, 2023-24, clients served and relative share, by client type
- Table 3.2.6.2 – Ontario, 2023-24, services delivered key facts, by service type
- Table 3.2.6.3 – Ontario, 2023-24, Employment Benefits key facts, by service type
- Table 3.2.6.4 – Ontario, 2023-24, Support Measures key facts, by service type
- Table 3.2.7.1 – Manitoba, 2023-24, clients served and relative share, by client type
- Table 3.2.7.2 – Manitoba, 2023-24, services delivered key facts, by service type
- Table 3.2.7.3 – Manitoba, 2023-24, Employment Benefits key facts, by service type
- Table 3.2.7.4 – Manitoba, 2023-24, Support Measures key facts, by service type
- Table 3.2.8.1 – Saskatchewan, 2023-24, clients served and relative share, by client type
- Table 3.2.8.2 – Saskatchewan, 2023-24, services delivered key facts, by service type
- Table 3.2.8.3 – Saskatchewan, 2023-24, Employment Benefits key facts, by service type
- Table 3.2.8.4 – Saskatchewan, 2022-23, Support Measures key facts, by service type
- Table 3.2.9.1 – Alberta, 2023-24, clients served and relative share, by client type
- Table 3.2.9.2 – Alberta, 2023-24, services delivered key facts, by service type
- Table 3.2.9.3 – Alberta, 2023-24, Employment Benefits key facts, by service type
- Table 3.2.9.4 – Alberta, 2023-24, Support Measures key facts, by service type
- Table 3.2.10.1 – British Columbia, 2023-24, clients served and relative share, by client type
- Table 3.2.10.2 – British Columbia, 2023-24, services delivered key facts, by service type
- Table 3.2.10.3 – British Columbia, 2023-24, Employment Benefits key facts, by service type
- Table 3.2.10.4 – British Columbia, 2023-24, Support Measures key facts, by service type
- Table 3.2.11.1 – Yukon, 2023-24, clients served and relative share, by client type
- Table 3.2.11.2 – Yukon, 2023-24, services delivered key facts, by service type
- Table 3.2.11.3 – Yukon, 2023-24, Employment Benefits key facts, by service type
- Table 3.2.11.4 – Yukon, 2023-24, Support Measures key facts, by service type
- Table 3.2.12.1 – Northwest Territories, 2023-24, clients served and relative share, by client type
- Table 3.2.12.2 – Northwest Territories, 2023-24, services delivered key facts, by service type
- Table 3.2.12.3 – Northwest Territories, 2023-24, Employment Benefits key facts, by service type
- Table 3.2.12.4 – Northwest Territories, 2023-24, Support Measures key facts, by service type
- Table 3.2.13.1 – Nunavut, 2023-24, clients served and relative share, by client type
- Table 3.2.13.2 – Nunavut, 2023-24, services delivered key facts, by service type
- Table 3.2.13.3 – Nunavut, 2023-24, Employment Benefits key facts, by service type
- Table 3.2.13.4 – Nunavut, 2023-24, Support Measures key facts, by service type
Introduction: Chapter 3
Activities conducted under Part II of the Employment Insurance Act (EI Act) help individuals in Canada prepare for, find and maintain employment. These activities are conducted through the Labour Market Development Agreements (LMDAs) and the Government of Canada's pan-Canadian programming:
- LMDAs are bilateral agreements between the Government of Canada (GC) and each province and territory (PT). Each year, under the LMDAs, at least $2.1 billion is provided for individuals and employers to receive training and employment supports in the form of Employment Benefits and Support Measures (EBSMs).Footnote 1 Part II of the EI Act sets out the framework for the LMDAs, including information such as who is eligible for employment supports and the categories of programs and supports that can be delivered by PTs
- Part II of the EI Act also includes the framework for the Government of Canada's pan-Canadian programming. Pan-Canadian programming includes the National Employment Service and serves to respond to labour market challenges that surpass local and regional labour markets. In 2023-24, pan-Canadian programming saw over $184 million in investment across 3 streamsFootnote 2
This chapter presents results achieved under Part II of the EI Act during the fiscal year beginning on April 1, 2023 and ending on March 31, 2024 (2023-24):
Sections in this chapter
Section 3.1 provides economic and labour market context for EI Part II and a national overview of EBSM programs delivered through the LMDAs and pan-Canadian programming. This year's aggregated outcomes, funding and client distributions and key program delivery results are also highlighted.
Section 3.2 reviews employment programming activities carried out by each province and territory under their respective LMDAs, including an analysis of regional approaches, key outcomes, client demographics and the different types of services offered.
Section 3.3 reviews results presented in the 2022 LMDA evaluation report. Participants are compared to similar non-participants to measure the effectiveness of the interventions on labour market attachment and dependence on government income supports.
Section 3.4 details the pan-Canadian activities and initiatives responding to issues of national and strategic importance and challenges extending beyond local or regional labour markets.
Notes to readers
Data collection/sources: Data for EBSM activities presented in the document were collected from PTs and Indigenous Skills and Employment Training (ISET) agreement holders (i.e., pan-Canadian Activities) and produced using the ESDC LMDA and pan-Canadian accountability datasets, following a standardized Performance Measurement Framework.
Data quality: The Government of Canada (GC) and PT governments strive to ensure data accuracy, reliability and consistency. However, operational or system improvements may impact the comparability of data from year to year.
Scope and limitations: The data presented are subject to limitations based on data collection methods and timing. While all efforts were made to ensure accuracy, small discrepancies may arise due to variations in data sources and reporting standards.
Performance Measurement Strategy (PMS): The PMS was collaboratively developed by Canada and PT governments through the Forum of Labour Market Ministers and implemented as part of the 2019 Labour Market Development Agreements (LMDA).
Financial data: Financial totals included in Chapter 3 and Annex 3 are based on PT-provided reports. Where final data was not available at the time of publication, expenditures are based on draft figures or previous year data.
3.1 National overview
In this section
- 3.1.1 Economic and labour market context
- 3.1.2 Main results
- 3.1.3 Interventions funded by the LMDAs
- 3.1.4 Clients served by the LMDAs
3.1.1 Economic and labour market context
Canada’s workforce is among the most highly educated in the world, yet challenges related to skill shortages, job mismatches and underemployment continue to shape the country’s labour market. As industries evolve due to technological advancements, demographic shifts and economic pressures, the ability of Canadian workers to meet changing demands is more critical than ever. Despite a strong foundation in tertiary education, gaps remain in aligning skills with labour market needs, particularly in sectors where vocational and technical training play a crucial role.
A need for vocational training and technical education
One of Canada’s most significant strengths is its high level of post-secondary attainment. In 2023, 63.3% of adults aged 25 to 64 held a post-secondary certificate or degree, placing Canada well above the OECD average of 41.0%.Footnote 3 This puts the country ahead of nations such as the United States, the United Kingdom and Germany, reaffirming Canada’s commitment to education as a driver of economic growth. However, while university and college education rates remain high, fewer Canadians pursue vocational training or technical education compared to other OECD countries.
In countries like Germany and Switzerland, strong apprenticeship systems support middle-skill occupations, ensuring that graduates are equipped with practical skills that align with industry needs. In Canada, only 30.0% of adults have completed upper secondary or post-secondary non-tertiary education, compared to the OECD average of 40.2%.Footnote 4 This reflects a tendency to prioritize academic pathways over skilled trades and applied technical fields—an imbalance that has led to skill shortages in key sectors.
Encouragingly, 2023 saw a rise in apprenticeship certifications, signaling renewed momentum in vocational education. The number of certificates granted to registered apprentices and trade qualifiers increased 7.1% to 1.6 million, reversing a small decline in 2022.Footnote 5 Trades such as heavy duty mechanics (+41.2%), automotive service (+28.1%) and food service (+18.9%) experienced the most significant growth in certifications, suggesting that demand for skilled trades workers remains strong.Footnote 6
Apprenticeship certifications in construction-related trades saw a modest 1.6% increase in 2023, driven largely by a significant 14.2% surge among plumbers, pipefitters and steamfitters. However, when excluding this group, certifications in the sector actually declined by 1.8%, highlighting uneven growth across the trades.
The growth in Red Seal certifications, which ensure national mobility for trades professionals, is another positive indicator of a strengthening workforce pipeline. However, despite these gains, persistent shortages remain in many trade professions, particularly in construction and manufacturing, where aging workers and low apprenticeship completion rates present ongoing challenges. In response, Canada’s Labour Market Development Agreements (LMDAs) play a critical role in addressing these shortages, providing funding for skills training targeted at unemployed and underemployed Canadians. These agreements help workers gain the credentials and experience necessary to enter high-demand fields, such as skilled trades, where shortages are most severe.
Skill-job mismatches and sector-specific shortages
Skill-job mismatches continue to be a pressing concern for businesses across Canada. Many industries report difficulties in finding qualified workers, with recruitment challenges particularly acute in construction, healthcare and information technology. According to results from the most recent Canadian Survey on Business Conditions conducted in early 2025, larger businesses, those with 100 or more employees, reported the greatest difficulty in hiring, with 47.6% citing recruitment of skilled employees as a major challenge. Meanwhile, retention has become a concern, as businesses compete for talent in an increasingly mobile and flexible job market.
Sector-specific skill shortages highlight deep-rooted structural challenges in Canada’s labour market. In the construction industry, 36.5%Footnote 7 of employers report difficulty recruiting skilled workers, with high demand for electricians, carpenters and other trades professionals. This shortage is further exacerbated by an aging workforce and a slower-than-expected uptake of apprenticeships. Similarly, the healthcare sector is struggling with severe staffing shortages, particularly among nurses and medical technicians, with 30.6%Footnote 8 of the sector reporting difficulty recruiting skilled employees.
In contrast, the professional, scientific and technical services sector—which includes industries like information technology, legal services and scientific research—faced the least difficulty in recruiting skilled workers, with just 17.3%Footnote 9 citing it as a challenge. Retaining talent was even less of a concern, with only 11.8%Footnote 10 reporting it as an obstacle, highlighting the sector’s relative stability in workforce management.
The LMDAs serve as a critical tool to help address these skill shortages. By funding targeted skills training, the LMDAs support workers transitioning into sectors experiencing high demand. Programs under the LMDAs have proven effective in increasing employment rates and earnings, with participants gaining an average $10,000 increase in income within 4 years after completing their training.Footnote 11 Such initiatives help fill labour gaps in key industries while ensuring that Canadian workers remain competitive in a rapidly evolving job market.
The problem of underemployment
Underemployment remains a significant challenge for the Canadian economy, particularly for younger workers. According to Statistics Canada, the underemployment rate averaged 7.6% during the 2023-24 fiscal year, marking a 60-basis-point increase from the previous year.Footnote 12 While men experienced a rate in line with the general population, women faced a higher underemployment rate of 8.6%.Footnote 13 The issue is most severe among young workers aged 15-24, with underemployment reaching 16.1% for men and 15.5% overall.Footnote 14 Many struggle to find full-time roles that match their qualifications, often resorting to part-time or temporary positions despite holding post-secondary credentials. Alarmingly, underemployment among this cohort has continued to climb in the first 10 months of the 2024-25 fiscal year, averaging 17.9%—outpacing the rise in unemployment itself.Footnote 15
In contrast, underemployment among core working-age individuals, aged25 to 54, remained significantly lower at 6.4%, indicating greater stability within this group.Footnote 16 The gender gap was also minimal, with rates of 6.3% for men and 6.5% for women.Footnote 17 However, similar to youth, underemployment in this demographic is rising, underscoring the shifting dynamics of the economic landscape.
To address underemployment, the LMDAs provide critical employment assistance services, including career counselling, résumé writing workshops and job search support. These programs help individuals—particularly youth, Indigenous peoples, persons with disabilities and racialized Canadians—overcome barriers to full-time employment and secure jobs that match their skills and experience.
Challenges for employers
The labour market challenges facing Canadian businesses are not uniform. While large firms struggle with recruitment and retention, small and medium-sized enterprises (SMEs) often experience additional difficulties in maintaining an adequate workforce due to budget constraints and competition from larger corporations offering higher wages and benefits. SMEs in sectors such as retail, hospitality and manufacturing face some of the highest turnover rates, leading to operational instability. The challenge of workforce availability is compounded by regional disparities, with certain provinces experiencing more acute shortages in key industries due to demographic and economic factors.
Challenges to participants
For labour market participants, challenges manifest in different ways depending on age, experience and industry. As indicated, many young workers struggle with underemployment, unable to secure stable, full-time jobs that match their qualifications, while older workers often face barriers to re-entering the workforce after periods of unemployment. Meanwhile, workers in high-demand industries may experience frequent job turnover, either due to better opportunities elsewhere or burnout caused by workforce shortages—a trend particularly visible in healthcareFootnote 18 and skilled trades.Footnote 19
To address these challenges, the LMDAs play an essential role in bridging gaps between employers' needs and workers' skills. These agreements provide skills development programs, wage subsidies and employment assistance services that help job seekers transition into stable, high-demand careers. Programs funded through LMDAs also support career mobility, ensuring underemployed or unemployed Canadians have the necessary resources to reskill, upskill, or enter emerging sectors.
3.1.2 Main results
LMDA evaluation results and year-over-year reporting reveal that participation in Employment Benefits and Support Measures (EBSMs) improves labour market attachment and reduces dependence on government income supports, compared to results for similar non-participants.
In 2023-24, LMDAs continued to support individuals and employers across Canada in obtaining skills training and employment support services.Footnote 20 The results of that support is evidenced through the program’s key performance indicators (KPIs).
Key performance indicators
ESDC monitors and tracks the results of EBSM programming delivered by PTs through 3 key performance indicators (KPIs). These measure the performance of the LMDAs’ basic goal of assisting EI claimants in regaining employment and thereby providing savings to the EI Part I system. Respectively, they are:
- Number of active claimant clients served: the foundational indicator, providing insight on the extent to which the LMDAs served its principal client-type
- Number of EI-insured clientsFootnote 21 who return to employment: assisting clients in returning to employment is the primary goal of the LMDAs. This indicator measures the LMDAs’ success in doing so
- Amount of unpaid EI Part I benefits resulting from returns to employment: by assisting EI claimants to return to employment before their benefits period is completed, the LMDAs help save funding for the EI Part I program. This indicator measures the savings achieved
Note: Each province and territory (PT) have their own targets for these indicators.
Results achieved
- Number of active claimant clients served: amid evolving labour market and economic conditions in FY 2023-24 across Canada, the number of active EI claimants served increased by 15.4% year-over-year, reaching 167,534
- Number of EI-insured clients who return to employment: returns to work slightly decreased by 0.3% year-over-year, with a total of 157,398 clients securing employment within 6 months of completing their services
- Amount of unpaid EI Part I benefits resulting from returns to employment: due to the rise in active EI claimants returning to work, unpaid EI Part I benefits totalled $909 million, increasing by 6.2% compared to the previous year's $856 million
Note: The average proportion of active claimants who received services within the first 12 weeks of their benefit period was 64.6%. Similarly, 53.8% of EI Part I benefit entitlements were saved because of clients returning to employment before exhausting their benefits.
Historical view
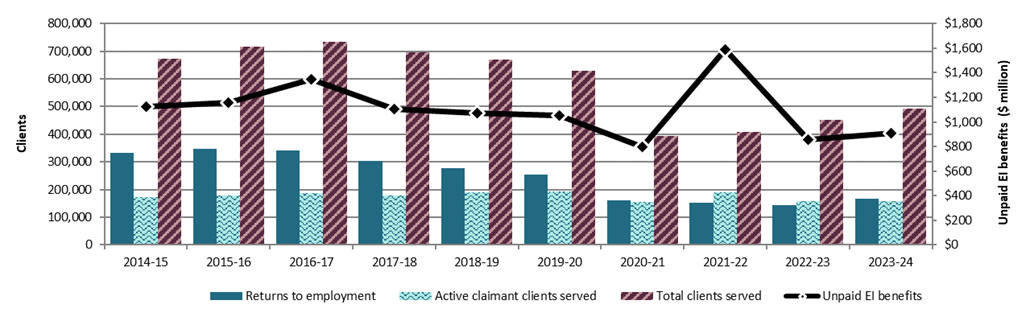
The chart below compares results for each of the 3 KPIs outlined above from 2014-15 through to 2023-24, providing a snapshot comparison of this fiscal year’s KPI results against those of the last 9 fiscal years:
Text description
| Year | Unpaid EI benefits | Active claimant clients served | Returns to employment | Total clients served |
|---|---|---|---|---|
| 2014-15 | $1,121,978,736 | 332,099 | 173,593 | 674,081 |
| 2015-16 | $1,154,581,388 | 348,392 | 178,556 | 717,896 |
| 2016-17 | $1,344,613,965 | 341,262 | 187,172 | 734,309 |
| 2017-18 | $1,103,167,911 | 304,339 | 177,335 | 695,911 |
| 2018-19 | $1,070,684,378 | 277,337 | 190,717 | 670,431 |
| 2019-20 | $1,054,344,499 | 254,553 | 194,120 | 630,425 |
| 2020-21 | $800,239,777 | 160,072 | 155,183 | 394,285 |
| 2021-22 | $1,588,456,667 | 153,689 | 190,919 | 409,459 |
| 2022-23 | $856,401,107 | 145,153 | 157,861 | 451,350 |
| 2023-24 | $909,578,874 | 167,534 | 157,398 | 491,279 |
Comparing LMDA and pan-Canadian programming
In 2023-24, a combined 871,769 pan-Canadian and non-pan-Canadian training and employment support services were provided under Part II of the EI Act, for a net increase of 8.4% from the previous year. However, the Indigenous Skills and Employment Training (ISET) program under pan-Canadian programming saw a slight decrease, with participation dropping by 2.3% to 51,740 in 2023-24:
| National level data | 2022-23 | 2023-24 | Year-over-year change |
|---|---|---|---|
| Total Employment Benefits Services | 188,144 | 192,365 | +2.2% |
| Total Support Measures: Employment Assistance Services | 562,987 | 627,664 | +11.5% |
| Total EBSM | 751,131 | 820,029 | +9.2% |
| Indigenous pan-Canadian | 52,973 | 51,740 | -2.3% |
| Total EBSM and Indigenous pan-Canadian services delivered | 804,104 | 871,769 | +8.4% |
- Notes:
- 1 This table reflects all new services started between April 1, 2023 and March 31, 2024.
- 2 LMDA data for YT and NU are estimated figures; YT data for 2023-24 are estimates based on last year's estimated figures.
Pan-Canadian changes
Along with participation, key performance indicators for the EI-funded portion of the ISET program declined slightly compared to 2022-23 as well. The program served 26,275 clients (active EI claimants, former EI claimants and Premiums Paid Eligible clients) which was 4.1% fewer than in the previous year. A total of 13,243 EI-funded ISET clients secured employment during 2023-24 within 6 months of their participation - 6.8% fewer than the previous year. The amount of EI Part I money saved as a result of active EI claimant ISET clients returning to work before exhausting their EI Part I benefits was $20,399,924 - 15.6% less than in 2022-23.
Summary of spending
Total expenditures under Part II of the EI Act were $2.5 billion in 2023‑24, which included EBSM programming and pan-Canadian activities. This represented an increase of 1.3% compared to the previous year.
Under the LMDAs, Employment Benefits remained the largest investment at $1.3 billion, representing the majority of expenditures by PTs. Compared to 2022‑23, spending on Employment Benefits increased by $1.2 billion (-0.7%). Employment Assistance Services expenditures increased as well, up 5.8%, to a total of $645.9 million. Other key areas of investment included $227.5 million for Labour Market Partnerships, $185.2 million for Research and Innovation and $150.6 million for Indigenous pan-Canadian programming.

Text description
| Employment Benefits | Employment Assistance Services | Labour Market Partnerships | Research and Innovation | Indigenous Pan-Canadian |
|---|---|---|---|---|
| $1,245,920,657 | $712,275,888 | $227,464,997 | $185,222,335 | $150,632,090 |
- Notes:
- 1 Figures expressed in thousands of dollars by service.
- 2 Totals may not add due to rounding.
- 3 The financial totals in the MAR are based on finalized reports provided by PTs. At the time of publication, final audited financial statements for YT, NT and NU had not been received. As such, expenditures for these jurisdictions are based on draft reports or the previous-year financial statements.
Spending by province and territory
A breakdown of spending by each high-level service type (Employment Benefits, Support Measures, Indigenous pan-Canadian) as well as associated total administrative costs are presented in the table below:
| Province/Territory | Employment Benefits | Support Measures | Over-contributions | Indigenous Pan-Canadian | Adjustments5 | Subtotal | Administrative costs6 | Total |
|---|---|---|---|---|---|---|---|---|
| Newfoundland and Labrador | $80,511 | $56,904 | $0 | $2,615 | $1,267 | $141,297 | $8,937 | $150,234 |
| Prince Edward Island | $19,449 | $6,650 | $0 | $281 | -$1 | $26,379 | $2,695 | $29,074 |
| Nova Scotia | $41,598 | $49,081 | $0 | $2,324 | $3,173 | $96,175 | $10,149 | $106,324 |
| New Brunswick | $58,498 | $43,116 | $0 | $1,712 | -$4 | $103,321 | $8,922 | $112,243 |
| Quebec | $414,175 | $226,515 | $0 | $12,356 | $1,183 | $654,229 | $58,920 | $713,149 |
| Ontario | $211,388 | $523,084 | $0 | $26,221 | $12,939 | $773,632 | $57,277 | $830,909 |
| Manitoba | $34,633 | $21,324 | $54 | $18,521 | $73 | $74,605 | $7,259 | $81,864 |
| Saskatchewan | $27,440 | $21,903 | $0 | $15,380 | $1,204 | $65,927 | $6,022 | $71,949 |
| Alberta | $123,201 | $81,925 | $0 | $16,633 | $2,798 | $224,557 | $9,594 | $234,151 |
| British Columbia | $229,537 | $89,435 | $2,882 | $17,921 | $4,040 | $343,815 | $20,263 | $364,078 |
| Yukon | $1,824 | $2,510 | $0 | $1,180 | -$2 | $5,511 | $389 | $5,900 |
| Northwest Territories | $2,072 | $1,110 | $0 | $3,568 | -$402 | $6,348 | $1,450 | $7,798 |
| Nunavut | $1,595 | $1,408 | $0 | $4,255 | -$136 | $7,122 | $787 | $7,909 |
| NHQ7 | n/a | $0 | $0 | $27,665 | -$27,665 | $0 | n/a | n/a |
| Totals by category | $1,245,921 | $1,124,965 | $2,936 | $150,632 | -$1,533 | $2,522,919 | $192,664 | $2,715,582 |
- Source: Provincial/Territorial Audited Statements
- Notes:
- 1 Figures expressed in thousands of dollars by service.
- 2 Totals may not add due to rounding.
- 3 For NL, NB, MB and NU, where spending exceeded federal allocated funding, proration was done for the expenses in each category.
- 4 The financial totals in the MAR are based on finalized reports provided by PTs. At the time of publication, final audited financial statements for YT, NT and NU had not been received. As such, expenditures for these jurisdictions are based on draft reports or previous-year financial statements.
- 5 This adjustment reflects overpayments established, refunds of previous years' expenditures and other accounting adjustments.
- 6 Net Administrative costs include salary and non-salary to administer LMDAs and $11 million for rent.
- 7 Represents Pan-Canadian (ISET) funding for Indigenous organizations that operate nationally rather than within a specific province or territory. A dedicated NHQ row ensures these funds are properly accounted for.
3.1.3 Types of services funded by the LMDAs
A variety of service types or Employment Benefit and Support Measures (EBSMs) are supported under the LMDAs. This subsection describes the various iservice types, the patterns and trends seen in 2023-24 and breaks down related expenditures. Also presented are supplemental performance indicators, which help demonstrate the impact of these services.
Types of services
Under the LMDAs, provinces and territories deliver programs and services that are reported according to the Employment Benefit and Support Measures (EBSM) categories established under Part II of the EI Act. The 8 EBSM categories first break down into either Employment Benefits (EBs), of which there are 5 intervention types and then Support Measures (SMs), of which there are 3 intervention types:
The 8 Employment Benefit and Support Measure (EBSM) categories:
Employment Benefits (EB): Employment Benefits are longer-term training and employment support, providing individuals with the skills or work experience required to regain employment. Through the LMDAs, PTs provide Employment Benefits consistent with the 5 benefits categories outlined in the EI Act:
- Targeted Wage Subsidies (TWS): assists participants to obtain on-the-job work experience by providing employers with financial assistance toward the wages of participants
- Targeted Earnings Supplements (TES)Footnote 22: encourages unemployed persons to accept employment through financial incentives
- Self-Employment (SE): provides financial assistance and business planning advice to eligible participants to help Canadians start their own business
- Job Creation Partnerships (JCP): provides participants with opportunities to gain work experience that will lead to ongoing employment
- Skills Development - Regular (SD-R): helps participants obtain employment skills by giving direct financial assistance that enables them to select, arrange for and pay for training
Skills Development - Apprentices (SD-A): apprentices are paid by their employer during periods of practical training. During the classroom portion of their training, apprentices are eligible for regular benefits under Part I of the EI Act if approved by their PT government. Depending on the regional and local priorities of the province or territory, the apprentice may receive EI Part II support to cover classroom-related expenses
Support Measures (SM): Support Measures fall into the subcategories of either (a) Employment Assistance Services (EASs) or (b) Other Support Measures (EASs):
- Employment Assistance Services (EAS): provides individual counselling that provides 1-on-1 job seeking support; action planning; job search skills; job-finding clubs; job placement services; and more
- Labour Market Partnerships (LMP): helps employers, employee and employer associations and communities to improve their capacity to deal with human resource requirements and to implement labour force adjustments
- Research and Innovation (R&I): supports activities that identify better ways of helping people to prepare for or keep employment and to be productive participants in the labour force
Expenditures by service type
Necessarily, spending on services and choices over whether to deploy more or fewer of one kind of service versus another will vary from one province or territory (PT) to the next. Accordingly, the national, aggregated picture will reflect this variation. See below a visual breakdown of the different intervention types deployed in 2023-24, their average duration and the overall amount spent on each type:

Text description
- Employment Benefits ($1.2B)
- Targeted Wage Subsidies (avg duration: 192 days) ($0.2B)
- Self Employment Benefit (avg duration: 217 days) ($0.1B)
- Job Creation Partnerships (avg duration: 60 days) ($0.02B)
- Skills Development - Regular (avg duration: 84 days) ($1.0B)
- Skills Development - Apprentices (avg duration: 55 days) ( Expenditure is included under SD - Regular)
- Targeted Earning Supplements (not currently used)
- EBSM
- Support Measures ($1.1B)
- Other Support Measures ($0.4B)
- Labour Market Partnerships ($0.2B)
- Research and Innovation ($0.2B)
- Employment Assistance Services ($0.7B)
- Employment Services (avg duration: 1 day)
- Individual Counselling (avg duration: 1 day)
- Other Support Measures ($0.4B)
- Notes:
- 1 This table reflects all new services started between April 1, 2023 and March 31, 2024.
- 2 LMDA data for NU and YT are excluded due to lack of information on start and end dates of services provided.
- 3 The financial totals in the MAR are based on finalized reports provided by PTs. At the time of publication, final audited financial statements for YT, NT and NU had not been received. As such, expenditures for these jurisdictions are based on draft reports or previous-year financial statements.
- 4 Expenditure totals may not add due to rounding.
2023-24 service trends and patterns
There was a 9.2% increase to total Employment Benefit and Support Measures (EBSM), resulting in 820,029 services provided to Canadians (excluding pan-Canadian services provided to Indigenous people). In 2019-20, there were 968,632 services, as compared to 641,656 in 2020-21. However, participation increased in each subsequent year, reaching 751,131 in 2022-23. This signals a strong recovery and growing demand for EBSMs. In 2023‑24, 519,184 clients benefited from EBSMs, marking an increase of 8.4% from the 478,744 clients served in 2022-23.
- Employment Benefits (EBs) services were provided to 192,365 Canadians in 2023-24 for a 2.2% increase from 188,144 in 2022-23. EBs are typically more expensive, more involved and have more stringent eligibility criteria, but can deliver a deeper and longer-lasting result for clients. In 2023-24, EBs made up 28% of total intervention services provided
- Employment Assistance Services (EAS), classed as Support Measures (SMs), consistently make up the majority of EBSM services provided. In 2023-24, 72% of total EBSM services were EASs. A client will first receive an EAS to determine what other benefits and services would be beneficial for labour market reattachment. In 2023-24, this intervention type saw a substantial increase, rising by 11.5% to reach 627,664 participants, compared to 562,987 the previous year
The distribution of EAS to EBs (72% to 28%) highlights the broader deployment of accessible assistance services as clients seek pathways to employment and stability, as well as higher costs associated with delivering Employment Benefits, which are tailored to direct job placement and skills development.
| Service type | Services delivered | Year-over-year change | Share of total | Year-over-year change (p.p.) |
|---|---|---|---|---|
| Total Employment Benefits | 192,365 | +2.2% | 22.1% | -1.3 |
| Total Support Measures: Employment Assistance Services | 627,664 | +11.5% | 72.0% | +2.0 |
| Total EBSM | 820,029 | +9.2% | 94.1% | +0.7 |
| Indigenous pan-Canadian | 51,740 | -2.3% | 5.9% | -0.7 |
| Total EBSM and Indigenous pan-Canadian services delivered | 871,769 | 8.4% | 100.0% | n/a |
- Notes:
- 1 This table reflects all new services started between April 1, 2023 and March 31, 2024.
- 2 LMDA data for YT and NU are estimated figures.
- 3 LMDA YT data for 2023-24 are estimates, based on last year's estimated figures.
A more detailed view of delivery of each intervention type in fiscal year 2023-24 follows below:
Delivery of Employment Benefits (EBs) services in 2023-24
In 2023-24, Employment Benefits training and employment supports totaled 192,365, reflecting a 2.2% year-over-year increase. Total expenditures for Employment Benefits amounted to $1.25 billion, a 0.7% decrease from the previous year.
Skills Development (SD) programs continued to provide the skills needed for the demanding Canadian workforce, accounting for 79.9% of all Employment Benefits delivered, with total SD expenditures reaching $995.3 million, a 3.2% decline from the previous year. Skills Development - Regular (SD-R) services (includes services such as occupational skills training and programs focused on literacy, essential skills and language training) grew by 3.0% to reach 99,806 services. This represented 51.9% of all Employment Benefits. Skill Development - Apprentices (SD-A) services saw a 5.6% rise to 77,857 and accounted for 40.5% of the total Employment Benefits, reflecting a sustained emphasis on equipping workers with specialized skills to meet labour market demands.
In contrast, Targeted Wage Subsidies (TWS) which represents a 5.7% of total Employment Benefits, experienced a sharp 15.4% decline, dropping to 11,037 services. This reduction suggests a reduced focus on wage subsidies, potentially due to stronger labour market conditions, changes in employer hiring strategies, or a resource reallocation favoring skill-based training programs. However, expenditures on TWS grew by 16.5%, reaching $179.2 million. Similarly, Self-Employment (SE) supports which makes up of 1.1% of all Employment Benefits, totaling 2,141 services also fell by 27.2%, which may indicate a decline in demand for Self-Employment (SE) assistance among participants. Despite this decline, expenditures increased by 7.3% to $56.2 million.
Job Creation Partnerships (JCPs) experienced a slight decline of 3.8%, totalling 1,524 and accounting for 0.8% of the Employment Benefits. Despite this reduction, Job Creation Partnerships (JCPs) remains a valuable resource for providing work experience, even though they represent a relatively small portion of the overall services. However, JCP expenditures declined by 28.7% to $15.2 million.
| Employment Benefits | Services | Year-over-year change | Share of employment benefits total | Expenditures | Year-over-year change |
|---|---|---|---|---|---|
| Targeted Wage Subsidies | 11,037 | -15.4% | 5.7% | $179,241,672 | +16.5% |
| Self-Employment | 2,141 | -27.2% | 1.1% | $56,190,017 | +7.3% |
| Job Creation Partnerships | 1,524 | -3.8% | 0.8% | $15,226,998 | -28.7% |
| Skills Development-Regular | 99,806 | +3.0% | 51.9% | $955,262,971 | -3.2% |
| Skills Development-Apprentices | 77,857 | +5.6% | 40.5% | Included above | Included above |
| Targeted Earning Supplements | 0 | 0.0% | 0.0% | n/a | n/a |
| Totals | 192,365 | 2.2% | 100.0% | $1,245,920,657 | -0.7% |
- Notes:
- 1 This table reflects all new services started between April 1, 2023 and March 31, 2024.
- 2 LMDA data for YT and NU are estimated figures.
- 3 LMDA YT data for 2023-24 are estimates, based on prior year's estimated figures.
Delivery of Employment Assistance Services (EASs) in 2023-24
Employment Assistance Services (EAS), as part of the Support Measure service type, are the first service an individual receives to determine what further training and employment supports would be beneficial for labour market reattachment. EAS is essential in providing support to individuals who have been disconnected from the labour market for an extended period or who have low job attachment. These services, which range from Employment Services (ES) to Individual Counselling, aim to help clients regain stable employment though various supports and personalized strategies.
In 2023-24, 627,664 EAS were provided to Canadians, marking an increase of 11.5% year-over-year. General ES, which includes services such as job search assistance, remained the most frequent accessed support, totalled 425,656 services, accounting for 67.8% of all EAS services. This represents an 11.3% year-over-year increase, highlighting the ongoing focus on engaging clients early through needs assessments and personalized employment strategies. In 2023‑24, EAS expenditures amounted to $712.3 million, increased by 7.9% year-over-year.
There was a notable increase in individual counselling, rising 11.8% to reach 202,008 services, accounting for 32.2% of all EAS delivered. This growth highlights a continued emphasis on providing tailored, in-depth support to address barriers and facilitate a successful return to work, meeting the evolving needs of job seekers in a dynamic labour market.
Delivery of other support measures in 2023-24
Other support measures include Labour Market Partnerships (LMP) and Research and Innovation (R & I), both of which play a critical role in strengthening the labour market and supporting workforce development.
The Labour Market Partnerships (LMP) offer crucial support to employers, assisting them in managing workforce adjustments and addressing human resources needs and challenges. These supports are also extended to employee and employer associations, community organizations and local communities, enabling them to develop and implement strategic workforce solutions. In 2023‑24, LMP expenditures amounted to $227.5 million, decreased by 26.0% year-over-year.
Research and Innovation (R & I) initiatives seek to identify better ways of helping people prepare for, return to, or keep employment and be productive participants in the labour force. In 2023‑24, Research and Innovation ( R & I)expenditures amounted to $185.2 million, compared to $268.8 million in the previous year. The outcomes of Research and Innovation (R & I) projects are reviewed through evaluations, where applicable and impactful approaches are shared as best practices to inform and enhance other employment programs.
| Support Measures | Services | Year-over-year change | Share of support measures total | Expenditures | Year-over-year change |
|---|---|---|---|---|---|
| Employment Assistence Services (EAS) | 425,656 | 11.3% | 67.8% | $712,275,888 | +7.9% |
| Individual Counselling (IC) | 202,008 | 11.8% | 32.2% | Included above | Included above |
| Labour Market Partnerships (LMP) | n/a | n/a | n/a | $227,464,997 | -26.0% |
| Research & Innovation (R&I) | n/a | n/a | n/a | $185,222,335 | -31.1% |
| Totals | 627,664 | 11.5% | 100.0% | $1,124,963,220 | -9.0% |
- Notes:
- 1 This table reflects all new services started between April 1, 2023 and March 31, 2024.
- 2 LMDA data for YT and NU are estimated figures.
- 3 LMDA YT data for 2023-24 are estimates, based on prior year's estimated figures.
- 4 LMP and R&I data is unavailable. only expenditure amounts are provided by Chief Financial Officer Branch.
Supplemental performance indicators
Terminology guide
Unpaid EI benefits: is a success indicator that refers to the amount of EI Part I benefits not paid to EI claimants, based on the difference between their maximum entitlement to regular income benefits and the actual payout of such benefits to them.
To determine these unpaid benefits, the EI Part I data of all LMDA Clients who were actively receiving EI Part I funds when they began an Action Plan under the LMDA program are examined. For the subset who became employed between April 1, 2023 and March 31, 2024 (determined by a premature and consistent cessation of requesting EI funds), the amount of EI money they were entitled to, but did not claim, is their Unpaid Benefits amount.
In 2023-24, there was a total of $909,578,874 in Unpaid Benefits as a result of LMDA programs and services.
The table in this section highlights additional EI performance metrics across Canadian provinces and territories (PTs)Ts, showcasing significant regional variations. For the percentage of active claimant clients who started action plans within 12 weeks of their benefit period commencement, Alberta leads with 73.8%, followed by Manitoba at 71.2% and British Columbia at 69.2%, reflecting efficient processes in these provinces.
The returns-to-work metric, measured as a proportion of the total size of the PTs labour force, remains generally low across most regions, with values under 1.0%. However, PEI is an outlier with a significantly higher rate of 5.7%. This can be attributed, at least in part, to the province serving a higher proportion of its labour force participants-their EI-insured client served count is 4.9% of their labour force count, compared to 1.5% at national level.
For the proportion of unpaid EI benefits due to active claimants returning to work before exhausting their EI benefits, the Northwest Territories leads with 66.5%, followed by Saskatchewan at 65.2% and Alberta at 64.2%, reflecting a strong trend of claimants resuming employment early.
At the national level, 64.6% of claimants start action plans within 12 weeks, 0.7% returns to work as a percentage of Canada's total labour force population and 53.8% of the EI benefits amount remains unpaid due to early return to work. These findings underscore regional disparities in EI program performance and claimant behaviour.
| Province/Territory | % of active claimant clients whose action plan started within 12 weeks of their benefit period commencement | Returns to work/total PTs labour force4 | Unpaid EI benefits due to active claimant clients having returned to work as a proportion of the total benefits they would have received had they not returned to work. |
|---|---|---|---|
| Newfoundland and Labrador | 47.9% | 0.7% | 49.7% |
| Prince Edward Island | 59.6% | 5.7% | 30.9% |
| Nova Scotia | 69.0% | 0.5% | 47.8% |
| New Brunswick | 61.9% | 1.1% | 42.7% |
| Quebec | 64.7% | 0.7% | 39.4% |
| Ontario | 57.0% | 0.7% | 56.9% |
| Manitoba | 71.2% | 0.8% | 61.6% |
| Saskatchewan | 65.3% | 0.8% | 65.2% |
| Alberta | 73.8% | 0.9% | 64.2% |
| British Columbia | 69.2% | 0.6% | 59.0% |
| Yukon | n/a | n/a | n/a |
| Northwest Territories | 52.0% | 0.6% | 66.5% |
| Nunavut | n/a | n/a | n/a |
| Canada | 64.6% | 0.7% | 53.8% |
- Notes:
- 1 This table excludes Indigenous pan-Canadian client data.
- 2 LMDA data for YT and NU are unavailable.
- 3 Return to work/total labour force represents the percentage of Active claimant clients, Former claimant clients and PPE clients who successfully re-entered employment between April 1, 2023 and March 31, 2024, after participating in a LMDA service, measured against the total labour force.
- 4 These indicators reflect outcomes influenced by multiple factors beyond the scope of the LMDAs and should not be solely attributed to LMDA services.
3.1.4 Clients served by the LMDAs
Under the LMDAs, EBSMs continue to support individuals in acquiring skills and work experience through various services. These services benefit active and former EI claimant clients, as well as individuals who have contributed EI premiums in at least 5 of the last 10 years.
This section identifies the various types of client served by the LMDAs. Included too are socio-demographic breakdowns of client types as well as a breakdown of client types by province and territory.
Terminology guide
A client is a person who has received at least 1 training and employment support that started in fiscal year 2023-24 and was funded by the LMDAs or by Indigenous organizations. As per the KPI measuring the number of active claimant clients served, there are multiple client types.
A training and/or employment support or service is a discrete program or service in which a client participates. Each service is attributed to the fiscal year in which it started.
Any reference to participants is the number of unique training and employment supports provided, where information on designated groups is collected at the training and employment supports level. Participant counts can be higher than client counts, as 1 client can receive multiple supports or benefits.
Types of client
Broadly, LMDA client types are as follows:
- Active claimant clients are those who were receiving EI Part I regular benefits when they requested labour market supports. Typically, they have stronger and more recent job attachment. They tend to return to work more quickly than those with weaker ties to employment
- Former claimant clients are those who received EI benefits in the previous 5 years
- Premiums Paid Eligible (PPE) are unemployed individuals who have made EI premium contributions on $2,000 or more in earnings in at least 5 of the last 10 years. This particularly benefits individuals with weaker labour force attachment
- Non-insured clients are those who are not eligible for Employment Benefits under EI Part II, but access Employment Assistance Services. This includes new labour force participants and individuals who were formally self-employed without paid employment earnings
2023-24 client trends and patterns
In 2023-24, the percentage of active claimant clients (including Indigenous pan-Canadian clients) as a proportion of overall clients served rose to 34.0% from 31.9% in 2022-23 (+2.1 percentage points). This growth suggests that more current EI recipients are seeking LMDA services, possibly due to economic shifts, including a recent rise in the national unemployment rate following historically low levels between late 2022 and early 2023.
The percentage of former claimant clients served (including Indigenous pan-Canadian clients) as a share of total clients decreased to 22.4% from 23.7% (-1.3 percentage points). This reduction continues a shift back toward pre-pandemic norms, given the proportion of former claimant clients served was considerably lower in the years prior to the pandemic.
Since former claimant clients are individuals who completed an EI claim within the past 5 years, the elevated levels stemming from pandemic-related job loss are expected to influence this category for up to 5years. As these claimants gradually transition out of the system, a return to historical trends-that more closely resembles a pre-pandemic distribution of client groups-is expected.
The greater representation of active claimant clients compared to former claimant clients confirms that services are able to quickly support individuals who recently started an EI claim. While the proportion of former claimant clients has remained stable across fiscal years, the growth in active claimant clients highlights increased demand for employment support services. The proportion of Premiums Paid Eligible (PPE) individuals, who are not currently on EI but have paid EI premiums contributions in the past, decreased from 10.5% to 9.6% (-0.9 percentage points). This decline highlights the ongoing challenge of engaging individuals with weaker labour market ties. Meanwhile, the share of non-insured clients, showed a slight increase from 33.9% to 34.0% (+0.1 percentage points).
| National level data | 2022-23 | 2023-24 | Year-over-year change (p.p.) |
|---|---|---|---|
| Active claimant clients (including Indigenous pan-Canadian clients) | 31.9% | 34.0% | +2.1 |
| Former claimant clients (including Indigenous pan-Canadian clients) | 23.7% | 22.4% | -1.3 |
| Premiums-paid eligible (PPE) individuals (including Indigenous pan-Canadian clients) | 10.5% | 9.6% | -0.9 |
| Non-insured | 33.9% | 34.0% | +0.1 |
- Notes:
- 1 This table reflects clients served between April 1, 2023 and March 31, 2024.
- 2 LMDA data for YT and NU are excluded due to insufficient client type information.
The distribution of clients remains similar when excluding Indigenous pan-Canadian clients: active claimant clients made up 34.1% of total clients (167,534 individuals), former claimant clients accounted for 21.0% (103,144 individuals), PPE clients represented 9.1% (44,656 individuals) and non-insured clients were the largest segment at 35.8% (175,945 individuals).
Indigenous pan-Canadian clients represented 5.1% of total clients, totalling 26,275 individuals, with a breakdown of 8,634 active claimants, 12,854 former claimants and 4,787 PPE clients.
In total, LMDA programs served 517,554 clients across Canada in 2023-24, excluding data from Yukon and Nunavut where access to client-type information is limited.
| Indicator | Active claimant clients | Former claimant clients | PPE clients | Non-insured clients | Total |
|---|---|---|---|---|---|
| Number served under the LMDAs (excluding Indigenous pan-Canadian clients) | 167,534 | 103,144 | 44,656 | 175,945 | 491,279 |
| Indigenous pan-Canadian clients | 8,634 | 12,854 | 4,787 | n/a | 26,275 |
| Total | 176,168 | 115,998 | 49,443 | 175,945 | 517,554 |
| Share of total (including Indigenous pan-Canadian clients) | 34.0% | 22.4% | 9.6% | 34.0% | 100.0% |
| Share of total (excluding Indigenous pan-Canadian clients) | 34.1% | 21.0% | 9.1% | 35.8% | 100.0% |
- Notes:
- 1 This table reflects clients served between April 1, 2023 and March 31, 2024.
- 2 LMDA data for YT and NU are excluded due to insufficient client type information. Total clients served, including YT and NU estimates is 519,184.
Since 2016-17, the number of active claimant clients (including Indigenous pan-Canadian clients) served under the LMDAs has been on a downward trend. This is largely attributed to improved labour market conditions. The decline accelerated in 2020, when COVID-19 public health protections were in place, leading to an even greater decrease in claimant numbers from 2020-21 to 2022-23. This trend reversed in 2023-24, with active claimant clients (including Indigenous pan-Canadian clients) rising from 153, 909 in 2022-23 to 176,168. This is thought to have been influenced by rising unemployment rates. Similarly, former claimant clients (including Indigenous pan-Canadian clients) also saw an increase from 114,468 to 115,998 in 2023-24, reinforcing the ongoing role of LMDAs in supporting individuals who are no longer receiving EI benefits but still need employment assistance.
The number of non-insured clients-individuals not linked to the EI system-increased to 175,945 in 2023-24, up from 158,321 the previous year. This rise reflects the number of non-insured individuals needing assistance, underscoring the broad reach of LMDAs in supporting employment needs beyond those with EI connections. In contrast, PPE clients (including Indigenous pan-Canadian clients) saw a slight decrease from 50,653 in 2022-23 to 49,443 in 2023-24, highlighting the continued challenge of providing assistance to people who have neither received EI in the preceding 5 years nor the current year.

Text description
| Year | Active claimant clients (including pan-Canadian clients) | Former claimant clients (including pan-Canadian clients) | PPE clients (including pan-Canadian clients) | Non-insured clients | Unemployment Rate |
|---|---|---|---|---|---|
| 2014-15 | 339,795 | 91,999 | n/a | 257,665 | 7.0% |
| 2015-16 | 356,828 | 92,689 | n/a | 284,607 | 7.0% |
| 2016-17 | 351,362 | 95,583 | n/a | 304,927 | 7.1% |
| 2017-18 | 313,998 | 115,927 | n/a | 285,733 | 6.4% |
| 2018-19 | 286,197 | 96,243 | 73,095 | 240,075 | 5.8% |
| 2019-20 | 262,196 | 98,633 | 73,088 | 218,350 | 5.7% |
| 2020-21 | 169,514 | 68,708 | 44,053 | 132,104 | 7.5% |
| 2021-22 | 163,672 | 90,005 | 45,900 | 134, 321 | 5.3% |
| 2022-23 | 153,909 | 114,468 | 50,653 | 158,321 | 5.4% |
| 2023-24 | 176,168 | 115,998 | 49,443 | 175,945 | 6.3% |
- Notes:
- 1 This chart reflects clients served between April 1, 2014 and March 31, 2024.
- 2 2022-24 LMDA data for YT and NU are excluded due to insufficient client type information.
- 3 Indigenous pan-Canadian clients are included.
- 4 Historical data has been adjusted to enhance accuracy.
This shift in 2023-24 signals renewed activity in LMDA programs, with an increased demand for services among active and former claimant clients, as well as non-insured individuals. The overall growth in client volumes highlights the responsiveness of LMDAs in adapting to changing economic conditions and their continuing relevance in helping a wide range of individuals re-enter or remain in the workforce. The slight decline in PPE clients, while small, suggests a need to further explore how to better engage this group in future labour market programs.
Clients by socio-demographic group
Breakdowns and details of clients by (1) age distribution, (2) designated and/or under-represented groups and (3) official languages are provided below:
Age distribution
The age distribution of clients under the LMDAs showed slight shifts in 2023-24, compared to the previous year. The percentage of youth clients (15-24 years old) decreased from 22.1% to 20.9%, (-1.2 percentage points). On the other hand, the percentage of core age clients (25-54 years old) who form most clients, increased from 65.3% in 2022-23 to 66.1% in 2023-24, (+0.8 percentage points). Additionally, the proportion of clients aged 55 and older increased slightly from 12.3% to 12.6% (+ 0.3 percentage points). See further details in the tables below:
| Age group | Number | Share of total |
|---|---|---|
| 15 to 19 | 28,503 | 5.5% |
| 20 to 24 | 79,381 | 15.4% |
| 25 to 29 | 80,919 | 15.7% |
| 30 to 34 | 75,227 | 14.6% |
| 35 to 39 | 61,958 | 12.0% |
| 40 to 44 | 50,716 | 9.8% |
| 45 to 49 | 39,024 | 7.6% |
| 50 to 54 | 32,768 | 6.4% |
| 55 and older | 65,213 | 12.6% |
| Unknown | 1,824 | 0.4% |
- Notes:
- 1 This table reflects clients served between April 1, 2023 and March 31, 2024.
- 2 LMDA data for YT and NU are excluded due to their data not being broken down by age groups.
| Youth (15-24) | Core age workers (25-54) | Clients aged 55 or older | Unknown |
|---|---|---|---|
| 20.9% | 66.1% | 12.6% | 0.4% |
- Notes:
- 1 This table reflects clients served between April 1, 2023 and March 31, 2024.
- 2 LMDA data for YT and NU are estimated figures.
- 3 LMDA YT data for 2023-24 are estimates, based on last year's estimated figures.
- 4 This table includes Indigenous pan-Canadian clients.
| National level data | 2022-23 | 2023-24 | Year-over-year change (p.p.) |
|---|---|---|---|
| Youth clients (15-24 years old) | 22.1% | 20.9% | -1.2 |
| Core age clients (25-54 years old) | 65.3% | 66.1% | +0.8 |
| Workers aged 55+ | 12.3% | 12.6% | +0.3 |
| Unknown Age | 0.3% | 0.4% | +0.1% |
- Notes:
- 1 This table reflects clients served between April 1, 2023 and March 31, 2024.
- 2 Reported counts may be lower than actual numbers due to reliance on self-identification PPE-categorized data.
- 3 LMDA data for YT and NU are estimated figures.
- 4 LMDA YT data for 2023-24 are estimates, based on last year's estimated figures.
- 5 Indigenous pan-Canadian clients are included.
The data from 2014-15 to 2023-24 indicates consistent engagement from core-age clients (25-54 years old), who make up the majority of LMDA clients. Over the years, participation rates for core-age clients have fluctuated slightly, starting at 68.1% in 2014-15 before dipping to 63.1% in 2018-19 and gradually climbing back to 66.1% in 2023-24.
Youth client participation saw a notable increase, rising from 19.4% in 2014-15 to a peak of 24.6% in 2021-22. This spike reflects the economic impact of the ongoing pandemic, which reduced the LMDA services among older age cohorts, while driving higher reliance among youth, whose unemployment rate peaked at 24.5% in 2020-21. Since then, the proportion of youth clients has declined to 20.9%. These figures suggest that, while LMDA services remain a vital resource for young people, demand is stabilizing among other age groups.
Finally, the increasing participation of workers aged 55+ over time underscores the growing importance of LMDA programs for older Canadians. Their engagement rose from 12.5% in 2014-15 to 13.9% in 2019-20, before a notable dip to 9.5% in 2020-21. However, recovery has occurred, with participation increasing to 12.6% in 2023-24.

Text description
| Client type | 2014-15 | 2015-16 | 2016-17 | 2017-18 | 2018-19 | 2019-20 | 2020-21 | 2021-22 | 2022-23 | 2023-24 |
|---|---|---|---|---|---|---|---|---|---|---|
| Youth (15-24 years old) | 19.4% | 20.6% | 20.4% | 21.0% | 22.3% | 20.9% | 24.5% | 24.6% | 22.1% | 20.9% |
| Core age (25-54 years old) | 68.1% | 66.9% | 66.7% | 65.5% | 63.1% | 65.1% | 65.9% | 65.4% | 65.3% | 66.1% |
| Workers aged 55+ | 12.5% | 12.4% | 12.9% | 13.5% | 13.4% | 13.9% | 9.5% | 10.0% | 12.3% | 12.6% |
- Notes:
- 1 This chart reflects clients served between April 1, 2014 and March 31, 2024.
- 2 Reported counts may be lower than actual numbers due to reliance on self-identification PPE-categorized data. As a result, totals may not precisely add to 100%.
- 3 LMDA data for YT and NU are estimated figures.
- 4 LMDA YT data for 2023-24 are estimates, based on last year's estimated figures.
- 5 Indigenous pan-Canadian clients are included.
Designated and under-represented groups
The table in this section shows year-over-year changes in representation for various designated and/or under-represented groups from 2022-23 to 2023-24. Notably, persons with disabilities saw an increase in representation from 16.6% to 17.7% (+1.1 percentage points), possibly reflecting progress in inclusivity efforts for this group.Footnote 23 Racialized people experienced a more substantial increase, with representation rising from 16.6% to 20.2% (+3.6 percentage points). This increase in representation for services corresponded to an increase in representation among the broader labour force for racialized people within the same fiscal period (an approximate 1.5 percentage points increase from 28.5% in 2022-23 to 2023-24).Footnote 24
In contrast, the proportion of clients who identified as Indigenous peoples declined, with representation dropping from 15.8% to 14.1% (-1.7 percentage points). In the broader labour force, by contrast, the representation of Indigenous workers remained stable (3.9% in 2022-23 to 3.8% in 2023-24).Footnote 25 The proportion of youth (15-24 years old) declined slightly, dropping from 21.6% to 20.3% (-1.3 percentage points). The representation of youth in the labour market at large remained constant between the 2 years (14.1%).Footnote 26
Older workers (aged 55 and older) had stable representation as clients (increasing from 11.8% to 12.0%) and within the broader labour force (decreasing from 21.5% to 21.3%).Footnote 27
The proportion of women that received supports declined slightly from 44.9% to 43.5% (-1.4 percentage points), where there was little change in the broader labour force (decreasing from 47.6% to 47.4%)Footnote 28.
| Designated and/or under-represented groups | 2022-23 Service provided | 2022-23 Representation (%) of total services | 2023-24 Service provided | 2023-24 Representation (%) of total services | Year-over-year (p.p.) |
|---|---|---|---|---|---|
| Persons with disabilities | 133,102 | 16.6% | 154,570 | 17.7% | +1.1 |
| Racialized people | 133,394 | 16.6% | 176,262 | 20.2% | +3.6 |
| Indigenous peoples | 126,968 | 15.8% | 122,930 | 14.1% | -1.7 |
| Youth (15-24 years old) | 173,779 | 21.6% | 176,583 | 20.3% | -1.3 |
| Older workers (aged 55+) | 95,253 | 11.8% | 104,248 | 12.0% | +0.2 |
| Women | 361,072 | 44.9% | 379,027 | 43.5% | -1.4 |
- Notes:
- 1 This table reflects services provided between April 1, 2023 and March 31, 2024.
- 2 Reported counts to designated groups may be lower than actual numbers due to reliance on voluntary self-identification.
- 3 LMDA data for YT and NU are estimated figures.
- 4 Indigenous pan-Canadian clients are included in all rows except Racialized people, which is an identity that these clients are not asked about.
- 5 Data for 2022-23 has been adjusted to enhance accuracy.
The table below highlights the distribution of services accessed by different demographic groups among LMDA clients, illustrating the levels of engagement in Employment Benefits versus Support Measures. Notably, Indigenous pan-Canadian programs do not separate services into these categories, instead providing a more integrated approach. Overall, for all LMDA clients, 192,365 services (23.5%) fell under Employment Benefits, while 627,664 services (76.5%) were Support Measures (i.e. EAS).
Some differences emerge for designated groups in accessing Employment Benefits compared to the general benchmark of 23.5%. While all groups accessed more Support Measures, youth accessed a higher proportion of Employment Benefits services, 27.9% (73,504 services), than any other designated group. Support Measures accounted for 72.1% (190,233 services) of services accessed by youth. This higher engagement in Employment Benefits may reflect fewer eligibility constraints or greater openness to training and wage subsidy programs compared to other groups. Older workers, in contrast, may be less inclined to participate in training programs that require a "return to school" later in life, while youth are more willing to take advantage of these opportunities.
One contributing factor may be eligibility requirements, as only active claimant clients, former claimant clients or PPE clients are eligible to receive Employment Benefits under LMDA. These eligibility criteria can limit Employment Benefits access for certain groups. Additionally, preferences and life stage considerations may play a role, particularly for older workers and women, who may prioritize Support Measures over training-based Employment Benefits.
Persons with disabilities accessed 26,554 Employment Benefits services (17.9%) and 122,141 Support Measures services (82.1%), while racialized people accessed 26,379 Employment Benefits services (15.0%) compared to 149,883 Support Measures services (85.0%). Similarly, older workers accessed 25,349 Employment Benefits services (16.7%) and 126,166 Support Measures services (83.3%) and women accessed 62,853 Employment Benefits services (17.8%) alongside 290,790 Support Measures services (82.2%). Indigenous peoples received 15,149 Employment Benefits services (21.3%) and 56,041 Support Measures services (78.7%), aligning more closely with the benchmark but still demonstrating a higher use of Support Measures.
| Designated and/or under-represented groups | Employment Benefit (EB) services | Employment Benefit % of the total services | Support Measures (SM) (i.e. EAS) | Support Measures % of the total services |
|---|---|---|---|---|
| All LMDA clients (for reference) | 192,365 | 23.5% | 627,664 | 76.5% |
| Persons with disabilities | 26,554 | 17.9% | 122,141 | 82.1% |
| Racialized people | 26,379 | 15.0% | 149,883 | 85.0% |
| Indigenous peoples | 15,149 | 21.3% | 56,041 | 78.7% |
| Youth (15-24 years old) | 73,504 | 27.9% | 190,233 | 72.1% |
| Older workers (aged 55+) | 25,349 | 16.7% | 126,166 | 83.3% |
| Women | 62,853 | 17.8% | 290,790 | 82.2% |
- Notes:
- 1 This table reflects services provided between April 1, 2023 and March 31, 2024.
- 2 This table excludes Indigenous pan-Canadian data because their services do not align with the Employment Benefits / Support Measures categorization.
- 3 Reported counts to designated groups may be lower than actual numbers due to reliance on voluntary self-identification.
- 4 LMDA data for YT and NU are estimated figures.
Official languages
To foster full recognition and use of English and French in Canadian society and to help ensure that labour market programs and services are delivered in both official languages, all LMDAs contain commitments by PTs to have programs and services delivered in both official languages where there is significant demand.
The tables below provide a breakdown of clients' official language preferences and the language in which services were delivered outside of Quebec during the 2023-24 fiscal year, where data was available. Clients with French-language preferences received 15,307 services, representing 1.9% of the national total of services (including Quebec's) and 2.4% of services of known client language outside of Quebec. Most of these services were provided in provinces with significant francophone populations such as Ontario, New Brunswick, Manitoba and Alberta. Their numbers of services provided to francophones compared to their numbers of services provided in French indicate that most francophones were served in their official language in these 4 provinces. Clients with English language preferences received 586,685 services, representing 71.5% of the national total and 92.0% of services of known client language outside of Quebec. Here 605,486 services were provided in English, indicating that anglophones outside of Quebec are well served in their official language.
Bilingual (English and French speaking) clients received 6,607 services, representing less than 1% of the national total and 1.0% of the services provided outside of Quebec. Clients of unknown language received 182,529 services (22.3% of the national total), 168,725 of which were provided in Quebec.
Clients using a non-official language received 28,900 services, making up 3.5% of the national total and 4.5% of services provided to clients of known language outside of Quebec. In comparison, only 11,046 services were delivered in non-official languages, 8,841 of which were provided in Ontario and 2,090 in Alberta.
| Province/Territory | French | English | Bilingual (English and French) | Non-Official language5 | Unknown | Total number of services |
|---|---|---|---|---|---|---|
| Newfoundland and Labrador | 47 | 18,022 | 24 | 9 | 159 | 18,261 |
| Prince Edward Island | 5 | 10,255 | 1,010 | 548 | 6 | 11,824 |
| Nova Scotia | 27 | 19,749 | n/a | n/a | 1,584 | 21,360 |
| New Brunswick | 3,131 | 18,458 | 5,372 | 45 | 19 | 27,025 |
| Quebec4 | n/a | n/a | n/a | n/a | 168,725 | 168,725 |
| Ontario | 5,569 | 201,032 | n/a | 62 | 324 | 206,987 |
| Manitoba | 3,482 | 100,162 | n/a | 7,300 | 73 | 111,017 |
| Saskatchewan | 17 | 11,538 | 48 | 198 | 6,636 | 18,437 |
| Alberta | 2,534 | 95,883 | n/a | 2,171 | 1,373 | 101,961 |
| British Columbia | 494 | 111,061 | 153 | 18,561 | 184 | 130,453 |
| Yukon | n/a | n/a | n/a | n/a | 749 | 749 |
| Northwest Territories | 1 | 521 | n/a | 4 | 11 | 537 |
| Nunavut | n/a | 4 | n/a | 2 | 2,686 | 2,692 |
| Totals by language | 15,307 | 586,685 | 6,607 | 28,900 | 182,529 | 820,028 |
- Notes:
- 1 This table reflects services provided between April 1, 2023 and March 31, 2024.
- 2 This table excludes Indigenous pan-Canadian data.
- 3 This table reflects the official language of choice or the language in which participants interacted with service providers, which may differ from the language of service delivery.
- 4 Quebec does not provide information on client language or language of service. Consequently, counts for French represent services provided to clients outside Quebec.
- 5 Refers to languages other than English and French, which are the official languages of the Government of Canada.
- 6 LMDA data for YT and NU are estimated figures.
| Province/Territory | French | English | Non-Official language5 | Unknown | Total number of services |
|---|---|---|---|---|---|
| Newfoundland and Labrador | 6 | 17,071 | n/a | 1,184 | 18,261 |
| Prince Edward Island | 9 | 11,671 | 114 | 30 | 11,824 |
| Nova Scotia | 639 | 18,915 | n/a | 1,806 | 21,360 |
| New Brunswick | 6,058 | 20,853 | 1 | 113 | 27,025 |
| Quebec4 | n/a | n/a | n/a | 168,725 | 168,725 |
| Ontario | 5,858 | 187,441 | 8,841 | 4,847 | 206,987 |
| Manitoba | 3,670 | 106,489 | n/a | 858 | 111,017 |
| Saskatchewan | n/a | 17,751 | n/a | 686 | 18,437 |
| Alberta | 2,180 | 95,346 | 2,090 | 2,345 | 101,961 |
| British Columbia | n/a | 129,454 | n/a | 999 | 130,453 |
| Yukon | n/a | n/a | n/a | 749 | 749 |
| Northwest Territories | n/a | 494 | n/a | 43 | 537 |
| Nunavut | n/a | 1 | n/a | 2,691 | 2,692 |
| Totals by Language | 18,420 | 605,486 | 11,046 | 185,076 | 820,028 |
- Notes:
- 1 This table reflects services provided between April 1, 2023 and March 31, 2024.
- 2 This table excludes Indigenous pan-Canadian data.
- 3 This table reflects the language in which the service was actually delivered, regardless of the client's preferred official language (OL).
- 4 Quebec does not provide information on client language or language of service. Consequently, counts for French represent services provided to clients outside Quebec.
- 5 Refers to languages other than English and French, which are the official languages of the Government of Canada.
- 6 LMDA data for YT and NU are estimated figures.
Targeting clients with the Targeting Referral and Feedback system
The Targeting, Referral and Feedback (TRF) system is a federal tool that provides provinces and territories with the client-level data to identify and provide outreach to EI applicants in a timely manner for a quicker return to the workforce. Each province and territory can set selection criteria to identify EI applicants who are likely candidates for jobs in demand or for programs available based on their labour market characteristics. These criteria are varied and can be revised, activated, or removed at any time in the TRF to match changes in the labour market, program offerings and available capacity.
In 2018, the LMDAs introduced a mandatory requirement for PTs to implement the TRF. All PTs have implemented the TRF as of 2021; increasing the utilization of the TRF is ongoing. ESDC tracks the number of referrals that are being sent daily to PTs for administrative purposes.
In 2023-24, more than 1.5 million applicants were processed across Canada, with 648,000 referrals made, representing an overall referral share of 42.9%. This marks a significant increase compared to the previous fiscal year, where the referral share was 36.8%. Notably, the Northwest Territories led the country in referral activity, referring 85.3% of applicants, a sharp increase from 48.5% the year prior. Newfoundland and Labrador (67.3%), Ontario (56.8%), with Nova Scotia (52.1%) and Quebec (49.9%) also saw around half of their applicants referred through the system.
| Provinces/Territories | % referrals from EI applicants, 2022-23 | % referrals from EI applicants, 2023-24 | Number of referrals, 2023-24 |
|---|---|---|---|
| Newfoundland and Labrador | 67.3% | 67.3% | 48,293 |
| Prince Edward Island | 0.0% | 0.0% | n/a |
| Nova Scotia | 10.6% | 52.1% | 32,424 |
| New Brunswick | 0.2% | 0.0% | n/a |
| Quebec | 49.4% | 49.9% | 199,861 |
| Ontario | 32.7% | 56.8% | 266,098 |
| Manitoba | 52.5% | 12.3% | 5,954 |
| Saskatchewan | 42.6% | 19.0% | 7,816 |
| Alberta | 25.0% | 23.1% | 38,556 |
| British Columbia | 38.5% | 29.3% | 47,619 |
| Yukon | 0.0% | 0.0% | n/a |
| Northwest Territories | 48.5% | 85.3% | 2,116 |
| Nunavut | 0.0% | 0.0% | n/a |
| Canada | 36.8% | 42.9% | 648,737 |
- Sources: Targeting, Referral and Feedback Dataset
Clients by province and territory
| Client type | Active claimants target4 | Active claimants served | Former claimants served | PPE clients served | Total insured clients served | Non-insured clients served | Total clients served |
|---|---|---|---|---|---|---|---|
| Newfoundland and Labrador | 5,000 | 3,775 | 2,082 | 219 | 6,076 | 1,126 | 7,202 |
| Prince Edward Island | 3,730 | 3,316 | 1,186 | 275 | 4,777 | 1,301 | 6,078 |
| Nova Scotia | 5,500 | 4,402 | 2,203 | 744 | 7,349 | 3,755 | 11,104 |
| New Brunswick | 9,700 | 4,581 | 2,654 | 802 | 8,037 | 5,719 | 13,756 |
| Quebec4 | 70,200 | 63,751 | 24,851 | 10,026 | 98,628 | 42,607 | 141,235 |
| Ontario | 27,784 | 33,812 | 39,929 | 17,948 | 91,689 | 62,048 | 153,737 |
| Manitoba | 5,000 | 5,822 | 4,138 | 2,905 | 12,865 | 12,687 | 25,552 |
| Saskatchewan | 33,000 | 5,299 | 4,969 | 3,788 | 14,056 | 718 | 14,774 |
| Alberta | 24,000 | 21,697 | 10,501 | 3,674 | 35,872 | 20,539 | 56,411 |
| British Columbia | 30,000 | 20,977 | 10,505 | 4,179 | 35,661 | 25,422 | 61,083 |
| Yukon | 200 | 212 | 0 | 0 | 212 | 0 | 4505 |
| Northwest Territories | 275 | 102 | 126 | 96 | 324 | 23 | 347 |
| Nunavut | 100 | 12 | 1 | 0 | 13 | 0 | 1,1805 |
| Total EBSM | 214,489 | 167,758 | 103,145 | 44,656 | 315,559 | 175,945 | 492,909 |
| Indigenous Pan-Canadian clients | 0 | 8,634 | 12,854 | 4,787 | 26,275 | n/a | 26,275 |
| Totals | 214,489 | 176,392 | 115,999 | 49,443 | 341,834 | 175,945 | 519,1845 |
- Notes:
- 1 This table reflects clients served between April 1, 2023 and March 31, 2024.
- 2 LMDA data for YT and NU are estimated figures.
- 3 QC includes both active and former claimants in the "Active claimants target" column, whereas other jurisdictions only include active EI claimants served.
- 4 "0" indicates data was not provided, while "n/a" indicates data is not available.
- 5 Row sums for YT and NU do not match the totals column, as they include 'Unknown' client types not displayed in this table.
3.2 Provincial and territorial activities
In this section
- 3.2.1 Newfoundland and Labrador
- 3.2.2 Prince Edward Island
- 3.2.3 Nova Scotia
- 3.2.4 New Brunswick
- 3.2.5 Quebec
- 3.2.6 Ontario
- 3.2.7 Manitoba
- 3.2.8 Saskatchewan
- 3.2.9 Alberta
- 3.2.10 British Columbia
- 3.2.11 Yukon
- 3.2.12 Northwest Territories
- 3.2.13 Nunavut
In 2023-24, Canada's LMDAs continued to be an essential tool for PTs, enabling them to design and deliver tailored employment programs that address their specific labour market needs. These agreements provide PTs the flexibility to implement tailored solutions that support local workers and employers. Under the LMDAs, PTs deliver programs and services that are similar to the EBSMs established under Part II of the EI Act.
The distinct needs and challenges of each PT are central to the LMDA framework. Each year, PTs carry out consultations with a diverse range of stakeholders-including employers, industry associations, labour unions, community groups, Indigenous organizations, post-secondary institutions and representatives of Official Language Minority Communities. These dialogues ensure that programs and services remain relevant to local labour market conditions, connecting job seekers to meaningful opportunities and providing businesses with access to skilled talent.
The approaches used for these consultations are as varied as the regions themselves. For example:
- Quebec uses a formal mechanism (Commission des partenaires du marché du travail) to engage all stakeholders on all Quebec programs at once
- New Brunswick implements Regional Labour Market Partnership Forums in 12 regions across the province
- Northwest Territories tailors its consultation process to each region of the territory via Regional Training Committees
- Alberta meets with stakeholders through ad hoc roundtables, national advisory committees and labour market information sessions
These targeted approaches allow PTs to gather crucial feedback and insights that directly inform their LMDA programming, ensuring a responsive and adaptable approach to evolving labour demands. By focusing on increasing labour market participation among underrepresented groups and enhancing employer access to a skilled workforce, PTs contribute to the inclusivity and resilience of Canada's economy.
Through the LMDA, each PT not only addresses local labour market challenges but also contributes to national economic goals by building a workforce that is skilled, diverse and ready for the future. The 2023-24 LMDA allocations reflect this commitment, as PTs work to bridge skills gaps, support workforce transitions and create employment pathways that benefit both individuals and communities.
Below are the 2023-24 LMDA allocations.
| Province/Territory | Base funding | Budget 2023 additional funding1 | Administrative funding | Total funding |
|---|---|---|---|---|
| Newfoundland and Labrador | $123,243,234 | $14,172,161 | $8,937,456 | $146,352,851 |
| Prince Edward Island | $22,445,126 | $3,653,405 | $2,695,332 | $28,793,863 |
| Nova Scotia | $74,859,795 | $15,818,382 | $10,148,601 | $100,826,778 |
| New Brunswick | $85,863,182 | $15,750,478 | $8,922,000 | $110,535,660 |
| Quebec | $539,963,982 | $100,726,245 | $58,920,000 | $699,610,227 |
| Ontario | $581,168,091 | $153,304,008 | $57,277,082 | $791,749,181 |
| Manitoba | $44,163,193 | $13,026,956 | $6,079,000 | $63,269,149 |
| Saskatchewan | $38,175,033 | $11,168,343 | $6,022,000 | $55,365,376 |
| Alberta | $155,484,268 | $49,641,471 | $9,594,000 | $214,719,739 |
| British Columbia | $275,380,128 | $46,474,213 | $20,535,000 | $342,389,341 |
| Yukon | $3,901,819 | $431,829 | $389,000 | $4,722,648 |
| Northwest Territories | $2,761,162 | $420,352 | $1,450,000 | $4,631,514 |
| Nunavut | $2,590,987 | $412,157 | $787,000 | $3,790,144 |
| Totals | $1,950,000,000 | $425,000,000 | $191,756,471 | $2,566,756,471 |
- Notes:
- 1 Announced in Budget 2023.
3.2.1 Newfoundland and Labrador
In this section
- Employment Benefits and Support Measures key facts
- Labour market context
- Canada-Newfoundland and Labrador Labour Market Development Agreement
- Designated and under-represented groups
- Stakeholder consultations
- Program delivery and participant supports
Employment Benefits and Support Measures key facts
| Indicator | Active claimant clients | Former claimant clients | PPE clients | Non-insured clients | Total |
|---|---|---|---|---|---|
| Number served | 3,775 | 2,082 | 219 | 1,126 | 7,202 |
| Share of total | 52.4% | 28.9% | 3.0% | 15.6% | 100.0% |

Text description
| Year | Youth (15-24 years old) | Core-age (25-54 years old) | Workers aged 55+ |
|---|---|---|---|
| 2014-15 | 26.6% | 62.5% | 10.9% |
| 2015-16 | 26.6% | 62.8% | 10.6% |
| 2016-17 | 23.6% | 64.5% | 11.8% |
| 2017-18 | 23.6% | 64.1% | 12.3% |
| 2018-19 | 23.8% | 62.4% | 13.5% |
| 2019-20 | 25.0% | 62.0% | 12.8% |
| 2020-21 | 26.4% | 62.8% | 10.7% |
| 2021-22 | 28.9% | 62.3% | 8.8% |
| 2022-23 | 27.9% | 60.0% | 11.9% |
| 2023-24 | 28.6% | 60.2% | 11.0% |
- Notes:
- 1 This chart reflects clients served between April 1, 2014 and March 31, 2024.

Text description
| Year | Active claimant clients | Former claimant clients | PPE clients | Non-insured clients |
|---|---|---|---|---|
| 2014-15 | 8,850 | 2,513 | n/a | 1,126 |
| 2015-16 | 8,941 | 2,095 | n/a | 1,297 |
| 2016-17 | 9,308 | 1,812 | n/a | 1,232 |
| 2017-18 | 9,390 | 2,370 | n/a | 1,107 |
| 2018-19 | 7,716 | 1,371 | 124 | 542 |
| 2019-20 | 5,831 | 2,284 | 281 | 1,253 |
| 2020-21 | 4,090 | 1,526 | 196 | 1,001 |
| 2021-22 | 4,596 | 1,467 | 220 | 1,003 |
| 2022-23 | 4,023 | 1,893 | 237 | 1,009 |
| 2023-24 | 3,775 | 2,082 | 219 | 1,126 |
- Notes:
- 1 This chart reflects clients served between April 1, 2014 and March 31, 2024.
| Service type | Services delivered | Year-over-year change | Share of total | Year-over-year change (p.p.) |
|---|---|---|---|---|
| Employment Benefits | 6,167 | +5.1% | 33.8% | -3.5 |
| Employment Assistance Services | 12,094 | +22.8% | 66.2% | +3.5 |
| Total services | 18,261 | +16.2% | 100.0% | n/a |
- Notes:
- 1 This table reflects all new services started between April 1, 2023 and March 31, 2024.
| Employment Benefits | Services | Year-over-year change | Expenditures | Year-over-year change |
|---|---|---|---|---|
| Targeted Wage Subsidies | 696 | -10.7% | $9,606,094 | -5.6% |
| Self-Employment | 171 | -20.8% | $5,604,508 | -7.9% |
| Job Creation Partnerships | 797 | -20.1% | $7,777,980 | -12.8% |
| Skills Development-Regular | 3,283 | +19.0% | $57,522,000 | -3.6% |
| Skills Development-Apprentices | 1,220 | +9.2% | Included above | Included above |
| Targeted Earning Supplements | 0 | n/a | n/a | n/a |
| Totals | 6,167 | +5.1% | $80,510,919 | -52.6% |
- Notes:
- 1 This table reflects all new services started between April 1, 2023 and March 31, 2024.
| Support Measures | Services | Year-over-year change | Expenditures | Year-over-year change |
|---|---|---|---|---|
| Employment Services | 5,972 | +16.6% | $12,315,876 | -30.6% |
| Individual Counselling | 6,122 | +29.5% | Included above | Included above |
| Labour Market Partnerships | n/a | n/a | $19,394,347 | -64.3% |
| Research & Innovation | n/a | n/a | $25,194,253 | +284.2% |
| Totals | 12,094 | +22.8% | $56,904,476 | -27.6% |
- Notes:
- 1 This table reflects all new services started between April 1, 2023 and March 31, 2024.

Text description
| Year | Unpaid EI benefits | Returns to employment | Active claimant clients served | Total clients served |
|---|---|---|---|---|
| 2014-15 | $25,346,330 | 3,298 | 8,850 | 12,489 |
| 2015-16 | $22,251,760 | 3,306 | 8,941 | 12,333 |
| 2016-17 | $23,234,836 | 3,696 | 9,308 | 12,352 |
| 2017-18 | $17,468,413 | 2,795 | 9,390 | 12,867 |
| 2018-19 | $16,161,345 | 3,055 | 7,716 | 9,753 |
| 2019-20 | $16,744,493 | 2,990 | 5,831 | 9,649 |
| 2020-21 | $9,698,804 | 1,536 | 4,090 | 6,813 |
| 2021-22 | $23,563,713 | 3,002 | 4,596 | 7,286 |
| 2022-23 | $16,693,473 | 2,179 | 4,023 | 7,162 |
| 2023-24 | $15,606,524 | 1,770 | 3,775 | 7,202 |
- Notes:
- 1 Volatility in the estimated Unpaid EI Benefits from 2021‑22 to 2022‑23 correlates with the speed of recovery of the labour market that allowed many Canadians to return to work before exhausting their EI benefits.
- 2 This table excludes Indigenous pan-Canadian clients.
- 3 The employment returns reported apply specifically to EI-insured clients (active claimants, former claimants and PPE clients).
Labour market context
In 2023-24, Newfoundland and Labrador continued to face a tight labour market, with historically low levels of unemployment and ongoing human resources challenges. Significant labour shortages contributed to a strong demand for training and employment supports to help both employers and employees adapt to evolving needs. Key sectors such as retail, food service, accommodations and healthcare continued to experience high labour demands.
The unemployment rate for individuals aged 15 and over declined to 10.0% in 2023, compared to 11.3% in 2022.Footnote 29 In contrast, Canada's national unemployment rate was 5.4% in 2023 and 5.3% in 2022.Footnote 30
Despite these improvements, the province's labour market remained characterized by skills mismatches and an aging population, both of which created an ongoing challenge for employers.
As of March 2024, the province had nearly 3,500 job vacanciesFootnote 31 compared to 27,400 individuals who were unemployed, had searched for work in the last 4 weeks and were available for employment.Footnote 32
In response to these challenges, there remained a strong need for training supports, particularly in emerging sectors and industries. Stakeholders continue to emphasize the importance of enhanced collaboration, better access to labour market information and addressing skills gaps through targeted development and experiential learning opportunities. Efforts to attract and retain talent, including the recognition of foreign credentials and increases in immigrations, remain crucial to supporting the province's labour market needs.
Canada-Newfoundland and Labrador Labour Market Development Agreement
In 2023-24, Newfoundland and Labrador received approximately $146 million though the LMDA, supporting programs and services that addresses the province's labour market challenges. Approximately 7,200 clients were served (about half of the previous year) and within 6 months of receiving training and employment supports, approximately 39% of active claimant clients had secured employment (down from 48.5%), resulting in an estimated $15.6 million in unpaid EI benefits.
The LMDA continued to play a pivotal role in addressing the province's labour market challenges. By offering a variety of programs and services, the LMDA has consistently demonstrated positive outcomes for diverse groups of clients, employers and communities. These investments supported economic growth, educational advancement, job creation and overall economic development in Newfoundland and Labrador.
In 2023-24, the LMDA funded the delivery of the following programs:
- Wage Subsidies
- Job Creation Partnerships
- Self-Employment Assistance
- Skills Development
- Employment Assistance Services
- Labour Market Partnerships
- Research and Innovation
The Skills Development program, a key program under the LMDA, provided financial assistance to EI-insured participants, helping them gain the skills needed for employment. By covering training costs beyond tuition fees, the program ensured greater accessibility and affordability for participants, removing financial barriers for participants.
In 2023-24, an investment of $49,799,370 was allocated to the Skills Development program, which included providing 1,907 clients with access to post-secondary training. This strategic funding not only enhanced participant's skills, but also improved their employability in a competitive labour market.
Additionally, Newfoundland and Labrador in collaboration with community organizations, delivered the Supported Employment program to develop employment opportunities for individuals with intellectual disabilities. This program provides tailored support to allow eligible individuals to participate to engage in integrated community employment. Services range from job orientation and analysis to full-time assistance from job trainers, providing participants with the support they need to meet job requirements and succeed in their roles.
In 2023-24, an investment of $2,249,520 provided essential job support for individuals with intellectual disabilities. As a result, 1,324 individuals participated in the program, with 150 successfully securing employment, showcasing the program's impact in promoting workforce inclusion and empowering individuals with intellectual disabilities to thrive in the job market.
Designated and under-represented groups
Newfoundland and Labrador continued its commitment to addressing labour market challenges by focusing on supporting designated and under-represented groups, including persons with disabilities, youth, Indigenous peoples and women. In 2023-24, LMDA funding was allocated towards initiatives aimed at reducing barriers to employment and providing tailored training and work opportunities tailored for these groups.
For example, in 2023-24, Supported Employment Corporations received $92,104 in funding to enhance opportunities for individuals with autism spectrum disorder. These corporations focused on helping participants develop action plans and employment strategies, while building personal, social and communications skills essential for workplace success. As a result, this initiative supported 44 individuals, helping them overcome barriers and achieve meaningful employment.
Additionally, the Office for Indigenous and Northern Skilled Trades (OINST), delivered by Trades Newfoundland and Labrador, received $1,787,265 in funding for 2023-24 to advance efforts. The program expanded its reach with offices in St. John's, Corner Brook and Happy Valley-Goose Bay, promoting skilled trades as a viable career path for Indigenous people. In total, OINST engaged 816 participants during the year, with 147 successfully securing employment in skilled trades industries.
Stakeholder consultations
In 2023-24, Newfoundland and Labrador maintained its commitment to engaging industry, labour, community and education stakeholders to ensure programs and services remained effective, relevant and responsive to evolving labour market needs.
The Workforce Innovation Centre (WIC) played a pivotal role in these efforts by hosting engagement sessions with underrepresented groups such as Indigenous peoples, persons with disabilities, youth, older workers, women and newcomers. These sessions provided a platform to explore labour market challenges and opportunities, with findings directly informing program and policy development.
Key themes emerging from these consultations highlighting the importance of fostering collaboration and partnerships, improving access to labour market information and addressing skills gaps through development and mentorship opportunities. Stakeholders also emphasized the need to prioritize key sectors such as healthcare, construction and renewable energy, while preparing the workforce for the adoption of emerging technologies, including automation and artificial intelligence. Additionally, consultations highlighted the necessity of promoting diverse and inclusive workplaces, particularly for newcomers and enhancing accessibility to programs and services to ensure equitable opportunity for all.
Grieg Seafood Newfoundland (GSN)
Grieg Seafood Newfoundland (GSN), located in Marystown, Newfoundland and Labrador, faced a significant challenge in finding qualified local workers to operate its land-based and marine-based aquaculture facilities. To address this, GSN received funding through the Labour Market Partnership program to support industry adjustment and deliver technician skills training to 22 individuals from the local community. This initiative prioritized those experiencing long-term workforce needs through micro-learning, attraction and retention; the development of hydrogen-focused post-secondary curriculum and courses; the creating of greater awareness of job opportunities ad requirements in clean growth; and the promotion of clean energy innovation in Newfoundland and Labrador.
Participants also engaged in hands-on work placements at GSN, equipping participants with the skills needed for success in the aquaculture industry. Of the 20 participants who completed the program, 18 secured employment with GSN, demonstrating the initiative’s effectiveness in bridging the gap between unemployment and meaningful employment. Funded over a 30-week period at a total cost of $132,063, the project highlights the transformative impact of targeted skills training in addressing local labour market needs and fostering local economic development in the region.
Program delivery and participant supports
This section provides an overview of the specific programs and financial supports available under the LMDA. It includes specific details on the programs/initiatives available, their duration associated funding and additional supports provided to participants. This aims to demonstrate how these programs and initiatives align with federal and provincial priorities and support labour market integration.
Skills Development
Program: Skills Development
Expenditures: $49,799,370 (36.9%)
Description: Assists EI-insured participants in need of financial assistance to obtain the skills needed for employment, ranging from basic to advanced skills through direct assistance to individuals. Funding covers costs paid to publicly funded training institutions beyond tuition recovery
Target client groups: EI Insured participants
Benefits and expected results: 1,907 clients received funding for post-secondary training
Program: Adult Basic Education (ABE) supports
Expenditures: $1,537,763 (1.1%)
Description: Provides support for EI- eligible clients to participate in ABE or General Educational Development (GED) preparation. Program targets EI-eligible clients. Tuition for some clients was paid directly by the Department of Education to ABE service providers and individual supports were paid under the Skills Development Employment Benefit
Target client groups: EI Insured participants
Benefits and expected results: 598 clients received benefits enabling participation and progress towards post- secondary training
Program: Apprenticeship Supports
Expenditures: $6,746,275 ($1,402,153 for individual supports and $5,344,122 for tuition costs) (5.0%)
Description: Provides financial assistance to apprentices, directed by Newfoundland and Labrador to attend full-time, in-school apprenticeship training, assistance includes living allowance, dependent care and travel costs
Tuition costs were issued directly to training institutions by the Apprenticeship and Trades Certification Division.
Target client groups: EI Insured participants
Benefits and expected results: 1,286 apprentices benefitted, progressing toward journeyperson certification
Program: Educational assessments
Expenditures: $40,000 (0.1%)
Description: An educational assessment helps identify strengths and areas for improvement in academic and cognitive functioning. It can reveal learning disabilities, intellectual disabilities, or giftedness. This type of assessment is particularly valuable for individuals facing academic or workplace learning challenges, as it provides a deeper understanding of the underlying causes and supports effective employment planning
Target client groups: EI Insured participants
Benefits and expected results: 17 clients received funding for educational assessments
Program: Job Creation Partnerships program (JCP)
Expenditures: $7,777,980 (5.8%)
Description: Provides EI-insured participants with meaningful work experience to improve their employment prospects. While project activities offer benefits to both the participant and the community, the primary focus is on helping insured participants gain the work experience needed to secure lasting employment. Through JCP, participants will maintain or enhance their employability skills in a practical setting. EI-Eligible participating may receive a living allowance and sponsors may qualify for assistance with project overhead cost
Target client groups: EI Insured participants
Benefits and expected results: 867 individual clients received funding to participate in 198 JCP projects
Wage subsidies
Program: Supported Employment program
Expenditures: $2,249,520 (1.7%)
Description: Delivered in partnership with community organizations, this program creates meaningful employment opportunities for individuals with intellectual disability. It offers tailored support to allow eligible individuals to participate in meaningful, integrated employment within the community
The program provides a range of supports, from orientation and job analysis to full-time assistance from a job trainer, ensuring that the participants successfully meet workplace exceptions and employer satisfaction
Target client groups: EI Insured participants
Benefits and expected results: 1,324 individuals participated; 150 successful gained meaningful employment
Program: Wage Subsidy Community Coordinator
Expenditures: $597,082 (0.4%)
Description: Receives contribution to encourage employers to hire female apprentices by offering wage subsidies to provide work experience that supports progression towards journeyperson status. The program targets EI-eligible women apprentices
Target client groups: EI Insured participants
Benefits and expected results: 34 placements were secured for clients by the Office to Advance Women Apprentices, supporting women apprentices in non-traditional occupations
Program: Jobs NL Wage Subsidy
Expenditures: $3,373,952 (2.5%)
Description: Connects employers and employees together by providing wage subsides for sustainable long-term employment or seasonal employment
2 streams were offered:
- Jobs NL- 42: Provides a wage subsidy over 28 weeks within 42-week period of employment period:
- First 14 weeks: 60% subsidy, up to $12 per hour
- Second 14 weeks: no subsidy
- Third 14 weeks: 80% subsidy, up to $12 per hour
- Jobs NL- 28: Provides a wage subsidy for a period of 10 to 28 weeks; supporting seasonal or short-term employment with a 60% subsidy, up to $12 per hour
Target client groups: EI Insured participants
Benefits and expected results: 507 clients work experience
Program: Apprentice Wage Subsidy (AWS) program
Expenditures: $3,253,762 (2.4%)
Description: Assists apprentices in gaining work experience in a skilled trade and progress towards journeyperson certification. Employers hiring apprentices receive a 75% wage subsidy, up to $14/hour, which is paid directly to the employer
Target client groups: EI Insured participants
Benefits and expected results: 362 apprentices acquired work experience towards journeyperson certification
Program: Opening Doors program
Expenditures: $39,303 (0.1%)
Description: Provides a wage subsidy to hire EI-eligible clients with disabilities for full-time, permanent positions within provincial government departments for a maximum of 52 weeks. These roles are specifically designated for persons with disabilities
It also provides resources and support to public service leaders, including information, advice and training, on disability related employment issues. Additionally, career support services provide practical job search and career counselling assistance to persons with disabilities registered with the Office's Client Registry.
Target client groups: EI Insured participants
Benefits and expected results: 1 client obtained work experience and career support services to support the transition into employment
Program: Employment Enhancement program
Expenditures: $92,475 (0.1%)
Description: Support employers in secondary processing sectors (forestry, aquaculture, agriculture and fishing) by providing funding to create sustainable, long-term employment or seasonal employment opportunities and training allowance for new employees
Target client groups: EI Insured participants
Benefits and expected results: 27 individuals gained work experience across 8 participating employers
Self-employment assistance
Program: Community coordinator
Expenditures: $2,494,716 (18.5%)
Description: Provides funding to organizations to assist eligible unemployed clients with starting entrepreneurial training, general information sessions and business plan development
Target client groups: EI Insured participants
Benefits and expected results: 17 organizations were provided with funding under this activity
Labour Market Partnerships
Program: Labour market integration for newcomers
Expenditures: $3,089,688 (2.3%)
Description: Provides funding to organizations for pilot initiatives aimed at helping unemployed newcomers integrate into the workforce. These initiatives enable service providing organizations, groups and communities to develop and deliver programs that expedites newcomers' entry into the labour market, support advancement in their professional fields and promote career progression
Target client groups: EI Insured participants
Benefits and expected results: 22 projects were supported with 5 different organizations
Program: Labour Market Partnerships
Expenditures: $16,304,660 (12.0%)
Description: Support employers, employer or employee associations, community groups and communities in develop and implement labour market strategies and activities to address labour force adjustments and meet human resource requirements. These partnerships focus on identifying labour market challenges, helping employed individuals at risk of job loss and fostering a positive outcome through collaborative initiatives. These initiatives address the employment needs of persons with disabilities, newcomers, Indigenous peoples and needs of specific labour market sector such as: agriculture, petroleum, healthcare, skilled trades, early childhood education, environment, fisheries and aquaculture, tourism and hospitality and information technology
Target client groups: EI Insured participants
Benefits and expected results: 50 projects received support under this program activity
Employment Assistance Services
Program: Employment Assistance Services (EAS) program
Expenditures: $12,315,876 (9.1%)
Description: Provides funding to organizations to offer Employment Assistance Services (EAS) to unemployed or underemployed individuals in individual or in a group setting
Key services include self-serve employment resources, needs assessments, development of employment plans, case management, employment counselling and workshops on topics such as job search, resume writing and transitional employment support.
Target client groups: EI Insured participants
Benefits and expected results: 48 agreements were funded, resulting in over 18,261 services provided to clients
Research and Innovation
Program: Research and Innovation
Expenditures: $25,194,253 (18.7%)
Description: Provides funding support for research and innovative projects that explore and identify better ways of helping individuals prepare for and attach to the labour market as productive employees
Target client groups: Research institutions
Benefits and expected results: One key outcome of the Research and Innovation program is the micro-credential pilot, which helps individuals gain industry-recognized skills while working. This initiative addresses labour market gaps, supports under-represented groups and create pathways to higher-paying, sustainable employment
3.2.2 Prince Edward Island
In this section
- Employment Benefits and Support Measures key facts
- Labour market context
- Canada-Prince Edward Island Labour Market Development Agreement
- Designated and under-represented groups
- Stakeholder consultations
- Program delivery and participant supports
Employent Benefits and Support Measures key facts
| Indicator | Active claimant clients | Former claimant clients | PPE clients | Non-insured clients | Total |
|---|---|---|---|---|---|
| Number served | 3,316 | 1,186 | 275 | 1,301 | 6,078 |
| Share of total | 54.6% | 19.5% | 4.5% | 21.4% | 100.0% |
- Notes:
- 1 This table reflects clients served between April 1, 2023 and March 31, 2024.

Text description
| Year | Youth (15-24 years old) | Core-age (25-54 years old) | Workers aged 55+ |
|---|---|---|---|
| 2014-15 | 28.4% | 61.8% | 9.8% |
| 2015-16 | 29.6% | 60.1% | 10.3% |
| 2016-17 | 30.0% | 61.1% | 8.9% |
| 2017-18 | 39.3% | 52.2% | 8.5% |
| 2018-19 | 40.3% | 47.7% | 8.2% |
| 2019-20 | 46.6% | 45.5% | 7.9% |
| 2020-21 | 53.0% | 41.7% | 5.3% |
| 2021-22 | 51.6% | 42.8% | 5.6% |
| 2022-23 | 51.5% | 43.0% | 5.4% |
| 2023-24 | 49.4% | 44.5% | 6.1% |
- Notes:
- 1 This chart reflects clients served between April 1, 2014 and March 31, 2024.

Text description
| Year | Active claimant clients | Former claimant clients | PPE clients | Non-insured clients |
|---|---|---|---|---|
| 2014-15 | 2,709 | 621 | n/a | 1,470 |
| 2015-16 | 2,876 | 657 | n/a | 1,681 |
| 2016-17 | 2,798 | 709 | n/a | 1,893 |
| 2017-18 | 3,487 | 784 | n/a | 1,852 |
| 2018-19 | 3,624 | 712 | 438 | 1,595 |
| 2019-20 | 3,293 | 739 | 421 | 1,408 |
| 2020-21 | 3,354 | 552 | 243 | 864 |
| 2021-22 | 3,807 | 752 | 231 | 843 |
| 2022-23 | 3,717 | 955 | 286 | 974 |
| 2023-24 | 3,316 | 1,186 | 275 | 1,301 |
- Notes:
- 1 This chart reflects clients served between April 1, 2014 and March 31, 2024.
| Service type | Services delivered | Year-over-year change | Share of total | Year-over-year change (p.p.) |
|---|---|---|---|---|
| Employment Benefits | 3,566 | -9.4% | 30.2% | -4.0 |
| Employment Assistance Services | 8,258 | +9.0% | 69.8% | +4.0 |
| Total services | 11,824 | +2.7% | 100.0% | n/a |
- Notes:
- 1 This table reflects all new services started between April 1, 2023 and March 31, 2024.
| Employment Benefits | Services | Year-over-year change | Expenditures | Year-over-year change |
|---|---|---|---|---|
| Targeted Wage Subsidies | 365 | -11.4% | $3,339,000 | -13.9% |
| Self-Employment | 104 | +6.1% | $1,488,501 | -2.7% |
| Job Creation Partnerships | 16 | 0.0% | $233,684 | -5.5% |
| Skills Development-Regular | 2,578 | -13.6% | $14,388,000 | +10.7%% |
| Skills Development-Apprentices | 503 | +18.1% | Included above | Included above |
| Targeted Earning Supplements | 0 | n/a | n/a | n/a |
| Totals | 3,566 | -9.4% | $19,448,629 | +4.3% |
- Notes:
- 1 This table reflects all new services started between April 1, 2023 and March 31, 2024.
- 2 2022-23 EI MAR Revision: PE targeted wage subsidies should have been $3,877,113 and skills development should have been $12,993,142.
| Support Measures | Services | Year-over-year change | Expenditures | Year-over-year change |
|---|---|---|---|---|
| Employment Services | 6,774 | +4.7% | $5,052,517 | -6.5% |
| Individual Counselling | 1,484 | +34.1% | Included above | Included above |
| Labour Market Partnerships | n/a | n/a | $1,597,385 | -10.9% |
| Research & Innovation | n/a | n/a | n/a | n/a |
| Totals | 8,258 | +9.0% | $6,649,902 | -7.6% |
- Notes:
- 1 This table reflects all new services started between April 1, 2023 and March 31, 2024.
- 2 Individual counselling is an intervention and expenditures are reflected within the employment services support measure.

Text description
| Year | Unpaid EI benefits | Returns to employment | Active claimant clients served | Total clients served |
|---|---|---|---|---|
| 2014-15 | $6,080,074 | 1,934 | 2,709 | 4,800 |
| 2015-16 | $6,986,476 | 1,997 | 2,876 | 5,214 |
| 2016-17 | $7,144,450 | 2,081 | 2,798 | 5,400 |
| 2017-18 | $7,125,047 | 2,202 | 3,487 | 6,123 |
| 2018-19 | $6,662,407 | 2,470 | 3,624 | 6,369 |
| 2019-20 | $6,816,141 | 2,508 | 3,293 | 5,861 |
| 2020-21 | $5,594,866 | 1,920 | 3,354 | 5,013 |
| 2021-22 | $16,837,056 | 2,782 | 3,807 | 5,633 |
| 2022-23 | $11,399,293 | 2,815 | 3,717 | 5,932 |
| 2023-24 | $6,823,130 | 2,463 | 3,316 | 6,078 |
- Notes:
- 1 Volatility in the estimated Unpaid EI Benefits from 2021‑22 to 2022‑23 correlates with the speed of recovery of the labour market that allowed many Canadians to return to work before exhausting their EI benefits.
- 2 This table excludes Indigenous pan-Canadian clients.
- 3 The employment returns reported apply specifically to EI-insured clients (active claimants, former claimants and PPE clients).
Labour market context
In 2023-24, Prince Edward Island's economy showed continued resilience, building on the recovery momentum from previous years. The province's employment outlook remained positive, supported by widespread employment gains, notably in healthcare and social assistance, accommodation and food services and agriculture. Despite external challenges, the province's economic performance remained steady, marked by a declining unemployment rate and a strengthening job market.
The unemployment rate for those aged 15 and over in Prince Edward Island was 7.3% in 2023, an improvement from 7.6% in the previous year.Footnote 33 In comparison, Canada's unemployment rate in 2023 was 5.4%, slightly higher than 5.3% in 2022.Footnote 34
Similar to other provinces, Prince Edward Island population continues to age. However, since 2016, the province has been experienced higher levels of population growth, with the median age declining since 2017 due to the large number of immigrants and non-permanent residents under the age of 40 entering the province.
Canada-Prince Edward Island Labour Market Development Agreement
In 2023-24, Prince Edward Island received approximately $28.8 millionFootnote 35 though the LMDA. The funding served approximately 6,100 clients, including 3,300 being active claimant clients. Within 6 months of receiving training and employment supports, 48.5% of active claimant clients were employed, contributing to an estimated $6.8 million in savings from unpaid EI benefits.
The Canada-Prince Edward Island LMDA supports the following provincial priorities:
- developing a skilled workforce
- preparing the future workforce
- enhancing services for job seekers
Programs delivered under the Canada-Prince Edward Island LMDA in 2023-24 include:
- Employment Assistance Services
- Labour Market Partnerships
- Skills Development
- Employer supported programs
- Work experience
- Entrepreneurship
- Skills Development and Employment Supports - Accessibility supports
For example, the province delivered the Skills Development program focused on adult education, post-secondary, apprenticeship, group-based training and industry-specific initiatives. Individuals were referred by employment counsellors to develop marketable and occupational skills they need to find work in Prince Edward Island through training at public or private institutions. In 2023-24, 4,500 individuals participated in these training programs, enhancing their employment prospects.
In Prince Edward Island, Employer Supported programs (which includes Employ PEI & Graduate Mentorship Program) help employers hire unemployed individuals and recent graduates. These programs provided participants with valuable mentorship and with on-the-job work experience. In 2023-24, 539 individuals participated in the program.
Designated and under-represented groups
Prince Edward Island actively considers the needs of designated and underrepresented groups, particularly individuals with disabilities, in its program planning and development. Through ongoing engagement with stakeholders, like the Supported Employment Network and the Access Ability Supports Advisory Council, the province ensures that programs are responsive to the unique challenges while promoting inclusivity. Initiatives include flexible funding for pilot programs, employer support for accommodating individuals with disabilities and increasing awareness of the benefits of an inclusive workforce.
In 2023-24, there was a 25.8% increase in clients identifying as a person with a disability and a 29.0% increase in clients identifying as visible minority compared to the prior fiscal year. Approximately 65.0% of clients served in 2023-24 were 30 years or younger, reflecting continued efforts to support youth in the workforce.
Stakeholder consultations
Prince Edward Island engages with stakeholders annually to determine provincial priorities and align program with workforce needs. This consultation process includes input from a broad range of stakeholders, including employers, educational institutions, industry associations and equity-deserving groups.
A key initiative in 2023 was Workforce Day: 2023 Investing in People, which brought together over 150 participants to address labour market challenges, share best practices and explore innovative solutions. Discussions emphasized aligning training with industry needs, fostering inclusive workplaces and increasing access to experiential learning opportunities.
Key themes that emerged from the consultations included the need for training that aligns with technological advancements, such as automation and artificial intelligence and supports the growing demand for digital skills. There was also a strong focus on maximizing workforce participation by ensuring all Islanders, including underrepresented groups, have access to skills development opportunities.
Career Bridges
Career Bridges is a 12-week employment skills program designed to help unemployed and underemployed clients re-enter the workforce. The program includes vocational assessment, career exploration, planning and decision making through 6 weeks of classroom training, followed by 6 weeks of on-the-job training and work placements, providing participants with practical skills and experience. The program targets the 4 employability dimensions including career/occupational decision making, skills enhancement, job search skills and employment maintenance. Career Bridges offers participants insight into various careers available in Prince Edward Island, helping them set realistic and obtainable goals for sustainable employment.
The 12-week program consists of 3 phases:
- Diagnostic/Self-Assessment
- Job Search Skills and Employability Skills
- Work Exposure
Career Bridges operates from 4 locations across Prince Edward Island, with offices in Charlottetown, Summerside, O'Leary and Montague.
Client testimonial "Career Bridges changed my life. This program taught me how to believe in myself and challenge my goals. I gained intel on what options were available and more importantly the confidence to reach my goals. I highly recommend it to others seeking an opportunity to not only re-enter the workforce, but give you the tools and the confidence to purse your dreams."
Program delivery and participant supports
This section provides an overview of the specific programs and financial supports available under the LMDA. It includes specific details on the programs/initiatives available, their duration associated funding and additional supports provided to participants. This aims to demonstrate how these programs and initiatives align with federal and provincial priorities and support labour market integration.
Program: Employment Assistance Services (EAS)
Expenditures: $5,052,517 (19.3%)
Description: Employment Assistance Service centers offer an integrated bundle of employment services to help participants understand, prepare for and meet the needs of the provincial labour market. EAS centers also support job seekers with services such as job search, job matching and career counselling.
Target client groups: The Department of Workforce, Advanced Learning and Population funds 11 Employment Assistance Services providers across the province to assist Islanders in preparing for, obtaining and maintaining employment. The Employment Assistance Services program provides individuals access to various services, including employment counseling, career planning, personal and professional development and job search training with labour connections.
EAS providers offer services for unemployed and underemployed Islanders at 26 locations across the province. The network of 11 service providers are part of a service delivery approach that provides a full range of responsive, accessible and client centered labour market programming. Approximately 70 case managers work for the network across the province providing employment services.
The case managers are responsible for developing the action plan with clients and are responsible for monitoring and reporting through the performance measurement framework. All participants accessing public funding must develop a plan and be monitored through the national performance measurement framework.
Benefits and expected results:
- to equip Islanders to prepare for employment, to obtain employment and to maintain employment
- expand access to client services across the province
- evolve delivery model to include access to services via digital and non-standard work week
- standardized monitoring and reporting for all participants
Program: Labour Market Partnership: Workforce Development Projects for Labour Force Adjustments
Expenditures: $1,597,385 (6.1%)
Description: Short term funding to encourage groups to work in partnership to develop activities or strategies that assist individuals or employers who are impacted by labour market challenges in a community or an industry
Target client groups: Unemployed and underemployed individuals and underrepresented groups
Benefits and expected results:
- to support industry sectors with planning and strategies to address labour market priorities
- to provide human resource support to small businesses that need HR expertise
- The continued focus will be on sector councils and partnerships to address labour market trends, providing human resource expertise to small business owners to support workforce development growth and further identification of industry training needs
- upskilling and reskilling workers to address industry training needs/gaps, build business competitiveness and to ensure labour market participants have the required skills and credentials to fill labour market gaps/opportunities
Program: Skills Development
Expenditures: $14,387,535 (55.1%)
Description: The department funds skills development programs such as adult education, postsecondary, apprenticeship, group-based training and industry-specific initiatives to assist unemployed, employed and underemployed individuals and access to skills training to meet emerging requirements to succeed in the workforce now and into the future
Target client groups: Adult students, unemployed and underemployed individuals, employed workers, apprentices and underrepresented groups
Benefits and expected results:
- to provide case-managed individuals with access to appropriate training and educational opportunities related to current and emerging employment opportunities
- to increase the number of individuals who find sustainable employment as result of receiving financial assistance in support of a training intervention
- to invest in short-term group-based training initiatives enhancing job readiness skills, essential skills and provide a valuable work experience to assist unemployed individuals make a successful transition to the labour market
- to collaborate with industry partners to identify possible solutions to address current and emerging skills shortages in priority areas such as apprenticeship, healthcare and early childhood education to ensure future sustainability
- to support labour force development by providing financial assistance to employers to train employed and underemployed workers to meet workforce needs and increase skill levels to meet job-specific and incremental industry requirements
Program: Employer Supported Programs (EmployPEI & Graduate Mentorship Program)
Expenditures: $3,338,909 (12.8%)
Description: Employment programs to assist Island employers to hire unemployed individuals and recent graduates and provide them with an on-the-job work experience and mentorship to enhance the individual's skills and employability ideally leading to a full-time job. Focus will be on experiential learning opportunities that align with field of study
Target client groups: Job seekers - unemployed and underemployed individuals including unemployed recent graduates
Benefits and expected results:
- to link recent post-secondary graduates with a valuable work experience in their field of study through a mentored work experience
- to connect employers to a skilled and job ready workforce to meet their needs
- to create experiential learning and mentorship opportunities to retain newcomers and create employment pathways for youth and underrepresented groups
Program: Work Experience: Labour Force Development
Expenditures: $233,684 (0.9%)
Description: An employment program that provides financial support to non-profit organizations for short-term projects while providing insured individuals with a work experience to enhance their employability skills
Target client groups: Unemployed and underemployed individuals and underrepresented groups
Benefits and expected results:
- to provide an individual with upskilling or reskilling so they have a viable skillset that meets labour market needs, resulting in the potential for long-term employment
- to create linkages between businesses and unemployed/under-represented populations by establishing work experiences
- to support non-profit organizations to cover the wages of an unemployed Islander to assist with a community project
Program: Self Employ:Entrepreneurship
Expenditures: $1,488,501 (5.7%)
Description: The Self Employ program provides unemployed individuals with financial and entrepreneurial assistance to launch a business
Target client groups: Unemployed individuals
Benefits and expected results:
- to support economic growth on Prince Edward Island
- increase labour market participation by supporting individuals with self-employed job creation
- to create further employment opportunities through the development of new enterprises
3.2.3 Nova Scotia
In this section
- Employment Benefits and Support Measures key facts
- Labour market context
- Canada-Nova Scotia Labour Market Development Agreement
- Designated and under-represented groups
- Stakeholder consultations
- Program delivery and participant supports
Employment Benefits and Support Measures key facts
| Indicator | Active claimant clients | Former claimant clients | PPE clients | Non-insured clients | Total |
|---|---|---|---|---|---|
| Number served | 4,402 | 2,203 | 744 | 3,755 | 11,104 |
| Share of total | 39.6% | 19.8% | 6.7% | 33.8% | 100.0% |
- Notes:
- 1 This table reflects clients served between April 1, 2023 and March 31, 2024.
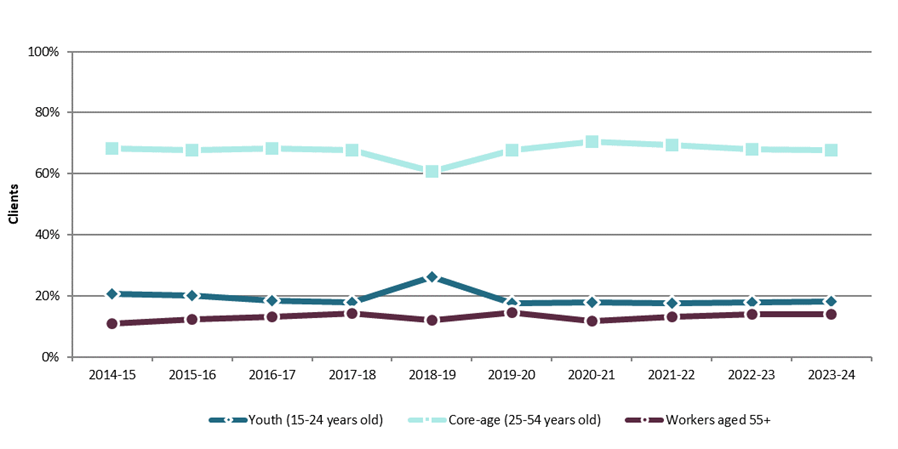
Text description
| Year | Youth (15-24 years old) | Core-age (25-54 years old) | Workers aged 55+ |
|---|---|---|---|
| 2014-15 | 20.6% | 68.3% | 11.0% |
| 2015-16 | 20.0% | 67.8% | 12.2% |
| 2016-17 | 18.4% | 68.3% | 13.2% |
| 2017-18 | 17.8% | 67.7% | 14.4% |
| 2018-19 | 26.2% | 60.8% | 12.1% |
| 2019-20 | 17.7% | 67.8% | 14.5% |
| 2020-21 | 17.8% | 70.4% | 11.7% |
| 2021-22 | 17.5% | 69.3% | 13.2% |
| 2022-23 | 17.9% | 68.1% | 14.0% |
| 2023-24 | 18.2% | 67.7% | 14.0% |
- Notes:
- 1 This chart reflects clients served between April 1, 2014 and March 31, 2024.

Text description
| Year | Active claimant clients | Former claimant clients | PPE clients | Non-insured clients |
|---|---|---|---|---|
| 2014-15 | 9,360 | 2,202 | n/a | 4,397 |
| 2015-16 | 9,575 | 2,134 | n/a | 4,620 |
| 2016-17 | 9,651 | 2,141 | n/a | 4,717 |
| 2017-18 | 9,152 | 2,397 | n/a | 4,337 |
| 2018-19 | 9,466 | 1,901 | 1,041 | 3,040 |
| 2019-20 | 6,536 | 2,119 | 1,045 | 2,858 |
| 2020-21 | 5,151 | 1,550 | 586 | 1,777 |
| 2021-22 | 5,496 | 1,963 | 670 | 1,972 |
| 2022-23 | 4,459 | 2,346 | 752 | 2,985 |
| 2023-24 | 4,402 | 2,203 | 744 | 3,755 |
- Notes:
- 1 This chart reflects clients served between April 1, 2014 and March 31, 2024.
| Service type | Services delivered | Year-over-year change | Share of total | Year-over-year change (p.p.) |
|---|---|---|---|---|
| Employment Benefits | 3,703 | +5.9% | 17.3% | -0.2 |
| Employment Assistance Services | 17,655 | +6.9% | 82.7% | +0.2 |
| Total services | 21,358 | +6.7% | 100.0% | n/a |
- Notes:
- 1 This table reflects all new services started between April 1, 2023 and March 31, 2024.
| Employment Benefits | Services | Year-over-year change | Expenditures | Year-over-year change |
|---|---|---|---|---|
| Targeted Wage Subsidies | 274 | -45.0% | $2,062,950 | -44.9% |
| Self-Employment | 122 | -60.1% | $3,469,881 | -50.0% |
| Job Creation Partnerships | 31 | -53.0% | $519,136 | -55.0% |
| Skills Development-Regular | 1,472 | +38.2% | $35,546,354 | +6.5% |
| Skills Development-Apprentices | 1,804 | +15.4% | included above | included above |
| Targeted Earning Supplements | 0 | n/a | n/a | n/a |
| Totals | 3,703 | +5.9% | $41,598,321 | -8.0% |
- Notes:
- 1 This table reflects all new services started between April 1, 2023 and March 31, 2024.
| Support Measures | Services | Year-over-year change | Expenditures | Year-over-year change |
|---|---|---|---|---|
| Employment Services | 16,729 | +8.3% | $39,553,543 | +6.6% |
| Individual Counselling | 926 | -13.1% | included above | included above |
| Labour Market Partnerships | n/a | n/a | $6,576,500 | +64.4% |
| Research & Innovation | n/a | n/a | $2,949,813 | 125.8% |
| Totals | 17,655 | +6.9% | $49,079,856 | +15.7% |
- Notes:
- 1 This table reflects all new services started between April 1, 2023 and March 31, 2024.
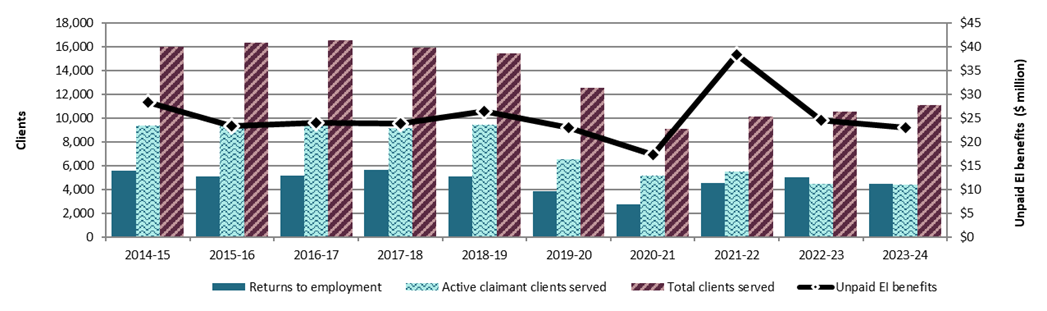
Text description
| Year | Unpaid EI benefits | Returns to employment | Active claimant clients served | Total clients served |
|---|---|---|---|---|
| 2014-15 | $28,414,245 | 5,608 | 9,360 | 15,959 |
| 2015-16 | $23,386,628 | 5,100 | 9,575 | 16,329 |
| 2016-17 | $24,021,668 | 5,153 | 9,651 | 16,509 |
| 2017-18 | $23,910,837 | 5,624 | 9,152 | 15,886 |
| 2018-19 | $26,429,016 | 5,075 | 9,466 | 15,448 |
| 2019-20 | $22,951,106 | 3,834 | 6,536 | 12,558 |
| 2020-21 | $17,272,179 | 2,781 | 5,151 | 9,064 |
| 2021-22 | $38,284,467 | 4,539 | 5,496 | 10,101 |
| 2022-23 | $24,585,983 | 5,022 | 4,459 | 10,542 |
| 2023-24 | $23,030,581 | 4,469 | 4,402 | 11,104 |
- Notes:
- 1 Volatility in the estimated Unpaid EI Benefits from 2021‑22 to 2022‑23 correlates with the speed of recovery of the labour market that allowed many Canadians to return to work before exhausting their EI benefits.
- 2 This table excludes Indigenous pan-Canadian clients.
- 3 The employment returns reported apply specifically to EI-insured clients (active claimants, former claimants and PPE clients).
Labour market context
In 2023-24, Nova Scotia experienced low unemployment rates and an increase in job vacancies. To attract workers, employers raised average hourly wages, however, the labour market continued to have many long-term vacancies. Nova Scotia also experienced strong population growth in 2023 (+3.2%) due to significant immigration and interprovincial migration. Despite this growth, the aging population remained a challenge, with many baby-boomers retiring and exiting the labour force in large numbers, affecting both labour supply and economic growth.
The unemployment rate for those aged 15 and over decreased slightly to 6.3% in 2023, a slight decrease from 6.5% in 2022 reflecting a modest recovery in the province's labour market.Footnote 36 In comparison, Canada's unemployment rate in 2023 was 5.4% and in 2022 was 5.3%.Footnote 37
By March 2024, Nova Scotia had about 15,300 job vacanciesFootnote 38, while approximately 29,000 people were unemployed, had recently looked for work in the past 4 weeks and were available for work.Footnote 39
Nova Scotia remains focused on population in-migration to offset population declines and maintain a healthy demographic profile, growth employment and meet labour market needs.
Canada-Nova Scotia Labour Market Development Agreement
In 2023-24, Nova Scotia received approximately $101 million through the LMDA. Approximately 19,000 clients were served. Within 6 months of receiving training and employment supports, approximately 61% of active claimant clients were employed which contributed to an overall savings of approximately $23 million in unpaid EI benefits.
Nova Scotia offered a number of Employment Benefits and Support Measures (EBSM) through the LMDA. In 2023-24, the province offered the following programs and services:
- Employment Assistance Services
- Skills Development
- Nova Scotia School of Adult Learning
- Labour Market Partnership
- START - Nova Scotia's version of the Targeted Wage Subsidy
- Job Creation Partnership program
- Self-Employment Assistance
- Research and Innovation
- Work Activity Centre
For example, in 2023-24, the Employment Assistance Services (EAS) program supported approximately 13,000 Nova Scotians. This program is provided through 16 external service providers across 50 locations throughout the province. All Nova Scotians can access EAS's Nova Scotia Works (NSW) self-directed resources. Additionally, unemployed Nova Scotians who are Canadian citizens or permanent residents are eligible for additional services, including individualized case management. These services may include employment needs assessment, career planning, employment counselling, job placement services and follow-up support.
In 2023-24, almost 2,400 participants benefited from Skills Development (SD) training programs including SD-Regular, SD-Fast Forward and SD-Apprenticeship.
- The SD (Regular) program is an employment program that provides financial assistance to LMDA-eligible participants to help them obtain the skills training they need to find employment. It is designed for those who need to learn additional basic-to-advanced skills to help them find sustainable employment. Eligible participants are those who are unable to find and secure employment with their existing skills and who lack marketable skills but who are otherwise job-ready. Participants attend training full-time and training may be provided through public or private providers
- SD Fast Forward is Nova Scotia's version of the Feepayer Program. This program provides an opportunity for individuals who are in receipt of regular Employment Insurance (EI) benefits to attend approved training, at their own expense, to improve their skills and enhance their employability for the duration of their claim
- SD Apprenticeship: This program provides wrap-around support, using LMDA funding, to help apprentices cover costs such as travel, childcare, accommodations, assistive technology and books
Designated and under-represented groups
As Nova Scotia is facing an aging population, the focus was on increasing the labour market participation rate of all available workers, including those from under-represented groups such as:
- Indigenous peoples
- racialized people
- persons with disabilities
- women
- youth
- older workers
Having a diverse and inclusive workforce is essential to the province's economic development and prosperity. The province introduced policies that help address labour market challenges to improve the equity, diversity and inclusion of its workforce. In recent years, Nova Scotia had a rise in the participation rates of older workers and women.
For example, in 2023-24, Employment Development Specialists (EDSs) engaged with community representatives and representative from community-serving organizations within First Nations, African Nova Scotian, Africadian (people of African Canadian descent), Acadian and newcomer communities to discuss how Employment Nova Scotia (ENS) might collaborate to address labour market challenges in these communities, comprising of connection with existing provincial programs and services, including engagement in specialized programs (Work For You and Job Creation Partnership, as well as special initiatives such as training opportunities to support those underrepresented in the Nova Scotia Labour Market. In 2023-24, EDSs built on previously established relationship to engage in deeper discussion regarding the unique barriers faced when entering the labour market and how ENS might adapt to become more inclusive to those who have traditionally faced greater barriers entering the labour market.
Stakeholder consultations
In 2023-24, Nova Scotia conducted consultations with a wide range of stakeholders, including employers, service providers, program administrators, program participants, sector councils and other organizations representing LMDA and WDA stakeholders. These consultations, both formal and informal were integral to program planning and evaluation.
For example, Nova Scotia met regularly with the Nova Scotia School of Adult Learning (NSSAL), which is responsible for providing adult education services across the province. NSAAL works closely with service providers, educators and community organizations to ensure the needs of adult learners are met. In 2023-24, NSAAL facilitated 4 regional planning meetings per region and collaborated with a diverse group of stakeholders, including NS Works, the Black Educator's Association and Deaf Literacy NS, to enhance learning opportunities and address emerging needs.
Microcredentials Initiative Innovation Fund (MIIF)
In 2023-24, through funding from the Canada-Nova Scotia LMDA, the Microcredentials Initiative Innovation Fund (MIIF) was launched to support the Nova Scotia Microcredentials Framework (2023). The purpose of this fund is to provide initial financial support and oversight to industry organizations, training providers and post-secondary institutions to co-develop and deliver 24 unique Microcredentials. This initiative is supported by Microcredentials Initiative Community of Practice (CoP) aimed at fostering collaborations between eligible organizations and government to establish a coordinated Microcredentials ecosystem across the province. The learning gained from these projects will inform recommendations for quality standards for the development, delivery and recognition of Microcredentials in Nova Scotia. The MIIF projects will enhance workforce inclusion, improve job accessibility and foster career advancement. They align with key government priorities, including affordable housing, net-zero targets, workforce retention, digital adoption, healthcare and youth employment. Between April 2024 and June 2025, the Microcredentials Innovation projects will collaborate with 59 organizations, benefiting approximately 571 learners.
Program delivery and participant supports
This section provides an overview of the specific programs and financial supports available under the LMDA. It includes specific details on the programs/initiatives available, their duration associated funding and additional supports provided to participants. This aims to demonstrate how these programs and initiatives align with federal and provincial priorities and support labour market integration.
Program: Work Activity Centre (WAC)
Expenditures: $2,780,000 (3.5%)
Description: The WAC program is an employment initiative that, through partner organizations, provides support to Nova Scotians with employment barriers to engage in entry level work or education and skills training.
Administered by Department of Community Services (DCS). Even though WAC is funded by both LMDA and WDA (along with provincial funds), it was not possible to break the table down into counts per section due to data limitations.
Target client groups: EI Insured participants
Benefits and expected results: EI Insured participants
Program: Employment Assistance Services: NS Works Centres and more
Expenditures: $33,773,543 (42.9%)
Description: The EAS consists of16 external service providers in over 50 province-wide locations. All Nova Scotians can access EAS via Nova Scotia Works (NSW) by accessing virtual services through the digital service channel and self-directed resources and all unemployed Nova Scotians who are Canadian citizens or permanent residents can access additional services, including individualized case management. These services may also include employment needs assessment, career planning, employment counselling, job placement services and follow-up support.
Target client groups: EI Insured participants
Benefits and expected results: Number of clients employed within 6 months of finishing the program, where known: 5,401/12,103 (45.0%)
Program: Skills Development: Regular
Expenditures: $13,887,842 (17.7%)
Description: The SD (Regular) program is an employment program that provides financial assistance to LMDA-eligible participants to help them obtain the skills training they need to find employment. It is designed for those who need to learn additional basic-to-advanced skills to help them find sustainable employment. Eligible participants are those who are unable to find and secure employment with their existing skills and who lack marketable skills but who are otherwise job-ready. Participants attend training full-time and training may be provided through public or private providers.
Target client groups: EI Insured participants
Benefits and expected results: Number of clients employed within 6 months of finishing the program, where known: 383/506 (76%)
Program: Self-Employment (including SETA)
Expenditures: $3,469,881 (4.4%)
Description: The Self-Employment program provides entrepreneurial support and financial assistance to eligible, unemployed participants starting their own business. Entrepreneurial support may include information sessions, orientation sessions, workshops, coaching, mentoring and access to specific business implementation training to enable participants to develop and implement their business plans.
Target client groups: EI Insured participants
Benefits and expected results:Number of clients employed within 6 months of finishing the program, where known: 198/210 (94%)
Program: Nova Scotia School of Adult Learning (NSSAL)
Expenditures: $7,500,000 (9.5%)
Description: The NSSAL program offers tuition-free programming to help individuals improve their essential skills in reading, math and digital, as well the behavioural (interpersonal) skills needed to achieve their goals. Through NSSAL, individuals can also take classes to obtain a Nova Scotia High School Graduation Diploma for Adults, upgrade high school credits to qualify for post-secondary education, or prepare for the high school equivalency certificate. These programs are offered in English and French through partner organizations - community learning organizations, adult high schools, Nova Scotia Community College (NSCC) and Université Sainte-Anne - across the province.
Target client groups: EI Insured participants
Benefits and expected results: Number of clients who obtained credentials (educational or technical), or certificates of completion: 333
Program: Labour Market Partnerships (Sector Councils)
Expenditures: $6,576,500 (8.4%)
Description: This program supports an industry-led approach to human resource planning and development that is tailored to meet the labour market needs of a range of industry sectors. Its focus is on ensuring that small- and medium-sized businesses have increased access to expertise, resources and support in the area of human resource planning.
Target client groups: EI Insured participants
Benefits and expected results:
The Labour Market Partnership program, for example, enabled key workforce initiatives that strengthened employer-employee connections, supported workforce retention and enhanced skills development across Nova Scotia.
In 2023-24, this included the efforts of the Association of Industry Sector Councils (AISC) and its members, who organized career fairs reaching nearly 18,000 participants, provided training for 12,000 individuals, developed strategic workforce planning tools for employers and supported immigration strategies to address labour market needs. These initiatives contributed to a more resilient and adaptable workforce, benefiting both job seekers and employers.
Program: START Program
Expenditures: $2,062,950 (2.6%)
Description: The START program is Nova Scotia's version of the Targeted Wage Subsidy and it encourages employers to target unemployed Nova Scotians requiring work experience, resulting in good jobs for Nova Scotians and good employees for employers. The program is intended to benefit small and medium-sized businesses but is available to all businesses and organizations (not-for-profit and social enterprises) that have a physical location in the province.
Target client groups: EI Insured participants
Benefits and expected results: Number of clients employed within 6 months of finishing the program, where known: 139/159 (87%)
Program: Skills Development: Apprenticeship
Expenditures: $5,133,359 (6.5%)
Description: In addition to Employment Nova Scotia (ENS) undertaking the administrative process with Service Canada to authorize registered apprentices to access Employment Insurance while attending apprenticeship technical training, ENS also provides wrap-around support, using LMDA funding, to help apprentices cover costs such as travel, childcare, accommodations, assistive technology and books.
Target client groups: EI Insured participants
Benefits and expected results: The employment outcome counts are low because this indicator is not tracked and most apprentices take time off from their work to attend this training and then return to their previous employment. However, this is not reflected in the numbers.
Program: Research and Innovation
Expenditures: $2,949,813 (3.7%)
Description: Research and Innovation (R & I) funding supports projects that will identify better ways of helping persons prepare for return to or keep employment and to be productive participants in the labour force.
Includes:
Employment Services Design Project
Pier Labs will partner with the Department of Labour, Skills and Immigration (LSI), Employment Nova Scotia (ENS) and Workplace Initiatives (WI) to complete a 12-month service design project. Through this partnership Pier Labs will provide expertise in project management, change management, service design, behavioral science and research and evaluation. Throughout the 12-month project Pier Labs will provide support to LSI in implementing both continuous improvement and development of new programs and services.
SETA: GO-3D
Self Employment Training and Assistance Program (SETA) (WDA and LMDA): SETA provides entrepreneurial support and financial assistance to eligible persons interested in self employment as a career option. It offers a flexible pathway towards self employment with wrap-around supports and funding to address unique barriers to employment. Participants are engaged in a variety of activities, to enable them to implement their business plan. These include orientation, business development, business operations, mentorship and coaching. The current Project being funded through this program is called the GO-3D Program (which stands for growth,opportunities,determination,drive,disability). TEAM Work Cooperative Ltd, in conjunction with various project partners, developed, tested and will evaluate the feasibility of the self employment program focused on persons with disabilities (GO-3D). Self employment activities focus on business start-ups by new and existing entrepreneurs who are needing support and coaching to remain viable. The program is rural and urban: TEAM Work Cooperative in the Halifax Regional Municipality (HRM) and Career Connections in the New Glasgow area.
AspireAtlantic
AspireAtlantic is a sectoral workforce development program that aims to move job seekers into middle skill jobs with advancement opportunities. Participants are people with essential skills gaps. The Future Skills Centre provided the core funding. This AspireAtlantic model is new and being tested under this project. The scope of this funding agreement is to support resourcing for 1 Advancement Coach position, with project activity, monitoring, results and evaluation falling under the responsibility of Future Skills Centre and Pier Labs. The program focuses on 3 sectors: construction, home building/renovation and manufacturing. Employers benefit from the increase in quality candidates trained for available jobs as well as higher retention of employees.
Microcredentials Initiative Innovation Fund (MIIF) programs
The Microcredentials Initiative Innovation Fund (MIIF) is dedicated to supporting the development and delivery of the training programs. These are specialized, focused training programs designed to provide individuals with specific skills and knowledge tailored to particular job roles or industries. They aim to enhance employability, support career progression and foster inclusive participation in the labour market by offering targeted learning experiences that align with current workforce needs. These credentials help individuals access job opportunities, maintain employment and build meaningful career pathways by equipping them with relevant, practical skills. Additionally, the MIIF invests in the establishment of a Microcredentials Community of Practice (CoP), bringing together stakeholders such as post-secondary institutions, industry representatives, training providers and government entities. This collaborative network aims to strengthen the microcredentials ecosystem, reduce redundancy and promote effective training practices and opportunities throughout Nova Scotia.
Target client groups: Research institutions
Program: Job Creation Partnerships (JCP)
Expenditures: $519,136 (0.7%)
Description: The JCP program supports projects that provide LMDA-eligible individuals with work experience that will benefit them by improving their employment prospects. Although funded projects are intended to benefit the individual and the community, the program's focus is aiding participants with work that will strengthen their long-term and full-time employment prospects.
Target client groups: EI Insured participants
Benefits and expected results: Number of clients employed within 6 months of finishing the program, where known: 21/37 (57%)
3.2.4 New Brunswick
In this section
- Employment Benefits and Support Measures key facts
- Labour market context
- Canada-New Brunswick Labour Market Development Agreement
- Designated and under-represented groups
- Stakeholder consultations
- Program delivery and participant supports
Employment Benefits and Support Measures key facts
| Indicator | Active claimant clients | Former claimant clients | PPE clients | Non-insured clients | Total |
|---|---|---|---|---|---|
| Number served | 4,581 | 2,654 | 802 | 5,719 | 13,756 |
| Share of total | 33.3% | 19.3% | 5.8% | 41.6% | 100.0% |
- Notes:
- 1 This table reflects clients served between April 1, 2023 and March 31, 2024.

Text description
| Year | Youth (15-24 years old) | Core-age (25-54 years old) | Workers aged 55+ |
|---|---|---|---|
| 2014-15 | 35.4% | 57.4% | 7.2% |
| 2015-16 | 38.1% | 54.6% | 7.4% |
| 2016-17 | 45.2% | 48.1% | 6.6% |
| 2017-18 | 48.5% | 45.7% | 5.8% |
| 2018-19 | 52.9% | 40.2% | 5.5% |
| 2019-20 | 53.1% | 41.9% | 4.7% |
| 2020-21 | 54.1% | 42.2% | 3.5% |
| 2021-22 | 56.3% | 40.1% | 3.5% |
| 2022-23 | 31.5% | 62.6% | 5.8% |
| 2023-24 | 28.3% | 65.8% | 5.8% |
- Notes:
- 1 This chart reflects clients served between April 1, 2014 and March 31, 2024.

Text description
| Year | Active claimant clients | Former claimant clients | PPE clients | Non-insured clients |
|---|---|---|---|---|
| 2014-15 | 8,596 | 2,393 | n/a | 4,838 |
| 2015-16 | 10,411 | 2,885 | n/a | 6,365 |
| 2016-17 | 11,386 | 2,859 | n/a | 8,347 |
| 2017-18 | 11,302 | 3,116 | n/a | 8,410 |
| 2018-19 | 10,387 | 2,263 | 1,327 | 7,550 |
| 2019-20 | 10,716 | 2,595 | 1,400 | 7,286 |
| 2020-21 | 9,909 | 1,524 | 739 | 3,578 |
| 2021-22 | 12,324 | 2,227 | 841 | 3,978 |
| 2022-23 | 5,087 | 2,576 | 809 | 4,662 |
| 2023-24 | 4,581 | 2,654 | 802 | 5,719 |
- Notes:
- 1 This chart reflects clients served between April 1, 2014 and March 31, 2024.
| Service type | Services delivered | Year-over-year change | Share of total | Year-over-year change (p.p.) |
|---|---|---|---|---|
| Employment Benefits | 5,924 | -7.9% | 21.9% | -2.6 |
| Employment Assistance Services | 21,103 | +6.8% | 78.1% | +2.6 |
| Total services | 27,027 | +3.2% | 100.0% | n/a |
- Notes:
- 1 This table reflects all new services started between April 1, 2023 and March 31, 2024.
| Employment Benefits | Services | Year-over-year change | Expenditures | Year-over-year change |
|---|---|---|---|---|
| Targeted Wage Subsidies | 427 | -17.2% | $0 | +100% |
| Self-Employment | 203 | -6.0% | $3,933,910 | -18.3% |
| Job Creation Partnerships | 0 | n/a | $0 | n/a |
| Skills Development-Regular | 3,103 | -14.6% | $54,564,401 | -15.4% |
| Skills Development-Apprentices | 2,191 | +6.0% | included above | n/a |
| Targeted Earning Supplements | 0 | n/a | n/a | n/a |
| Totals | 5,924 | -7.9% | $58,498,312 | -15.6% |
- Notes:
- 1 This table reflects all new services started between April 1, 2023 and March 31, 2024.
| Support Measures | Services | Year-over-year change | Expenditures | Year-over-year change |
|---|---|---|---|---|
| Employment Services | 4,866 | +6.2% | $7,788,054 | +10.8% |
| Individual Counselling | 16,237 | +7.0% | included above | Included above |
| Labour Market Partnerships | n/a | n/a | $35,317,653 | -17.6% |
| Research & Innovation | n/a | n/a | $9,639 | -97.6% |
| Totals | 21,103 | +6.8% | $43,115,346 | -14.3% |
- Notes:
- 1 This table reflects all new services started between April 1, 2023 and March 31, 2024.

Text description
| Year | Unpaid EI benefits | Returns to employment | Active claimant clients served | Total clients served |
|---|---|---|---|---|
| 2014-15 | $27,266,183 | 7,471 | 8,596 | 15,827 |
| 2015-16 | $31,018,474 | 8,179 | 10,411 | 19,661 |
| 2016-17 | $30,008,146 | 8,300 | 11,386 | 22,592 |
| 2017-18 | $29,137,706 | 8,800 | 11,302 | 22,828 |
| 2018-19 | $25,004,412 | 8,031 | 10,387 | 21,527 |
| 2019-20 | $26,374,579 | 8,848 | 10,716 | 21,997 |
| 2020-21 | $22,265,921 | 6,803 | 9,909 | 15,750 |
| 2021-22 | $56,832,095 | 8,571 | 12,324 | 19,370 |
| 2022-23 | $42,506,427 | 11,993 | 5,087 | 13,134 |
| 2023-24 | $23,794,702 | 5,640 | 4,581 | 13,756 |
- Notes:
- 1 Volatility in the estimated Unpaid EI Benefits from 2021‑22 to 2022‑23 correlates with the speed of recovery of the labour market that allowed many Canadians to return to work before exhausting their EI benefits.
- 2 This table excludes Indigenous pan-Canadian clients.
- 3 The large increase in clients served in 2021-2022, with many reported as clients employed in 2022-2023 due to the natural lag between being served and finding employment.
- 4 The employment returns reported apply specifically to EI-insured clients (active claimants, former claimants and PPE clients).
Labour market context
In 2023-24, New Brunswick continued to face significant labour shortages, especially in critical sectors such as healthcare, education, construction, trucking and manufacturing. Additionally, the province's aging population, which accounted for 23.0% of the total in 2023, further contributed to a declining workforce, as fewer workers to replace retirees. These factors increased hiring challenges and placed additional pressure on the labour force.Footnote 40
The unemployment rate for those aged 15 and over in New Brunswick was 6.6% in 2023, down from 7.2% in previous year.Footnote 41 In comparison, Canada's unemployment rate in 2023 was 5.4%, slightly higher than 5.3% in 2022.Footnote 42
In March 2024, New Brunswick reported nearly 10,000 job vacanciesFootnote 43 compared to 33,000 persons who were unemployed, actively seeking employment within the last 4 weeks and available for work.Footnote 44
Moving forward, the province's focus remains on supporting employers in maximize the recruitment and retention of employees, particularly from designated and/or under-represented groups, including newcomers. The province will need to address ongoing labour shortages and skills mismatches, while also responding to the pressures of an aging population and rising housing costs.
Canada-New Brunswick Labour Market Development Agreement
In 2023-24, New Brunswick received approximately $110.5 million though the LMDA, which served approximately 13,800 clients. Within 6 months of receiving training and employment supports, approximately 71% of active claimant clients were employed, resulting in an overall savings of approximately $23.8 million in unpaid EI benefits.
Programs and services under the LMDA are continuously reviewed by the province to ensure they effectively address evolving labour market opportunities and challenges.
An example of such program is the Human Resources Support Services (HRSS), which helps employers in New Brunswick address workforce needs through ongoing consultations with WorkingNB. The program offers recruitment support, including financial assistance for work placements, job postings and job fairs, as well as training funding for employees and supervisors. HRSS also provides expertise in human resources management, such as human resource planning, policy development and succession planning. In 2023-24, the program invested approximately $42M and served 2,084 clients, enhancing employers' capacity and address labour market challenges.
Designated and under-represented groups
In 2023-24, the Government of New Brunswick, through the WorkingNB division provided targeted programs and services to support employers with the recruitment and retention of newcomers. These programs and services also offered employment counseling and fostered a strong collaboration with organizations who supported newcomers in the province.
WorkingNB provided services such as:
- language services: partnering with community organizations, settlement agencies and educational institutions to deliver language training programs, ensuring they are integrated into the services offered to newcomers
- experiential learning and work experiences: providing short-term job placements, workshops and 1-on-1 coaching, mentorship opportunities to help under-represented groups gain hands-on experience
- job maintenance support: providing job maintenance support to assist both employers and employees in ensuring individuals from under-represented groups retain their jobs. This support may involve troubleshooting workplace challenges or offering conflict resolution services to help individuals retain their jobs
- work culture competencies: providing assistance to help newcomers understand the work culture in New Brunswick. This can include training on workplace expectations, etiquette, communication and team dynamics
- foreign credential recognition support: WorkingNB provides foreign credential recognition support to help newcomers, with professional qualifications from other countries, navigate the process of having their qualifications recognized in New Brunswick. This may involve connecting individuals with organizations that assess foreign credentials or providing guidance on how to apply for equivalency assessments. The development of a new virtual employment counselling services unit in 2024 has built additional FQR capacity and expertise within WorkingNB. The team specializes in supporting FQR clients in navigating credential recognition processes, while providing them with employment counselling services
Stakeholder consultations
New Brunswick actively engages a diverse range of stakeholders, including employers, employees, communities (including official language communities) and organizations to develop effective and responsive workforce programs. Each year, WorkingNB collaborates with key sectors, such as, health care and social assistance, education, construction, manufacturing, information technology (IT), agriculture, forestry, fisheries and tourism. These partnerships address labour market challenges and support employers in implementing workforce strategies tailored to their needs.
Specific examples of stakeholder consultations and collaboration:
- The Restigouche Regional Labour Market Partnership forum: This forum collaborated with various stakeholders, including education institutions (school and postsecondary institutions), community partners, economic development agencies, employers and municipalities to develop a 5-year attraction and retention strategy for the region. Three strategic pillars were identified and a comprehensive action plan developed to guide the necessary actions
- Belledune Port Authority (BPA): WorkingNBs supported BPA in establishing Community and Workforce Development Committee. This committee engages local stakeholders and community members to make recommendations that support a clean-energy based industrial transition for northern New Brunswick. The community provides a forum for information sharing and feedback, enabling collaborative efforts to pursue opportunities in community education, workforce development, training and recruitment. It also fosters broader stakeholder engagement on goals and opportunities at the Port. Focusing on projects and development opportunities identified by the BPA, the committee is tasked with identifying economic impacts and opportunities for the region while planning for jobs, training and community outreach initiatives
Regional Service Commissions (RSCs) in New Brunswick plays a crucial role in driving economic development across the province. They foster collaboration between municipalities, local governments and stakeholders to address economic challenges and promote growth.
Following are examples of RSC contributions to economic development:
- promoting regional economic cooperation: encouraging collaboration between communities to tackle shared economic issues, attract investments and leverage regional strengths for coordinated growth
- attracting investment and supporting business growth: identifying regional economic opportunities and align resources to create attractive environments for investors and entrepreneurs, supporting business development and expansion
- optimizing service delivery for growth: streamlining services and coordinating regional efforts, RSCs improve the efficiency of service delivery, contributing to a more competitive and sustainable economy
Through these efforts, RSCs enhances regional competitiveness, support infrastructure development and help create a thriving, resilient economy for businesses and communities in New Brunswick.
Building innovative pathways to support immigration into the construction workforce in New Brunswick
In New Brunswick, approximately 8.5% of construction jobs are currently unfilled, with an estimated 10,000 vacancies expected by 2027. To address this, a Labour Force Adjustment Committee was formed, bringing together key stakeholders and government representatives to identify and overcome barriers contributing to the labour shortage in the construction sector. The committee's goal is to develop solutions that support both individuals and employers in the industry.
The project focuses on increasing immigration to New Brunswick's construction sector. While immigrants make up 20.0% of the national construction workforce, they represent only 3.2% in New Brunswick. Addressing this disparity is critical to meeting infrastructure goals and addressing the housing crisis.
Success will be measured by the development of initiatives and simplified immigration into the construction sector. These efforts will emphasize increased collaboration between provincial and federal governments to ensure effective implementation and sustainable workforce growth.
Program delivery and participant supports
This section provides an overview of the specific programs and financial supports available under the LMDA. It includes specific details on the programs/initiatives available, their duration, associated funding and additional supports provided to participants. The intent is to demonstrate how programs and initiatives align with federal and provincial priorities and support labour market integration.
Program: Human Resources Support Services (HRSS)
Project expenditures: $18,800,000 (Base) / $4,128,000 (temporary additional funding) (19.8%)
Description: Human Resources Support Services (HRSS) is a service delivery approach for employers. Through HRSS, workforce consultants in regional WorkingNB offices have ongoing dialogues with employers. Through these dialogues Workforce Consultants help employers identify their Human Resource needs and together identify and recommend flexible and innovative interventions to address those needs. Ongoing support is provided to employers during their participation in interventions in the areas of recruitment, training and other areas of Human Resource management.
- Recruitment supports: provides financial support for work placements, assisting with job postings, organizing local, provincial and national job fairs, referring to partnering departments to address international recruitment needs and experiential education (FutureNB). Some of the supports offered are funded through Adjustment Services
- Training supports: provide funding for various types of training for both employees and supervisors or managers, customized training programs for employees, as well as cultural/diversity awareness training. Training interventions may be funded through other appropriate programs, including the Labour Force Training (LFT) program and Workplace Essential Skills (WES) training
- Human resource management supports: provides funding to employers for external Human Resource expertise in areas such as Human Resource (HR) planning, the development of policies and procedures for various Human Resource practices, job analysis, compensation and benefits planning, succession planning, coaching on cultural diversity and workplace culture, etc. Many of these supports are funded through Adjustment
Target client groups:
- New Brunswick employers
- associations
- non-profit organizations
Benefits and expected results: More strategic investments in ensuring employers' Human Resource needs are met through Working NB supports; reducing the number of unemployed persons and unfilled job vacancies.
Program: Employment Services program
Project expenditures: $26,000,000 (Base) / $5,500,000 (temporary additional funding) (27.1%)
Description: The Employment Services program has 4 components:
Adjustment Services (AS) encourage, support and facilitate human resource management and labour market adjustments, which are in the public interest. The approach used to deliver AS is focused on 2 distinct types of activities: Labour Force Adjustment (LFA) and Labour Market Research and Analysis (LMRA). The objective of Adjustment services is to help employers, employees, associations, community groups, communities, or other agencies to improve their capacity for dealing with human resource requirements and to address their labour force adjustment needs.
Labour Force Adjustment (LFA) assists threatened businesses and industries to address significant changes impacting human resources at the workplace. The program's objective is to support the steps necessary for labour and management to adjust to identified labour force changes in the workplace by investing time, energy and resources to work in a concerted manner.
Labour Market Research and Analysis (LMRA) improves the capacity to deal with human resource requirements (i.e., labour force imbalances) through means such as, human resource planning and research. LMRA typically aids associations representing sectors or a group of companies who are involved in the analysis of human resource supply and demand, the identification of trends and emerging issues and the identification of skills gaps and barriers to hiring and retaining appropriate human resources within a given sector or group of companies. The program's objective is to identify new and better tools and approaches that are designed to help individuals prepare for, return to, or keep employment and become productive participants in the labour force.
Labour Force Training (LFT) funds eligible businesses and organizations to train individuals who are being considered for an available job in their company and/or to improve the skills and job situation or prospects of their new or existing employees.
Employment Assistance Service (EAS) provides a variety of employment services to targeted clients. EAS is typically delivered through external contracts in partnership with non-profit, private and public organizations, where direct measurable employment results (placements) are achieved. The program's objective is to provide specialized employment services to assist individuals experiencing barriers in making the transition to employment.
Target client groups:
- New Brunswick employers
- associations
- non-profit organizations
- individuals seeking employment and or upskilling
Benefits and expected results: More strategic investments in ensuring employers Human Resource needs are met through WorkingNB supports; reducing the number of unemployed persons and unfilled job vacancies.
Program: Training and Skills Development (TSD)
Project expenditures: $33,000,000 (Base) / $7,000,000 (temporary additional funding) (34.5%)
Description: This program provides financial assistance to case-managed clients, whose employment action plan identifies skills development as being necessary to prepare them for employment opportunities, to access appropriate training and education programs so they can return to work. The focus of the program is to help clients receive training or educational programs which will allow them to quickly return to work.
The program has 2 objectives:
- to provide case-managed individuals with access to appropriate training and educational opportunities related to current and emerging employment opportunities
- to increase the number of individuals who find sustainable employment as a result of receiving financial assistance in support of a training intervention
For the 2023-24 year, this will consist of 2 programs: literacy upgrading and support for post-secondary training interventions.
Target client groups: An unemployed individual who has identified skills training, through a developed Employment Action Plan, as being necessary to access long-term employment opportunities
Benefits and expected results:
- percentage of clients employed after the completion of an intervention – 83%
- percentage of clients who obtained employment in a related field of study – 94%
Program: Future NB Co-op Program and Future NB Program
Project expenditures: $7,000,000 (Base) / $1,300,000 (temporary additional funding) (7.2%)
Description: The Co-op placement component (Future NB Co-op) encourages placements in the private or not-for-profit sector for students who are enrolled in a recognized college or university co-operative education program. These programs formally integrate a student's academic studies with work experience. The usual plan is for the student to alternate periods of experience in a field related to their program of study. Co-op placements occur throughout the fiscal year through 3 intakes (1 in the summer, 1 in the fall and 1 in the winter).
Future NB provides information and resources to students at the high school and post-secondary levels to prepare them for the workforce through information and experiential learning opportunities.
Objectives:
- to provide students with meaningful, experiential learning opportunities/work experience related to their skills and education
Target client groups:
- NB University and College students attending publicly funded institutions.
- maximum number of placements per year = 86
Benefits and expected results:
- ensuring students are better prepared to attain employment in NB post-graduation
- creating connections between students/employers earlier on
- fostering these connections and ensuring labour market demands are addressed through placements/training of NB students
- encouraging connections with students/employers to encourage retention of NB graduates for available NB jobs
Program: Community Adult Learning (CAL) training
Project expenditures: $2,624,000 (Base) / $576,000 (temporary additional funding) (2.8%)
Description: Through a partnership of funding for service delivery of the Adult Learning Services (Community Adult Learning Program - CALP) between government and communities, New Brunswick adults have access to learning services in, or near, their communities. Two options are available for them: the Academic and the Digital Literacy (DL) services, each designed to meet adult learners' need to improve their skills, whether for personal, employment, or further training reasons.
Academic Services
Academic Services offers free academic training in both official languages throughout the province.
Adults who wish to attend academic training could access academic upgrading up to the General Educational Diploma (GED) or Canadian Adult Education Credential (CAEC) Preparation level. The schedules are flexible to meet the needs of adults who may attend full or part-time training.
Academic training offers quality teaching and guidance to each participating learner.
Digital Literacy Services
The rapid development and adoption of digital technologies has changed the way we work, learn and
communicate. From social networking, to commerce, to the workplace, digital skills have become increasingly important in today's society.
In response to these realities, WorkingNB established Digital Literacy Services which focus on teaching basic digital skills needed to thrive in today's digital-rich society.
These services are designed to provide, throughout New Brunswick, an adult-friendly learning environment and encourage learners to be actively involved in the planning of their Individualized Learning Plan and in setting and reaching their goals. An adult education approach is used to maximize the success of adult learners, considering their maturity, encouraging them to become self-directed learners, guiding them in their learning objectives and valuing prior learning and experiences.
Target client groups: Adults without a high school diploma
Benefits and expected results: Serve approximately 1500 learners
- skill gain in learners
- successfully gaining GED certification
- increase in employment (or employment retention) after training
Program: Workplace Connections (WPC)
Project expenditures: $4,500,000 (Base) / $990,000 (temporary additional funding) (4.7%)
Description: Workplace Connections is a service available through WorkingNB for individuals who require a work experience as identified through their Employment Action Plan (EAP).
The objective of the WPC initiative is to increase the labour market attachment of individuals by providing them with workplace opportunities to address employment barriers or acquire experience and skills required for an occupation.
The WPC initiative includes a variety of initiatives that are available to individuals, as well as indirectly benefiting employers who host an individual for a funded placement at their business/organization.
The WPC stream will be determined based on the individual's needs and goals as identified by their Employment Action Plan (EAP) developed either through WorkingNB, Social Development or another authorized referral agent (i.e., Indigenous organization, Employment Assistance Services).
- Barriers to Employment: for individuals who have a barrier(s) that needs to be overcome to be able to contribute successfully to the workplace (e.g., gaps in employment). Includes career choice/career exploration subcomponent
- Skills Development: for individuals who need to acquire and develop skills that will enable them to contribute to their successful performance in a specific position/job (e.g., lack of experience in a field)
- Group-Based Initiatives: provides individuals with an experiential placement that is part of a group-based initiative aimed at meeting the needs of individuals and the labour market. This stream is for regional and provincial initiatives combining WPC with another intervention (e.g., WES)
Target client groups: Unemployed or underemployed New Brunswick residents (18 years of age and over) who are legally entitled to work in Canada
Benefits and expected results: The service increases the labour market attachment of individuals by providing them with workplace opportunities to address employment barriers or acquire experience/skills required for an occupation.
Program: Self-Employment Benefit (SEB) Program
Project expenditures: $3,800,000 (Base) / $830,000 (temporary additional funding) (4.0%)
Description: Self-Employment Benefit (SEB) helps unemployed individuals create a job for themselves by starting a new business. SEB provides various types of support during the initial development phase of the business including financial assistance, coaching and ongoing technical advice. Coaching is tailored to meet individual needs and can include subjects such as, business plan development, accounting and marketing.
Objectives of SEB:
- to assist unemployed individuals in securing sustainable self-employment
- to stimulate the creation of long-term employment opportunities in the private sector
Target client groups: Unemployed individuals seeking self-employment opportunities who need assistance with various elements to be successful
Benefits and expected results: To continue to exceed targets for requests for information about the program to serve over 900 individuals with the program.
3.2.5 Quebec
In this section
- Employment Benefits and Support Measures key facts
- Labour market context
- Canada-Quebec Labour Market Development Agreement
- Designated and under-represented groups
- Stakeholder consultations
- Program delivery and participant supports
Employment Benefits and Support Measures key facts
| Indicator | Active claimant clients | Former claimant clients | PPE clients | Non-insured clients | Total |
|---|---|---|---|---|---|
| Number served | 63,751 | 24,851 | 10,026 | 42,607 | 141,235 |
| Share of total | 45.1% | 17.6% | 7.1% | 30.2% | 100.0% |
- Notes:
- 1 This table reflects clients served between April 1, 2023 and March 31, 2024.

Text description
| Year | Youth (15-24 years old) | Core-age (25-54 years old) | Workers aged 55+ |
|---|---|---|---|
| 2014-15 | 16.3 | 68.3% | 15.4% |
| 2015-16 | 20.3% | 65.3% | 14.4% |
| 2016-17 | 19.6% | 65.0% | 15.3% |
| 2017-18 | 18.6% | 65.1% | 16.4% |
| 2018-19 | 17.6% | 62.8% | 18.4% |
| 2019-20 | 17.0% | 63.5% | 19.5% |
| 2020-21 | 21.3% | 66.9% | 11.8% |
| 2021-22 | 20.8% | 66.6% | 12.5% |
| 2022-23 | 17.7% | 63.6% | 18.6% |
| 2023-24 | 16.7% | 63.0% | 20.3% |
- Notes:
- 1 This chart reflects clients served between April 1, 2014 and March 31, 2024.

Text description
| Year | Active claimant clients | Former claimant clients | PPE clients | Non-insured clients |
|---|---|---|---|---|
| 2014-15 | 140,026 | 24,986 | n/a | 64,769 |
| 2015-16 | 146,359 | 26,946 | n/a | 79,814 |
| 2016-17 | 138,682 | 26,945 | n/a | 84,716 |
| 2017-18 | 127,614 | 32,965 | n/a | 79,764 |
| 2018-19 | 116,261 | 23,005 | 17,248 | 58,228 |
| 2019-20 | 107,330 | 22,990 | 17,524 | 51,110 |
| 2020-21 | 36,742 | 16,328 | 10,023 | 29,197 |
| 2021-22 | 40,257 | 22,821 | 11,231 | 32,807 |
| 2022-23 | 51,331 | 24,283 | 9,961 | 30,575 |
| 2023-24 | 63,751 | 24,851 | 10,026 | 42,607 |
- Notes:
- 1 This chart reflects all new services started between April 1, 2014 and March 31, 2024.
| Service type | Services delivered | Year-over-year change | Share of total | Year-over-year change (p.p.) |
|---|---|---|---|---|
| Employment Benefits | 16,794 | -39.1% | 10.0% | -9.4 |
| Employment Assistance Services | 151,931 | +32.4% | 90.0% | +9.4 |
| Total services | 168,725 | +18.6% | 100.0% | n/a |
- Notes:
- 1 This table reflects all new services started between April 1, 2023 and March 31, 2024.
| Employment Benefits | Services | Year-over-year change | Expenditures | Year-over-year change |
|---|---|---|---|---|
| Targeted Wage Subsidies | 4,905 | -26.0% | $122,278,000 | +30.8% |
| Self-Employment | 501 | -56.9% | $15,598,000 | -6.6% |
| Job Creation Partnerships | 0 | n/a | $0 | n/a |
| Skills Development-Regular | 11,388 | -42.5% | $276,299,000 | -10.8% |
| Skills Development-Apprentices | 0 | n/a | Included above | Included above |
| Targeted Earning Supplements | 0 | n/a | n/a | n/a |
| Totals | 16,794 | -39.1% | $414,175,000 | -1.4% |
- Notes:
- 1 This table reflects all new services started between April 1, 2023 and March 31, 2024.
| Support Measures | Services | Year-over-year change | Expenditures | Year-over-year change |
|---|---|---|---|---|
| Employment Services | 150,469 | +32.9% | $146,398,000 | +29.8% |
| Individual Counselling | 1,462 | -0.7% | Included above | Included above |
| Labour Market Partnerships | n/a | n/a | $73,352,000 | -32.5% |
| Research & Innovation | n/a | n/a | $6,765,000 | +27.7% |
| Totals | 151,931 | + 32.4% | $226,515,000 | -0.1% |
- Notes:
- 1 This table reflects all new services started between April 1, 2023 and March 31, 2024.

Text description
| Year | Unpaid EI benefits | Returns to employment | Active claimant clients served | Total clients Served |
|---|---|---|---|---|
| 2014-15 | $290,835,087 | 59,949 | 140,026 | 229,781 |
| 2015-16 | $332,312,524 | 64,697 | 146,359 | 253,119 |
| 2016-17 | $334,050,331 | 66,468 | 138,682 | 250,343 |
| 2017-18 | $327,619,996 | 68,794 | 127,614 | 240,343 |
| 2018-19 | $293,919,267 | 72,535 | 116,261 | 214,742 |
| 2019-20 | $302,813,344 | 75,735 | 107,330 | 198,954 |
| 2020-21 | $171,442,339 | 43,761 | 36,742 | 92,290 |
| 2021-22 | $286,041,048 | 41,409 | 40,257 | 107,116 |
| 2022-23 | $85,763,636 | 24,629 | 51,331 | 116,150 |
| 2023-24 | $156,384,552 | 35,046 | 63,751 | 141,235 |
- Notes:
- 1 Volatility in the estimated Unpaid EI Benefits from 2021‑22 to 2022‑23 correlates with the speed of recovery of the labour market that allowed many Canadians to return to work before exhausting their EI benefits.
- 2 This table excludes Indigenous pan-Canadian clients.
- 3 The employment returns reported apply specifically to EI-insured clients (active claimants, former claimants and PPE clients).
Labour market context
In 2023-24, the labour market in Quebec was marked by an ongoing labour shortage, which was mainly due to the ageing of the population and baby boomers leaving the labour market. Despite an economic recovery, companies struggled to fill certain job vacancies with a high employment rate and historically low unemployment. At the same time, the economic transformation, which was influenced by automation and artificial intelligence, prompted companies to modernize their infrastructure and adapt to workers' new expectations. It put more pressure on companies to maintain their ability to compete.
In 2023, both the employment rate of people aged 15 to 64 (78.4%) and women aged 25 to 54 with young children (81.8%) increased from the previous year. The employment rate of people aged 15 to 64 was the highest it has been since 1976 while the employment rate of women aged 25 to 54 with young children was a record high. The employment rate of Quebec-born individuals (79.2%) was higher than the national average (75.8%). However, the employment rate of new immigrants to Quebec (69.1%) was below the national average (73.1%).Footnote 45
In March 2024, there were 133,000 job vacanciesFootnote 46 for 235,900 unemployed individualsFootnote 47 who had been looking for a job within the last 4 weeks and were available to work.
Quebec's ageing population is contributing significantly to the labour shortage. Baby boomers (born between 1946 and 1965) are continuing to leave the labour market and the number of working-age people (15-64 years of age) should continue to decrease until 2060.
Canada-Quebec Labour Market Development Agreement
In 2023-24, Quebec received approximately $700 million through the LMDA which served approximately 141,200 clients. Within 6 months of receiving training and employment support, approximately 40%Footnote 48 of active claimant cleints were employed, which contributed to savings of approximately $156.4M in unpaid EI benefits to active claimants.
For example, since 2021, the ministère de l'Emploi et de la Solidarité sociale (Ministry of Employment and Social Solidarity)(MESS) has coordinated Opération main d'œuvre, which aims to provide solutions to address the labour shortage in certain priority areas. Specifically, MESS increased income support for unemployed individuals who are taking qualifying training that leads to a trade or profession. A total of 8,792 people received an allowance of $475 per week in 2023-24. The MESS also relied on the work-study program model with the Programme de formations de courte durée (Short-term training program), which focuses on internships in occupations that are prioritized by the Commission des partenaires du marché du travail (Labour Market Partners Commission) to support companies that are having difficulty recruiting workers.
Designated and under-represented groups
In Quebec, nearly 57,000 people from under-represented groups in the labour market were employed 3 months after having participated in a public employment services measure, including persons with disability, experienced workers aged 55 and over, immigrants who arrived in Canada less than 5 years ago, people with criminal records, First Nations and Inuit people, women, young people (aged 24 and under), English-speaking Quebeckers and people with a criminal records.
In addition, as part of the Plan d'action pour le secteur de la construction (Action plan for the construction sector) and Operation Workforce, Quebec has promoted the use of salary subsidies that are aimed at entry into employment for those in under-represented groups in the labour market. Among others, 242 women received these subsidies, which facilitated their entry into employment in the construction sector.
Stakeholder consultations
The Government of Quebec collaborates with the Commission des partenaires du marché du travail (CPMT) to adapt its public employment services to the needs of the labour market. Created in 1997 under the Act respecting the Ministère de l'Emploi et de la Solidarité sociale (Ministry of Employment and Social Solidarity) and the Commission des partenaires du marché du travail (labor market partners) and the Act to promote workforce skills development and recognition (Loi sur les compétences or 1% Law), the CPMT brings together representatives of employers, workers, the educational community, organizations that specialize in employability and economic and social departments and organizations.
Mandated to ensure that there is a match between the provision of training, workforce skills and market needs, the CPMT relies on a network of partners, which includes advisory committees on under-represented groups (immigrants, women, young people, workers aged 45 and over, First Nations and Inuit people, persons with disabilities, English-speaking Quebeckers and people with criminal records).
It also contributes to the development of the Plan d'action annuel des services publics d'emploi (Annual action plan for public employment services) and supports initiatives, such as the Programme d'aide à la relance par l'augmentation de la formation (the Program to aid recovery through increased training) (PARAF), which fosters skills development among the unemployed.
The Operation Workforce
Quebec continued its efforts to meet the labour shortage challenge. The Operation Workforce (Opération main d'oeuvre) government initiative prioritizes assistance for companies in certain sectors (health, education, childcare services, information technology, engineering and construction) and companies in the industrial, scientific and life sciences sectors. In 2023-24, 44.5% of the companies that had received assistance from public employment services were in sectors that were prioritized by the government.
Moreover, in support of the campaign launched in the fall of 2023 to train 4,000 to 5,000 people in the construction sector, the Government of Quebec pays, through the ministère de l'Emploi et de la Solidarité sociale (Ministry of Employment and Social Solidarity), $750 in weekly financial support, which the ministère de l'Éducation provides to eligible learners while they train.
In addition to overseeing this government action to meet labour market needs in certain economic sectors, Quebec acted to support the labour market. Therefore, it supported skills development among workers, particularly to increase productivity. Through activities aimed at adapting human resources management practices, it also helped companies support the professional integration and job retention of a diverse workforce.
Program delivery and participant supports
This section provides an overview of the specific programs offered through the LMDA. Please note that, due to the province's information gathering process, some additional details regarding the programs and services (e.g., details on the programs and initiatives, their duration, the associated funding as well as the additional supports provided to participants) are not available:
- Contrat d'intégration au travail (Work Integration contract)
- Formation de la main-d'œuvre Individus (Individual Workforce Training)
- Financement MESS (MESS funding)
- Projet préparation à l'emploi (Employment Preparation project)
- Recherche et innovation (Research and innovation)
- Recherche et innovation - jeunes en mouvement vers l'emploi (Research and innovation - Youth moving towards employment)
- Recherche et innovation - personnes handicapées vers l'emploi (Research and innovation - persons with disabilities to employment)
- Services d'aide à l'emploi (Employment Assistance Services)
- Subvention aux entreprises adaptées (Subsidies to Adapted Businesses)
- Soutien au travail autonome (Self-employment Support)
- Subventions salariales (Wage subsidies)
- Boni au maintien en emploi (Job retention bonuses)
- Initiatives ciblés travailleurs expérimentés (Initiatives targeting experienced workers)
- Microcrédit (Microcredits)
- Activités et services (Activities and services)
- Concertation pour l'emploi (Consultation and Collaboration for Employment)
- Formations de la main-d'œuvre Entreprises (Trainings for (future) Businesses Workforce)
3.2.6 Ontario
In this section
- Employment Benefits and Support Measures key facts
- Labour market context
- Canada-Ontario Labour Market Development Agreement
- Designated and under-represented groups
- Stakeholder consultations
- Program delivery and participant supports
Employment Benefits and Support Measures key facts
| Indicator | Active claimant clients | Former claimant clients | PPE clients | Non-insured clients | Total |
|---|---|---|---|---|---|
| Number served | 33,812 | 39,929 | 17,948 | 62,048 | 153,737 |
| Share of total | 22.0% | 26.0% | 11.7% | 40.4% | 100.0% |
- Notes:
- 1 This table reflects clients served between April 1, 2023 and March 31, 2024

Text description
| Year | Youth (15-24 years old) | Core-age (25-54 years old) | Workers aged 55+ |
|---|---|---|---|
| 2014-15 | 22.2% | 66.4% | 11.3% |
| 2015-16 | 22.8% | 65.7% | 11.5% |
| 2016-17 | 21.7% | 66.7% | 11.6% |
| 2017-18 | 23.7% | 64.2% | 12.0% |
| 2018-19 | 26.1% | 62.3% | 11.4% |
| 2019-20 | 21.9% | 65.9% | 12.0% |
| 2020-21 | 24.4% | 66.2% | 9.4% |
| 2021-22 | 24.8% | 65.5% | 9.6% |
| 2022-23 | 24.0% | 64.9% | 11.0% |
| 2023-24 | 20.8% | 68.5% | 10.6% |
- Notes:
- 1 This chart reflects clients served between April 1, 2014 and March 31, 2024.

Text description
| Year | Active claimant clients | Former claimant clients | PPE clients | Non-insured clients |
|---|---|---|---|---|
| 2014-15 | 63,061 | 19,734 | n/a | 71,278 |
| 2015-16 | 60,489 | 18,611 | n/a | 82,458 |
| 2016-17 | 62,339 | 24,796 | n/a | 103,402 |
| 2017-18 | 56,484 | 29,702 | n/a | 106,483 |
| 2018-19 | 53,221 | 26,626 | 25,228 | 100,631 |
| 2019-20 | 51,739 | 27,360 | 24,302 | 94,111 |
| 2020-21 | 41,545 | 21,023 | 15,325 | 61,254 |
| 2021-22 | 29,780 | 25,828 | 14,027 | 55,578 |
| 2022-23 | 26,667 | 38,406 | 18,311 | 68,801 |
| 2023-24 | 33,812 | 39,929 | 17,948 | 62,048 |
- Notes:
- 1 This chart reflects clients served between April 1, 2014 and March 31, 2024.
| Service type | Services delivered | Year-over-year change | Share of total | Year-over-year change (p.p.) |
|---|---|---|---|---|
| Employment Benefits | 40,061 | +2.1% | 19.4% | +0.3 |
| Employment Assistance Services | 166,926 | +0.4% | 80.6% | -0.3 |
| Total services | 206,987 | +0.7% | 100.0% | n/a |
- Notes:
- 1 This table reflects all new services started between April 1, 2023 and March 31, 2024.
| Employment Benefits | Services | Year-over-year change | Expenditures | Year-over-year change |
|---|---|---|---|---|
| Targeted Wage Subsidies | 0 | n/a | $0 | n/a |
| Self-Employment | 0 | n/a | $0 | n/a |
| Job Creation Partnerships | 75 | +31.6% | $1,267,018 | -6.6% |
| Skills Development-Regular | 7,949 | +5.3% | $210,120,656 | +5.8% |
| Skills Development-Apprentices | 32,037 | +1.3% | Included above | Included above |
| Targeted Earning Supplements | 0 | n/a | n/a | n/a |
| Totals | 40,061 | +2.1% | $211,387,674 | +5.7% |
- Notes:
- 1 This table reflects all new services started between April 1, 2023 and March 31, 2024.
| Support Measures | Services | Year-over-year change | Expenditures | Year-over-year change |
|---|---|---|---|---|
| Employment Services | 160,604 | -2.3% | $352,402,839 | +2.6% |
| Individual Counselling | 6,322 | +251.4% | Included above | Included above |
| Labour Market Partnerships | n/a | n/a | $48,348,198 | -7.1% |
| Research & Innovation | n/a | n/a | $122,333,388 | -11.0% |
| Totals | 166,926 | +0.4% | $523,084,425 | -1.8% |
- Notes:
- 1 This table reflects all new services started between April 1, 2023 and March 31, 2024.

Text description
| Year | Unpaid EI benefits | Returns to employment | Active claimant clients served | Total clients served |
|---|---|---|---|---|
| 2014-15 | $240,958,877 | 36,166 | 63,061 | 154,073 |
| 2015-16 | $236,037,611 | 35,625 | 60,489 | 161,558 |
| 2016-17 | $262,656,120 | 37,044 | 62,339 | 190,537 |
| 2017-18 | $233,152,537 | 39,678 | 56,484 | 192,669 |
| 2018-19 | $265,220,824 | 47,400 | 53,221 | 205,706 |
| 2019-20 | $250,508,356 | 46,864 | 51,739 | 197,512 |
| 2020-21 | $222,913,962 | 51,561 | 41,545 | 139,147 |
| 2021-22 | $443,437,968 | 64,607 | 29,780 | 125,213 |
| 2022-23 | $242,171,435 | 58,137 | 26,667 | 152,185 |
| 2023-24 | $250,122,741 | 54,918 | 33,812 | 153,737 |
- Notes:
- 1 Volatility in the estimated Unpaid EI Benefits from 2021‑22 to 2022‑23 correlates with the speed of recovery of the labour market that allowed many Canadians to return to work before exhausting their EI benefits.
- 2 This table excludes Indigenous pan-Canadian clients.
- 3 The employment returns reported apply specifically to EI-insured clients (active claimants, former claimants and PPE clients).
Labour market context
In 2023-24, Ontario continues to experience relatively tight labour market conditions, meaning low unemployment rate, elevated wage growth and a high number of unfilled jobs. Some employers in key sectors such as healthcare, skilled trades and technology faced challenges in recruiting and retaining workers with the skills needed to meet current demands. Demographic shifts, such as the aging Baby Boomer population and declining fertility rates, are shaping the labour market and will have long-term implications.
Ontario's unemployment rate for those aged 15 and over was 5.7% in 2023, a slightly increase from 5.6% in 2022.Footnote 49 In comparison, the unemployment rate for some groups such as Indigenous people, very recent immigrants and youth was much higher than the provincial average. For example, in 2023 the unemployment rate for Indigenous people aged 15 and over in Ontario was 8.3%Footnote 50 and the rate for youth aged 15-24 was 12.6%. Canada's unemployment rate was 5.4% in 2023 and 5.3% in 2022.Footnote 51
In March 2024, the province had approximately 213,000 job vacanciesFootnote 52 compared to approximately 576,000 persons who were unemployed, actively seeking employment within the last 4 weeks and available for work.Footnote 53
To address these challenges, Ontario is taking steps to bolster its workforce, including plans to optimize the selection of skilled workers under Ontario Immigrant Nominee Program in 2025 and beyond to fill critical gaps in industries such as manufacturing, healthcare and the skilled trades. With projected job openings of more than 500,000 in skilled trades related occupations alone by 2033, targeted employment and training supports funded through LMDA and WDA resources will play a crucial role in equipping workers with the skills necessary to thrive in the evolving economy.
Canada-Ontario Labour Market Development Agreement
In 2023-24, Ontario received approximately $792 million though the LMDA, which served approximately 153,700 clients. Within 6 months of receiving training and employment supports, approximately 74% of active claimant clients were employed,Footnote 54 resulting in an overall savings of approximately $250 million in unpaid EI benefits.
In 2023-24, Ontario used funding from the LMDA to:
- provide better training through the Skills Development Fund and other programs that target specific populations, including designated and/or under-represented groups
- help transition people from social assistance programs to meaningful jobs
- grow the skilled trades to modernize the skilled trades and apprenticeship system
For example, the In-Class Enhancement Fund (IEF) supported apprenticeship training by funding Ontario-approved Training Delivery Agents, including colleges and non-colleges such as union-affiliated or employer-sponsored training providers. By subsidizing in-class training costs, the IEF ensures apprentices receive high-quality instruction, facilitating their progression and completion. In 2023-24, with support from LMDA, the program served over 31,000 apprentices.
Furthermore, the Integrated Employment Services, delivered by Service System Managers, offers clients a range of employment and training supports and services to find and keep employment and match employers to workers with the right skills. Examples of services offered include employment counselling, employment-related skills workshops and activities, work with employers and communities to build the highly skilled and educated workforce Ontario needs to be competitive; and providing training resources and information services, including local labour market information for self-directed clients.
The Integrated Employment Services System is designated to support a diverse client base, including persons with disabilities, newcomers and racialized individuals. These clients received supports that had a real effect on their employment outcomes 73% of those who completed an exit survey upon completion of their program reported being employed.
Designated and under-represented groups
Ontario's LMDA programming served a diverse client base, committing to prioritizing inclusive training and employment initiatives to increase the labour market participation rate of under-represented groups address tight labour market conditions and elevated job vacancies in key sectors.
The Integrated Employment Services (IES) program continued to support the creation of a more efficient employment and assistance system that is responsive to local conditions. This program enhances accessibility and delivers better outcomes for job seekers, including individuals on social assistance and people with disabilities. In 2023-24, with supports from LMDA, the program served over 72,000 clients, which included:
- 45% women
- 49% newcomers
- 33% persons with disabilities
- 50% racialized people
- 4% Indigenous peoples
- 17% youth (15-24)
- 12% older workers (55+)
Stakeholder consultations
Ontario engaged with several stakeholders and partners in 2023-24, including official language minority community stakeholders, organizations representing employers, organizations representing employees, persons with disabilities stakeholders and Indigenous community organizations.
In late 2023 and early 2024, Ontario held consultations in preparation for the Ontario Budget. Key themes emerged that included:
- continuing investments in training more healthcare workers, strengthening residential construction workforce and supporting the settlement and economic success of increasing numbers of immigrants and asylum seekers
- challenges in attracting and retaining staff, especially in the skilled trades, health, farming and manufacturing sectors
- acute labour shortages and the need to invest in training new and current employees
- addressing labour challenges for under-represented groups
- providing equitable access to employment and training programs and incentivizing employers' participation in upskilling and reskilling programs
Additionally, Ontario continued to engage with urban Indigenous partners through the Urban Indigenous Engagement Table (UIET) in 2023-24. Representatives from Tungasuvvingat Inuit, Métis Nation of Ontario, Ontario Native Women's Association and Ontario Federation of Indigenous Friendship Centres were part of the table. The table provided input and recommendations to improve employment outcomes for urban Indigenous clients within the Integrated Employment Services model.
Ontario also continued to engage First Nations through a partnership with the Chiefs of Ontario to identify an approach to engagement and co-develop a First Nations model for employment services delivery. The Employment Table Working Group (ETWG), a First Nations-led working group established through this partnership with the Chiefs of Ontario, provided the province with recommendations on a path forward.
Better Jobs Ontario program
The Better Jobs Ontario (formerly Second Career) program is an application-based program that provides unemployed individuals with vocational skills training. BJO financial support can be used for training programs which take 52 weeks or less to complete and is available to unemployed individuals for which skills training is the most appropriate intervention to transition them into high-skill, in-demand occupations. This program is available to unemployed individuals, who have been laid-off and also those who are from a low-income household experiencing challenges attaching to the labour market. In 2023-24, with supports of LMDA, Better Jobs Ontario served over 2,400 participants. Underrepresented groups are also being assisted by this program, as 35% of 2023-24 participants self-identified as newcomers, 37% are women, 26% self-identified as visible minority.
Program delivery and participant supports
This section provides an overview of the specific programs offered through the LMDA. Please note that, due to the province's information gathering process, some additional details regarding the programs and services (e.g., details on the programs and initiatives, their duration, the associated funding as well as the additional supports provided to participants are not available:
In 2023-24, Ontario invested over $1 billion in employment and training, apprenticeship, adult education programs, which offered approximately 822,000 supports to Ontarians.
Employment Ontario network
The province's employment and training programs and services are primarily delivered through the Employment Ontario (EO) network, composed of Ontario's community-based network including employment service providers, literacy providers, public colleges, direct delivery apprenticeship offices and training delivery agents. EO helps people prepare for, find and keep full-time jobs. It connects employers, communities, incumbent workers and job seekers to meet the demands of evolving economic changes, addressing local labour market needs.
Ontario is undertaking a multi-year effort to improve its employment and training service delivery by integrating elements of its social assistance and employment and training programming. This will result in Ontario's service delivery being more responsive to local conditions, be easier for clients to navigate and foster more inclusive outcomes for job seekers, including those on social assistance and persons with disabilities.
Financial supports for individuals and employers
Unemployed individuals in Ontario can apply for financial support that covers their skills training and living expenses. Financial support is also provided to employers to purchase skills training for new hires and current employees or when apprentices meet specific training and certification milestones.
Job placement and retention supports and funding for basic work-related costs are provided to Ontarians with disabilities to help them transition to employment, find and keep employment and increase employment earnings.
In addition to LMDA and WDA funded programs and services, Ontario provided additional funding to support employers for retention and capacity building, to enhance employment pathways for workers and job seekers facing higher employment barriers, to encourage partnerships across the economy and support training solutions and encourage people with disabilities to find and maintain employment.
Research and innovation programs offset through Labour Market Development Agreement in 2023-24 Footnote 55
The following programs and initiatives are also supported by the provincial funding and by the Workforce Development Agreement. The program expenditures and results included in the table below only reflect the portion of program activities supported by Labour Market Development Agreement in 2023-24. For the LMDA funded portion, the targeted client group is EI Insured participants, while provincial funding and Workforce Development Agreement targeted client groups are broader.
Project title: Skills Development Fund
Expenditures: $68,563,254 (56.0%)
Description: Supports projects that enable market-driven solutions and unlock the economic potential of apprenticeship, skilled trades and broader workforce development initiatives to facilitate economic recovery. The SDF seeks to address the challenges of the pandemic and provides flexibility to support innovative proposals that are aligned with Ontario's workforce development objectives and its Skilled Trades Strategy.
Benefits and expected results: It is estimated that more than 38,300 individuals participated in SDF projects.Footnote 56
Project title: Pre-Apprenticeship Training Program
Expenditures: $29,486,683 (24.1%)
Description: Provides people with technical and employability training needed to enter an apprenticeship program. The program is designed to support potential apprentices who may need job readiness skills and trade readiness experience to gain employment as apprentices.
Benefits and expected results: The program intended to serve approximately 1,700 participants
Project title: Achievement Incentive Program
Expenditures: $22,324,760 (18.3%)
Description: Supports employers, including those in group sponsor arrangements, by providing a financial incentive when apprentices meet specific training and certification milestones. It is a systems-based grant program that helps employers (in all trades prescribed under the Ontario College of Trades and Apprenticeship Act, 2019) train apprentices by reducing some of the cost associated to training.
Benefits and expected results: More than 2,600 sponsors received funding supports for over 13,300 eligible clients.
Project title: Skills Ontario
Expenditures: $1,958,691 (1.6%)
Description: Works with schools, colleges, industry and governments to provide opportunities for youth to explore and develop skills for successful careers in the skilled trades and technologies. Funded activities include in-school presentations, Canada's largest skills competition, summer camps for skills development and in-school competitions.
Benefits and expected results: Over 47,000 people, including more than 2,800 competitors, attended the 2024 Skills Ontario Competition.
3.2.7 Manitoba
In this section
- Employment Benefits and Support Measures key facts
- Labour market context
- Canada-Manitoba Labour Market Development Agreement
- Designated and under-represented groups
- Stakeholder consultations
- Program delivery and participant supports
Employment Benefits and Support Measures key facts
| Indicator | Active claimant clients | Former claimant clients | PPE clients | Non-insured clients | Total |
|---|---|---|---|---|---|
| Number served | 5,822 | 4,138 | 2,905 | 12,687 | 25,552 |
| Share of total | 22.8% | 16.2% | 11.4% | 49.7% | 100.0% |
- Notes:
- 1 This table reflects clients served between April 1, 2023 and March 31, 2024.

Text description
| Year | Youth (15-24 years old) | Core-age (25-54 years old) | Workers aged 55+ |
|---|---|---|---|
| 2014-15 | 23.2% | 69.2% | 7.5% |
| 2015-16 | 22.8% | 69.3% | 7.8% |
| 2016-17 | 22.6% | 69.3% | 8.0% |
| 2017-18 | 22.0% | 69.2% | 8.7% |
| 2018-19 | 21.3% | 69.9% | 8.6% |
| 2019-20 | 25.3% | 66.6% | 8.0% |
| 2020-21 | 27.6% | 65.0% | 7.4% |
| 2021-22 | 25.5% | 67.2% | 7.3% |
| 2022-23 | 24.5% | 68.3% | 7.1% |
| 2023-24 | 24.1% | 68.9% | 6.9% |
- Notes:
- 1 This chart reflects clients served between April 1, 2014 and March 31, 2024.
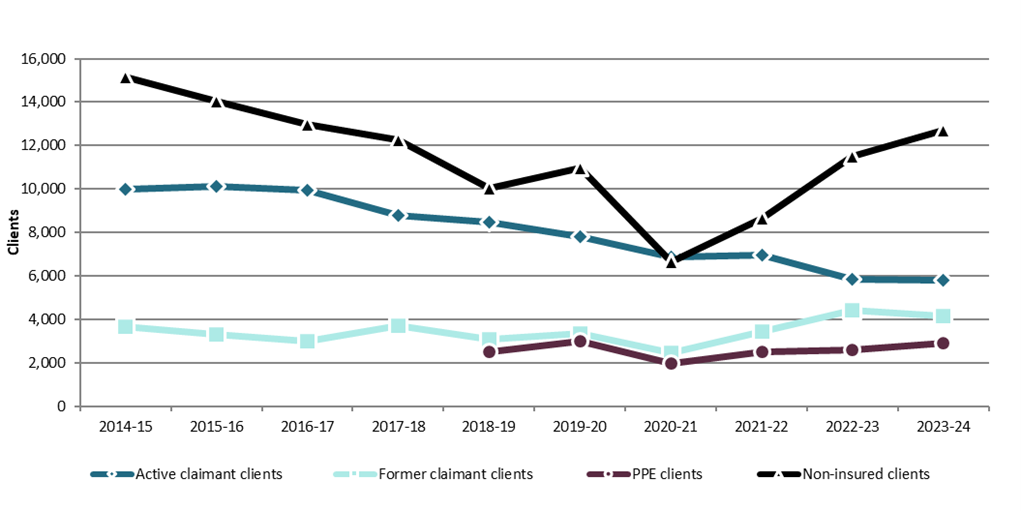
Text description
| Year | Active claimant clients | Former claimant clients | PPE clients | Non-insured clients |
|---|---|---|---|---|
| 2014-15 | 9,996 | 3,672 | n/a | 15,174 |
| 2015-16 | 10,132 | 3,292 | n/a | 14,056 |
| 2016-17 | 9,941 | 3,011 | n/a | 12,963 |
| 2017-18 | 8,792 | 3,729 | n/a | 12,279 |
| 2018-19 | 8,453 | 3,085 | 2,518 | 10,022 |
| 2019-20 | 7,801 | 3,352 | 3,013 | 10,990 |
| 2020-21 | 6,854 | 2,460 | 1,949 | 6,639 |
| 2021-22 | 6,944 | 3,444 | 2,519 | 8,668 |
| 2022-23 | 5,856 | 4,416 | 2,591 | 11,490 |
| 2023-24 | 5,822 | 4,138 | 2,905 | 12,687 |
- Notes:
- 1 This chart reflects clients served between April 1, 2014 and March 31, 2024.
| Service type | Services delivered | Year-over-year change | Share of total | Year-over-year change (p.p.) |
|---|---|---|---|---|
| Employment Benefits | 23,654 | +29.9% | 21.3% | +2.9 |
| Employment Assistance Services | 87,363 | +8.4% | 78.7% | -2.9 |
| Total services | 111,017 | +12.4% | 100.0% | n/a |
- Notes:
- 1 This table reflects all new services started between April 1, 2023 and March 31, 2024.
| Employment Benefits | Services | Year-over-year change | Expenditures | Year-over-year change |
|---|---|---|---|---|
| Targeted Wage Subsidies | 89 | +12.7% | $87,028 | -7.6% |
| Self-Employment | 37 | -58.9% | $280,131 | -35.8% |
| Job Creation Partnerships | 589 | +49.1% | $3,522,819 | -46.4% |
| Skills Development-Regular | 19,695 | +35.8% | $30,742,626 | +5.2% |
| Skills Development-Apprentices | 3,244 | +3.0% | Included above | Included above |
| Targeted Earning Supplements | 0 | n/a | n/a | n/a |
| Totals | 23,654 | +29.9% | $34,632,604 | -4.7% |
- Notes:
- 1 This table reflects all new services started between April 1, 2023 and March 31, 2024.
| Support Measures | Services | Year-over-year change | Expenditures | Year-over-year change |
|---|---|---|---|---|
| Employment Services | 31,492 | +9.1% | $12,878,841 | +19.2% |
| Individual Counselling | 55,871 | +8.0% | Included above | Included above |
| Labour Market Partnerships | n/a | n/a | $8,266,182 | -20.4% |
| Research & Innovation | n/a | n/a | $179,000 | -81.7% |
| Totals | 87,363 | +8.4% | $21,324,023 | -3.8% |
- Notes:
- 1 This table reflects all new services started between April 1, 2023 and March 31, 2024.

Text description
| Year | Unpaid EI benefits | Returns to employment | Active claimant clients served | Total clients served |
|---|---|---|---|---|
| 2014-15 | $43,089,409 | 7,156 | 9,996 | 28,842 |
| 2015-16 | $44,139,791 | 6,957 | 10,132 | 27,480 |
| 2016-17 | $46,591,343 | 6,565 | 9,941 | 25,915 |
| 2017-18 | $41,310,812 | 4,505 | 8,792 | 24,800 |
| 2018-19 | $42,169,989 | 4,470 | 8,453 | 24,078 |
| 2019-20 | $42,246,459 | 6,279 | 7,801 | 25,156 |
| 2020-21 | $37,080,692 | 4,751 | 6,854 | 17,902 |
| 2021-22 | $74,444,682 | 7,093 | 6,944 | 21,575 |
| 2022-23 | $39,556,692 | 6,685 | 5,856 | 24,353 |
| 2023-24 | $40,291,094 | 5,965 | 5,822 | 25,552 |
- Notes:
- 1 Volatility in the estimated Unpaid EI Benefits from 2021‑22 to 2022‑23 correlates with the speed of recovery of the labour market that allowed many Canadians to return to work before exhausting their EI benefits.
- 2 This table excludes Indigenous pan-Canadian clients.
- 3 The employment returns reported apply specifically to EI-insured clients (active claimants, former claimants and PPE clients).
Labour market context
Manitoba continues to be vulnerable to labour shortages that threaten the health and growth of its economy. Over the next 5 years, Manitoba's labour market is expected to remain tight in terms of the number of workers available compared to the number of job openings. However, this projection only considers the total number of workers that will be available - and does not adequately represent the challenge that occupational labour shortages and skills mismatches will present to most sectors.
The unemployment rate for those aged 15 and over in Manitoba was 4.8% in 2023, slightly higher than the unemployment rate of 4.6% in 2022.Footnote 57 In comparison, Canada's unemployment rate in 2023 was 5.4% and in 2022 was 5.3%.Footnote 58
The unemployment rate for youth (aged 15 to 24) in Manitoba was 9.6% in 2023, up from 8.6% in 2022, but remained below the national average of 10.8%. The unemployment rate for core working age (25-54) Manitobans was 4.0% in 2023, up from 3.6% in 2022, but below the 2023 national average of 4.5%. The unemployment rate in Manitoba for those aged 55 and over decreased from 4.3% in 2022 to 3.6% in 2023. This is below the 2023 national average which had an unemployment rate of 4.5% for those aged 55 and over.
In March 2024, the province had close to 25,000 job vacanciesFootnote 59 compared to approximately 36,700 persons who were without work, looked for work in the last 4 weeks and were available for work.Footnote 60
Despite this apparent surplus of job seekers, significant labour shortages and skills mismatched continues to restrict economic growth in key sectors. Manitoba is targeting these issues through several initiatives. This includes programming aimed at supporting unemployed and underemployed workers living in rural areas of the province to enter Manitoba's growing information techonology (IT) sector. Programming to address shortages in critical sectors, such as the trucking industry and healthcare is another focus for Manitoba.
Canada-Manitoba Labour Market Development Agreement
In 2023-24, Manitoba received approximately $63.2 million though the LMDA. Some 25,552 clients were served. Within 6 months of receiving training and employment supports, approximately 62% of active claimant clients were already employed which contributed to an overall savings of approximately $40.3 million in unpaid EI benefits.
Manitoba's LMDA programming provides Manitobans with a range of supports including skills development, training and work experience, in addition to helping employers attract skilled workers. In 2023-24, the LMDA programming included:
- Employment Assistance Services
- Labour Market Partnership
- Skills Development
- Targeted Wage Subsidies
- Self-Employment
- Job Creation Partnerships
- Targeted Earnings Supplements
For example, the Labour Market Partnership program supports private, public and community organizations with funding to address workforce development needs. The program aims to improve human resource management, create new jobs and foster economic growth, particularly for small to medium-sized enterprises. In 2023-24, the program served 417 employers.
Additionally, the Skills Development program offers financial support for individuals seeking employment-related training, including skills development, academic upgrading and apprenticeship programs. Targeting unemployed or low-skilled workers, it provides assistance with tuition, childcare, transportation and other costs. In 2023-24, the program served 7,085 clients.
Designated and under-represented groups
To address labour shortages and improve workforce inclusion and diversity, Manitoba is focusing on increasing participation from designated and/or under-represented groups, particularly its large Indigenous population, which makes up 15% of the province's population. Initiatives include:
- targeting immigration using a multifaceted approach aligned to occupation, industry and regional needs
- investing in skills development and demand-led training programs for under-represented groups
- streamlining credential recognition for newcomers
- improving participation rates of under-represented groups, particularly Indigenous peoples
Manitoba has engaged with stakeholders to better understand barriers to labour market entry and develop solutions to improve workforce participation. One insight from stakeholders was the need for more culturally-appropriate training and education resources that would support longer-term employment for Indigenous peoples, especially those in rural and remote areas.
Stakeholder consultations
Manitoba regularly meets with stakeholders to identify emerging issues and inform government strategies, initiatives and program priorities. Stakeholders include apprentices, employers and service providers, businesses and industry, post-secondary institutions, Indigenous organizations, sector councils, employment and training organizations and settlement organizations.
In 2023-24, Manitoba held a combination of formal and informal consultations with key stakeholders. Manitoba also maintains a close working relationship with hundreds of contracted third-party service providers and consults with these organizations throughout the year.
Key stakeholder observations from the forums included:
- broader access to program information through social media platforms is essential to marketing and outreach efforts to raise awareness and promote new and existing programs
- greater relationship building with Indigenous groups and communities, service delivery partners and industries is critical to the coordination of effective and appropriate employment and training program delivery to meet current labour market demands and Indigenous economic reconciliation
- improving training delivery methods using digital media platforms to overcome geographical and systemic barriers will help increase the participation of various clients, including youth who rely heavily on innovative digital media platforms for learning and outreach supports
- co-locating service delivery partners in rural and northern areas will improve training accessibility for remotely located citizens, including persons with disabilities and reduce barriers to accessing employment and training services
- working in partnership with stakeholders to develop simple and strong data collection models will help strengthen the evaluation of program outcomes
- labour shortages are a challenge across all sectors and employers are seeing skill mismatches between the current workforce/job seekers and available jobs. There is also significant out-migration of youth to other provinces
Eastside Industrial Coatings and Composites Ltd (EICC)
A family-owned business established in 1997, has been successfully serving original equipment manufacturers across North America with manufacturing solutions.
Through LMDA and WDA funding, EICC provided on-the-job and classroom training for 55 new and 155 existing employees. This support enabled EICC to achieve significant outcomes, such as:
- increased payroll employment by $1.5M for 55 new hires
- increased staff retention by 30% through the implementation of continuous improvement training
- commercial export sales up 100% with new client acquisitions
EICC is benefitting from a lower attrition rate with a more organized, structured onboarding experience and improved training for new employees has resulted in them becoming productive more quickly. Employees benefit by learning advanced manufacturing skills and techniques, which are taught to empower staff to improve processes with a more in-depth understanding of the process, the flow of the facility and the equipment they use. EICC aims to pay higher than market wages in exchange for high performance. This is achieved through training and providing staff with the right tools to meet those goals.
Program delivery and participant supports
This section provides an overview of the specific programs and financial supports available under the LMDA. It includes specific details on the programs and initiatives available, their duration associated funding and additional supports provided to participants. These programs and expenditures reflect projections based on base and a temporary additional LMDA funding allocated for 2023-24.This aims to demonstrate how these programs and initiatives align with federal and provincial priorities and support labour market integration.
Program: LMDA: Employment Assistance Services
Project expenditures: $7,570,000 (13.2.%)
Description: Community organizations offer a variety of short-term employment-related services to help individuals conduct a successful job search, find and keep a job and improve their employability
Areas of focus: Employment preparation
Target client groups:
- individuals with a current or previous EI claim
- individuals who paid employee's premiums in at least 5 of the previous 10 calendar years
- unemployed individuals
- job loss threatened individuals
- employed individuals working less than an average of 20 hours per week
Benefits and expected results:
- activities and services include employment plan development and counselling, assessment, labour market and education information provision, resume assistance and job referral/placement
- expected results include improvement in participants' general employability, reduced unemployment (increased employment) and direct savings to the Employment Insurance account through reduced dependency on government funded income support programs
Program: LMDA: Employment Partnerships
Project expenditures: $3,012,188 (5.3%)
Description: Assists communities, sector associations and employers to address labour force development needs while assisting eligible individuals to gain sustainable employment
Areas of focus: Employment preparation, training, employment partnerships
Target client groups:
- individuals with a current or previous EI claim
- individuals who paid employee's premiums in at least 5 of the previous 10 calendar years
- unemployed individuals
- low skilled existing workers
- job loss threatened individuals
Benefits and expected results:
- activities and services include pre-employment preparation, job-specific skills training and on-site hands-on training
- expected results include an increase in individuals' employability skills, reduced unemployment (increased employment) and direct savings to the Employment Insurance account through reduced dependency on government funded income support programs
Program: LMDA: Labour Market Partnerships
Projected Expenditures: $8,313,500 (14.0%)
Description: Provides private, public and community sector organizations with financial support to undertake activities that address labour market development, labour force development and workforce adjustment issues. Supports companies that are locating to or expanding within Manitoba with funding to train new and existing employees, develop training curriculum/learning materials and lease or purchase equipment/materials required for training. Assists companies to assess human resource management needs and develop/implement human resource and workforce training and development plans.
Areas of focus: Training, supports, employment partnerships
Target client groups:
- communities, sectoral associations and individual employers
- private, for-profit companies with a Canadian business number licensed to carry on business in Manitoba and are locating new operations in Manitoba or expanding existing Manitoba operations
- small and medium-sized enterprises
- large companies, particularly those operating in highly competitive markets
Benefits and expected results:
- activities and services include workforce development and adjustment activities to assist employers, employee associations and workers to deal with workforce changes, improve their capacity to implement workforce expansion, identify and create employment opportunities to address labour market supply and demand needs and support labour force development activities that help identify and address human resource and training needs in specific sectors
- assistance to companies with little or no capacity to develop HR management plans to maximize the contribution of their workforce to achieve business goals
- assistance to companies to develop and implement workforce training and development to achieve business goals
- assistance may include direct service delivery and brokering relevant internal/external resources
- expected results include an increase in companies' investments in their employees' skill level, new hires and creation of net new jobs and the economic benefit to Manitoba resulting from these employment opportunities
Program: LMDA: Research and Innovation
Project expenditures: $1,025,535 (1.8%)
Description: Provides financial support to organizations who research and design practical projects that identify innovative ways of helping individuals prepare for, find, return to, or maintain sustainable employment and strengthen and promote province-wide or regional labour force development.
Areas of focus: Building knowledge
Target client groups: Research institutions
Benefits and expected results:
- activities and services include research studies, information and/or data development, program/project evaluations and demonstration projects
- expected results include products that address the objectives and priorities of the R&I program, such as addressing policy and program issues, research and design projects that are practical and help identify innovative ways of helping individuals prepare for, find, return to or maintain sustainable employment and strengthen and promote province-wide or regional labour market development
Program: LMDA: Self Employment
Projected expenditures: $472,000 (0.8%)
Description: Contracts with local service providers to assist eligible individuals to create jobs for themselves by starting a business.
Areas of focus: Employment preparation, supports, training
Target client groups:
- individuals with a current or previous EI claim
- individuals who paid employee's premiums in at least 5 of the previous 10 calendar years
- employed individuals who are low skilled
- employment and Income Assistance recipients
- unemployed individuals
- job loss threatened individuals
Benefits and expected results:
- activities and services include training and supports to develop business plans and entrepreneurial skills and individual coaching/consulting on implementing plans
- expected results include reduced unemployment (increased employment), direct savings to the Employment Insurance account through reduced dependency on government funded income support programs and reduced EIA costs
Program: LMDA: Skills Development
Projected expenditures: $36,509,423 (64.0%)
Description: Assists eligible individuals who need training to find employment, including occupational and skills training, academic upgrading, literacy and English as an Additional Language training required for skills training or employment, apprenticeship training and co-operative education programs.
Areas of focus: Training, supports
Target client groups:
- individuals with a current or previous EI claim
- individuals who paid employee's premiums in at least 5 of the previous 10 calendar years
- unemployed individuals
- employed individuals who are low skilled
- employment and Income Assistance recipients
- job loss threatened individuals
Benefits and expected results:
- activities and services include direct financial assistance to attend employment related skills training including tuition, certification/licensing allowance, daycare costs, lodging and transportation
- expected results include increased employability skills, reduced unemployment (increased employment), direct savings to the Employment Insurance account through reduced dependency on government funded income support programs and reduced EIA costs
Program: LMDA: Skills Development Apprenticeship
Projected expenditures: $9,223,000 (16.0%)
Description: A vocational-based post-secondary training program that leads to a certificate of qualification in a skilled trade. Trade programs combine paid-on-the-job training with technical training in the classroom.
Areas of focus: Training, supports, employment partnerships
Target client groups:
- individuals with a current or previous EI claim
- individuals who paid employee's premiums in at least 5 of the previous 10 calendar years
- individuals approved to attend apprenticeship training
Benefits and expected results:
- activities and services include financial support for tuition, living allowance, transportation and childcare costs
- expected results include increased employability skills, reduced unemployment (increased employment), direct savings to the Employment Insurance account through reduced dependency on government-funded income support programs and reduced EIA costs
Program: LMDA: Wage Subsidy
Projected expenditures: $50,000 (0.08%)
Brief description of program - Areas of focus: Partners with employers to offset the cost of hiring and training new workers to assist eligible individuals in gaining full time employment
Areas of focus: Training, employment partnerships
Target client groups:
- individuals with a current or previous EI claim
- individuals who paid employee's premiums in at least 5 of the previous 10 calendar years
- employment and Income Assistance recipients
- unemployed or underemployed individuals
- job loss threatened individuals
Benefits and expected results:
- activities and services include work experience and job specific skills development
- expected results include increased employability skills, reduced unemployment (increased employment), direct savings to the Employment Insurance account through reduced dependency on government funded income support programs and reduced EIA costs
Program: LMDA: Industry Expansion
Projected expenditures: $238,003 (0.4%)
Description: This funding will be used to expand the number of companies that can access funding through the Industry Expansion program, which is aimed at supporting companies that are locating new operations to Manitoba or expanding existing Manitoba operations. The program assists companies by contributing to their investment in skills training for net new and existing employees.
Target client groups: Unemployed/under-employed individuals, existing workers who require upskilling
Benefits and expected results:
- 80 net new positions will be filled
- 175 existing workers will be upskilled
- company-specific key performance indicators will be achieved
3.2.8 Saskatchewan
In this section
- Employment Benefits and Support Measures key facts
- Labour market context
- Canada-Saskatchewan Labour Market Development Agreement
- Designated and under-represented groups
- Stakeholder consultations
- Program delivery and participant supports
Emplyoment Benefits and Support Measures key facts
| Indicator | Active claimant clients | Former claimant clients | PPE clients | Non-insured clients | Total |
|---|---|---|---|---|---|
| Number served | 5,299 | 4,969 | 3,788 | 718 | 14,774 |
| Share of total | 35.9% | 33.6% | 25.6% | 4.9% | 100.0% |
- Notes:
- 1 This table reflects clients served between April 1, 2023 and March 31, 2024.

Text description
| Year | Youth (15-24 years old) | Core-age (25-54 years old) | Workers aged 55+ |
|---|---|---|---|
| 2014-15 | 13.1% | 77.9% | 8.9% |
| 2015-16 | 13.0% | 78.0% | 8.9% |
| 2016-17 | 12.4% | 78.7% | 8.9% |
| 2017-18 | 24.2% | 69.6% | 6.2% |
| 2018-19 | 31.7% | 63.9% | 4.1% |
| 2019-20 | 18.0% | 72.0% | 9.8% |
| 2020-21 | 18.6% | 72.5% | 8.8% |
| 2021-22 | 14.3% | 75.6% | 10.0% |
| 2022-23 | 17.3% | 72.8% | 9.9% |
| 2023-24 | 18.0% | 72.8% | 9.2% |
- Notes:
- 1 This chart reflects clients served between April 1, 2014 and March 31, 2024.

Text description
| Year | Active claimant clients | Former claimant clients | PPE clients | Non-insured clients |
|---|---|---|---|---|
| 2014-15 | 10,503 | 2,565 | n/a | 813 |
| 2015-16 | 11,362 | 2,667 | n/a | 799 |
| 2016-17 | 11,542 | 2,742 | n/a | 1,040 |
| 2017-18 | 9,442 | 4,156 | n/a | 5,035 |
| 2018-19 | 8,850 | 6,058 | 7,772 | 2,527 |
| 2019-20 | 7,799 | 6,187 | 6,600 | 1,423 |
| 2020-21 | 6,882 | 4,924 | 4,511 | 858 |
| 2021-22 | 7,242 | 5,927 | 5,094 | 839 |
| 2022-23 | 5,412 | 5,843 | 4,876 | 798 |
| 2023-24 | 5,299 | 4,969 | 3,788 | 718 |
- Notes:
- 1 This chart reflects clients served between April 1, 2014 and March 31, 2024.
| Service type | Services delivered | Year-over-year change | Share of total | Year-over-year change (p.p.) |
|---|---|---|---|---|
| Employment Benefits | 10,638 | -25.0% | 57.7% | -3.3 |
| Employment Assistance Services | 7,799 | -13.9% | 42.3% | +3.3 |
| Total services | 18,437 | -20.7% | 100.0% | n/a |
- Notes:
- 1 This table reflects all new services started between April 1, 2023 and March 31, 2024.
| Employment Benefits | Services | Year-over-year change | Expenditures | Year-over-year change |
|---|---|---|---|---|
| Targeted Wage Subsidies | 0 | n/a | n/a | n/a |
| Self-Employment | 34 | -5.6% | $412,836 | +7.3% |
| Job Creation Partnerships | 0 | n/a | n/a | n/a |
| Skills Development-Regular | 6,766 | -35.2% | $27,027,292 | +7.5% |
| Skills Development-Apprentices | 3,838 | +3.4 | Included above | Included above |
| Targeted Earning Supplements | 0 | n/a | n/a | n/a |
| Totals | 10,638 | -25.0% | $27,440,128 | +7.5% |
- Notes:
- 1 This table reflects all new services started between April 1, 2023 and March 31, 2024.
| Support Measures | Services | Year-over-year change | Expenditures | Year-over-year change |
|---|---|---|---|---|
| Employment Services | 1,325 | -21.6% | $12,062,330 | -17.9% |
| Individual Counselling | 6,474 | -12.2% | Included above | Included above |
| Labour Market Partnerships | n/a | n/a | $9,778,316 | +6.4% |
| Research & Innovation | n/a | n/a | $62,602 | -38.6% |
| Totals | 7,799 | -13.9% | $21,903,248 | -8.7% |
- Notes:
- 1 This table reflects all new services started between April 1, 2023 and March 31, 2024.

Text description
| Year | Unpaid EI benefits | Returns to employment | Active claimant clients served | Total clients served |
|---|---|---|---|---|
| 2014-15 | $61,595,865 | 6,038 | 10,503 | 13,881 |
| 2015-16 | $61,550,486 | 6,204 | 11,362 | 14,828 |
| 2016-17 | $74,734,297 | 6,716 | 11,542 | 15,324 |
| 2017-18 | $50,378,925 | 4,879 | 9,442 | 18,633 |
| 2018-19 | $49,071,838 | 5,148 | 8,850 | 25,207 |
| 2019-20 | $48,249,012 | 8,127 | 7,799 | 22,009 |
| 2020-21 | $36,529,501 | 6,940 | 6,882 | 17,175 |
| 2021-22 | $83,581,517 | 9,182 | 7,242 | 19,102 |
| 2022-23 | $46,389,772 | 5,870 | 5,412 | 16,929 |
| 2023-24 | $44,013,787 | 4,938 | 5,299 | 14,774 |
- Notes:
- 1 Volatility in the estimated Unpaid EI Benefits from 2021‑22 to 2022‑23 correlates with the speed of recovery of the labour market that allowed many Canadians to return to work before exhausting their EI benefits.
- 2 This table excludes Indigenous pan-Canadian clients.
- 3 The employment returns reported apply specifically to EI-insured clients (active claimants, former claimants, and PPE clients).
Labour market context
In 2023-24, Saskatchewan's economy and labour market demonstrated strong growth, supported by one of the most engaged labour forces in Canada. The province recorded one of the highest employment rates and labour force participation rates among provinces. At the same time, shifts in the labour market, including challenges finding workers, posed significant risks to business expansion and economic growth. Labour demand was strong in Saskatchewan in 2023-24. The province had one of the highest average job vacancy rates at 4.4%. The province also had one of the tightest labour markets in the country, with a ratio of 1.4 unemployed persons for every vacant job, on average each month. As a result, many sectors were challenged with low/dwindling supplies of available workers.
The unemployment rate for those aged 15 and over in Saskatchewan was 5.5% in 2024, slightly higher than the unemployment rate of 4.8% in 2023.Footnote 61 In comparison, Canada's unemployment rate in 2024 was 6.4 percent and in 2023 was 5.4 percent.Footnote 62
Given the persistent labour shortages affecting many sectors, it is critical for Saskatchewan to ensure residents have access to training and workforce development supports to capitalize on current and future job opportunities. Labour market programming remains focused on addressing these shortages by delivering a broad suite of upskilling and training initiatives and career and employment services.
Canada-Saskatchewan Labour Market Development Agreement
In 2023-24, Saskatchewan received approximately $55.3 million though the LMDA and approximately 14,800 unique clients were served. Within 6 months of receiving training and employment supports, about 63% of active claimant clients were already employed which contributed to an overall savings of approximately $44 million in unpaid EI benefits.
Saskatchewan's LMDA programming helps individuals prepare for, obtain and maintain employment and assists employers to recruit, train and retain skilled workers. LMDA funding supports the development, delivery and evaluation of programs and services designed to meet labour market needs in the province.
In 2023-24, Saskatchewan provided career and employment services through offices across the province and through partnerships with third-party service providers. Services target specialized needs such as career counseling, vocational assessments, employment supports and work placement opportunities. Additionally, Saskatchewan provided financial and program support to training institutions, agencies and industries that deliver skills development services throughout the province.
Saskatchewan also continued to deliver Essential Skills (ES) programming to help adults build foundational skills such as literacy, numeracy and employability skills. Key components of ES programming include Adult Basic Education (ABE) and Essential Skills for the Workplace (ESWP) and GED testing). These programs support adults in entering or re-entering the workforce, pursuing further training, or advancing in their careers. In 2023-24, 6,600 individuals benefited from ES programming.
The province also delivered Skills Training (ST) programs to address the training needs of businesses and industries in areas of high demand. These programs included accredited and certificate diploma programs, as well as short-term and entry-level training through the Trades and Skills Centres and targeted supports for Northern Saskatchewan residents through the Northern Skills Training program. In 2023-24, approximately 3,600 individuals benefited from the ST programs.
In 2023-24, the province continued to support apprenticeship training to address the demand for skilled tradespeople in Saskatchewan. Apprenticeship and trade certification are important in fostering economic growth, developing a skilled workforce and ensuring the ongoing competitiveness of the labour market. The demand for apprentices and skilled tradespeople is on the rise. In 2023-24, approximately 4,304 apprentices received training.
Saskatchewan continued to expand experiential and work-integrated training opportunities for job seekers through Workforce Development programming, which included Self-Employment, Career Employment Services, Enhanced Career Bridging, Targeted Initiative for Older Workers and Training Voucher Program. Under this programming, clients received numerous services such as vocational assessments, career counselling, job readiness, life skills, entry-level skills, digital literacy skills, job development, basic skills training, job coaching and individualized employment-related supports. These services target unemployed and under-employed Saskatchewan residents, including Indigenous persons, youth, newcomers, persons with disabilities and older workers. Consideration is also given to persons in seasonal and resource-based sectors impacted by market factors or international trade disputes. In 2023-24, 15,605 clients participated in the programming.
Designated and under-represented groups
Funding targeted for under-represented groups assisted: Indigenous peoples, persons with disabilities, racialized people, women and underemployed or unemployed individuals. The Saskatchewan Labour Market Strategy, launched in March 2024, focuses on training, upskilling and prioritizing engagement of under-represented groups in the labour. For example, in 2023-24 the province:
- continued to offer the Northern Skills Training program to address academic and skills barriers for residents living in Northern Saskatchewan
- supported establishment of an additional cohort of the Mental Health and Wellness diploma program at the Saskatchewan Indian Institute of Technologies to meet demand in this occupation. The skills learned in the program enable newly graduated frontline workers to provide care to Indigenous individuals
- provided funding to the Saskatchewan Apprenticeship and Trade Certification Commission's Indigenous Apprenticeship Initiative to increase the recruitment of Indigenous peoples into apprenticeship and skilled trades careers. Projects include apprenticeship and pre-employment trades training with First Nation and Métis communities. In 2023-24, 17.1% of registered apprentices self-declared as Indigenous peoples
- partnered with industry representatives to deliver projects to increase Indigenous representation and address the critical labour shortage in potash mining and mining construction
- continued to provide the Workforce Development - Enhanced Career Bridging program to support job seekers facing barriers to employment. This program provides in-class training and helps to develop essential skills followed by a work placement. In 2023-24, 332 job seekers participated in the program, with 57% gaining employment or entering further training at the time of their completion
- partnered with third-party service providers to deliver the Newcomer Employability Supports program which assists newcomers with reaching a level of employment readiness that allows them to obtain and maintain employment. In 2023-24, more than 6,200 newcomers participated in the program. Of those who completed the program, 45% gained employment or pursued further education. Saskatchewan saw a 38% increase in participation numbers in comparison to 2022-23
- continued to deliver the Targeted Initiative for Older Workers program to increase the employability of older workers (aged 55 to 64) through a combination of in-class training and work placement. In 2023-24, 272 job seekers participated in the program, with 62% gaining employment or entering further training at the time of their completion
In addition, aiming to enhance Francophone participation in the labour force, Saskatchewan continued to partner with Francophone community-based organizations, which includes Assemblée Communautaire Fransaskoise (ACF) and Conseil économique et coopératif de la Saskatchewan (CÉCS). In 2023-24, ACF reported 202 newcomer clients needing settlement services which doubled compared to the previous year, CECS reported 118 placements for newcomer clients requesting employment services representing a 40% increase compared to 2022-23.
Stakeholder consultations
In 2023-24, Saskatchewan engaged and consulted with a broad range of stakeholder organizations including business and industry associations, individual employers, community leaders, community-based organizations, organizations providing employment services for people from under-represented groups, Francophone organizations, post-secondary education and training institutions, labour groups and ICT partner ministries, agencies and commissions. Stakeholder engagement offers the opportunity to discuss and receive advice on the array of programs and services delivered through the LMDAs. Stakeholder engagements are often held in the form of consultations, information sessions, employer outreach, conference calls, presentations and meetings. Through these engagements, key themes were raised by stakeholders that align with Saskatchewan's labour market goals:
- employers across various sectors are challenged with finding suitable candidates for vacant positions. This is due to several factors, including a tight labour force, lack of in-demand skills and competition for skilled talent domestically and internationally
- a shortage of skilled tradespersons to support public and private infrastructure investments/projects is a key challenge for economic growth. With a significant number of projects underway to support the Government of Saskatchewan's capital investment plan, the demand for skilled trades has increased exponentially
- there is a significant need for pre-trades training programs to establish a pipeline of talent in construction-related occupations
- there is increased demand for healthcare workers such as continuing care aides, psychiatric nurses, paramedics, laboratory technicians, medical radiation technologists, diagnostic sonography, among others. Attraction of healthcare workers to rural areas remains a priority
- enhanced partnerships with industry, Indigenous-led businesses and communities are needed to identify pathways and build capacity to increase Indigenous participation in the labour market
- there is a need to continue enhancing employment and economic opportunities for Indigenous communities in northern Saskatchewan, specifically transitions into post-secondary education with subsequent transitions into the labour market
- due to the growing Saskatchewan economy, there is an increased demand for specialized talent in regulated occupations. Specific sectors, including healthcare, trades and technology are facing shortages that require strategies to recruit and assess international qualifications and competencies
- similar to other jurisdictions, skilled workers may have difficulty getting their foreign credentials recognized in order to work in Saskatchewan. Licensure processes can be lengthy, costly and require individuals to meet stringent requirements for registration
- employment barriers exist for newcomers including education not aligned with Canadian curriculum, low language proficiency, or employers not recognizing international work experience
- there is a need to improve awareness, access and effectiveness of career supports to help job seekers become employed
- there is a great need to support retention and integration of newcomers in Saskatchewan through various settlement supports, including pre-arrival services
- specialized training and supervised work experience placements are needed to help internationally trained individuals develop the competencies required for working in regulated occupations
- Francophone organizations voiced a need to support Francophone participation in Saskatchewan's workforce by delivering more services in French
The Regina Work Preparation Centre Incorporated
The Government of Saskatchewan has partnered with the Regina Work Preparation Centre Incorporated (RWPC) for over 20 years to deliver specialized services that support jobseekers to become strong employees with the skills and capacities needed for workplace success.
Through the Employment Pathways Program, clients are supported to:
- develop action plans which help them move forward in their employment and training goals
- enhance their job search skills, with job matching, interview preparation and exploration of labour market opportunities
- connect with additional employment services, training, or other vocational assessment supports
In 2023-24 over 250 individuals participated in the program with over 50 per cent finding employment, or enrolling in further education or training and an additional 21 per cent being job ready.
The partnership with the RWPC has also led to the addition of new initiatives including digital literacy training for job seekers and exploration of in-demand careers using Virtual Reality (VR) technology. VR technology provides innovative career exploration for job seekers, assisting them to determine the skills they have and identify skills pathways for upskilling that can expand career opportunities with in-demand industries in Saskatchewan. The made-in Saskatchewan simulations are managed by RWPC and accessible on the CareerLabsVR platform. These simulations are used by over 25 Saskatchewan service providers to encourage job seekers to pursue in-demand careers.
Program delivery and participant supports
This section provides an overview of the specific programs and financial supports available under the LMDA. It includes specific details on the programs/initiatives available, their duration associated funding and additional supports provided to participants. This aims to demonstrate how these programs and initiatives align with federal and provincial priorities and support labour market integration. Saskatchewan's labour market programs are funded through a combination of funding sources such as LMDA, WDA and provincial budget. In 2023-24, Saskatchewan spent a total of $130.6 million on labour market programming. The table below includes information about the LMDA portion of funding for the labour market programming in 2023-24.
Program: Essential Skills (ES)
Expenditure: $4,442,000 (9.0%)
Description: Through ES programming, participants acquire the knowledge, skills and attitudes needed to enter or re-enter the labour force, move on to further training or advance in a chosen career. ES programming helps adults improve their literacy level and develop essential and employability skills. Learners who successfully complete Level 3 (also known as Adult 10) receive a certificate of completion and those who complete Level 4 (or Adult 12) achieve a Grade 12 standing. The ES program includes Adult Basic Education (ABE) and the Essential Skills for the Workplace (ESWP) and the GED testing
Target client groups: ES programs are available to all adults at least 18 years of age and out of school for at least 1 year; who wish to enter or re-enter the labour force; who need further training; or who wish to advance in a chosen career
Benefits and expected results: Over 6,600 learners participated in ES funded programs in 2023-24. Learners develop the skills and competencies needed to acquire and retain employment, resulting in increased earnings, decreased use of social support(s) and improved learner wellness and well-being.
- completion rate – 66%
- total Employment – 18%
- further Education – 54%
Program: Skills Training Allocation (STA) and Northern Skills Training (NST)
Project expenditure: $6,200,000 (12.5%)
Description: The STA program is designated to address the training needs of Saskatchewan businesses and industry in the areas of greatest labour market demand and promote equity participation in training delivery. Credit training programs for occupations in demand are delivered through publicly funded post-secondary training institutions.
The NST program addresses unique academic and skills barriers that adults in the north face when seeking employment. Successful program participants acquire the occupational skills that address employer needs and that help transition participants to employment. Learners acquire occupational/technical skills and consequently increase their employability. As well, funding allows training institutions to deliver accredited programs that meet employer needs. In 2023-24, program offerings included: Early Childhood Education, Indigenous Practical Nursing, Heavy Equipment Operator, Mineral Exploration Techniques, Radiation and Environmental Monitoring, Mental Health and Wellness and Harvester Training and Scaffolding.
STA Target client groups: The STA programs are open to all adults seeking opportunities to improve skills development. The STA program has a strong emphasis on improving the employability of under-represented groups (e.g., Indigenous people, social assistance recipients, persons with disabilities, women in under-represented occupations, immigrants, racialized people and youth) leading to long-term sustainable employment.
NST Target client groups: The NST focuses on learners in Northern Saskatchewan communities. 10 NST programs were offered in Air Ronge, Buffalo Narrows, Creighton and Stony Rapids.
STA Benefits and expected results:
- over 3,100 learners participated in STA funded programs in 2023-24.
- completion Rate – 82%
- employment Rate – 60%
- further Education Rate – 32%
NST Benefits and expected results:
43 learners participated in NST programs with a completion rate of 95%, of those who completed their program, the employment rate was 49%.
Program: Trades and Skills Centres (TSCs)
Project expenditure: $519,000 (1.1%)
Description: The TSCs deliver trades and skills programs that lead to entry-level jobs in industries where workers are in high demand. They deliver training in many different occupations such as plumbing, health care, culinary arts, commercial construction, scaffolding, painting, roofing, electrical and more. The TSCs serve low skilled adults and youth in Regina and Saskatoon. Trainees are engaged in work experience training that mimics an employment experience while receiving wage-based income support.
Target client groups: Low-skilled and under-employed adults, who want to enter one of the designated skilled trades while in a training system
Benefits and expected results: Over 400 learners participated in 33 programs in 2023-24.
- completion rate – 83%
- employment rate (of those who completed programming) – 84%
Program: Workforce Development (WFD)
Project expenditure: $12,101,000 (24.5%)
Description: WFD programs help people prepare for, find and maintain employment. Saskatchewan contracts third-party service providers to deliver programs and services based on client and industry needs, that target specific under-represented groups as well as more generalized supports for a wide range of job seekers to address employment barriers, such as low literacy (reading, numeracy and computer skills), little or no work experience, disability, social barriers, addictions, etc. Programs and services include but are not limited to vocational assessments, career counselling, job readiness, life skills, entry level skills, digital literacy skills, work experience, job development, basic skills training, job coaching, job search assistance, occupational skills training, interview preparation and individualized training and employment related supports.
Target client groups: Unemployed and under-employed Saskatchewan residents who face barriers to employment including specific demographic groups such as Indigenous persons, youth, women, newcomers and persons with disabilities and older workers. Consideration is also given for persons in resource-based or in-demand workforce sectors. Programming was also available to support individuals pursuing self employment.
Benefits and expected results:
In 2023-24, 15,605 job seekers participated in WFD programming with 47% of participants finding employment and 9% going on to further education/training.
Findings from the 2023-24 3-month and 12-month client follow-up surveys indicate that program participants saw an increase in employment from 41% pre-program up to 49% 3 months post-program and up to 54% 12 months post-program.
Employers are supported in hiring persons from under-represented groups. According to the results of the above-mentioned survey, 53% of respondents were Indigenous, 37% were recent immigrants and 14% were persons with disabilities.
Program: Saskatchewan Apprenticeship and Trade Certification Commission
Project Expenditure: $13,319,000 (26.9%)
Description: The Saskatchewan Apprenticeship and Trade Certification Commission (SATCC) arranges apprenticeship training to meet the direct needs of employers in Saskatchewan's labour market. The SATCC is also responsible for the certification of qualified tradespeople who have developed the necessary skills and obtained the necessary work experience in non-compulsory trades.
Target client groups: Adults wanting to enter one of the designated skilled trades while in a training system combining on-the-job experiential learning with time spent in a classroom setting.
Benefits and expected results: The 2023-24 Apprenticeship Training Programs results:
- Apprentices in Technical Training and Upgrading – 4,094
- New Registered Apprentices – 2,331
- SATCC Trade Clients served – 10,765
- Indigenous Apprentices at Year-End – 1,152
- Share of Indigenous Apprentices – 17.1%
- Youth Apprentices Registered – 3,045
- Women Apprentices Active – 667 (9.9%)
- Journeyperson Certificates Issued – 983
Program: Apprenticeship Training Allowance (ATA)
Project Expenditure: $2,359,000 (4.8%)
Description: The ATA is available to eligible apprentices while they attend technical training. The funding helps apprentices maintain a second residence while attending technical training.
Target client groups: Employment Insurance (EI) eligible apprentices attending apprenticeship technical training
Benefits and expected results: In 2023-24, 1,645 apprentices received the ATA to participate in apprenticeship technical training.
Program: Canada-Saskatchewan Job Grant (CSJG)
Project expenditure: $9,778,000 (19.8%)
Description: The SJG supported local employers by providing funding to train and develop a competent workforce, ensuring employees are equipped with the necessary skills to be successful in new jobs or be promoted to better jobs. As an employer-driven program, businesses chose the training, training provider and trainees that met their labour market needs.
Target client groups: Employers in the private and not-for-profit sector operating in the province
Benefits and expected results: In 2023-24, employers submitted 1,825 applications, which is a slight decrease of 1% when compared to 2022-23. Saskatchewan approved 1,190 job grants which supported close to 990 unique employers with funding to train 1,912 employees.
Program: Newcomer and Settlement
Project expenditure: $763,000 (1.5%)
Description: Settlement funding provides a comprehensive range of programs and services delivered by third-party organizations for newcomers aimed at community settlement, integration and employment services and skills training to help newcomers attach to the labour market. Settlement programs and services include orientation and planning, English language training, employment supports, credential recognition services and referrals to community services.
Target client groups: Newcomers to Saskatchewan including temporary workers, permanent residents and refugees and international students seeking supports to address barriers to settlement and employability
Benefits and expected results: The Ministry has 16 agreements with third-party service providers for Newcomer and Settlement supports to provide specialized services for newcomers experiencing cultural, language or other barriers to employment.
In 2023-24, there were 6,215 participants, which is a 38% increase from 4,498 participants in 2022-23.
Approximately 45% of newcomers completing their program find employment or go on to further training. The number of employed newcomers as a result of completing the program increased from 909 to 1,576 and the number of newcomers taking further training increased from 347 to 367. This represents a year-to-year increase of almost 55% for newcomers gaining employment or going on to further training from 2022-23 to 2023-24.
According to the 2023-24 3-month and 12-month client follow-up surveys, newcomer and settlement program participants saw an increase in employment from 47 per cent pre-program to 68% 12 months post-program.
3.2.9 Alberta
In this section
- Employment Benefits and Support Measures key facts
- Labour market context
- Canada-Alberta Labour Market Development Agreement
- Designated and under-represented groups
- Stakeholder consultations
- Program delivery and participant supports
Employment Benefits and Support Measures key facts
| Indicator | Active claimant clients | Former claimant clients | PPE clients | Non-insured clients | Total |
|---|---|---|---|---|---|
| Number served | 21,697 | 10,501 | 3,674 | 20,539 | 56,411 |
| Share of total | 38.5% | 18.6% | 6.5% | 36.4% | 100.0% |
- Notes:
- 1 This table reflects clients served between April 1, 2023 and March 31, 2024.

Text description
| Year | Youth (15-24 years old) | Core-age (25-54 years old) | Workers aged 55+ |
|---|---|---|---|
| 2014-15 | 20.8% | 69.0% | 10.2% |
| 2015-16 | 18.9% | 69.9% | 11.2% |
| 2016-17 | 18.8% | 69.5% | 11.7% |
| 2017-18 | 19.6% | 68.1% | 12.3% |
| 2018-19 | 19.0% | 63.2% | 11.8% |
| 2019-20 | 19.8% | 68.6% | 11.4% |
| 2020-21 | 25.6% | 66.7% | 7.6% |
| 2021-22 | 26.2% | 65.5% | 8.3% |
| 2022-23 | 25.9% | 65.3% | 8.8% |
| 2023-24 | 28.6% | 63.6% | 7.8% |
- Notes:
- 1 This chart reflects clients served between April 1, 2014 and March 31, 2024.

Text description
| Year | Active claimant clients | Former claimant clients | PPE clients | Non-insured clients |
|---|---|---|---|---|
| 2014-15 | 43,398 | 15,820 | n/a | 60,344 |
| 2015-16 | 51,694 | 16,213 | n/a | 60,191 |
| 2016-17 | 49,720 | 14,087 | n/a | 54,258 |
| 2017-18 | 35,101 | 15,856 | n/a | 38,909 |
| 2018-19 | 30,363 | 13,036 | 8,388 | 31,484 |
| 2019-20 | 27,561 | 13,704 | 7,759 | 27,886 |
| 2020-21 | 22,094 | 7,577 | 3,796 | 17,506 |
| 2021-22 | 22,074 | 8,962 | 3,675 | 17,642 |
| 2022-23 | 19,654 | 10,756 | 3,886 | 17,455 |
| 2023-24 | 21,697 | 10,501 | 3,674 | 20,539 |
- Notes:
- 1 This chart reflects clients served between April 1, 2014 and March 31, 2024.
| Service type | Services delivered | Year-over-year change | Share of total | Year-over-year change (p.p.) |
|---|---|---|---|---|
| Employment Benefits | 21,956 | +9.2% | 21.5% | +0.6 |
| Employment Assistance Services | 80,006 | +5.3% | 78.5% | -0.6 |
| Total services | 101,962 | +6.1% | 100.0% | n/a |
- Notes:
- 1 This table reflects all new services started between April 1, 2023 and March 31, 2024.
| Employment Benefits | Services | Year-over-year change | Expenditures | Year-over-year change |
|---|---|---|---|---|
| Targeted Wage Subsidies | 136 | -6.8% | $1,216,000 | +15.7% |
| Self-Employment | 218 | +6.9% | $1,570,442 | -12.4% |
| Job Creation Partnerships | 0 | n/a | $0 | 0% |
| Skills Development-Regular | 2,732 | -16.4% | $120,414,000 | -35.2% |
| Skills Development-Apprentices | 18,870 | +14.5% | Included above | Included above |
| Targeted Earning Supplements | 0 | n/a | n/a | n/a |
| Totals | 21,956 | +9.2% | $123,200,679 | -25.0% |
- Notes:
- 1 This table reflects all new services started between April 1, 2023 and March 31, 2024.
- 2 2022-23 EI MAR Revision: AB skills development should have been $104,088,000 and job creation partnerships should have been $0.
| Support Measures | Services | Year-over-year change | Expenditures | Year-over-year change |
|---|---|---|---|---|
| Employment Services | 11,811 | +2.7% | $71,272,275 | +47.7% |
| Individual Counselling | 68,195 | +5.8% | Included above | Included above |
| Labour Market Partnerships | n/a | n/a | $10,652,786 | +68.2% |
| Research & Innovation | n/a | n/a | n/a | n/a |
| Totals | 80,006 | +5.3% | $81,925,061 | +31.6% |
- Notes:
- 1 This table reflects all new services started between April 1, 2023 and March 31, 2024.

Text description
| Year | Unpaid EI benefits | Returns to employment | Active claimant clients served | Total clients served |
|---|---|---|---|---|
| 2014-15 | $266,985,993 | 25,745 | 43,398 | 119,562 |
| 2015-16 | $267,881,263 | 26,525 | 51,694 | 128,098 |
| 2016-17 | $384,909,915 | 29,671 | 49,720 | 118,065 |
| 2017-18 | $233,417,003 | 18,726 | 35,101 | 89,866 |
| 2018-19 | $205,883,273 | 18,669 | 30,363 | 83,271 |
| 2019-20 | $195,730,747 | 18,094 | 27,561 | 76,910 |
| 2020-21 | $139,176,642 | 17,867 | 22,094 | 50,973 |
| 2021-22 | $303,807,613 | 26,311 | 22,074 | 52,353 |
| 2022-23 | $197,849,296 | 21,405 | 19,654 | 51,751 |
| 2023-24 | $198,920,239 | 22,861 | 21,697 | 56,411 |
- Notes:
- 1 Volatility in the estimated Unpaid EI Benefits from 2021‑22 to 2022‑23 correlates with the speed of recovery of the labour market that allowed many Canadians to return to work before exhausting their EI benefits.
- 2 This table excludes Indigenous pan-Canadian clients.
- 3 The employment returns reported apply specifically to EI-insured clients (active claimants, former claimants, and PPE clients).
Labour market context
In 2023-24, Alberta focused on addressing market instability and economic challenges following a period of economic downturn. While job vacancies have been declining over the past year, they remain high compared to pre-pandemic levels. Despite robust population growth, Alberta's labour market continues to face sector-specific labour supply challenges, particularly in healthcare and skilled trades. Upskilling remains a priority to adapt to a rapid changing labour environment driven by automation and digitization.
The unemployment rate for those aged 15 and over in Alberta was 5.9% in 2023, slightly higher than 5.8% in 2022.Footnote 63 By comparison, Canada's unemployment rate in 2023 was 5.4% up from 5.3% in 2022.Footnote 64
In March 2024, the province reported over 76,200 job vacanciesFootnote 65 compared to approximately 169,100 individuals who were unemployed, actively looking for work within the last 4 weeks and available for work.Footnote 66
Similar to other provinces, Alberta faces challenges associated with an aging population. While population growth remains robust, the province is experiencing challenges with the integration of this rapid growth into its labour market, contributing to elevated unemployment rates.
Employers have identified 2 major challenges in the current labour market: fewer applicants and a mismatch in skills. In response, Alberta is focusing on increasing labour market participation rates among youth and under-represented groups, as well as leveraging immigration to fill job vacancies.
Canada-Alberta Labour Market Development Agreement
In 2023-24, Alberta received approximately $214.7 million through the LMDA, which served approximately 56,400 clients. Within 6 months of receiving training and employment supports, approximately 71% of active claimant clients were employed, resulting in an estimated $199 million in savings from unpaid EI benefits.
The LMDA funding supported initiatives to connect employers with job seekers and provide training for jobs in growth sectors such as energy, agriculture/forestry, tourism, culture, technology, aviation and aerospace, logistics and finance.
For example, in 2023-24, Alberta provided a technical training program for apprentices, covering the cost of training delivered by approved training providers to individuals registered in an apprenticeship program in Alberta. In 2023-24, the program served 18,870 clients.
Furthermore, the Driving Back to Work Grant program received funding through the LMDA to address the commercial truck driver shortage by subsidizing up to 90% of training and testing costs for unemployed individuals seeking a Class 1 drivers license. In 2023-24, the program served 155 clients with a completion rate of 91.4%.
Designated and under-represented groups
Alberta's LMDA programming serves a diverse client base, with a continued focus on supporting designated and/or under-represented groups, including Indigenous peoples, older workers, newcomers, persons with disabilities, women and youth. 2023-24 funding helped address labour shortages, unemployment and removing barriers to employment for under-represented groups, through skills training, improved access to education and employment support.
The Employment Partnerships program focused on labour market participation and fostering inclusion for Indigenous Albertans. In 2023-24, it served approximately 1,730 clients. Additionally, Alberta collaborated with Indigenous communities through the Career and Employment Information Services (CEIS), which delivers workshops on and off reserves to help clients secure and maintain employment while building career service capacity in these communities.
Stakeholder consultations
In 2023-24, Alberta maintained regularly engagement with stakeholders through formal meetings and informal interactions. These efforts focused on understanding the current labour market context and targeting in-demand sectors and jobs. Insights gathered from these consultations helped Alberta plan for programming, future workforce demands and skills training initiatives. Stakeholders included community stakeholders, training providers, employers, industry groups and other government organizations.
For example, Alberta met with industry stakeholders through roundtables, national advisory committee meetings and labour market information sessions to discuss labour market partnerships and attraction and retention partnerships.
At the regional level, Alberta worked closely with stakeholders to identify and address region-specific workforce needs across the province. Employers and industry stakeholders were consulted in developing regional training programs and services and hire clients who complete these programs. This process ensured that industry and employers are involved and are interested in having these programs in their community.
Furthermore, Alberta engages stakeholders annually in budget planning processes to ensure that LMDA-funded programs and services remain efficient, viable and align with Alberta's labour market priorities.
Red Deer Employment Services
Employment Placement and Supports Services (EPSS) provide several employment support services to Albertans. Between April 1, 2023 to March 31, 2024 the program served:
- Resource centre: 473
- Job placement: 191
- Career consulting: 186
- Exposure courses:15
An EI-eligible client with a diverse background and education sought guidance on her employment. She was referred to EPSS for employment supports, where staff helped her revamp her resume and prepare for interviews through workshop focused on behavioural questions and responses. She also participated in exposure courses.
The client started her job search and secured her first interview with a local community service organization, where she was offered a position as a Youth and Family Counsellor. This client also advanced to the second stage of the interview process for a federal government position as a Judicial Clerk. Given the lengthy nature of the federal government process, the client opted to accept the position with the local community service organization in the meantime. EPSS continues to provide her with employment support and follow up services as she progresses in her career journey.
Program delivery and participant supports
This section provides an overview of the specific programs and financial supports available under the LMDA. It includes specific details on the programs/initiatives available, their duration, associated funding and additional supports provided to participants. This aims to demonstrate how these programs and initiatives align with federal and provincial priorities and support labour market integration.
Program: Job Search Assistance
Description:
- Transition to employment services: customized work-directed services to help individuals acquire workplace and occupational skills to facilitate their rapid (re-) attachment to the labour market
- Job Search Assistance (exposure course): provides job ready individuals with skills needed to quickly obtain employment
- Job placement: connects individuals seeking work with employers seeking to fill job openings
Target client groups: EI Insured participants
Program: Counselling / Case Management
Project expenditures: $19,800,000 (9.7%)
Description:
- Career and employment assistance services: services include career counselling, career planning and job search, job placement and employment support services
- Case management: provides support to individuals during the implementation and progression through their individual Service Plan
- WORP post intervention survey (evaluation and analysis): a component of case management to support an individual's progression through their service plan and includes follow-up to confirm completion of the plan and obtain outcome information
Target client groups: All individuals
Program: Unassisted Services
Project expenditures: $29,500,000 (14.4%)
Description:
- Resource centre: access to informational resources, tools and technical equipment on topics such as career planning, education, job search and labour market information
- Career and job fair: fairs showcase a variety of career and employment options, employer options, industry information, postsecondary choices and labour market facilitation
- Group information sessions (e.g. workshops): address a variety of career and employment needs
- CEIS Grants: employment related events such as job/career fairs, employer connections, conferences and speaking events
- Workplace and career planning (ALIS website): career planning, job search and labour market information available through print and online services
- Labour Market Information Product (evaluation and analysis): development of Labour Market information (wage and salary) to assist job seekers, career planners, etc. to support informed evidence-based decisions
Target client groups: All individuals
Program: Short-Term Training
Project expenditures: $500,000 (0.2%)
Description:
- Integrated training program costs: skills-based training that combines academic and general employability skills with occupation-related
- Integrated Foundational Pathways program costs: a unique blend of essential skills, academics and applied skills development designed to build upon foundational skills
- Integrated training program costs: skills-based training that combines academic and general employability skills with occupation-related skills
- Training for Work (integrated, immigrant bridging and self-employment) financial assistance costs: needs-based financial assistance for eligible participants attending full-time approved training
- Pre-apprenticeship training program costs: skills-based training that combines academic and general employability skills with occupation-related skills
- Short-term training financial assistance costs: needs-based financial assistance for eligible participants attending full-time approved Integrated Skills Training, Pre-Apprenticeship Training and Integrated foundational pathways
- Immigrant bridging program costs: integrated training programs that focus on training skilled immigrants with prior education and experience in a specific occupation, so that they can bridge gaps in knowledge skills in order to gain employment in that occupation or a related occupation
Target client groups: EI Insured participants
Program: Occupational Skills Training
Project expenditures: $26,900,000 (13.1%)
Target client groups: EI-Insured participants
Program: Literacy, Essential Skills, Language Training and Adult Basic Education
Project expenditures: $22,900,000 (11.2%)
Description:
- Foundational learning (academic upgrading and Adult Basic Education) program costs: training in literacy and numeracy ranging from basic skills to adult academic subjects needed to meet post-secondary entry requirements
- Foundational learning (English as an additional language) program costs: training to improve English language competencies for individuals whose first language is other than English
- Financial assistance costs - Foundational learning: needs-based financial assistance for eligible participants attending full-time approved Academic upgrading, Adult Basic Education and English as an Additional Language
Target client groups: EI Insured participants
Program: Apprenticeship
Project expenditures: $65,700,000 (32.0%)
Description:
Apprentice training program costs: technical training, delivered by an Alberta approved training provider, to individuals registered in the Alberta apprenticeship program
Target client groups: EI Insured participants
Program: Targeted Wage Subsidies
Project expenditures: $1,000,000 (0.5%)
Description:
Workplace training program costs: individually-focused worksite training provided by an employer. The employer receives a subsidy to offer on-the-job training, or a short term paid work experience to individuals with barriers to employment
Target client groups: EI Insured participants
Program: Self-Employment Assistance
Project expenditures: $1,700,000 (0.8%)
Description:
Self employment program costs: training on business plan development, business counselling, coaching and guidance to facilitate entry into self-employment for participants who have a viable business idea
Target client groups: EI Insured participants
Program: Labour Market Partnerships
Project expenditures: $15,900,000 (7.8%)
Description:
- Labour Market Partnerships: identify, develop and support projects with industry, organizations and community groups to enhance human resource development and labour market adjustment strategies
- Agriculture, Forestry and Rural Economic Development Project: identify, develop and support projects with industry, organizations and community groups to enhance human resource development and labour market adjustment strategies
- Employment Partnership Program: identify, develop and support projects with industry, organizations and community groups to enhance human resource development and labour market adjustment strategies
- Employer Sponsored Training: training for workers to help them upgrade or acquire new skills to maintain employment
Target client groups: EI Insured participants
3.2.10 British Columbia
In this section
- Employment Benefits and Support Measures key facts
- Labour market context
- Canada-British Columbia Labour Market Development Agreement
- Designated and under-represented groups
- Stakeholder consultations
- Program delivery and participant supports
Employment Benefits and Support Measures key facts
| Indicator | Active claimant clients | Former claimant clients | PPE clients | Non-insured clients | Total |
|---|---|---|---|---|---|
| Number served | 20,977 | 10,505 | 4,179 | 25,422 | 61,083 |
| Share of total | 34.3% | 17.2% | 6.8% | 41.6% | 100.0% |
- Notes:
- 1 This table reflects clients served between April 1, 2023 and March 31, 2024.

Text description
| Year | Youth (15-24 years old) | Core-age (25-54 years old) | Workers aged 55+ |
|---|---|---|---|
| 2014-15 | 15.0% | 69.9% | 15.1% |
| 2015-16 | 14.5% | 70.3% | 15.2% |
| 2016-17 | 13.9% | 70.6% | 15.5% |
| 2017-18 | 12.6% | 70.9% | 16.5% |
| 2018-19 | 14.1% | 69.1% | 16.4% |
| 2019-20 | 18.0% | 67.3% | 14.6% |
| 2020-21 | 19.7% | 68.7% | 11.6% |
| 2021-22 | 19.8% | 67.6% | 12.5% |
| 2022-23 | 19.2% | 68.2% | 12.5% |
| 2023-24 | 20.0% | 68.3% | 11.7% |
- Notes:
- 1 This chart reflects clients served between April 1, 2014 and March 31, 2024.

Text description
| Year | Active claimant clients | Former claimant clients | PPE clients | Non-insured clients |
|---|---|---|---|---|
| 2014-15 | 34,937 | 9,502 | n/a | 32,365 |
| 2015-16 | 35,891 | 9,007 | n/a | 31,706 |
| 2016-17 | 35,272 | 8,733 | n/a | 31,073 |
| 2017-18 | 32,881 | 10,209 | n/a | 25,883 |
| 2018-19 | 28,399 | 7,055 | 2,904 | 23,332 |
| 2019-20 | 25,584 | 8,607 | 4,794 | 19,677 |
| 2020-21 | 23,215 | 4,511 | 2,393 | 8,876 |
| 2021-22 | 20,839 | 6,132 | 2,952 | 10,878 |
| 2022-23 | 18,577 | 9,296 | 3,706 | 19,541 |
| 2023-24 | 20,977 | 10,505 | 4,179 | 25,422 |
- Notes:
- 1 This chart reflects clients served between April 1, 2014 and March 31, 2024.
| Service type | Services delivered | Year-over-year change | Share of total | Year-over-year change (p.p.) |
|---|---|---|---|---|
| Employment Benefits | 57,879 | +21.9% | 44.4% | +0.4 |
| Employment Assistance Services | 72,574 | +19.9% | 55.6% | -0.4 |
| Total services | 130,453 | +20.8% | 100.0% | n/a |
- Notes:
- 1 This table reflects all new services started between April 1, 2023 and March 31, 2024.
| Employment Benefits | Services | Year-over-year change | Expenditures | Year-over-year change |
|---|---|---|---|---|
| Targeted Wage Subsidies | 4,089 | +3.7% | $39,008,868 | -12.6% |
| Self-Employment | 738 | +23.0% | $23,481,748 | +73.8% |
| Job Creation Partnerships | 16 | -70.4% | $1,906,361 | -38.8% |
| Skills Development-Regular | 39,208 | +32.1% | $165,139,855 | +7.4% |
| Skills Development-Apprentices | 13,828 | +4.8% | Included above | Included above |
| Targeted Earning Supplements | 0 | n/a | n/a | n/a |
| Totals | 57,879 | +21.9% | $229,536,832 | +6.8% |
- Notes:
- 1 This table reflects all new services started between April 1, 2023 and March 31, 2024.
| Support Measures | Services | Year-over-year change | Expenditures | Year-over-year change |
|---|---|---|---|---|
| Employment Services | 34,060 | +16.1% | $49,338,797 | +10.6% |
| Individual Counselling | 38,514 | +23.4% | Included above | Included above |
| Labour Market Partnerships | n/a | n/a | $12,688,281 | -1.6% |
| Research & Innovation | n/a | n/a | $27,408,057 | -76.2% |
| Totals | 72,574 | +19.9% | $89,435,135 | -48.2% |
- Notes:
- 1 This table reflects all new services started between April 1, 2023 and March 31, 2024.

Text description
| Year | Unpaid EI benefits | Returns to employment | Active claimant clients served | Total clients served |
|---|---|---|---|---|
| 2014-15 | $126,683,222 | 19,818 | 34,937 | 76,804 |
| 2015-16 | $125,294,701 | 19,552 | 35,891 | 76,604 |
| 2016-17 | $152,689,817 | 21,050 | 35,272 | 75,078 |
| 2017-18 | $136,556,392 | 20,997 | 32,881 | 68,973 |
| 2018-19 | $136,811,084 | 21,515 | 28,399 | 61,690 |
| 2019-20 | $138,735,969 | 20,491 | 25,584 | 58,662 |
| 2020-21 | $135,929,742 | 17,002 | 23,215 | 38,995 |
| 2021-22 | $258,134,870 | 23,086 | 20,839 | 40,801 |
| 2022-23 | $148,383,657 | 18,924 | 18,577 | 51,120 |
| 2023-24 | $149,023,590 | 19,160 | 20,977 | 61,083 |
- Notes:
- 1 Volatility in the estimated Unpaid EI Benefits from 2021‑22 to 2022‑23 correlates with the speed of recovery of the labour market that allowed many Canadians to return to work before exhausting their EI benefits.
- 2 This chart excludes Indigenous pan-Canadian clients.
- 3 The employment returns reported apply specifically to EI-insured clients (active claimants, former claimants, and PPE clients).
Labour market context
Between 2022-23 and 2023-24, British Columbia's labour market has eased, moving from the extremely tight conditions in 2020-21 and 2021-22 to a more balanced labour market. This has largely been attributed to a significant increase of immigrants and temporary residents. However, the easing of labour market conditions has not have been felt uniformly across all sectors and regions.
British Columbia's unemployment rate rose to an average of 5.2% in 2023 from 4.6% in 2022.Footnote 67 Job vacancies continued to decline, with the job vacancy rate dropping to 3.9% in March 2024, down from its peak of 7.2% in December 2021 and down from the average of 5.8% in 2022-23.Footnote 68 In March 2024, there were approximately 97,185 job vacancies in the province,Footnote 69 compared to approximately 167,200Footnote 70 persons who were without work, looked for work in the last 4 weeks and were available for work.
Despite an overall decline in job vacancies, British Columbia still faces significant challenges in recruiting workers, especially in sectors such as health care and social assistance, construction, professional, scientific and technical services and educational services. Regions outside of the Lower Mainland-Southwest also encounter greater difficulties in finding workers. In these sectors and regions, job vacancies remained above 2019 levels.
British Columbia's economic and labour market priorities in 2023-24 focused on addressing the challenges of an aging workforce and managing the impacts of high interest rates and inflation. Immigration played a vital role in supporting labour force growth, particularly among those high demand sectors and regions. Ensuring a skilled workforce capable of meeting the needs of both emerging and established industries remained a central priority.
Canada-British Columbia Labour Market Development Agreement
In 2023-24, British Columbia received over $342 million though the LMDA, serving approximately 61,100 clients. Within 6 months of receiving training and employment supports, approximately 65% of active claimant clients had secured employment, resulting in approximately $149 million in saving from unpaid EI benefits.
The LMDA funding in British Columbia contributed to addressing the following priorities:
- ensuring job seekers have access to high quality services and supports they need to find and keep meaningful employment
- supporting programs, services and initiatives that promote equity for underrepresented groups in the labour market, with program and policy design aligned with the Declaration on the Rights of Indigenous Peoples Act
- building an efficient labour market that support all communities
- evolving employment and labour market services to meet the needs of a modern and inclusive economy
For example, in 2023-24, over 35,200 Active, Former and Premium-Paid EI claimants, along with nearly 25,200 non-insured individuals, accessed services through WorkBC. After years of declining participation due to British Columbia's strong economy, client numbers began to rise again in 2022-23, as labour market began to recover. This trend continued into 2023-24, driven by increasing number of individuals facing complex barriers to stable employment, higher immigration rates and youth unemployment-groups that typically have lower eligibility for EI benefits.
Among WorkBC clients in 2023-24, over 54.0% of Active EI, Former EI and Premium-Paid clients secured employment. In total, nearly 27,000 clients, including non-insured individuals, achieved employment through WorkBC services.
Designated and under-represented groups
British Columbia prioritizes an inclusive labour market that values diversity and enables employers to draw from a wide talent pool and benefit from a variety of skills, perspectives and experiences. In 2023-24, recent immigration made up 42.0% of WorkBC's case-managed, the largest group served by inclusion-focused programming. With recent immigrants expected to play a key role in meeting future labour market needs, WorkBC achieved positive outcomes for 52.0% of its recent immigrant clients, who secured employment after receiving case management services.
WorkBC also supported nearly 14,000 clients with disabilities in 2023-24, with 37.0% of them securing employment or a community attachment (volunteer opportunity) after receiving case management.
Recognizing reconciliation as an ongoing commitment, British Columbia continues to work with partners in ways that honor Indigenous rights and advance reconciliation efforts. In 2023-24, British Columbia engaged with over 6,950 Indigenous clients through WorkBC services. Additionally, the province invested over $6.9 million through Community and Employer Partnerships to support 16 Indigenous-focused projects, creating opportunities for up to 317 participants across the province.
Stakeholder consultations
In British Columbia, partnerships and collaboration with community organizations play a critical role in the successful development of employment programming. The province continuously engages stakeholders across various areas, including sectors and employers, communities, Indigenous communities and organizations, employees, provincial ministries, persons with disabilities, inclusive employers, community-based service providers and Francophone service providers. British Columbia works closely with the Fédération des Francophones de la Colombie-Britannique (FFCB) to address the needs of Francophone job seekers and communities in the province. The collaboration supports the planning and integrated implementation of the Official Language Minority Community Employment Assistance Services network, funded by the Government of Canada, ensuring Francophone communities receive tailored employment assistance.
Dental Assistant Program Empowers Immigrants with Career Success
The Dental Assistant program, developed through Community and Employer Partnership funding, provided 55 newcomer participants with specialized training in the high-demand dental field.
During the 31-weeks program, participants gained essential skills as chairside dental assistants, including knowledge of dental procedures, radiography, sterilization and patient management. Nearly 85.0% of participants successfully completed the program and training and earned their Dental Assistant certificate.
Participant testimonials
"The part I enjoyed most about the program was hands-on experience, the supportive learning environment and the relationships with classmates and instructors," says Polly, a program participant who secured employment after completing the training and is now pursuing further education as a Assistant.
Another successful program participant, Lesly stated, "I enjoyed being in a real clinic [as it] made me more confident …. I loved learning about CDA [Chairside Dental Assistance], radiography and [working as a] receptionist. I learned what my career path is and that if you work hard for what you want you are going to succeed."
Program delivery and participant supports
This section provides an overview of the specific programs and financial supports available under the LMDA. It includes specific details on the programs/initiatives available, their duration associated funding and additional supports provided to participants. This aims to demonstrate how these programs and initiatives align with federal and provincial priorities and support labour market integration.
Program: WorkBC employment services: General Employment Support
Expenditures: In 2023-24, over $145.6 million of LMDA funding was attributed to skills-training programs for unemployed and underemployed British Columbians, providing about 24,500 skills training services to clients.
An additional $39.0 million was invested to support British Columbians gain paid work experience to improve their search for employment.
To help prepare for an expected shortfall of skilled trades people, British Columbia. invested an additional $19.5 million in programs supporting apprentices, an increase of 55% compared to 2022-23.
Description: To achieve sustainable and meaningful employment, British Columbia's programs provide customized services to help clients find good, stable jobs in key in-demand sectors like construction, social services, technology, tourism, natural resources and healthcare
Target client groups: EI Insured participants funded via the LMDA. WDA and provincial funding support equitable access to the suite of case managed services
Benefits and expected results: In 2023-24, almost 94,000 clients actively receiving services, with 75,600 case managed.
Of these clients close to 34,300 were supported through their first year of employment. In 2023-24, the WorkBC employment outcome rate was 49%. The outcome rate was higher for Active EI, Former EI and past premium contributing clients who received WorkBC services, with over 54% achieving employment.
For those participating in skills training programs, 51% achieved employment.
Notably, among individuals who completed Occupational Skills Training, 79% secured employment.
For those participating in Wage Subsidy, 78% achieved employment.
This year, over 15,800 apprentices have participated in the WorkBC Apprentice Services program, with 11,700 completing a level of apprentice training this year.
In 2016, B.C. launched the Targeting, Referral and Feedback (TRF) initiative to assist EI applicants return to employment more quickly by identifying and connecting these individuals with their local WorkBC Centre. In 2023-24, while conducting behavioural insights trials, over 47,000 EI applicants were referred and about 3,000 began working with a WorkBC Case Manager.
LMDA funding helps British Columbians seeking employment adapt to changing labour market conditions and to meet the needs of employers seeking a skilled workforce. Close to 13,000 employers ranging from small businesses to multi-national corporations hired over 19,000 current and former EI recipients through WorkBC in 2023-24. The top occupations and employers of over 16,000 of these jobs were reported to WorkBC employment counsellors.
Program: WorkBC employment services: Inclusive Employment Support
Description: A diverse and inclusive labour market creates a wider pool for employers to draw on. Providing a broader choice of job applicants and bringing into workplaces a wealth of diverse skills, knowledge and fresh viewpoints. WorkBC provides individualized services and support to all case-managed clients to support them in achieving their employment goals.
Target client groups: EI Insured participants funded by the LMDA. WDA and Provincial funding support equitable access to needed services to support people toward meaningful employment.
Benefits and expected results: In 2023-24, 42% of WorkBC Case Managed clients identified as an immigrant. Immigrants represent the largest inclusion group and one of the groups expected to help meet future labour market demands.
52% of WorkBC immigrant clients achieved an employment outcome after receiving case management services.
WorkBC also served almost 14,000 people with disabilities in 2023-24.
- Of these, 37% achieved an employment outcome or secured community attachment (volunteer opportunity) after receiving case management services
- Additionally, BC provides secretariat support to the Presidents' Advisory Committee and supports ongoing collaboration to promote awareness of and the business case for, recruitment and retention of persons with disabilities
Program: WorkBC employment services, community and employer partnership: Project Based Labour Market Training
Expenditures: In 2023-24, over 6,950 clients who identify as Indigenous participated in WorkBC services.
BC also provided over $6 million from Community and Employer Partnerships to support 16 Indigenous-focused projects for up to 317 participants across the province.
Description: BC recognizes that reconciliation is an ongoing commitment and will continue to engage with partners in ways that respect the rights of Indigenous Peoples and advance reconciliation.
Target client groups: EI Insured participants funded by the LMDA. WDA and Provincial funding support equitable access to needed services to support people toward meaningful employment.
Benefits and expected results: Project Based Labour Market Training, a key employment project, supported 66 participants in 8 communities with essential and employability skills training, as well as work experience to prepare them for employment in construction, transportation, general labour and security.
Program: Single Parent Employment Initiative
Description: In 2015, BC introduced the Single Parent Employment Initiative to support single parents on income and disability assistance who want to pursue employment and move towards financial independence.
Target client groups: EI Insured participants funded through the LMDA. Provincial funding supports single parents receiving income assistance who have not established EI eligibility
Benefits and expected results: As of March 2024, 2,667 single parents have participated in the Single Parent Employment Initiative through WorkBC. Of those, 1,875 have found employment
Program: WorkBC employment services: Francophone Client Support
Description: The volume of new WorkBC clients who self-identified as Francophone grew 20% year-over-year in 2023-24.
Target client groups: EI Insured participants funded via the LMDA. WDA and Provincial funding support equitable access to needed services to support people toward meaningful employment.
Benefits and expected results: Over 2,000 Francophone clients were provided employment services or supported through the first year of employment. Of these clients, about 37% also identified as immigrants, this ratio has increased steadily over the last 2 fiscal years. Francophone clients participated in over 3,000 WorkBC services.
In March of 2022, B.C. introduced automated surveys to collect WorkBC clients' feedback on their overall satisfaction with the services they received. In 2023-24 close to 470 Francophone clients completed the surveys with an average satisfaction score of 73 and expects increased satisfaction as program improves over time.
Program: Community and Employer Partnership (CEP) program
Expenditures: B.C. invested $34.6 million in 82 projects across the province including $11.6 million in individual participant supports and $23.0 million for project costs.
Description: B.C.'s investments in innovative CEP projects offer unique skills training and work experience opportunities to support people into good jobs. CEP projects support innovative initiatives to help to make life better for people and their families. BC continued to leverage funding from the Community and Employer Partnerships fund to learn about and address unique local labour market issues, as well as help support communities and contribute to economic growth.
Target client groups: EI insured participants funded via the LMDA
Benefits and expected results: In 2023-24, B.C. focused on labour market recovery and prioritized funding CEP projects that:
- supported people to ensure they have all the employment supports needed to be able to participate fully in the labour market and gain the skills needed for good, in-demand jobs
- provided individual and community tailored training and work experience opportunities with industry recognized certifications in priority sectors
- had the greatest and most immediate impact on employment outcomes
- ensured that funding was accessible and equitably distributed across the province
Program: Project Based Labour Market Training projects
Description: B.C. also supported 64 Project Based Labour Market Training projects, such as:
- Chairside Dental Assistant with Indigenous Content provided participants with employability, essential skills and occupational skills training and on-the-job work experience with local employers to prepare participants for employment as Dental Assistants
- Construction Electrical Trades Training prepared participants for employment in the construction electrical trades. Training included hands-on workshops related to this as well as work experience, in which participants obtained Construction Electrician Trades Certificate upon completion
- Teacher Certificate Program with Indigenous Inclusion provided participants with employability, essential skills, occupational skills training and on the job work experience opportunities with local employers to prepare for employment as Teacher Assistants
Target client groups: EI Insured participants funded via the LMDA. WDA and Provincial funding support equitable access to needed services to support people toward meaningful employment
Program: Job Creation Partnership projects
Description: B.C. invested in 11 Job Creation Partnership projects, including:
- The Regenerative Agriculture Project provided participants with work experience and skill enhancement in the agriculture sector. Training included general farm practices, composting skills, regenerative agriculture and food security techniques. The project enhanced the participants' employment prospects as harvesting labourers or general farm workers, as well as knowledge of regenerative agriculture that gave participants' advantage in the labour market
Target client groups: EI Insured participants
Program: Labour Market Partnership projects
Description: B.C. invested in 3 Labour Market Partnership projects, for example:
- Light The Way Youth Homelessness Conference that coordinated a 2-day Provincial Youth Homelessness Conference in Vancouver, BC to bring together youth, government and community partners from the BC Coalition to End Youth Homelessness to present youth-led and youth-informed solutions to issues surrounding homelessness in British Columbia which includes employment as a key milestone in housing sustainability
Program: Research and Innovation projects: Youth Employment Support
Description: B.C. also supported 4 Research and Innovation projects, including:
- Improving Outcomes for Youth Experiencing Multiple Barriers to Employment through Supportive Employment project that built upon existing practice to further understand how to support homeless youth experiencing barriers to employment and to implement supportive employment practices in the tourism industry
Target client groups: Research institutions and project-based research approaches that test new and innovative service delivery approaches to inform and continue to enhance services, including informing future services
Program: Research and Innovation projects: Inclusive Employment Supports
Description: In 2023-24, BC. invested in projects that continue to build on investments made in previous years to support initiatives focusing on employment supports and programming for youth, Indigenous Peoples, people with disabilities and underrepresented populations. Projects included:
- Foundry Work and Education program which provides integrated and personal wraparound assistance to youth ages 15 to 24, including health, mentoring, education, skills development and job-placement services
- Victoria L.E.A.P. (Life Skills, Employment Skills and Awareness Program) which supports the development of pre-employment training and employment readiness for people who have formerly experienced homelessness and who are contemplating employment
Target client groups: EI Insured participants. Research institutions and project-based research approaches that test new and innovative service delivery approaches to inform and continue to enhance services, including informing future services
Program: Research and Innovation projects: Care economy
Description: The care economy encompasses the full life cycle of human services. The care economy includes direct (e.g., nurturing, nurses, social worker,) and indirect (e.g., housecleaning, security) work. The common theme is carework contributes to current and future population well-being. Public sector and not-for-profit employers across British Columbia are struggling to recruit and retain the thousands of workers needed in the care economy to maintain important education, elder care, mental health and social services.
In 2023-24, B.C. invested in 6 care economy focused projects, 2 of which used federal LMDA funding:
- Online Training for Newcomers in the Care Economy, jointly funded with B.C., provides online training to support newcomers entering the human services sector. This will improve newcomer employment outcomes and retention rates and remove barriers by providing training free of cost to participants
- Supervisor Training in the Community Social Services Sector provides supervisory training and education for leaders in the social service sector, improving outcomes and retention rates for supervisors and their staff
Target client groups: Research institutions and project-based research approaches that test new and innovative service delivery approaches to inform and continue to enhance services, including informing future services
Program: Community and Employer Partnerships
Expenditures: In 2023-24, B.C. Community and Employer Partnerships program invested almost $23.0 million in 82 projects across the province for up to 2,049 participants.
An additional $11.6 million in centralized funding was provided as client financial supports to project participants making a combined LMDA investment of $34.6 million.
Temporary additional funding provided B.C. flexibility to create responsive programming and invest in innovative initiatives through the Community and Employer Partnerships fund to address the changing labour market including shifts, emerging opportunities and responsive strategies to meet the needs of workers, sectors, employers and communities.
Target client groups: EI Insured participants funded via the LMDA. WDA and Provincial funding support equitable access to needed services to support people toward meaningful employment.
Benefits and expected results: These investments are demonstrating strong results - 63% of individuals who participated in diverse Project Based Labour Market Training projects obtained employment in in-demand occupations including construction and related trades, health, social sector, childcare and education and supply chain. 50% of individuals who participated in a Job Creation Partnership project obtained employment in-demand occupations including construction, scientific and administrative occupations.
Program: Employer: Driven wage subsidies
Expenditures: Temporary additional funding through the LMDA allowed this program to provide over $12M to employers supporting the affordability of bringing on new employees at a time of rising inflationary costs for small businesses and supporting job seekers with paid training placements with employers to secure good jobs.
Target client groups: EI Insured participants funded via the LMDA. WDA and Provincial funding support equitable access to needed services to support people toward meaningful employment.
Benefits and expected results: In 2023-24, employer-driven wage subsidies supported about 1,290 employers and over 2,500 job seekers.
3.2.11 Yukon
In this section
- Employment Benefits and Support Measures key facts
- Labour market context
- Canada-Yukon Labour Market Development Agreement
- Designated and under-represented groups
- Stakeholder consultations
- Program delivery and participant supports
Employment Benefits and Support Measures key facts
| Indicator | Active claimant clients | Former claimant clients | PPE clients | Non-insured clients | Total |
|---|---|---|---|---|---|
| Number served | 212 | n/a | n/a | n/a | 4502 |
| Share of total | 47.1% | n/a | n/a | n/a | 100.0% |
- Notes:
- 1 This table reflects clients served between April 1, 2023 and March 31, 2024.
- 2 LMDA YT data for 2023-24 are estimates, based on last year's estimated figures.
- 3 Row sums for YT do not match the totals column, as they include 'Unknown' client types not displayed in this table.

Text description
| Year | Youth (15-24 years old) | Core-age (25-54 years old) | Workers aged 55+ |
|---|---|---|---|
| 2014-15 | 19.3% | 63.3% | 17.5% |
| 2015-16 | 15.0% | 70.1% | 15.0% |
| 2016-17 | 18.1% | 69.4% | 12.4% |
| 2017-18 | 14.8% | 72.6% | 12.6% |
| 2018-19 | 11.6% | 75.5% | 10.7% |
| 2019-20 | 19.3% | 72.4% | 8.3% |
| 2020-21 | 26.7% | 69.9% | 2.3% |
| 2021-22 | 37.7% | n/a | n/a |
| 2022-23 | n/a | n/a | n/a |
| 2023-24 | n/a | n/a | n/a |
- Notes:
- 1 This chart reflects clients served between April 1, 2014 and March 31, 2024.
- 2 Some LMDA data for YT are unavailable for 2021-22.
- 3 LMDA data for YT are unavailable for 2022-24.

Text description
| Year | Active claimant clients | Former claimant clients | PPE clients | Non-insured clients |
|---|---|---|---|---|
| 2014-15 | 259 | 45 | n/a | 131 |
| 2015-16 | 211 | 41 | n/a | 65 |
| 2016-17 | 201 | 34 | n/a | 85 |
| 2017-18 | 208 | 44 | n/a | 108 |
| 2018-19 | 189 | 35 | 39 | 75 |
| 2019-20 | 155 | 23 | 29 | 24 |
| 2020-21 | 115 | 22 | 27 | 23 |
| 2021-22 | 177 | 77 | 49 | 54 |
| 2022-23 | 212 | n/a | n/a | n/a |
| 2023-24 | 212 | n/a | n/a | n/a |
- Notes:
- 1 This chart reflects clients served between April 1, 2014 and March 31, 2024.
- 2 Some LMDA data for YT are unavailable for 2022-24.
- 3 YT LMDA data for 2023-24 are estimated based on last year's figures.
- 4 YT did not provide the breakdown of the client types and therefore 'Unknown' client types are not displayed in this chart.
| Service type | Services delivered | Year-over-year change | Share of total | Year-over-year change (p.p.) |
|---|---|---|---|---|
| Employment Benefits | 324 | n/a | 43.3% | n/a |
| Employment Assistance Services | 425 | n/a | 56.7% | n/a |
| Total services | 749 | n/a | 100.0% | n/a |
- Notes:
- 1 This table reflects all new services started between April 1, 2023 and March 31, 2024.
- 2 LMDA YT data for 2023-24 are estimated based on last year's figures.
- 3 Year over year change is not included as data availability was not consistent between years.
| Employment Benefits | Services | Year-over-year change | Expenditures | Year-over-year change |
|---|---|---|---|---|
| Targeted Wage Subsidies | 0 | n/a | $97,231 | -13.3% |
| Self-Employment | 4 | n/a | n/a | n/a |
| Job Creation Partnerships | 0 | n/a | n/a | n/a |
| Skills Development-Regular | 108 | n/a | $1,727,210 | -12.1% |
| Skills Development-Apprentices | 212 | n/a | Included above | Included above |
| Targeted Earning Supplements | 0 | n/a | n/a | n/a |
| Totals | 324 | n/a | $1,824,441 | -12.2% |
- Notes:
- 1 This table reflects all new services started between April 1, 2023 and March 31, 2024.
- 2 LMDA YT data for 2023-24 are estimated based on last year's figures.
- 3 Year over year change is not included as data availability was not consistent between years.
- 4 The financial totals in the MAR are based on finalized reports provided by PTs. At the time of publication, YT final audited financial statements for 2023-24 had not yet been received. As such, expenditures for YT are based on a draft report or the previous year's financial statements.
| Support Measures | Services | Year-over-year change | Expenditures | Year-over-year change |
|---|---|---|---|---|
| Employment Services | 338 | n/a | $2,188,625 | -16.0% |
| Individual Counselling | 87 | n/a | Included above | Included above |
| Labour Market Partnerships | n/a | n/a | $0 | -100% |
| Research & Innovation | n/a | n/a | $320,583 | +51.7% |
| Totals | 425 | n/a | $2,509,208 | -14.6% |
- Notes:
- 1 This chart reflects all new services started between April 1, 2023 and March 31, 2024.
- 2 LMDA YT data for 2023-24 are estimated based on last year's figures.
- 3 Year over year change is excluded due to inconsistent data availability across years.
- 4 The financial totals in the MAR are based on finalized reports provided by PTs. At the time of publication, YT final audited financial statements for 2023-24 had not yet been received. As such, expenditures for YT are based on a draft report or the previous year's financial statements.

Text description
| Year | Unpaid EI benefits | Returns to employment | Active claimant clients served | Total clients Served |
|---|---|---|---|---|
| 2014-15 | $1,851,947 | 170 | 259 | 435 |
| 2015-16 | $1,266,470 | 188 | 211 | 317 |
| 2016-17 | $1,498,718 | 176 | 201 | 320 |
| 2017-18 | $1,011,003 | 141 | 208 | 360 |
| 2018-19 | $1,069,493 | 120 | 189 | 338 |
| 2019-20 | $1,117,099 | 123 | 155 | 231 |
| 2020-21 | $957,323 | 92 | 115 | 187 |
| 2021-22 | $1,821,872 | 105 | 177 | 357 |
| 2022-23 | n/a | 4 | 212 | 450 |
| 2023-24 | n/a | 4 | 212 | 450 |
- Notes:
- 1 Volatility in the estimated Unpaid EI Benefits from 2021‑22 to 2022‑23 correlates with the speed of recovery of the labour market that allowed many Canadians to return to work before exhausting their EI benefits.
- 2 This table excludes Indigenous pan-Canadian clients.
- 3 Some LMDA data for YT are unavailable for 2022-24.
- 4 LMDA YT data for 2023-24 are estimated based on last year's figures.
- 5 YT did not provide the breakdown of the client types and therefore ‘Unknown’ client types are not displayed in this chart.
- 6 The employment returns reported apply specifically to EI-insured clients (active claimants, former claimants and PPE clients).
Labour market context
In 2023-24, Yukon experienced both opportunities and challenges within its labour market. The territory's unemployment rate remained relatively low compared to the national average, highlighting a generally strong labour market. However, many posted jobs remained unfilled, as a significant portion of working-age Yukoners were not actively participating in the labour force.Footnote 71
The unemployment rate for those aged 15 and over in Yukon was 4.9%Footnote 72 in January 2024, slightly higher than 4.5% in 2022.Footnote 73 By comparison, Canada's unemployment rate was 5.4% in 2023 and 5.3% in 2022.Footnote 74
In March 2024, the territory had approximately 1,210 job vacanciesFootnote 75, while in 2023, there were, on average, around 900 unemployed individuals.Footnote 76
Yukon's growth prospects remained positive, driven by sectors such as tourism, non-residential investment projects and an expected population increase. However, there are concerns about a slowdown in the mining sector. To address these challenges, Yukon is focusing on the evolving demographic shifts and ensuring a skilled and inclusive workforce to support future growth.Footnote 77
Canada-Yukon Labour Market Development Agreement
In 2023-24, Yukon received approximately $4.7 million though the LMDA, which served approximately 450 clients.
In 2023-24, LMDA funding was directed towards the following priorities:
- establishing meaningful, government-to-government labour market engagement with Yukon First Nations to support the Truth and Reconciliation Calls to Action #7 under the Education theme
- improving engagement with employers and employer organizations to drive positive change in recruitment and employer-driven workforce development
- leveraging the current labour market situation and recent work in Skills for Success to develop stronger solutions reengaging working-age Yukoners in the labour market
- determining the most effective means to support the shift from demand-driven to supply-driven thinking and maintaining flexibility as the labour market continues to evolve
In 2023-24, Yukon funded the Staffing UP - Employer Funding Support program, which helped employers hire, retain and train employees while enhancing workplace supports for employees and employers human resource knowledge and practice. This program served 30 employers, out of which, 7 funded through LMDA and 23 employers funded through WDA.
Designated and under-represented groups
Yukon continued to regularly engage several under-represented stakeholders, including:
- First Nations
- official language minority communities
- persons with disabilities
- youth
- newcomers to Canada
- older workers
- women in trades and technology
For example, in 2023-24, Yukon collaborated with stakeholders to improve labour market outcomes for persons with disabilities by developing consistent job coaching and work placement opportunities. Labour market participants from under-represented groups can assist Yukon in helping to fill the job vacancies.
In 2023-24, the territory funded the Building Up - Organizational Funding Support program. Below is a summary of the individuals serviced:
- 16 organizations reported 16,450 units of service, representing tracked interactions with Yukon job seekers and employers
- These interactions include repeat use by unique individuals for many services, such as accessing labour market information, using computers for job searches, receiving assistance job applications and resume support. Historically, a unique individual is estimated to access these services 4 times a year, translating into 4,000 unique individuals were served in 2023-24. Among these:
- 11 funded organizations/institutions provided support to 350 Yukon First Nation citizens
- 313 individuals received training support through Community Training Funds
- 194 individuals received ongoing case-management support to return to or gain employment
This program helped to strengthen the labour market by providing support to individuals and employers, coordinating community and sector training funds and helping to connect employers with job seekers. It specifically targets members of under-represented groups, such as:
- Yukon First Nation citizens
- youth
- older workers
- persons with disabilities
- women in trades and technology
- newcomers in professional sectors
Stakeholder consultations
Yukon actively engage several stakeholders, including one-on-one engagement. In 2023-24, stakeholders included:
- First Nations
- official language minority communities
- organizations representing employers
- organizations representing workers
- persons with disabilities
- Government of Yukon departments
Supporting Yukon entrepreneurs
In 2023-24, Champagne and Aishihik First Nations(CAFN) arranged for consultants to provide business mentoring and support for the development of business plan for 19 entrepreneurs/businesses to enhance their business capacity.
- The participants gained tools and knowledge to assess the feasibility of their business concept, preparing comprehensive business plans and understand financial documents and explore financial supports options
- The participants achieved outcomes, including: a complete feasibility assessment on their business concept, a comprehensive business plan with 3 years of financial projections to support their career in self-employment
The project supported capacity building for CAFN entrepreneurs, enabling them to participate in CAFN and Yukon Procurement. It aligns with Yukon First Nation Procurement Policy, ensuring CAFN citizens benefit from Government of Yukon procurement activity.
By making these businesses eligible for inclusion in the Yukon First Nations Business Registry, the projectopens up further funding and business opportunities for CAFN entrepreneurs. These efforts are expected to lead to increased employment opportunities for CAFN citizens and enhance the business capacity of entrepreneurs and small businesses within the Haines Junction community.
Program delivery and participant supports
This section provides an overview of the specific programs and financial supports available under the LMDA. It includes specific details on the programs/initiatives available, their duration associated funding and additional supports provided to participants. This aims to demonstrate how these programs and initiatives align with federal and provincial priorities and support labour market integration.
Program: Building UP: Organizational Funding Support
Expenditures: $2,164,820.19 (78.7%)
Description: Funding support for organizations that strengthen the labour market by providing:
- support to individuals
- support to employers
- projects that connect employers to job seekers
- coordination of community and sector training funds
Programs:
- Employment Assistance Services (EAS) (Building UP)
- Labour Market Partnerships (LMP) (Building UP)
- Skills For Success projects (Building UP - participants are ‘insured participants')
- Research and Innovation (R andI) (Building UP - Projects)
Target client groups:
- organizations providing services and supports to employers and individuals
- organizations providing information and expertise to strengthen the labour market
Benefits and expected results: Maintain services and supports provided to employers and individuals to attain Benefits and expected results for equity-seeking groups in the Yukon's labour market. For example:
- Yukon First Nations people
- youth
- older workers
- persons with disabilities
- women in trades and technology
- newcomers in professional sectors
Program: Staffing UP: Employer Funding Support
Expenditures: $78,477.95 (2.9%)
Description: Strengthening the labour market with funding for employers to:
- find, hire and keep workers that are a good fit for employers
- train new or existing workers to meet the employers' needs
- develop workplace supports to accommodate staff
- enhance employer human resource knowledge and practice
- get and effectively use labour market information
- connect with other employers to find and keep workers
Programs:
- Targeted Wage Subsidies (TWS) (Staffing UP)
- Employer Sponsored Training (Staffing UP – trainees are ‘insured participants')
Target client groups: Yukon employers and employers who are training, hiring and retaining individuals, with particular incentives for those employers targeting equity-seeking groups in the Yukon
Priority sectors: Health services, food production, construction trades and tourism
Benefits and expected results:
- increased employer engagement in training, hiring and retaining employees
- increased or sustained employment in the food production, tourism and hospitality sectors and a demonstrable strengthening of participant workplace skills
Program: Working UP: Individual Funding Support (delivered by the Department of Education)
Expenditures: $506,500.75 (18.4%)
Description: Funding for individuals to help them:
- take the next steps toward their work or learning goals
- improve literacy and essential skills
- increase participants' workplace skills and experience, including apprenticeship
- get workplace or learning support
- explore options for self-employment
Programs:
- Skills Development Regular (SD-R)
- Skills Development Apprentice (SD-A)
Target client groups: Individuals who require assistance and support in moving towards their labour market goals
Benefits and expected results: Increase in foundational and vocational skills and demonstrable movement of individuals towards their labour market goals
3.2.12 Northwest Territories
In this section
- Employment Benefits and Support Measures key facts
- Labour market context
- Canada-Northwest Territories Labour Market Development Agreement
- Designated and under-represented groups
- Stakeholder consultations
- Program delivery and participant supports
Employment Benefits and Support Measures key facts
| Indicator | Active claimant clients | Former claimant clients | PPE clients | Non-insured clients | Total |
|---|---|---|---|---|---|
| Number served | 102 | 126 | 96 | 23 | 347 |
| Share of total | 29.4% | 36.3% | 27.7% | 6.6% | 100.0% |
- Notes:
- 1 This table reflects clients served between April 1, 2023 and March 31, 2024.
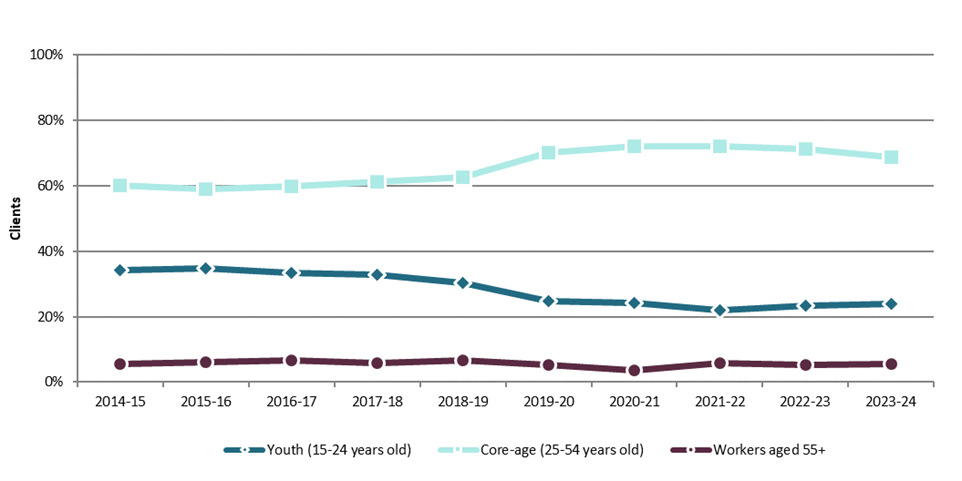
Text description
| Year | Youth (15-24 years old) | Core-age (25-54 years old) | Workers aged 55+ |
|---|---|---|---|
| 2014-15 | 34.2% | 60.0% | 5.6% |
| 2015-16 | 34.9% | 58.9% | 6.1% |
| 2016-17 | 33.5% | 59.8% | 6.7% |
| 2017-18 | 32.9% | 61.3% | 5.8% |
| 2018-19 | 30.3% | 62.7% | 6.8% |
| 2019-20 | 24.7% | 70.1% | 5.2% |
| 2020-21 | 24.3% | 72.1% | 3.6% |
| 2021-22 | 21.9% | 72.2% | 5.9% |
| 2022-23 | 23.4% | 71.3% | 5.3% |
| 2023-24 | 23.9% | 68.9% | 5.5% |
- Notes:
- 1 This chart reflects clients served between April 1, 2014 and March 31, 2024.

Text description
| Year | Active claimant clients | Former claimant clients | PPE clients | Non-insured clients |
|---|---|---|---|---|
| 2014-15 | 294 | 138 | n/a | 500 |
| 2015-16 | 325 | 195 | n/a | 849 |
| 2016-17 | 306 | 156 | n/a | 573 |
| 2017-18 | 333 | 343 | n/a | 793 |
| 2018-19 | 266 | 205 | 229 | 355 |
| 2019-20 | 134 | 61 | 85 | 19 |
| 2020-21 | 110 | 70 | 48 | 20 |
| 2021-22 | 124 | 137 | 106 | 27 |
| 2022-23 | 121 | 157 | 141 | 31 |
| 2023-24 | 102 | 126 | 96 | 23 |
- Notes:
- 1 This chart reflects clients served between April 1, 2014 and March 31, 2024.
- 2 The steep decline in non-insured clients from 2017-18 to 2019-20 can be explained mainly by the introduction of the Workforce Development Agreements in 2017.
| Service type | Services delivered | Year-over-year change | Share of total | Year-over-year change (p.p.) |
|---|---|---|---|---|
| Employment Benefits | 221 | -14.7% | 41.2% | +4.4 |
| Employment Assistance Services | 316 | -29.1% | 58.8% | -4.4 |
| Total services | 537 | -23.8% | 100.0% | n/a |
- Notes:
- 1 This table reflects all new services started between April 1, 2023 and March 31, 2024.
| Employment Benefits | Services | Year-over-year change | Expenditures | Year-over-year change |
|---|---|---|---|---|
| Targeted Wage Subsidies | 28 | +16.7% | $1,273,970 | -7.2% |
| Self-Employment | 9 | +28.6% | $350,059 | -7.2% |
| Job Creation Partnerships | 0 | n/a | n/a | n/a |
| Skills Development-Regular | 90 | -28.0% | $448,172 | -7.2% |
| Skills Development-Apprentices | 94 | -8.7% | Included above | Included above |
| Targeted Earning Supplements | 0 | n/a | n/a | n/a |
| Totals | 221 | -14.7% | $2,072,201 | -7.2% |
- Notes:
- 1 This table reflects all new services started between April 1, 2023 and March 31, 2024.
- 2 The financial totals in the MAR are based on finalized reports provided by PTs. At the time of publication, NT final audited financial statements for 2023-24 had not yet been received. As such, expenditures for NT is based on a draft report or the previous-year financial statements.
| Support Measures | Services | Year-over-year change | Expenditures | Year-over-year change |
|---|---|---|---|---|
| Employment Services | 2 | -50.0% | $895,697 | -7.2% |
| Individual Counselling | 314 | -29.0% | Included above | Included above |
| Labour Market Partnerships | n/a | n/a | $213,616 | -7.2% |
| Research & Innovation | n/a | n/a | n/a | n/a |
| Totals | 316 | -29.1% | $1,109,313 | -7.2% |
- Notes:
- 1 This table reflects all new services started between April 1, 2023 and March 31, 2024.
- 2 The financial totals in the MAR are based on finalized reports provided by PTs. At the time of publication, NT final audited financial statements for 2023-24 had not yet been received. As such, expenditures for NT are based on a draft report or the previous year's financial statements.

Text description
| Year | Unpaid EI benefits | Returns to employment | Active claimant clients served | Total clients served |
|---|---|---|---|---|
| 2014-15 | $2,351,982 | 193 | 294 | 932 |
| 2015-16 | $1,820,141 | 173 | 325 | 1,369 |
| 2016-17 | $1,924,873 | 177 | 306 | 1,035 |
| 2017-18 | $1,298,865 | 142 | 333 | 1,469 |
| 2018-19 | $1,640,575 | 181 | 266 | 1,055 |
| 2019-20 | $1,430,328 | 185 | 134 | 299 |
| 2020-21 | $1,063,755 | 152 | 110 | 248 |
| 2021-22 | $1,345,869 | 207 | 124 | 394 |
| 2022-23 | $1,101,443 | 197 | 121 | 450 |
| 2023-24 | $1,230,066 | 147 | 102 | 347 |
- Notes:
- 1 Volatility in the estimated Unpaid EI Benefits from 2021‑22 to 2022‑23 correlates with the speed of recovery of the labour market that allowed many Canadians to return to work before exhausting their EI benefits.
- 2 This chart excludes Indigenous pan-Canadian clients.
- 3 The employment returns reported apply specifically to EI-insured clients (active claimants, former claimants and PPE clients).
Labour market context
In 2023-24, the Northwest Territories faced a significant challenge with a tight labour market and noticeable regional disparities. While Yellowknife and the capital region experienced low unemployment due to higher employment levels, smaller communities struggled with higher unemployment rates, driven by limited local employment opportunities. Employment decreased most significantly in industries such as construction, trade, forestry, fishing, mining and oil & gas,Footnote 78 highlighting the need for workforce development and targeted recruitment strategies.
The unemployment rate for those aged 15 and over in the Northwest Territories was 5.9% in 2023,compared to 5.0% in 2022.Footnote 79 By comparison, Canada's unemployment rate in was 5.4% in 2023 and in 5.3% in 2022.Footnote 80 In 2024 the territory had, on average, approximately 720 unemployed individuals.Footnote 81
The labour market needs in the Northwest Territories range from essential skills to advanced technical and trades skills development. Many job seekers face significant barriers to employment, such as the lack of high school diplomas or equivalency credentials. Projections shows that over the next 20 years, a large majority of jobs will require some kind of post-secondary education. To address these challenges, the Northwest Territories is leveraging LMDA funding to deliver targeted programs and services aimed at increasing labour force participation, particularly among individuals not currently in the workforce or those considering re-entry.
Canada-Northwest Territories Labour Market Development Agreement
In 2023-24, Northwest Territories received approximately $4.6 million though the LMDA, serving approximately 350 clients. Within 6 months of receiving training and employment supports, approximately 83% of active claimant clients secured employed, resulting in approximately $1.2 million savings in unpaid EI benefits.
For example, the territory funded the Skills Development Program, which provided training opportunities to update skills, acquire knowledge and develop essential employability skills. Eligible activities included education and training programs that led towards labour market attachment. Approximately 110 clients benefited from this program in 2023-24.
Designated and under-represented groups
The Northwest Territories delivered LMDA programming designed to encourage greater employer involvement in training, ensuring that skills were better aligned with job opportunities. These programs and services specifically target under-represented groups. For example, Employment Assistance Services funding supported the Conseil de development économique des Territoires du Nord-Ouest (CDÉTNO) in operating the Northwest Territories Career Centre. This center provides career and employment assistance targeted to local needs, includes designated and/or under-represented groups across the territory.
Stakeholder consultations
In 2023-24, the Northwest Territories continued to engage stakeholders through its Regional Service Centres. Engagement sessions on LMDA-supported labour market programs and included stakeholders such as other government departments, local employers, community and non-governmental organizations and Indigenous governments and organizations.
Consultations processes were tailored to address the unique circumstances of each region. Key themes that emerged from consultations include:
- focusing on regional projects and local training needs
- forecasting of labour training
- highlighting other funding programs available to individuals, employers and communities
- addressing challenges faced by individuals in the community needing to travel far from home for training and skills development
- providing targeted supports, such as financial assistance
- increasing the availability of experienced journeypersons to supervise apprentices
Self Employment Program
In 2023-24, an individual in Yellowknife completed a trade qualification as an automotive service technician and applied to the Self-Employment Program funding with the Department of Education, Culture and Employment , to launch his own business, Auto Diagnostic Solutions. Supported by LMDA the program provided him weekly financial support and access to a business expert at Akaitcho Business Development Corporation in Yellowknife.
The client described the support as very helpful, especially during the overwhelming initial stages of starting a business. Through the LMDA-supported Self-Employment Program, he attended seminars organized by business experts on topics such as finance, creating websites and workplace safety, which the client found very informative.
With the help of his business expert, the client successfully established a mobile service business that provides automotive repair services to smaller, local communities. He is currently building a website and exploring new opportunities, such as securing contracts with local businesses and the Government of the Northwest Territories.
The client is grateful for the Self-Employment Program support that helped provide a cushion and peace of mind to be able to concentrate on his work.
Program delivery and participant supports
This section provides an overview of the specific programs and financial supports available under the LMDA. It includes specific details on the programs/initiatives available, their duration associated funding and additional supports provided to participants. This aims to demonstrate how these programs and initiatives align with federal and provincial priorities and support labour market integration.
Program: Skills Development program
Expenditures: $799,521 (24.5%)
Description: The Skills Development Program (SDP) provides support for eligible individuals to participate in short-term training opportunities for up to 52 weeks, which upgrade or develop essential employability skills.
Eligible activities include education and training programs that lead to labour market attachment. This may include academic upgrading, life skills, employment readiness programs, pre-employment training courses, skill-specific training programs and post-secondary programs.
SDP interventions may be supported under the LMDA or WDA.
- Dehcho: apprenticeship technical training, mining, Mackenzie highway development, pre-trades training, upgrading, driver's training
- North Slave: apprentice technical training (including Schools North Apprenticeship Program (SNAP)), driver training (Classes 1 and 3), tourism (land/water-based)
- South Slave: apprenticeship technical training; business administration, heavy equipment operator (HEO) training, health support workers, driver's training
- Beaufort Delta: apprenticeship technical training, driver's training, infrastructure, pre-apprenticeship training, academic upgrading, northern journalism, post-secondary studies
- Sahtu: apprenticeship technical training, safety training, financial literacy, business administration, remediation, HEO, health support workers, general community services skills, indigenous arts
Target client groups:
- Dehcho: apprentices, EI eligible, PPE, active claim, unemployed, persons with disabilities
- North Slave: apprentices, individuals in need of skill development or academic upgrading, driver training; tourism and high school students entering SNAP
- South Slave: apprentices, EI Eligible, Active Claim, Unemployed, Persons with Disabilities
- Beaufort Delta: active apprentices, post-secondary students; youth and school graduates, Income Assistance (IA) clients, person with disabilities
- Sahtu: apprentices who are eligible for technical levels training, references from: Economic Development Officers, Community Employment Officers, ISETS and Sahtu Secretariat incorporated (SSI)
Program: Self-Employment program
Expenditures: $301,516 (9.2%)
Description: The Self-Employment Program (SEP) provides support to individuals who are starting or taking over a small business.
This program provides supports for clients in assessing their business idea, their personal suitability, family issues, financial risks and the resources available or required to be successful.
SEP interventions are administered by the Career Development Officers in the Regional ECE Service Centres.
SEP interventions may be supported under the LMDA or WDA.
- Dehcho: journeyperson starting new business, craft business start-ups, tourism
- North Slave: journeypersons starting a new business
- South Slave: contractors (trades), childcare, food businesses, delivery services, esthetics, lawn care
- Beaufort Delta: childcare, small engine repair, construction, arts and crafts, food businesses, journeypersons starting a new business retail
- Sahtu: food services, small business start-up assistance (in cooperation with the Department of Industry, Tourism and Investment (ITI), references from Community Employment Officers, ISETS and Sahtu Secretariat Incorporated (SSI)
Target client groups:
- unemployed
- EI eligible, PPE, active claim, self-employed
- post-secondary graduates
Program: Wage Subsidy program
Expenditures: $756,831 (23.2%)
Description: The Wage Subsidy Program (WSP) provides funding to employers to hire NWT residents with minimal work experience and education by offsetting the cost of hiring and training.
This program is intended to provide work experience and training that will better enable clients to obtain meaningful long-term employment. WSP projects may be supported under the LMDA or WDA.
- Dehcho: construction, tourism, mining, Mackenzie Highway construction, bookkeeping/accounting, pre-trades, SNAP
- North Slave: small employers, industry, tourism, construction, non-profits, newer businesses
- South Slave: trades industry, small business start ups, daycares, office administrators
- Beaufort Delta: community government, Indigenous organizations, small business', retail business', industry, non-profits
- Sahtu: local employers, Indigenous governments and land-claim organizations (indigenous and non-Indigenous) with focus on employers that are willing to take time to train their employees to grow into the new role.
Target client groups:
- small employers, communications industry, tourism industry, construction, accounting
- existing and new entrants of labour force
- EI Eligible, PPE, active claim, self-employed
- Indigenous employers, NGOs, municipal governments
Program: Employee Training Program
Expenditures: $301,516 (9.2%)
Description: The Employee Training Program (ETP) helps employers offset the cost of training employees.
The ETP can assist employers who require employee up-skilling due to economic, technological and organizational change and may be used to support individuals who are under-employed or employed and in need of training to maintain their current job and advance, progress or move to a different and better job.
The ETP may also be used in conjunction with the Wage Subsidy Program (WSP) to offset the costs of training employees.
Requests for ETP are primarily supported under the WDA. If used in conjunction with the WSP, then support may also be provided under LMDA.
- Dehcho: construction, pre-trades, tourism, mining Mackenzie Highway construction, bookkeeping/accounting, driver's training
- North Slave: newer employers needing certified and qualified individuals in positions, non-profits and industry
- South Slave: band offices, First Nations, small employers, fishing and mining industry
- Beaufort Delta: community government, Indigenous organizations, small business', retail business', Industry, non-profits
- Sahtu: band offices, First Nations, small employers, communication industry, tourism industry; Construction, pre-trades, tourism, mining, Mackenzie highway construction, bookkeeping/accounting Designated community authorities, ISETS
Target client groups:
- small employers, communications industry, tourism industry, construction, accounting
- existing and new entrants of labour force
- EI Eligible, PPE, active claim, self-employed
- Indigenous employers, NGO's, municipal governments
Program: Employee Assistance Services
Expenditures: $844,180 (25.9%)
Description: Employment Assistance Services (EAS) enables regional ECE Service Centres to provide career and employment assistance targeted to particular local needs and to extend the delivery of services throughout their region. EAS is used to fill gaps in service and is intended to help individuals prepare for the workforce, find work and to maintain work through third party organizations.
EAS may be supported under the LMDA or WDA.
- Dehcho: career development representatives in employment offices/band offices to assist with resumes, job applications, completing funding applications, etc.
- North Slave: non-profit organizations and small businesses with an employment focus/training
- South Slave: Community Employment Coordinators, Hay River Community for Persons with Disabilities, French Employment Services
- Beaufort Delta: Indigenous governments, municipal governments, Non-Profit organizations
- Sahtu: Community Employment Officers
Target client groups:
- unemployed
- existing & new entrants of labour force
- EI Eligible, PPE, Active Claim, self-employed
Program: Strategic Workforce Initiatives
Expenditures: $258,943 (7.9%)
Description: Strategic Workforce Initiatives (SWI) supports community partners in undertaking labour market activities that promote labour force development, workforce adjustments and effective human resources planning. Activities must address a community labour market need and may include identifying economic trends, creating strategies and initiating projects to develop a responsive local labour force. SWI projects may be supported under the LMDA or WDA.
Providing financial support to assist DCAs with the development of community labour market development plans, Indigenous governments and organizations with labour market research and supporting other regional workforce initiatives, including the North Slave regional training partnership and hub and supports to the NWT mine training society.
Target client groups:
- Dehcho: DCAs
- North Slave: DCAs and NWT mine training society
- South Slave: Aurora College, band offices, non-government organizations, municipalities, hamlets
- Beaufort Delta: Regional training partnerships, Indigenous governments and organizations,DCAs
- Sahtu: DCAs
3.2.13 Nunavut
In this section
- Employment Benefits and Support Measures key facts
- Labour market context
- Canada-Nunavut Labour Market Development Agreement
- Designated and under-represented groups
- Stakeholder consultations
- Program delivery and participant supports
Employment Benefits and Support Measures key facts
| Indicator | Active claimant clients | Former claimant clients | PPE clients | Non-insured clients | Total |
|---|---|---|---|---|---|
| Number served | 12 | 1 | n/a | n/a | 1,180 |
| Share of total | 1.0% | 0.1% | n/a | n/a | 100.00% |
- Notes:
- 1 This table reflects clients served between April 1, 2023 and March 31, 2024.
- 2 LMDA data for NU is estimated.
- 3 Some LMDA data breakdowns for NU are unavailable.
- 4 Row sums for NU do not match the totals column, as they include 'Unknown' client types not displayed in this table.

Text description
| Year | Youth (15-24 years old) | Core-age (25-54 years old) | Workers aged 55+ |
|---|---|---|---|
| 2014-15 | 36.1% | 59.8% | 3.7% |
| 2015-16 | 35.2% | 60.2% | 4.5% |
| 2016-17 | 38.1% | 57.9% | 3.5% |
| 2017-18 | 44.1% | 50.9% | 3.2% |
| 2018-19 | 41.7% | 53.2% | 3.4% |
| 2019-20 | 44.6% | 49.1% | 3.9% |
| 2020-21 | 41.2% | 55.5% | 3.3% |
| 2021-22 | 13.4% | 31.5% | 0.7% |
| 2022-23 | n/a | n/a | n/a |
| 2023-24 | n/a | n/a | n/a |
- Notes:
- 1 This chart reflects clients served between April 1, 2014 and March 31, 2024.
- 2 LMDA data for NU is unavailable for 2022-24.

Text description
| Year | Active claimant clients | Former claimant clients | PPE clients | Non-insured clients |
|---|---|---|---|---|
| 2014-15 | 110 | 126 | n/a | 460 |
| 2015-16 | 126 | 154 | n/a | 706 |
| 2016-17 | 116 | 95 | n/a | 628 |
| 2017-18 | 153 | 168 | n/a | 773 |
| 2018-19 | 142 | 177 | 234 | 694 |
| 2019-20 | 74 | 113 | 135 | 305 |
| 2020-21 | 11 | 4 | 202 | 511 |
| 2021-22 | 29 | 37 | 52 | 40 |
| 2022-23 | 37 | n/a | n/a | n/a |
| 2023-24 | 12 | 1 | n/a | n/a |
- Notes:
- 1 This chart reflects clients served between April 1, 2014 and March 31, 2024.
- 2 LMDA data for NU is estimated for 2022-24.
- 3 Some LMDA data for NU are unavailable.
- 4 NU did not provide the breakdown of the client types and therefore 'Unknown' client types are not displayed in this chart.
| Service type | Services delivered | Year-over-year change | Share of total | Year-over-year change (p.p.) |
|---|---|---|---|---|
| Employment Benefits | 1,478 | +42.7% | 54.9% | +11.5 |
| Employment Assistance Services | 1,214 | -10.1% | 45.1% | -11.5 |
| Total services | 2,692 | +12.8% | 100.0% | n/a |
- Notes:
- 1 This table reflects all new services started between April 1, 2023 and March 31, 2024.
- 2 LMDA data for NU is estimated.
| Employment Benefits | Services | Year-over-year change | Expenditures | Year-over-year change |
|---|---|---|---|---|
| Targeted Wage Subsidies | 28 | 0.0% | $272,333 | -37.5% |
| Self-Employment | 0 | n/a | n/a | n/a |
| Job Creation Partnerships | 0 | n/a | n/a | n/a |
| Skills Development-Regular | 1,422 | +46.4% | $1,322,586 | -20.3% |
| Skills Development-Apprentices | 28 | -24.3% | Included above | Included above |
| Targeted Earning Supplements | 0 | n/a | n/a | n/a |
| Totals | 1,478 | +42.7% | $1,594,918 | -23.9% |
- Notes:
- 1 This table reflects all new services started between April 1, 2023 and March 31, 2024.
- 2 LMDA data for NU is estimated.
- 3 The financial totals in the MAR are based on finalized reports provided by PTs. At the time of publication, NU final audited financial statements for 2023-24 had not yet been received. As such, expenditures for NU are based on a draft report or the previous year's financial statements.
| Support Measures | Services | Year-over-year change | Expenditures | Year-over-year change |
|---|---|---|---|---|
| Employment Services | 1,214 | -10.1% | $128,493 | -73.1% |
| Individual Counselling | 0 | n/a | Included above | Included above |
| Labour Market Partnerships | n/a | n/a | $1,279,732 | n/a |
| Research & Innovation | n/a | n/a | n/a | n/a |
| Totals | 1,214 | -10.1% | $1,408,225 | -32.7% |
- Notes:
- 1 This table reflects all new services started between April 1, 2023 and March 31, 2024.
- 2 LMDA data for NU is estimated.
- 3 The financial totals in the MAR are based on finalized reports provided by PTs. At the time of publication, NU final audited financial statements for 2023-24 had not yet been received. As such, expenditures for NU are based on a draft report or the previous year's financial statements.

Text description
| Year | Unpaid EI benefits | Returns to employment | Active claimant clients served | Total clients Served |
|---|---|---|---|---|
| 2014-15 | $519,522 | 47 | 110 | 696 |
| 2015-16 | $624,023 | 53 | 126 | 986 |
| 2016-17 | $1,149,451 | 75 | 116 | 839 |
| 2017-18 | $780,375 | 52 | 153 | 1,094 |
| 2018-19 | $640,855 | 48 | 142 | 1,247 |
| 2019-20 | $626,866 | 42 | 74 | 627 |
| 2020-21 | $314,051 | 17 | 11 | 728 |
| 2021-22 | $323,897 | 25 | 29 | 158 |
| 2022-23 | n/a | n/a | 37 | 1,192 |
| 2023-24 | $337,868 | 17 | 12 | 1,180 |
- Notes:
- 1 Volatility in the estimated Unpaid EI Benefits from 2021‑22 to 2022‑23 correlates with the speed of recovery of the labour market that allowed many Canadians to return to work before exhausting their EI benefits.
- 2 This table excludes Indigenous pan-Canadian clients.
- 3 Some LMDA data for Nunavut are unavailable for 2022-24.
- 4 LMDA NU data for 2023-24 are estimates.
- 5 NU did not provide the breakdown of the client types and therefore 'Unknown' client types are not displayed in this chart.
- 6 The employment returns reported apply specifically to EI-insured clients (active claimants, former claimants and PPE clients).
Labour market context
In 2023-24, Nunavut's unemployment rate remained one of the highest in Canada, recorded at 12.6%,Footnote 82 maintaining the same level as the previous year.Footnote 83 Although significantly higher than the national average of 5.4%,Footnote 84 this stability could indicate the beginning of a more stabilized labour market.
In December 2023, Nunavut reported approximately 510 job vacancies,Footnote 85 indicating a tight labour market where demand for workers in various sectors, particularly in construction, mining and public services, outpaces available supply. This demand highlights the ongoing challenges of filling positions despite the high unemployment rate.
Through the Canada-Nunavut LMDA, the territory has enhanced its training and employment programs for job seekers and employers, focusing on increasing labour force participation and addressing skills gaps. These initiaves aim to better align the local workforce with industry needs and contribute to better employment outcomes in the coming years.
Nunavut's labour market outlook is expected to improve further, supported by increased funding from all levels of government for infrastructure projects and other economic development initiatives, which will help create more jobs for residents.Footnote 86
Canada-Nunavut Labour Market Development Agreement
In 2023-24, Nunavut received approximately $3.8 million though the LMDA, serving approximately 1,200 clients.Footnote 87 Within 6 months of receiving training and employment supports, approximately 1.0% of active claimant clients secured employment, resulting in approximately $338K in savings from unpaid EI benefits.
In 2023-24, LMDA funding supported the delivery of programs and services, including:
- training
- upskilling
- employment supports
- career counselling
- job search assistance
For example, the Training Assistance Program (TAP) provided work experience, training and skills development to job seekers. TAP offered wage subsidies to employers, covering up to 50.0% of the hourly wage (maximum $15/hour) for eligible participants in the public, private and not-for-profit sectors, helping them secure potential permanent employment. For persons with disabilities, TAP subsidies covered 65.0% of the wage, up to 40 hours per week. In total, 88 clients benefited from this program, receiving job training, mentorship and hands-on experience to enhance their employability.
Designated and under-represented groups
Nunavut's continued to deliver LMDA-programming aimed at supporting under-represented groups in 2023-24. The Targeted Labour Market Programs provided funding to employers, institutions, training providers, community organizations and Inuit organizations to offer training for in-demand occupations and skills. The program served 88 clients, with priority given to Nunavut based organizations that target under-represented groups such as:
- persons with disabilities
- at-risk youth
- persons who face multiple barriers to employment
- persons who are unemployed, underemployed or persistently unemployed
Additionally, in 2023-24, Nunavut supported youth aged 18-30 through Hamlets Employing Youth (HEY) program, which offered valuable work experience, job training and mentoring over a 6-month period. The program targeted youth who were out of school, not planning to return and either unemployed or underemployed. Youth participants in the HEY program earned a livable wage while receiving job training and mentorship. In 2023-24, 6 clients benefited from this program.
The program subsidized 75.0% of wages for up to 40 hours per week, with increased subsidies of up to 90.0% for persons with disabilities. It also aimed to secure full-time employment for youth at the end of the 6-month period, ensuring meaningful job opportunities for participants.
Stakeholder consultations
In 2022-23, Nunavut conducted a series of consultations with a wide range of stakeholders, including industry representatives, employers, journeypersons, apprentices, Inuit organizations, economic development officers, hamlets, Nunavut Arctic College officials and Nunavut Housing Corporation officials.
During these community consultations, discussions focused on several key topics, such as:
- programming and community needs assessments
- Nunavut Housing 3000 initiatives
- trades and occupations certification options
- technical training and tutoring supports
- trades Entrance Exam
- pay rates for apprentices
- on-the-job training and support
- employer engagement and inclusive hiring practices
- compulsory certification and governance of the apprenticeship system
- high school involvement in trade programs
Nunavut Apprenticeship
There are currently 99 active registered apprentices and 18 trade qualifiers in Nunavut. Registration levels have remained consistent over the past 6 years and indicate industry's continued support for apprenticeship. Career Development provides wage subsidies to employers during the on-the-job training components and financial support to apprentices for technical training courses.
In 2023-24, 14 employers received on-the-job wage subsidies and 37 apprentices received subsidies to attend technical training courses. The United for Literacy program, supported by the department, providing tutoring to clients advance in their apprenticeship journey. These services included preparation for the Trades Entrance Exam, Level Exams, Nunavut Arctic College programs and literacy and essential skills. In addition, 30 clients received tutoring services to move forward in their apprenticeship.
The new Apprenticeship Act provides more options for trades and occupational certification, increases the quality and flexibility of assessment of on-the-job training, creates the framework for compulsory certification trades and places more responsibility into the hands of the stakeholders. The department is continuing to make improvements to the apprenticeship program identified during the review of Nunavut's apprenticeship system, to support and encourage more Nunavummiut to enter the trades.
Program delivery and participant supports
This section provides an overview of the specific programs and financial supports available under the LMDA. It includes specific details on the programs/initiatives available, their duration associated funding and additional supports provided to participants. This aims to demonstrate how these programs and initiatives align with federal and provincial priorities and support labour market integration.
Program: Adult Learning and Training Supports (ALTS)
Expenditures: $2,612,731 (35.0%) (LMDA and WDA contribution: $2M)
Description: Adult Learning and Training Supports (ALTS) provides funding to individuals to participate in skills development training necessary to obtain employment. ALTS provides students with financial supports to attend training or upgrading that is under 1 year in duration. Depending on eligibility, funding may cover the cost of tuition, books, special equipment, tutoring, training allowance, disability assistance, childcare, airfare and accommodations.
Target client groups: EI Insured participants
Benefits and expected results: The ALTS program reduces the financial barriers faced by Nunavut clients seeking training opportunities. Training funded under this program contributes to positive employment outcomes.
Program: Grant for Nunavut Employers (GNE)
Expenditures: $87,079 (1.2%)
Description: Formerly Nunavut Employers Grant, this program is designed for small employers (50 or fewer employees) and designated Crown Corporations and Inuit Organizations who wish to target training initiatives for trainees from small remote communities. This program provides eligible employers with a maximum grant of $10,000.00 to support their employees in training that will increase their job opportunities.
Target client groups: EI Insured participants
Benefits and expected results: To support the training of Nunavummiut for new and available jobs and to encourage greater employer involvement in employee training so that skill development is better aligned to job opportunities
Program: Training Assistance Program (TAP)
Expenditures: $756,348 (10.1%) (LMDA and WDA Contribution: $600,000)
Description: Formerly Training on the Job (TOJ), this program provides wage subsidies to employers who wish to invest in an individual by providing on-the-job training, thereby strengthening the participant's employability skills. Upon completion of the subsidy, employers are expected to offer the participant a job, which has a reasonable chance to become a permanent position. TAP is intended to subsidize training during full-time, part time or seasonal employment. TAP offers subsidies of up to $15.00/hour (or to a maximum of 50 per cent of the hourly wage, whichever is less) to cover the wage costs of eligible participants.
Target client groups: EI Insured participants
Benefits and expected results: Employers hire Nunavummiut who require additional experience, skill building and workplace training. This makes them better qualified for existing positions and allows them to pursue other positions. Wage subsidies for employing apprentices (Apprenticeship Training on the Job - ATOJ) are also under this program.
Program: Employment Assistance Services (EAS)
Expenditures: $1,211,806.87 (16.2%)
Description: The EAS Program provides individuals with a variety of employment services with the overall goal of increasing their labour market participation. Career Development delivers EAS through both Career Development Officers (CDOs), as well as through community organizations who deliver EAS on behalf of Family Services.
Employment Assistance Services include: job interview preparation, resume writing assistance, labour market information, computer and internet access and training program referrals.
Target client groups: EI Insured participants
Benefits and expected results: Employment preparation services are offered to increase labour market participation for unemployed or underemployed Nunavummiut and for persons with disabilities.
In addition to Government of Nunavut staff, EAS services were provided by Nunavummi Disabilities Makinnasuaqtiit Society (NDMS) and Carrefour Nunavut.
NDMS delivered: a formalized programming for 31 clients, 51 drop-in clients, 42 employer engagement sessions and training for 6 Government of Nunavu staff. Formalized programming includes workshops on specific skill development (cooking, nutrition, finance, conflict management and stress management).
Carrefour Nunavut delivered its Employability Skills and Employment Readiness Services throughout the fiscal year in Iqaluit and across Nunavut. They also provided employment assistance in French targeting unemployed young adults aged 15 to 30 who experienced barriers to employment. These individuals included persons with disabilities, youth at risk, persons who face multiple barriers to employment and unemployed and underemployed persons. 1041 clients were served and 77 clients indicated they were employed due to the intervention.
Program: Targeted Labour Market Programs (TLMP)
Expenditures: Total under LMDA and WDA: $2,140,135.97 (28.7%)
Description: TLMP supports the development and delivery of training and pre-employment programs for persons with disabilities and unemployed Nunavummiut who experience multiple barriers to employment. Third- party service providers are funded by the DFS Career Development division to provide these training opportunities.
Target client groups: EI Insured participants
Benefits and expected results: In 2023-24 several training programs for person with disabilities, unemployed, underemployed and people who face multiple barriers to employment, were delivered through the Targeted Labour Market Program. These programs included the following:
Nunavut Literacy Council delivered its Miqqut program in Pond Inlet and Kugaaruk during the fiscal year. Miqqut is a non-formal embedded literacy program delivered through culturally based sewing that supported women to improve their Inuktitut, literacy and essential skills and reconnect them to their heritage and identity. A total of 30 women participated in the 2 offerings of the program.
Pinnguaq Association worked with 13 communities to establish local programs and facilities to support STEM learning. 49 training programs were delivered with 414 participants. 32% of participants identified as having a disability and 95% identified as Inuit.
Nunavut Fisheries and Marine Training Consortium delivered its Kisarvik marine industry training program for youth in Iqaluit. 10 young people from across Nunavut participated in the program earning Transport Canada certifications and other transferrable skills.
United for Literacy provided trades tutoring (both in-person and remotely) in 6 Nunavut Communities. A total of 22 clients (including 3 women). This tutoring prepared clients to take the Trades Entrance Exam which is a prerequisite to becoming an apprentice.
Nunavummi Disabilities Makinnasuaqtiit Society: NDMS offered full-time in-class pre-employment program in Iqaluit to develop employability skills. Participants were expected to participate in 1-on-1 sessions with the course instructor and classroom-based coursework with other participants. Where applicable, participants were connected with co-op-based opportunities. NDMS offered drop-in support to participants not enrolled in the pre-employment program on an as needed basis. In an effort to support as much outreach as possible, NDMS hosted 4 information booths to share information about the program in an attempt to enlist new participants. NDMS offered 3 employer engagement events across the territory. Employer engagement events brought employers together to discuss inclusive hiring practices, the duty to accommodate and the business case for hiring people with disabilities.
Skills Canada Nunavut: Objectives of Skills Canada Nunavut are to promote and increase exposure of the Skilled Trades and Technology sector through Skills Canada Nunavut Programs to students across Nunavut as first choice career options; Identify and select current trades and technologies to ensure Skills Canada Nunavut programs reflect the Nunavut territory and promote women in skilled trades. In addition to promoting the skilled trades and technology, students who participate in SCN activities are encouraged first and foremost to stay in school.
Skills Canada Nunavut's programming includes the Territorial Skills Competitions, Skills Canada National Competitions, Skills Clubs and Career Fairs. A total of 596 youth participated in the program.
Program: Piqataugitsi
Expenditures: $657,825.97 (8.8%) (this amount is included in targeted Labour Market Programming)
Description: Employment for Nunavummiut with Disabilities is a Government of Nunavut priority. This program assists individuals with disabilities to obtain and maintain employment by offering funding supports. The programs also assist with job coaching and training employers how to be more inclusive.
Target client groups: EI Insured participants
Benefits and expected results:
- promoted equity, access and inclusion in the workplace
- provided greater supports to persons with disabilities to increase their labour market participation
- NDMS delivered: a formalized programming for 31 clients, 51 drop-in clients, 42 employer engagement sessions and training for 6 Government of Nunavut staff. Formalized programming includes workshops on specific skill development (cooking, nutrition, finance, conflict management and stress management)
- NDMS also administers the Supporting Employment and Training (SET) program on behalf of the Department of Family Services. This program provides persons with disabilities with adaptive devices and pay for training and employment expenses related to an individual's disabilities. In 2023-24, 18 clients were provided support
3.3 Evaluation of Employment Benefits and Support Measures (EBSMs)
The Evaluation Directorate of ESDC completed the third LMDA evaluation cycle (Cycle III) of the LMDAs between 2018 and 2023. Studies conducted as part of the second and third evaluation cycles examined all programs and services funded under the LMDAs.
Evaluation of the impact and effectiveness of Employment Benefits and Support Measures (EBSM) is required under the LMDAs. This evaluation builds on findings of previous LMDA evaluation cycles to address knowledge gaps and assess the effectiveness, efficiency, as well as design and delivery, of LMDA-funded employment benefits and support measures across Canada.
Evaluation terminology
Participants vs. non-participants: The impact that the participation of EI claimants in a LMDA-funded program could have on their chances to be employed is measured by comparing their employment rate to the employment rate of EI claimants who did not participate to any LMDA-funded program. The difference between these 2 employment rates informs the impact that participation in LMDA- funded programs could have on employment and the same comparison is done for other indicators such as, employment earnings or reliance on Government supports.
Outcome analysis measures the changes experienced by participants before and after program participation. An outcome analysis alone does not allow an assessment of the extent to which those changes can be attributed to program participation.
Incremental impacts aim to assess the impact and effectiveness of a program. Incremental impacts are estimated by comparing participants' outcomes to that of similar non-participants. Incremental impacts represent the proportion of the observed outcomes that can be attributed to program participation.
The Horizontal Evaluation of the Labour Market Development Agreements was approved for publication by the Federal-Provincial-Territorial Evaluation Steering Committee and the Deputy Minister in 2022.Footnote 88 Additionally, 12 provincial and territorial-level LMDA evaluation reports were approved through bilateral joint evaluation committees and received Deputy Minister approval for publication in 2023.Footnote 89 Both the national and provincial/territorial-level evaluation reports are available at Evaluation Reports.
The evaluation findings are drawn from 9 separate evaluation studies,Footnote 90 which employed a combination of qualitative and quantitative methodologies, including:
- incremental impact analysis: assessed program effectiveness by comparing the labour market experiences of 2010 participants to those of 2012 participants, before, during and after their participation in LMDA-supported programming post participation with that of similar non-participants
- outcome analysis: assessed program participants' labour market outcomes by comparing the pre- and post-participation labour market outcomes of 2010 participants against those of 2012 participants in LMDA-supported programming (outcomes were tracked up to 2017)
- cost-benefit analysis: assessed program efficiency by comparing the participants' cost of participating and the government's cost of delivering the program against the benefits associated with the program
- key informant interviews: gathered insights on challenges and lessons learned from 287 provincial/territorial representatives, service providers, agreement holders and key stakeholders
- provincial/territorial questionnaires: collected PT-specific challenges and factors contributing to programs successes
- a national survey: examined the contribution of the program to the success of self-employment businesses by surveying 2,023 participants in LMDA-funded self-employment assistance services
- document and literature reviews: identified challenges, lessons learned and best practices associated with the design and delivery of EBSMs
Summary of findings
The evaluation revealed that participation in LMDA-funded programs and services improves participants' labour market attachment and reduces their dependence on government income supports, compared to similar non-participants. These benefits were observed across PTs, with some regional variation. For example, the following findings each represent changes in labour market outcomes from before to after participation for a group of participants in a specific intervention relative to similar non-participants.
- Skills Development: participants collecting EI benefits saw their employment rate increase by 4.0 percentage points
- Targeted Wage Subsidies: participants who had previously collected EI benefits experienced a 6.2 percentage point rise in employment
- Employment Assistance Services: participants collecting EI benefits saw their employment rate improve by 4.8 percentage points
These results align with those of the second LMDA evaluation cycle (between 2012 and 2017).
The impact of participation in LMDA-funded programs was assessed by intervention type, jurisdiction and participant subgroup. Relative to similar non-participants, participants (including those from designated and/or under-represented groups) experienced the greatest benefits from Skills Development, Targeted Wage Subsidies and Employment Assistance Services. For example:
- Skills Development: participants collecting EI benefits, including older workers, saw their employment rate increase by 11.8 percentage points, while Indigenous participants experienced a 7.4 percentage points rise
- Targeted Wage Subsidies: participants who had collected EI benefits before their participation, as well as persons with disabilities, saw their employment rate increase by 11.5 percentage points, while young workers experienced 5.1 percentage points increase
- Employment Assistance Services: participants collecting EI benefits and recent immigrants experienced a 4.7 percentage point increase in employment, while women saw a 1.4 percentage point increase
In all PTs where cost-benefit analyses were conducted, the social benefits of participating in LMDA-funded programs and services exceeded the initial investment made in these programs. For example:
- Skills Development: social benefits surpassed the cost of participation after 8.3 years
- Targeted Wage Subsidies: social benefits exceeded the cost in less than 1 year for participants who had collected EI benefits before their participation
- Employment Assistance Services: social benefits outweighed the cost after 7.7 years
3.4 Pan-Canadian activities and the National Employment Service
In this section
- 3.4.1 Indigenous programming
- 3.4.2 Investments in workplace skills
- 3.4.3 Labour market information
- 3.4.4 The National Essential Skills Initiative
- 3.4.5 Sustainable Jobs
- 3.4.6 Work Integration Social Enterprises Research
Through pan-Canadian activities under the LMDAs, the Government of Canada plays a leadership role in addressing challenges that extend beyond local and regional labour markets. These activities are guided by 4 primary objectives:
- promote an efficient and integrated national labour market
- preserve and enhance Canadian economic unity
- help address common labour market challenges and priorities of national and international scope that surpass provincial and territorial borders
- promote equality of opportunity for all Canadians, with a focus on helping designated and/or underrepresented groups reach their full potential in the Canadian labour market
In 2023-24, approximatively $184 million of EI part II funding, including just over $150 million in program funding (chart 3.4.1), was invested in pan-Canadian activities to support these objectives through 3 funding streams:
- Improving Access to Skills Training and Employment Supports in a Changing Labour Market
- Indigenous Skills and Employment Training program
- Skilled Trades and Apprenticeship and Red Seal program
- Giving Canadian Workers and Employers the information they need to succeed
- Sectoral Workforce Solutions program
- Education and Labour Market Longitudinal Linkage PlatformFootnote 91
- Labour Market Information
- Exploring New Opportunities to Improve Labour Market Participation and Outcomes
- National Essential Skills Initiative
- Work Integration Social Enterprises research

Text description
| Program | Expenditure |
|---|---|
| The National Essential Skills Initiative | $5,516,450 |
| Sectoral Workforce Solutions program | $19,294,175 |
| Work Integration Social Entreprise Research | $1,211,484 |
| Indigenous Skills and Employment Training | $124,609,981 |
| Total | $150,632,090 |
3.4.1 Indigenous programmingFootnote 92
The pan-Canadian funding delivered through the Indigenous Skills and Employment Training (ISET) program aims to enhance the skills of Indigenous people and support their participation in the Canadian labour market. The program ensures that First Nations, Inuit, Métis and Urban/Non-affiliated Indigenous people have access to skills development training and employment supports to help them achieve their long-term career goals and secure employment.
In 2023-24, the ISET program received approximately $125 million from EI Part II funds to support training and related services for Indigenous clients. This funding supports a network of over 115 Indigenous contribution recipients operating through more than 650 service points across Canada. ISET Program results for 2023-24 were funded through EI Part II and the Consolidated Revenue Fund (CRF). Additionally, $23,744,883 in ISET program funds were transferred to Crown-Indigenous Relations and Northern Affairs Canada (CIRNAC) for self-governing Indigenous governments, delivered through their Fiscal Financing Agreements or related self-governing grants.
The ISET program aims to reduce the skills and employment gaps between Indigenous and non-Indigenous people. Co-developed with Indigenous partners, the program includes 4 distinct labour market strategies, each with its own funding envelope for: First Nations, Inuit, Métis, Urban and Non-affiliated Indigenous peoples.
Offering new investments and long-term, flexible agreements to Indigenous service delivery organizations supports Canada's efforts to advance reconciliation and promote self-determination. Systemic inequities between Indigenous and non-Indigenous people in Canada are addressed by creating more job training opportunities for Indigenous people. This approach aligns with the United Nations Declaration on the Rights of Indigenous Peoples and Canada's Action Plan.
The program offers a broad range of labour market activities tailored to each group's unique needs. Indigenous service delivery organizations design and deliver locally-relevant programs, including:
- employment-related and career development assistance
- wrap-around supports such as living expenses
- financial assistance to support individuals in obtaining skills for employment
- tuition support
- business coaching and mentorship
- disability-related support
Indigenous service delivery organizations receive funding from both the CRF and the EI Part II pan-Canadian Fund to support their clients. EI Part II funding enables them to support clients who meet the EI Part II employment support measures eligibility criteria. In 2023-24, the ISET program served over 54,000 Indigenous clients, including both new and ongoing participants (see Chart 3.4.2). Of these, more than 47,750 were new clients, with over 21,500 funded through EI Part II. Out of the total 54,000 indigenous clients, more than 19,000 secured employment within 6 months of participating in training and employment programs, including over 10,400 EI funded clients. Additionally, over 6,500 clients returned to school for further training.

Text description
| Type of client | Total number of clients | Clients funded through EI Part II | CRF Funded clients |
|---|---|---|---|
| New clients | 47,750 | 21,500 | 26,250 |
| Secured employment within six months of participation | 19,000 | 10,400 | 8,600 |
| Returned to school | 6,500 | 0 | 6,500 |
- Notes:
- 1 EI Part II and CRF combined, representing the total number of clients served under the Indigenous Skills and Employment Training program.
- 2 The number of clients returned to school is available only for the combined EI Part II and CRF total.
3.4.2 Investments in workplace skills
The skilled trades and apprenticeship and Red Seal programs
The Red Seal Program develops common interprovincial standards and examinations for the designated Red Seal trades, based on which tradespeople can be trained and assessed. These standards and examinations are used to harmonize apprenticeship training among provinces and territories (PTs), provide the public with updated descriptions of trades and serve as the foundation for skills assessment.
The Red Seal endorsement is a nationally recognized standard for skilled trades workers in Canada. It promotes excellence to employers, instills pride in skilled workers and facilitates labour mobility across jurisdictions. Experienced tradespeople and apprentices who completed their training can take the interprovincial Red Seal examination. Those who passed received a Red Seal endorsement on their provincial or territorial certificate of qualification, indicating they have met both the provincial/territorial requirements and have demonstrated the knowledge required for the national standard in that trade.
In most PTs, the Red Seal examination serves as the final examination for certification for Red Seal trades. The collaboration process of developing interprovincial Red Seal standards and examinations also results in cost-savings for governments.
The Canadian Council of Directors of Apprenticeship (CCDA) oversees the Red Seal Program. The Government of Canada and all PTs - each responsible for apprenticeship training and trade certification in their jurisdictions - are members of the CCDA. ESDC sponsors a Red Seal Secretariat, which provide strategic and secretariat support to the CCDA and the Red Seal Program.
Red Seal Program
The Red Seal Program currently covers 54 skilled trades, accounting for: 76% of registered apprentices, 84% of new registrations and 83% of completing apprentices.
The top 5 Red Seal trades by number of endorsements issued in 2023 are:
- construction electrician
- automotive service technician
- plumber
- industrial mechanic (millwright)
- truck and transport mechanic
Red Seal Program Highlights (2023-24):
- In 2023, 45,013 Red Seal examinations were written, resulting in 23,317 Red Seals endorsement being issued
- 6 new Red Seal Occupational Standards were completed
- 69 examinations were published for 18 trades
The Red Seal Program regularly updates its products to reflect the evolving needs of the labour market. In 2023-24, the Red Seal Occupational Standard for Refrigeration and Air Conditioning Mechanic was revised to include additional content addressing the growing demand for heat pump installation and maintenance. Furthermore, for trade-specific technical content, every Red Seal trade's occupational standard now features an overarching section emphasizing the importance of the skilled trades in building a sustainable future.
The Government of Canada remains committed to working with provinces, territories and industries to reduce barriers to certification in the skilled trades and expand opportunities for apprentices across the country. The CCDA continues to lead the efforts to harmonize apprenticeship training requirements in Red Seal trades. Harmonization promotes greater labour mobility across Canada and supports apprentices in completing their training when relocating to another jurisdiction during their apprenticeship.
The Registered Apprenticeship Information System
The Registered Apprenticeship Information System (RAIS) is an annual administrative database produced by Statistics Canada. The database compiles data from PTs on the number of registered apprentices participating in in-class and on-the-job training in trades that are either Red Seal or non-Red Seal. It also compiles data on the number of certificates granted to apprentices or trade qualifiers (challengers).
RAIS is part of the Education and Labour Market Longitudinal Platform, announced in Budget 2018 with an investment of $5.5 million per year ongoing starting in 2018-19. The Platform provides Canadians with up-to-date labour market information to help them make informed career decisions. It integrates data from foundational systems, including the RAIS, the Post-Secondary Information System and Canada Revenue Agency's T1 Family File. Annually published RAIS longitudinal indicators provide insights on a number of key topics, including apprenticeship pathways, labour market outcomes and interprovincial mobility.
The latest 2021 RAIS results revealed that there were over 330,000 continuing apprentices, with 76% enrolled in Red Seal trades. Additionally, more than 72,000 new registrations were recorded, 82% of which were in Red Seal trades. Furthermore, over 35,000 apprentices received certification, with 84% earning their certification in Red Seal trades.
Sectoral Workforce Solutions Program
In 2023-24, ESDC continued to implement the Sectoral Workforce Solutions Program (SWSP) announced in Budget 2021. The SWSP builds upon and expands the activities previously supported by the Sectoral Initiatives Program (SIP). It operates using 2 funding sources: $19.4 million in EI Part II funds and $353.2 million from the Consolidated Revenue Fund (CRF).
The SWSP offers a broad range of support for training workers and helping employers address workforce needs. It assists sectors and employers in tackling current and future skills shortages by funding the development and distribution of sector-specific labour market intelligence, national occupational standards and skills certification and accreditation systems.
A key focus of the program is supporting equity-seeking groups by fostering a diverse and inclusive workforce. This approach helps employers find skilled workers while enabling Canadians to access the training needed to secure good jobs in essential sectors.
Although the program benefits both workers and employers, EI Part II funding is primarily directed toward helping employers, particularly small and medium-sized businesses, attract and retain skilled workers. Key stakeholders include primarily partnership-based organizations engaged in skills and workforce development in their respective economic sectors or employment groups across Canada. Eligible organizations include not-for-profit organizations, for-profit organizations, municipal governments, Indigenous organizations, as well as provincial and territorial governments, institutions, agencies and crown corporations.
In 2023-24, the SWSP invested $0.6 millionFootnote 93 in EI Part II funding and $8.4 million in CRF funding to support 3 legacy projects originally launched under the Sectoral Initiatives Program (SIP). Additionally, $18.9 million in EI Part II funding and $16.7 million in CRF funding was allocated to supporting 21 tourism projects and 9 projects targeting persons with disabilities.Footnote 94 Furthermore, the program invested $325.9 million in CRF funding to support 21 additional SWSP projects,Footnote 95 expanding its reach and impact across various sectors.
Specifically, $19.4 million in EI Part II funding supported 16 projects in 2023-24, including:
- $0.6 million for 1 of the 3 SIP legacy projects focused on developing labour market information and workforce tools in construction, health and natural resources and environment sectors
- $6.2 million for 6 of the 21 tourism projects, aimed at helping one of the sectors hardest hit by the pandemic by developing labour market information and workforce tools, attracting and retaining skilled workers, conducting training activities and reducing barriers for designated and/or equity-seeking groups
- $12.6 million for all 9 projects targeting persons with disabilities, with a focus on removing barriers to labour market participation, providing training tools and supporting employment and career-building opportunities across multiple sectors, including information and communications technology and transportation
Overall, in 2023-24, the SWSP supported 54 projects (16 projects funded through EI Part II and 38 projects funded through the (CRF), resulting in:
- 89,546 individual participants engaged in training activities
- 430 labour market intelligence reports and forecasting systems developed
- 174 national occupational standards created
- 29 certification and accreditation systems established
- 1,382 onboarding and retention tools developed
- 14,986 employers and end users accessing these solutions and tools
SWSP supported projects
Below are the SWSP projects that were funded through EI Part II. $19.4 million was allocated to 16 projects.
Persons with disabilities projects
- Abilities to Work Employment Support - Employability Health Support Services Project
- Canadian Association for Supported Employment - Case Innovations Lab Initiative
- Canadian Cultural Society of the Deaf - Building Capacity for Sign Languages Employment
- Canadian National Institute of the Blind - Apprenticeship Training for New Guide Dog Trainers and Guide Dog Mobility Instructors
- Disabled Workers Foundation of Canada - Towards Excellence in Return to Work
- Gateway Association for Community Living - GEDI-Hub
- Realwheels Society - Customized Actor Training for Persons with Disabilities
- Rick Hansen Foundation - Building National Capacity for Accessibility Training and Credentials
- The Canadian Council on Rehabilitation and Work - Accessibility First West Coast
Tourism projects
- Cape Breton University - Cape Breton Island's Tourism Training Network
- Conseil de la Nation Huronne-Wendat - Together for our future
- Gros Morne Institute for Sustainable Tourism Inc. - Leadership and Innovation for the Future of Tourism in Atlantic Canada
- Refiner's House of Prayer - Placement Aid and Skills Development Project
- The Further Education Society of Alberta - Pathways Creating Opportunities for Indigenous Youth Employment in Tourism and Government
- Wheatland Express Inc. - East-Central Saskatchewan Tourism and Learning Centre
SIP legacy project
Carleton University - Energy Efficiency Career Hub
3.4.3 Labour market information
Labour Market Information (LMI) is an integral component of the Government of Canada's economic agenda, providing Canadians with employment-related information to make informed decisions regarding the labour market. LMI includes both qualitative and quantitative information, offering insights into job supply and demand, job location and required qualifications. It also includes information on wages and other forms of compensation, as well as skills needs and gaps at both detailed and aggregate levels.
ESDC invests in a number of foundational LMI frameworks and programs to streamline data collection and measurement of occupational and competency-based information across Canada. These foundational frameworks - such as classifications, taxonomies and information systems - create a common lens and terminology to improve the capture and interpretation of LMI data. This information is made publicly available through the Job Bank platform.
National Occupational Classification
ESDC's LMI portfolio includes the administration of the National Occupational Classification (NOC), the national framework for collecting, analyzing and disseminating occupational data. For many occupational groups, the NOC describes job titles, functions, tasks and duties, employment requirements, responsibilities and qualifications.
The current version of the NOC organizes information for over 40,000 job titles classified into 516 unit grouping - occupations with similar duties and employment requirements. These groups are classified into broad occupational categories within the labour market.
Labour market surveys, research, analysis and reports commonly rely on the NOC. It also supports employment-based programming, such as EI, the Temporary Foreign Worker Program and initiatives supporting the integration of injured workers and persons with disabilities. NOC-based information is used for policy development, program design and service delivery.
ESDC, in collaboration with Statistics Canada, revises the NOC every 5 years to maintain its accuracy and relevance. These revisions are informed by research and stakeholders feedback gathered through extensive consultations.
On September 21, 2021, ESDC and Statistics Canada released the NOC 2021 V1.0 redesigned classification. This version replaced the former NOC "Skill Level" categories with a Training, Education, Experience and Responsibilities (TEER) categorization system. The TEER system offers a clearer distinction between occupations based on formal training and education requirements, while also capturing work experience, managerial duties and significant safety responsibilities.
Since the release of the NOC 2021 V1.0, ESDC has moved to an ongoing consultation process to provide stakeholders more opportunities to offer feedback. Research for the NOC 2026 revision is already underway and is expected to be finalized in early 2025.
The Skills and Competency Taxonomy and the Occupational and Skills Information System
As a natural extension to the NOC, ESDC has developed and maintains skills frameworks and systems that outline the competency requirements of Canadian occupations.
ESDC developed a Skills and Competencies Taxonomy (SCT). The SCT is a dictionary of over 300 descriptors and definitions designed to standardize terminology across skills, competencies and occupational domains. This streamlined terminology improves the comparability of skills and competencies taxonomy across sectors and over time.Footnote 96 The SCT serves as the foundation for the development of a Canadian system similar to the American O*NET system, which is recognized as an effective model for providing detailed skill information for all occupations. Using the SCT and the NOC, ESDC launched a new system called Occupational and Skills Information System (OASIS). The OASIS 2023 V1.0 maps skills and competency requirements for 900 occupational profiles, allowing users to understand how skills, competencies and occupational work activities from the SCT apply to specific occupations. It also enables users to compare occupations based on skills, abilities and personal attributes, while exploring career options that share similar skill sets.
In today's economic context, including digitalization of jobs, more granular information about skills is needed to support Canadians navigate labour market transitions. Comprehensive and well-structured skills information is important as job searches, match processes and training advice are increasingly delivered online through modern digital formats.
Canada is adopting common international practices and leading development of algorithms tailored to Canadian labour markets. These algorithms leverage from artificial intelligence (AI), natural language processing and text mining technologies.
Labour market information products and services
ESDC also delivers the National Employment Service on behalf of the Canada Employment Insurance Commission (CEIC), supported by regional and labour market analysts. These analysts produce regular LMI products based on the NOC and other LMI classifications. These products and services include data on wages, wage analyses, job market snapshots, employment outlooks and economic forecasts, all of which are accessible to Canadians via the Job Bank website. LMI products help to match current and future job seekers, including students and immigrants, with available and potential job opportunities. They also facilitate exploration of educational and training options, helping Canadians make informed career decisions.
Job Bank is a free and bilingual platform co-delivered with PTs governments, offering a comprehensive listing of job opportunities across Canada. Employers use Job Bank to post their job vacancies and connect with qualified candidates. Job Bank supports other ESDC employment programs, as well and collaborates with private job boards to enhance the diversity of jobs opportunities available and offered.
In 2023-24, Job Bank introduced several online service enhancements aimed at supporting Canadians in succeeding in the labour market, with a focus on sustainable employment and addressing skill mismatches.
- Support for employment groups: Job Bank enhanced its platform to help employers highlight how they create a more inclusive workplace, displaying this information on job posting and can employer's business profile. As part of the Inclusive Workplaces' campaign (January 15 to March 31, 2024), additional interactive information targeting persons with disabilities were integrated into the employer pages to further support inclusivity efforts
- Recognition of Red Seal occupations: Job profiles now identify occupations and professions recognized by the Red Seal program, with information available at both the national and provincial/territorial levels
- Job Transition Tool: Job seekers can explore career changes using the new Job Transition Tool, which recommends occupations based on their qualifications. The tool also provides an estimated timeline for the transition from their current occupation to a new career path
- Green jobs pages: Job Bank introduced dedicated pages for green jobs, offering advice and resources for job seekers looking to work in the green economy. Employers aiming to create a positive environmental impact can access resources to advertise green jobs and establish eco-friendly workplace
Key highlights of 2023-24: Job seekers
- 1.99 million job seekers created a user account on Job Bank, up from 1.71 million in 2022-23
- Job alerts users enrolled via AppliWeb accounted for 87% of the new Job Alerts users
- Top occupations of Job Alerts users included construction, elementary and secondary teacher assistants, carpenters and truck drivers, which remained largely consistent with previous year
Website content enhancements
Job Bank launched a dedicated content page for employers about green jobs, titled Hire for a Green Future. This page encourages employers to participate in the green economy by offering tips on how to "greenify" their businesses and providing information about various funding opportunities.
In 2023-24, Job Bank launched the Career Planning advice page. This page provides users guidance on key steps for planning their future careers, featuring actionable advice, links, tools and to assist with career decisions. Additionally, the Job Bank support page was revamped to enhance user experience and improve accessibility.
The Job Bank mobile application underwent several updates in 2023-24 to align with website changes. A satisfaction survey was launched to gather user feedback and guide future application development. Additionally, back-end changes were made to maintain the application's performance and provide job seekers with a seamless experience.
Job Bank also continued to expand its job listings by integrating job feeds from 17 "external" contributors, including provinces, private job boards and federal government agencies or departments. In 2023-24, these contributors added a total of 841,294 jobs to the Job Bank's platform.
Increased integrity, efficiency and interoperability
Job Bank continued to enhance interoperability and collaboration with stakeholders within ESDC to improve its services and functionality.
- For the sixth consecutive year, Job Bank leverages its job posting capabilities to publish Canada Summer Jobs opportunities on its website and Mobile App
- Interoperability with stakeholders was further improved with the introduction of a new connection to the Occupational and Skills Information System (OaSIS) API, enhancing quality of the information available to users consulting Job Bank's job profiles
- Job Bank implemented changes that improved operational efficiency, including an increase in auto-approval rates for job postings in 2023-24
Job Bank updated its registration options to include the gender-neutral titled "Mx.", allowing users who identify outside of the gender binary to select a suitable prefix. This change ensures more inclusive communication in all interactions with Job Bank.
Key highlights of 2023-24: Web analytics and job postings
- The Job Bank website received 96.7 million visits up from 79.7 million in previous year, averaging 265,000 site sessions and 1.8 million page views per day
- 57% of visitors viewed job postings, up from 53%, resulting in over 176 million job posting views, compared to 153 million views in the previous fiscal year
- The Trend Analysis sections (LMI) received approximately 33,000 site visits per day, up from 25,000, generating over 66,000 job profiles daily, up from 55,000 last year
- The Career Planning section attracted nearly 1.9 million site visits during the year
- The Mobile App recorded over 2.5 million sessions, an increase from 1.8 million, resulting in over 5.8 million job posting views, up from 4.0 million in the previous year
- Over 1.3 million job postings were available on Job Bank from all sources in 2023-24, an increase from 1.2 million last year
- Over 101,520 employers posted 425,000 job postings, up from 86,000 employers and 364,000 job postings in the previous fiscal year. These postings represented over 937,000 job vacancies, slightly down from 947,000 the year before
- Approximately 79,000 job postings directly advertised on Job Bank were associated with the TFW Program up from 51,000 last year
- TFW job postings account for 19% of all direct employer postings, an increase from 14% in the previous fiscal year and 6% of postings displayed across all sources, reflecting a 2 percentage point increase from the prior year
- Over 60,000 job postings (covering 90,000 distinct vacancies) were available on the Canada Summer Jobs feature, down from 75,000 job postings (124,500 vacancies) in the previous fiscal year. These postings were received by 26,446 employers, compared to 31,049 employers in the prior year
Close to 50 percent of the employers who completed Job Bank's Employer Survey in 2023-24 indicated that they filled a job vacancy as a result of posting on Job Bank.
3.4.4 The National Essential Skills Initiative
The National Essential Skills Initiative (NESI), funded through EI Part II, is 1 of 2 Grants and Contributions programs under the Skills for Success (SFS) program; the other is the Adult Learning, Literacy and Essential Skills Program, funded through the CRF. The SFS program supports Canadians improve their foundational and transferable skills, enabling them to prepare for, secure and retain jobs while adapting and succeeding in the workforce. This aligns with the Government of Canada's commitment to helping Canadians develop the skills necessary for good quality jobs.
Past evaluations of the SFS Program's predecessor, including NESI funded activities, have shown positive results. The 2016-21 evaluation report, detailed in the 2022 Literacy and Essential Skills Program Evaluation, highlights the effectiveness of these initiatives in addressing skills gaps.
NESI focusses on research projects that anticipate and help predict emerging foundational and transferable skills needs, particularly for designated and/or under-represented groups in the labour market. In line with departmental priorities, 30% of NESI funding supports research projects for persons with disabilities (10%) and racialized Canadians (20%). These research projects allow the SFS program to:
- understand evolving foundational and transferable skills gaps across Canada, with a focus on changing labour market and informed by an intersectional lens
- target future project intake processes to anticipate and respond to emerging priorities and labour market trends
In 2023-24, NESI funded 9 projects, focussing on enhancing foundational and transferable skills for persons with disabilities, workers in the non-profit sector, early career workers and Indigenous apprentices. However, delays in the project intake process led to fewer funded projects than anticipated. Most of these projects are set to conclude in 2024-25, with outcomes reported next year.
As an example, NESI project in 2023-24 is the Canadian Apprenticeship Forum's, "Holistic Skills for Success Models in the Trades" project. This initiative collaborated with over a dozen partners to research and document promising practices that integrate Skills for Success and well-being in holistic training models. It identified measures of success that reflect Indigenous lived experiences, improved employment preparation and addressed apprenticeship labour market challenges that affected equity group retention. The project engaged more than 100 individuals through a webinar, conducted nearly 70 virtual interviews and co-developed its research model and framework with Indigenous partners.
3.4.5 Sustainable jobs
The Government of Canada is committed to reducing greenhouse gas emissions to fight climate change, while strengthening the economy by fostering the creation of sustainable jobs. Transitioning to a low-carbon economy creates opportunities across both existing and emerging sectors, requiring the transformation of Canadian industries and the Canadian labour market. Ensuring Canada has a plan to advance a low-carbon economy and a workforce that can thrive in the low-carbon economy is fundamental to achieving our climate targets.
On February 17, 2023, the Government released its Interim Sustainable Jobs Plan (2023-25), a framework for the Sustainable Jobs Action Plans that will be released every 5 years, starting in 2025. These plans are designed to guide and coordinate efforts to support workers as they transition to the economy of the future. This interim Plan outlines federal measures across 10 key action areas:
- Establish the Sustainable Jobs Secretariat
- Create a Sustainable Jobs Partnership Council
- Develop economic strategies through the Regional Energy and Resource Tables
- Introduce a sustainable jobs stream under the Union Training and Innovation Program
- Advance funding for skills development towards sustainable jobs
- Promote Indigenous-led solutions and a National Benefits-Sharing Framework
- Improve labour market data collection, tracking and analysis
- Motivate investors and draw in industry leadership to support workers
- Collaborate and lead on the global stage
- Establish legislation that ensures ongoing engagement and accountability
These actions are informed by over 2 years of consultations and conversations with PTs, Indigenous peoples, workers, unions, industries, environmental and civil society organizations and interested Canadians.
Alongside the release of the interim Sustainable Action Plan, ESDC implemented several key investments in 2023-24, partially funded through EI Part II, to drive progress towards sustainable jobs and support Canada's transition to a low-carbon economy. Key areas of investment include:
- Labour Market Development Agreements (LMDAs): Each year, the Government provides funding through the bilateral LMDAs with PTs to support training and employment initiatives for individuals and employers. Many of these programs contribute directly to the net-zero transition. While the Government of Canada provides funding, LMDAs require PTs to consult annually with labour market stakeholders within their jurisdictions to ensure the programming is tailored to address regional priorities and meet the specific needs of local labour market
- Indigenous Skills and Employment Training (ISET): First Nations, Inuit, Métis and Urban/Non-affiliated organizations have the autonomy to design and prioritize training and employment supports that are specifically tailored to the unique needs of their people and communities. These efforts include initiatives that support Indigenous participation in net-zero transition
- Red Seal Program: National occupational standards are being updated to include ‘green learning' objectives and address key topics such as reducing emissions and pollution, integrating emerging technologies that support net-zero climate goals and reducing the trades' environmental footprint. For example, in 2023-24, the Red Seal Occupational Standard for Refrigeration and Air Conditioning Mechanic was revised to incorporate content that address the increasing demand for heat pump installation and maintenance, directly supporting Canada's net-zero and carbon-neutral commitments
- Community Workforce Development Program (CWDP): Provide project-based funding to support workforce planning and skills training, enabling worker transitions from declining to growing industries to meet local economic development needs. This funding assists communities and workers affected by mass layoffs, offering additional support to help workers successfully transition into new job opportunities
- Union Training and Innovation Program (UTIP): Through the Sustainable Jobs Stream of the program, new funding is supporting a series of projects aiming at developing and delivering green training for journeypersons and apprentices in Red Seal trades, focussing on key areas to reducing Canada's emissions
- Labour Market Information (LMI): Investments in developing and disseminating labour market information through tools, such as surveys, enhance understanding of the labour demands in a net-zero future. These efforts support informed decision-making regarding career, education, training and hiring
- Job Bank green jobs features: Investments in the Job Bank green jobs features connect Canadian job seekers with employers contributing to positive environmental outcomes, supporting green economy sectors and fostering the development of workers with specialized environmental skills and expertise
The Government will remain committed to creating sustainable jobs by leveraging existing programming and collaborating with stakeholders to identify the skill sets needed for a low-carbon economy and to ensure that Canada's workforce is equipped to succeed in a net-zero future.
3.4.6 Work Integration Social Enterprises research
The Work Integration Social Enterprises (WISE) research program is designed to provide evidence that support the achievement of the Government of Canada's and ESDC's objective of creating a skilled, adaptable and inclusive workforce while fostering an efficient labour market. The findings of this research will inform policy and program funding decisions, ensuring federal investments align with labour market needs. This objective emphasize collaboration with the not-for-profit sector and private business in implementing innovative ideas, social partnerships and social finance approaches. The research program itself is an example of this collaboration approach.
This strategy aligns well with the Government's Social Innovation and Social Finance Strategy and supports long standing initiatives by various governments to recognize social enterprise as a key business model. WISEs serves as a primary examples of community organizations developing solutions for society's most challenging problems. They consistently look for innovative financing and new revenue sources to enhance their sustainability and achieve greater impact.
WISEs have the capacity to (re)integrate vulnerable populations into existing labour markets, creating long-term new jobs and increase the overall employability of disadvantaged populations. However, a lack of empirical data on the direct labour market and broader relevant social outcomes of WISEs for different vulnerable populations in Canada remain a significant barrier to evidence-based policy and program development.
WISE Phase I
ESDC launched the WISE Research program in 2017, as a 5-year longitudinal study composed of 6 main projects. The goal was to measure the impact of social enterprises on labour market outcomes for vulnerable populations including persons with disabilities, youth, recent immigrants, homeless or those at risk of homelessness, and Indigenous peoples. Funding was strictly for research purposes and did not cover the WISE organizations on their interventions directly.
These 6 longitudinal research projects included 1 project based on a quasi-experimental design and 5 projects based on multi-site extended case studies, with projects located in Ontario (4), Quebec (1), and British Columbia (1).
The 6 research teams completed their projects in 2022, marking the completion of the WISE Phase I Research Program. Each team publicly published a final report highlighting the key results from their research.
The results demonstrated that WISE interventions generally lead to improvements in employment and financial outcomes for participants, including enhanced ability to secure and maintain employment and achieve higher income levels. Notably, 1 project provided evidence that funding WISE programs can have a positive return on investment.
Further details on WISE Phase I Research Program can be found in the Synthesis report: Work Integration Social Enterprises (WISE) Research Program - Synthesis - 2017 to 2022.
WISE Phase II
Building on WISE Phase I Research Program, ESDC launched a Phase II in 2023 as a multi-project longitudinal study spanning over 5 fiscal years, from 2022-23 to 2026-27. Phase II focused on the role of the broader social enterprises sector in supporting the work and social integration of Black and racialized groups in Canada.
The research aims to address key questions:
- what are the characteristics of social enterprises serving Black and racialized groups
- what are the characteristics of the clients of these social enterprises
- how and to what extent do these social enterprises help promote the social and labour market integration of Black and racialized persons in Canada (e.g., improvement in employment, mental health, wellbeing and other socio-economic outcomes)
This research program aligns with the Canada's goal of fostering equality, equity and fairness as well as the Research and Innovation (R & I) objectives of EI Part II. It responds directly to the growing need to improve labour market outcomes for equity-deserving groups and racialized workers.
In 2023-24, the WISE Phase II Research Program funded 11 projects that are set to conclude in 2026-27. Achievements for the current exercise include:
- formation of research teams: Research teams were formed and formally introduced to ESDC through Individual bilateral meetings (March to July 2023)
- kickoff workshop: In October 2023, each team presented their projects overviews at a virtual Kickoff Workshop
- finalization of methodologies: All research methodologies and study design were finalized, marking the beginning of participants and social enterprises recruitment
- progress report: A progress report on the research program was produced and is scheduled for public release in 2024-25
ESDC is organizing the second workshop, scheduled for February 2025. This hybrid event and will bring together the 11 research teams and a selected ESDC stakeholders to discuss the progress of the research projects.