
2023 annual report – Occupational injuries in the Canadian federal jurisdiction
On this page
- List of abbreviations
- List of charts
- Executive summary
- Introduction
- Section 1: About the data
- Section 2: Occupational injuries in federal jurisdiction industries in 2023
- Key occupational injuries statistics
- Assessing workplace safety performance for federally regulated industries
- Disabling Injury Frequency Rate
- Fatal Injury Frequency Rate
- Section 3: Impact of the scale of economic activity on work-related injuries
- Section 4: Tracking safety performance trends and exploring regional variations within industries
- Tracking safety trends for federally regulated industries from 2019 to 2023
- Exploring variations in regional safety performance within industries
- Section 5: Moving forward
- Annex: List of terms
Alternate formats

Large print, braille, MP3 (audio), e-text and DAISY formats are available on demand by ordering online or calling 1 800 O-Canada (1-800-622-6232). If you use a teletypewriter (TTY), call 1-800-926-9105.
List of abbreviations
- AIRT
- Air Transportation
- BANK
- Banking and Banks
- BRID
- Interprovincial Infrastructure (Bridges, Tunnels, Canals, and Causeways)
- BROAD
- Broadcasting (Television, Radio, and Internet)
- COMM
- Communications
- DIFR
- Disabling Injury Frequency Rate
- EAHOR
- Employer's Annual Hazardous Occurrence Report
- ENER
- Energy, Mining and Mineral Processing
- FEED
- Feed, Flour and Seed
- FIFR
- Fatal Injury Frequency Rate
- FTE
- Full-time Equivalent
- GRAIN
- Grain Handling and Grain Elevators
- INDG
- First Nations, Band Councils, and Indigenous Self-Governments (certain activities)
- LONG
- Longshoring, Stevedoring, Port, Harbour Operations and Pilotage
- PIPE
- Pipeline Transportation
- POST
- Postal Services and Postal Contractors
- PUBS
- Federal Public Services, Public Service Departments and Crown Corporations
- RAIL
- Rail Transportation
- ROAD
- Road Transportation
- WATER
- Water Transportation (Shipping and Ferries)
List of charts
- Chart 2.1: Numbers of fatal injuries by federally regulated industry, 2022 vs 2023
- Chart 2.2: Shares (%) of total disabling injuries vs total hours worked by federally regulated industry in 2023
- Chart 2.3: Disabling Injury Frequency Rates (DIFR) by federally regulated industry in 2023
- Chart 2.4 (a): Fatal Injury Frequency Rates (FIFR) by federally regulated industry in 2023
- Chart 2.4 (b): Ten-year Fatal Injury Frequency Rates (FIFR) by federally regulated industry in 2023
- Chart 3.1: Changes in the number of disabling injuries reported between 2022 and 2023 by federally regulated industry
- Chart 3.2: Changes (%) in disabling injuries and hours worked reported between 2022 and 2023 by federally regulated industry
- Chart 3.3 (a): Changes (%) in hours worked between 2019 and 2023 by federally regulated industry
- Chart 3.3 (b): Changes (%) in disabling injuries between 2019 and 2023 by federally regulated industry
- Chart 4.1 (a): Air Transportation DIFR, 2019 to 2023
- Chart 4.1 (b): Road Transportation DIFR, 2019 to 2023
- Chart 4.1 (c): Postal Services and Postal Contractors DIFR, 2019 to 2023
- Chart 4.1 (d): Federal Public Services, Public Service Departments and Crown Corporations DIFR, 2019 to 2023
- Chart 4.2 (a): Air Transportation DIFR by province and territory in 2023
- Chart 4.2 (b): Road Transportation DIFR by province and territory in 2023
- Chart 4.2 (c): Postal Services and Postal Contractors DIFR by province and territory in 2023
- Chart 4.2 (d): Longshoring, Stevedoring, Port, Harbour Operations and Pilotage DIFR by province and territory in 2023
Executive summary
The Labour Program of Employment and Social Development Canada (ESDC) publishes a report annually to provide aggregated statistics on disabling and fatal injuries occurring at work reported by industries within the federal jurisdiction. The primary data source for this report is the Employer's Annual Hazardous Occurrence Report (EAHOR), which federally regulated employers are required to submit to the Labour Program for each reporting year.
By providing an overview of the state of workplace safety across federally regulated industries, this report identifies both notable challenges and progress made toward making these industries safer. Historical data on all injury rates dating back to 2008 are available at the Government of Canada's Open Government Portal.
Key findings from the 2023 annual report
- Disabling work-related injuries increased in 2023. 18,796 disabling injuries were reported, marking an increase of 665 injuries from 2022 when 18,131 disabling injuries were reported.
- The number of reported fatal injuries also rose, from 67 in 2022 to 71 in 2023.
- The total number of disabling injuries in 2023 was lower compared to 2019 (the last reporting year before the COVID-19 global pandemic). 20,850 disabling injuries were reported in 2019, approximately 2,000 more injuries than in 2023.
- Economic activities within the federal jurisdiction have shown signs of post-pandemic recovery in 2023, surpassing pre-pandemic levels with an increase of approximately 200 million total hours worked compared to 2019.
- The extent of this recovery varies significantly among federally regulated industries. Total hours worked in 6 out of 16 industries are below their pre-pandemic values. These industries include:
- Interprovincial Infrastructure (Bridges, Tunnels, Canals, and Causeways)
- Broadcasting (Television, Radio, and Internet)
- Air Transportation
- Rail Transportation
- Longshoring, Stevedoring, Port, Harbour Operations and Pilotage
- Postal Services and Postal Contractors
- Nine industries showed noticeably improved safety performance in 2023 compared to 2019 based on a decrease in the number of disabling injuries reported, while 2 industries reported little change. In contrast, 5 industries reported worsening performance compared to the pre-pandemic era. These industries include:
- Air Transportation
- Communications
- First Nations, Band Councils, and Indigenous Self-Governments (certain activities)
- Pipeline Transportation
- Energy, Mining and Mineral Processing
- The Disabling Injury Frequency Rate (DIFR) - the number of disabling injuries per 1 million hours worked - for the federal jurisdiction slightly increased from 7.61 in 2022 to 7.77 in 2023 but still remained lower than in 2019 (9.39).
- The 2023 DIFR values for 4 industries were greater than the federal jurisdiction rate of 7.77:
- Air Transportation (21.38)
- Road Transportation (19.24)
- Postal Services and Postal Contractors (16.43)
- Longshoring, Stevedoring, Port, Harbour Operations and Pilotage (9.75)
- This is the first time that the Air Transportation industry has had the highest DIFR in the federal jurisdiction since 2008, the earliest year for which EAHOR open data is available on the Open Government Portal.
- Within these 4 industries, there is a prominent regional variance in the DIFR, demonstrating the diverse nature of workplace safety challenges across the provinces and territories.
- The Fatal Injury Frequency Rate (FIFR) - the number of fatal injuries per 1 billion hours worked - for the federal jurisdiction slightly increased from 28.01 in 2022 to 29.23 in 2023.
- The Grain Handling industry had the highest 2023 FIFR of 131.67, while reporting 2 fatal injuries.
- A new 10-year FIFR was produced for the 2023 annual report to address the volatility of the annual FIFR. This rate is calculated as the total number of fatal injuries reported for every 1 billion hours worked from 2014 to 2023. The addition of the 10-year FIFR improves the analysis of long-term fatal injury trends and allows for more comparability between industries. The 10-year FIFR for the federal jurisdiction for the period of 2014 to 2023 was 27.04.
- The Road Transportation industry had the highest 10-year FIFR (98.08), based on data from 2014 to 2023 that included 353 fatal injuries.
Introduction
Each year, the Labour Program of Employment and Social Development Canada (ESDC) publishes a report on work-related injuries in the federal jurisdiction. The report provides an update on the overall safety performance of workplaces across the federal jurisdiction. It analyses the data collected in the Employer's Annual Hazardous Occurrence Report (EAHOR), which is submitted by federally regulated employers to the Labour Program for each reporting year.
The 2023 edition comprises 5 sections:
Section 1 - About the data - outlines the data source and the employers and employees represented in this report.
Section 2 - Occupational injuries in federal jurisdiction industries in 2023 - analyses the prevalence of work-related injuries in the industries under federal jurisdiction for 2023, comparing it with 2022.
Section 3 - Impact of the scale of economic activity on work-related injuries - explores the relationship between changes in economic activity volume (measured in hours worked) and occurrences of injuries in federally regulated workplaces.
Section 4 - Tracking safety performance trends and exploring regional variations within industries - provides the findings on the safety performance of federally regulated industries over the past 5 years (2019 to 2023) and regional variations within industries, based on the Disabling Injury Frequency Rate (DIFR). This standardised safety metric measures the number of disabling and fatal injuries for every 1 million hours worked, facilitating meaningful comparisons across different time periods or between organisations with similar work environments. It offers insights into relative safety performance, enabling the identification of trends and improvements in occupational safety.
Section 5 - Moving forward - concludes the report, offering recommendations for potential steps to strengthen occupational safety performance monitoring and reporting for the federal jurisdiction.
The report also includes a list of abbreviations and a glossary that explains the definitions of injury rates and other relevant terms.
Section 1: About the data
The data presented in this publication originates from the Employer's Annual Hazardous Occurrence Report, submitted by federally regulated employers to the Labour Program for the 2023 reporting year. Data from previous years were used when analysing trends or making year-to-year comparisons.
Industries under federal jurisdiction
According to the Canada Labour Code (the Code), federal jurisdiction encompasses any work and/or undertaking or business that is within the legislative authority of the Parliament of Canada. This includes all work deemed to be for the common good of at least 2 provinces and outside the exclusive authority of provincial legislatures. Part II of the Code also applies to employers and employees covered under the Parliamentary Employment and Staff Relations Act, which includes Federal Public Services, Public Service Departments and Crown Corporations.
EAHOR submissions
The Occupational Health and Safety (OHS) Regulations under the Code require that employers subject to federal jurisdiction submit an EAHOR each year by March 1, covering the period from January 1 to December 31 of the preceding calendar year. In an EAHOR, employers are required to provide the following information and data:
- number of disabling injuries
- number of deaths
- number of minor injuries
- number of other hazardous occurrences
- total number of employees (in FTEs)
- number of office employees
- total number of hours worked
- workplace status (active/inactive)
- date status became inactive, if applicable
A disabling injury refers to an employment injury or an occupational disease that prevents an employee from reporting for work or from effectively performing their duties on any day after the injury or disease occurred. Any workplace injury or disease that results in an employee losing a body member or the ability to use a body member also qualifies as a disabling injury. A disabling injury could also be a workplace injury or disease that results in the permanent impairment of a body function of an employee.
It is important to note that EAHOR submissions only collect aggregate injury data and do not provide a breakdown of detailed types or severity of injuries. The information contained in this publication is based on what employers have reported to the Labour Program in their EAHOR submissions for calendar year 2023 and therefore may not have captured every injury in the federal jurisdiction.
As illustrated in Table 1.1 below, the data analysed in this report are collected from a total of 4,793 EAHOR submissions that meet the reporting requirements. Although not all federally regulated employers complied with their requirement to submit an EAHOR, this is an improvement from the nearly 4,500 reports included in the 2022 publication.
| Industry | EAHOR submissions in 2022 | EAHOR submissions in 2023 |
|---|---|---|
| AIRT | 610 | 708 |
| BANK | 56 | 64 |
| BRID | 6 | 7 |
| BROAD | 156 | 181 |
| COMM | 171 | 181 |
| ENER | 14 | 17 |
| FEED | 291 | 321 |
| GRAIN | 52 | 60 |
| INDG | 257 | 296 |
| LONG | 57 | 56 |
| PIPE | 17 | 19 |
| POST | 13 | 16 |
| PUBS | 209 | 199 |
| RAIL | 23 | 23 |
| ROAD | 2,401 | 2,507 |
| WATER | 126 | 138 |
| Canada | 4,459 | 4,793 |
The Road Transportation industry experienced the largest increase in the number of submissions, from 2,401 in 2022 to 2,507 in 2023. This was followed by the Air Transportation industry, which submitted 610 reports in 2022 and 708 reports in 2023. The only 2 industries that submitted fewer reports in 2023 than in 2022 were the Federal Public Service and the Longshoring industry. Since an organisation’s industry is determined by the nature of its activities in terms of products and services delivered, some Crown corporations are not classified under Federal Public Services, Public Service Departments and Crown Corporations. As an example, Canada Post is classified as a Crown corporation under the Postal Services industry due to the nature of its work.
A key factor that contributed to the increased number of submissions in 2023 was the enhancement of the EAHOR program awareness campaign for that year. This included improving awareness notifications on social media, enhancing online resources for the public, and concerted outreach efforts to inform federally regulated employers of their requirement to complete the EAHOR each year. As a result of these efforts, the criteria for what injuries qualify as disabling injuries became more available for employers, which reinforced the importance of submitting the EAHOR.
A larger number of submissions demonstrates that more employers are represented in the data, which helps ensure that the annual report's analysis accurately reflects the reality of the federal jurisdiction in terms of workplace safety. Table 1.2 shows that these submissions covered approximately 1.2 million full-time equivalent (FTE) employees under federal jurisdiction. The total economic activity in 2023, measured by total hours worked, was reported at around 2.4 billion hours.
Please note that percentage values in some charts and tables may not add up to 100% due to rounding.
| Employer size (number of FTEs) | EAHOR submissions | EAHOR submissions (%) | Total FTEs | Total FTEs (%) | Total hours worked | Total hours worked (%) |
|---|---|---|---|---|---|---|
| 1 to 99 | 3,997 | 83.4% | 91,292 | 7.4% | 189,313,853 | 7.8% |
| 100 to 499 | 579 | 12.1% | 119,650 | 9.7% | 243,086,925 | 10.0% |
| 500 and above | 217 | 4.5% | 1,026,088 | 82.9% | 1,996,852,381 | 82.2% |
| Total | 4,793 | 100.0% | 1,237,030 | 100.0% | 2,429,253,159 | 100.0% |
As in 2022, the majority of EAHOR submissions in 2023 were from employers with fewer than 100 FTEs. While these reports made up roughly 83% of total submissions, these employers reported only 7.4% of FTEs and 7.8% of hours worked.
The remaining approximately 16% of employers had 100 or more FTEs, representing 92.6% of the FTE population and accounting for 92.2% of economic activities under federal jurisdiction. The 217 largest employers (with 500 or more FTEs) reported the greatest share of FTEs and total hours worked, both at approximately 82%.
The data in Table 1.3 indicates that the smallest employers (1 to 9 FTEs) were the least likely to report any injuries in 2023, as 91.4% reported 0 injuries. One possible explanation is that an organisation having a small number of employees makes it statistically less likely that an injury will occur.
| Employer size (number of FTEs) | EAHOR submissions | EAHOR that reported 0 injuries | EAHOR that reported 0 injuries (%) | EAHOR that reported at least 1 injury | EAHOR that reported at least 1 injury (%) | Total disabling injuries reported | Total disabling injuries reported (%) |
|---|---|---|---|---|---|---|---|
| 1 to 9 | 1,577 | 1,442 | 91.4% | 135 | 8.6% | 41 | 0.2% |
| 10 to 49 | 1,838 | 1,089 | 59.2% | 749 | 40.8% | 507 | 2.7% |
| 50 to 99 | 419 | 92 | 22.0% | 327 | 78.0% | 1,047 | 5.6% |
| 100 to 249 | 160 | 20 | 12.5% | 140 | 87.5% | 1,157 | 6.2% |
| 250 to 499 | 582 | 183 | 31.4% | 399 | 68.6% | 623 | 3.3% |
| 500 and above | 217 | 17 | 7.8% | 200 | 92.2% | 15,421 | 82.0% |
| Total | 4,793 | 2,843 | 59.3% | 1,950 | 40.7% | 18,796 | 100.0% |
The reported number of disabling injuries is also positively correlated with the scale of economic activity, with large employers reporting most of the disabling injuries in 2023. 200 employers with 500 or more FTEs reported 15,421 disabling injuries, which accounted for 82% of all disabling injuries reported in 2023. It is important to note that the EAHOR data for 2023 shows significant variations in the number of disabling injuries reported by employers of similar sizes.
Section 2: Occupational injuries in federal jurisdiction industries in 2023
Key occupational injuries statistics
Both disabling injuries and hours worked rose in 2023. Federally regulated employers reported a total of 41,668 work-related injuries and approximately 2.4 billion hours worked by employees under federal jurisdiction. The injuries reported include 18,796 (45.1%) disabling injuries, 71 (0.2%) fatal injuries and 22,801 (54.7%) minor injuries.
Table 2.1 provides statistics for 2023 injuries and economic activity, measured by total hours worked, for each industry under federal jurisdiction.
| Industry | Disabling injuries | Fatal injuries | Minor injuries | Total hours worked | % of total disabling injuries |
|---|---|---|---|---|---|
| AIRT | 4,413 | 7 | 3,917 | 206,723,548 | 23.5% |
| BANK | 312 | 0 | 823 | 505,231,293 | 1.7% |
| BRID | 2 | 0 | 20 | 680,182 | 0.0% |
| BROAD | 151 | 0 | 169 | 45,248,554 | 0.8% |
| COMM | 1,041 | 4 | 1,144 | 159,456,884 | 5.5% |
| ENER | 43 | 0 | 37 | 13,546,506 | 0.2% |
| FEED | 149 | 0 | 426 | 19,255,959 | 0.8% |
| GRAIN | 95 | 2 | 140 | 15,189,324 | 0.5% |
| INDG | 119 | 4 | 786 | 46,229,371 | 0.6% |
| LONG | 289 | 1 | 810 | 29,739,254 | 1.5% |
| PIPE | 12 | 0 | 15 | 11,796,580 | 0.1% |
| POST | 1,514 | 2 | 982 | 92,297,280 | 8.1% |
| PUBS | 3,218 | 14 | 6,447 | 833,219,464 | 17.1% |
| RAIL | 459 | 2 | 212 | 67,302,508 | 2.4% |
| ROAD | 6,813 | 35 | 6,340 | 355,932,276 | 36.2% |
| WATER | 166 | 0 | 533 | 27,404,176 | 0.9% |
| Canada | 18,796 | 71 | 22,801 | 2,429,253,159 | 100.0% |
As shown in Table 2.1, the 5 industries that reported the largest shares of total disabling injuries in 2023 were:
- Road Transportation (6,813, 36.2%)
- Air Transportation (4,413, 23.5%)
- Federal Public Services, Public Service Departments and Crown Corporations (3,218, 17.1%)
- Postal Services and Postal Contractors (1,514, 8.1%)
- Communications (1,041, 5.5%)
Altogether, the number of disabling injuries reported in these 5 industries accounted for 16,999 or 90.4% of the total number of disabling injuries in the federal jurisdiction in 2023.
The 2023 data also reveals that 71 workers in the federal jurisdiction tragically lost their lives in a fatal injury at work. Although 35 of these fatal injuries occurred in the Road Transportation industry, there were 9 fewer fatal injuries in this industry compared to 2022. This was followed by the Federal Public Service, which reported 14 fatal injuries, up from 3 in 2022.
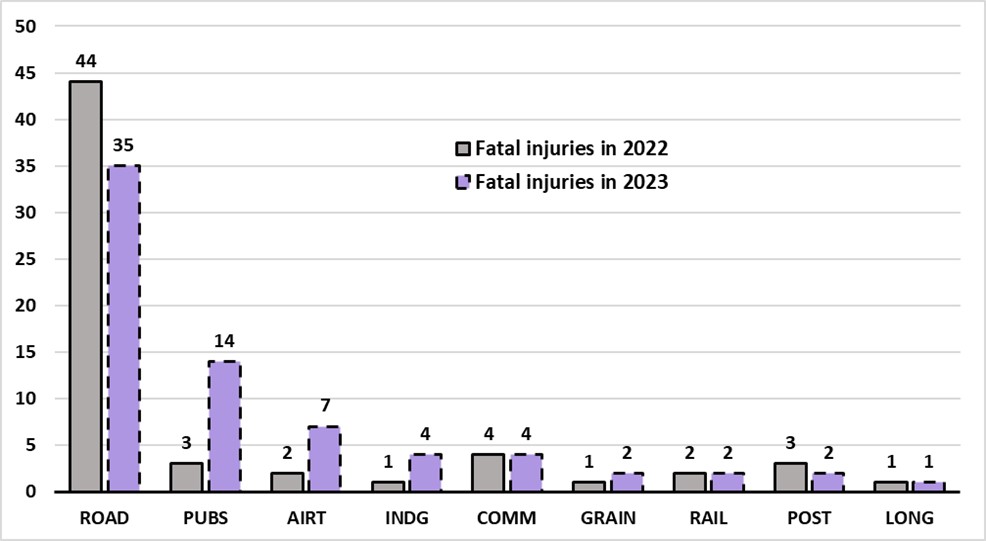
*In addition to the 71 fatal injuries reported on 2023 EAHOR submissions, 1 fatality related to harassment and violence was reported on a 2023 Employer's Annual Harassment and Violence Occurrence Report (EAHVOR) submission.
Chart 2.1 – Text description
| Industry | Fatal injuries in 2022 | Fatal injuries in 2023 |
|---|---|---|
| ROAD | 44 | 35 |
| PUBS | 3 | 14 |
| AIRT | 2 | 7 |
| INDG | 1 | 4 |
| COMM | 4 | 4 |
| GRAIN | 1 | 2 |
| RAIL | 2 | 2 |
| POST | 3 | 2 |
| LONG | 1 | 1 |
Reported disabling and fatal injuries both increased in 2023 compared to 2022. The number of disabling injuries increased from 18,131 in 2022 to 18,796 in 2023, a rise of 665 disabling injuries. Moreover, the number of fatal injuries increased from 67 in 2022 to 71 in 2023, an increase of 4 deaths.
Although reported disabling and fatal injuries increased from 2022 to 2023, it is less than the previous increase from 2021 to 2022. During that time, disabling injuries increased by 1,789, and fatal injuries by 23.
Meanwhile, economic activity in the federal jurisdiction, measured by total hours worked, increased by 37.4 million hours worked between 2022 and 2023.
Section 3 explores whether the reported number of injuries increased or decreased for each federally regulated industry, and to what extent changes in the number of injuries could be attributed to variations in economic activity.
A significant development in 2023 is that disabling injuries in the Air Transportation industry rose from 3,020 in 2022 to 4,413 in 2023. As shown in Table 2.2, disabling injuries in this industry have now surpassed the number reported in 2019, prior to the COVID-19 global pandemic. As a result, the industry's DIFR value is also greater than it was in 2019. In contrast, fewer fatal injuries were reported in this industry in 2023 than in 2019 (11 in 2019 compared to 7 in 2023).
| AIRT data | 2019 | 2020 | 2021 | 2022 | 2023 | Change from 2022 to 2023 |
|---|---|---|---|---|---|---|
| Hours worked (millions) | 228.7 | 133.2 | 133.4 | 173.9 | 206.7 | 18.9% |
| Disabling injuries | 3,511 | 1,775 | 2,143 | 3,020 | 4,413 | 46.1% |
| DIFR | 15.40 | 13.34 | 16.10 | 17.38 | 21.38 | 23.0% |
Assessing workplace safety performance for federally regulated industries
Chart 2.2 illustrates the shares (percentages) of total hours worked and total disabling injuries for each industry in the federal jurisdiction in 2023.
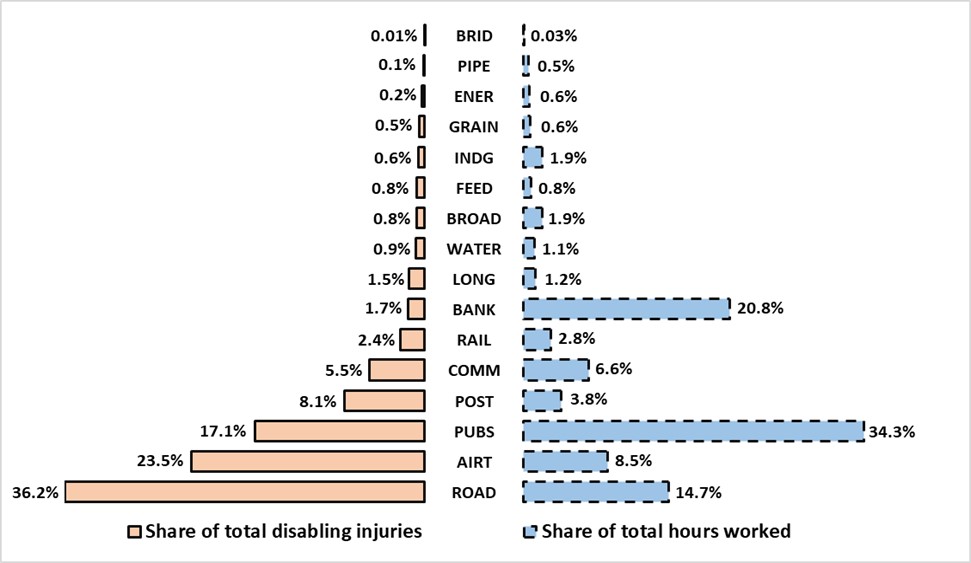
Chart 2.2 - Text description
| Industry | Share of total disabling injuries | Share of total hours worked |
|---|---|---|
| BRID | 0.01% | 0.03% |
| PIPE | 0.1% | 0.5% |
| ENER | 0.2% | 0.6% |
| GRAIN | 0.5% | 0.6% |
| INDG | 0.6% | 1.9% |
| FEED | 0.8% | 0.8% |
| BROAD | 0.8% | 1.9% |
| WATER | 0.9% | 1.1% |
| LONG | 1.5% | 1.2% |
| BANK | 1.7% | 20.8% |
| RAIL | 2.4% | 2.8% |
| COMM | 5.5% | 6.6% |
| POST | 8.1% | 3.8% |
| PUBS | 17.1% | 34.3% |
| AIRT | 23.5% | 8.5% |
| ROAD | 36.2% | 14.7% |
One method for identifying industries with a higher risk or prevalence of workplace injuries is by comparing their share of total disabling injuries to their share of total hours worked.
Industries with a disproportionately high share of disabling injuries relative to their share of total hours worked are likely at greater risk of workplace accidents. Such industries may require targeted interventions to enhance workplace safety.
One example of this is the Road Transportation industry. In 2023, its share of total disabling injuries reported in the federal jurisdiction was 36.2% while its share of total hours worked was only 14.7%. This indicates that its share of workplace injuries was approximately 2.5 times greater than its share of economic activity. A similar case is the Air Transportation industry. Its 2023 share of total disabling injuries was 23.5%, nearly 3 times greater than its 8.5% share of total hours worked. Conversely, the Banking industry's share of total disabling injuries was much smaller than its share of total hours worked (1.7% versus 20.8%). This suggests that Banking workplaces have a lower prevalence of workplace injuries compared to other industries' workplaces.
Using the ratio between the share of total disabling injuries and the share of total hours worked, we can identify which industries have the highest risk or prevalence of workplace injuries among the federally regulated industries, based on which ones have the highest ratio.
| Industry | Share of total disabling injuries (%) | Share of total hours worked (%) | Ratio |
|---|---|---|---|
| AIRT | 23.5% | 8.5% | 2.8 |
| ROAD | 36.2% | 14.7% | 2.5 |
| POST | 8.1% | 3.8% | 2.1 |
| LONG | 1.5% | 1.2% | 1.3 |
| FEED | 0.8% | 0.8% | 1.0 |
| RAIL | 2.4% | 2.8% | 0.9 |
| COMM | 5.5% | 6.6% | 0.8 |
| GRAIN | 0.5% | 0.6% | 0.8 |
| WATER | 0.9% | 1.1% | 0.8 |
| PUBS | 17.1% | 34.3% | 0.5 |
| BROAD | 0.8% | 1.9% | 0.4 |
| ENER | 0.2% | 0.6% | 0.4 |
| BRID | 0.01% | 0.03% | 0.4 |
| INDG | 0.6% | 1.9% | 0.3 |
| PIPE | 0.1% | 0.5% | 0.1 |
| BANK | 1.7% | 20.8% | 0.1 |
Disabling Injury Frequency Rate
In the realm of workplace safety, the Disabling Injury Frequency Rate (DIFR) serves as a standard safety metric, normalising the number of disabling injuries for every 1 million hours worked. By factoring in size differences among organisations, the DIFR is useful for comparing risks and safety performance among organisations or industries of various sizes. However, caution is needed when comparing industries with distinct work environments, as disabling injuries can vary in severity.
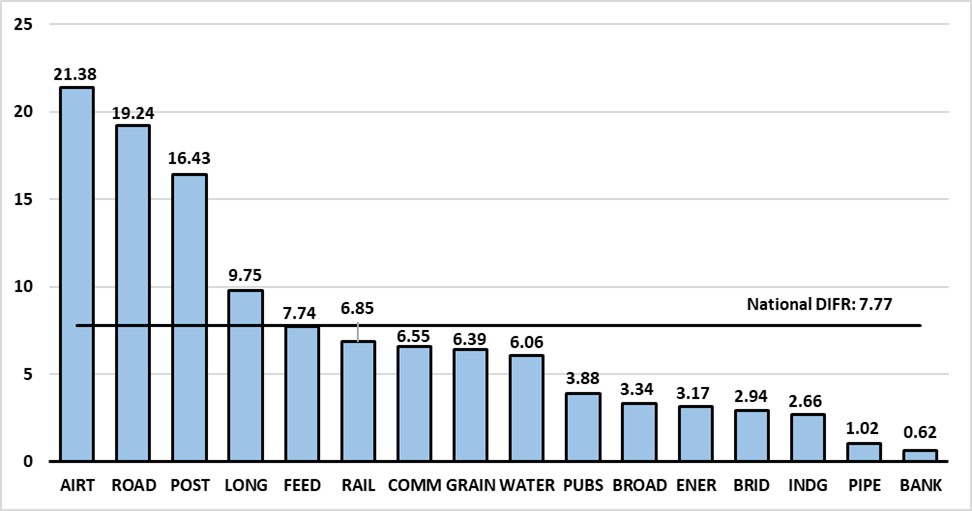
Chart 2.3 - Text description
| Industry | Disabling Injury Frequency Rate (DIFR) |
|---|---|
| AIRT | 21.38 |
| ROAD | 19.24 |
| POST | 16.43 |
| LONG | 9.75 |
| FEED | 7.74 |
| RAIL | 6.85 |
| COMM | 6.55 |
| GRAIN | 6.39 |
| WATER | 6.06 |
| PUBS | 3.88 |
| BROAD | 3.34 |
| ENER | 3.17 |
| BRID | 2.94 |
| INDG | 2.66 |
| PIPE | 1.02 |
| BANK | 0.62 |
| National DIFR | 7.77 |
As illustrated in Chart 2.3, the following 4 industries exhibited the highest DIFR values, which surpassed the national DIFR for the federal jurisdiction (7.77). This suggests that these 4 industries likely faced the highest safety risks among the industries under federal jurisdiction:
- Air Transportation (21.38)
- Road Transportation (19.24)
- Postal Services and Postal Contractors (16.43)
- Longshoring, Stevedoring, Port, Harbour Operations and Pilotage (9.75)
Of these 4 industries, only Air Transportation's DIFR value increased from 2022 to 2023. This is the first time that the Air Transportation industry has had the highest DIFR in the federal jurisdiction since as far back as 2008, the earliest year for which EAHOR open data is available on the Open Government Portal. It should be noted that Air Transportation's DIFR only indicates a high risk of injuries occurring and does not reveal how severe those injuries are compared to injuries in other industries.
Fatal Injury Frequency Rate
The Fatal Injury Frequency Rate (FIFR), another safety metric that is used to assess the risk of fatal injuries occurring at work, is calculated as the total number of fatal injuries reported for every 1 billion hours worked. Nine industries reported fatal injuries in 2023, and their FIFR values are compared in Chart 2.4 (a).
.jpg)
Chart 2.4 (a) - Text description
| Industry | Fatal Injury Frequency Rate (FIFR) |
|---|---|
| GRAIN | 131.67 |
| ROAD | 98.33 |
| INDG | 86.53 |
| AIRT | 33.86 |
| LONG | 33.63 |
| RAIL | 29.72 |
| COMM | 25.09 |
| POST | 21.67 |
| PUBS | 16.80 |
| National FIFR | 29.23 |
Chart 2.4 (a) shows that 6 industries had a higher FIFR value than the national FIFR for the federal jurisdiction (29.23):
- Grain Handling and Grain Elevators (131.67)
- Road Transportation (98.33)
- First Nations, Band Councils, and Indigenous Self-Governments (certain activities) (86.53)
- Air Transportation (33.86)
- Longshoring, Stevedoring, Port, Harbour Operations and Pilotage (33.63)
- Rail Transportation (29.72)
The fact that the FIFR values for these industries are greater than the national FIFR suggests that employees in those industries faced a higher risk of fatal injuries compared to employees in these 3 industries below the FIFR for the federal jurisdiction:
- Communications (25.09)
- Postal Services and Postal Contractors (21.67)
- Federal Public Services, Public Service Departments and Crown Corporations (16.80)
The Grain Handling industry had the highest 2023 FIFR of 131.67, while reporting 2 fatal injuries. In 2022, this industry had an FIFR of 73.86 with 1 fatal injury.
It is important to note that applying the FIFR to industries that report significantly less than a billion hours worked in a single year can lead to unreliable results due to the limitations of a short timeframe. The Grain Handling industry is an example of this challenge. As shown in Table 2.4 , this industry's annual FIFR has varied significantly over the past 10 years, from 0 to a high of nearly 132. This fluctuation is due to the industry's annual reported fatalities ranging from 0 to 2 from 2014 to 2023, while typically reporting between 1.4 and 1.5% of 1 billion hours worked. This variability makes the FIFR an unstable indicator for this industry.
| Year | Fatal injuries | Hours worked | % of a billion hours | FIFR |
|---|---|---|---|---|
| 2023 | 2 | 15,189,324 | 1.5% | 131.67 |
| 2022 | 1 | 13,725,894 | 1.4% | 72.85 |
| 2021 | 0 | 14,422,068 | 1.4% | 0.00 |
| 2020 | 0 | 14,807,711 | 1.5% | 0.00 |
| 2019 | 0 | 14,999,695 | 1.5% | 0.00 |
| 2018 | 1 | 14,103,327 | 1.4% | 70.91 |
| 2017 | 1 | 14,815,611 | 1.5% | 67.50 |
| 2016 | 0 | 15,014,798 | 1.5% | 0.00 |
| 2015 | 0 | 14,756,089 | 1.5% | 0.00 |
| 2014 | 1 | 10,212,526 | 1.0% | 97.92 |
| 2014 to 2023 | 6 | 142,047,043 | 14.2% | 42.24 |
In contrast, a 10-year FIFR calculated over a longer timeframe provides a more stable and accurate safety metric for smaller industries like Grain Handling that report less than 5% of a billion hours worked. A 10-year FIFR offers a significantly improved estimate of the true risk of fatal injuries in these industries. A 10-year FIFR can also provide reliable estimates for a large-scale sector like the Federal Public Service (which has reported an average of 70% of 1 billion hours from 2014 to 2023) and for the entire federal jurisdiction (where the reported average is 2.3 billion hours annually).
Chart 2.4 (b) compares the 10-year FIFR values for each industry in the federal jurisdiction.
.jpg)
Chart 2.4 (b) - Text description
| Industry | 10-year Fatal Injury Frequency Rate (FIFR) |
|---|---|
| ROAD | 98.08 |
| INDG | 60.28 |
| FEED | 45.64 |
| GRAIN | 42.24 |
| RAIL | 32.06 |
| LONG | 31.33 |
| AIRT | 29.53 |
| BROAD | 28.89 |
| WATER | 25.88 |
| POST | 15.29 |
| PIPE | 14.08 |
| PUBS | 10.04 |
| COMM | 8.86 |
| BANK | 1.70 |
| ENER | 0.00 |
| BRID | 0.00 |
| National 10-year FIFR | 27.04 |
As Chart 2.4 (b) illustrates, 8 industries had a higher 10-year FIFR value than the federal jurisdiction (27.04). This suggests that employees in these industries faced a higher risk of fatal injuries from 2014 to 2023 compared to employees in the other 8 industries that are below the 10-year FIFR for the federal jurisdiction. The industries with a 10-year FIFR above the national rate for the federal jurisdiction include:
- Road Transportation (98.08)
- First Nations, Band Councils, and Indigenous Self-Governments (certain activities) (60.28)
- Feed, Flour and Seed (45.64)
- Grain Handling and Grain Elevators (42.24)
- Rail Transportation (32.06)
- Longshoring, Stevedoring, Port, Harbour Operations and Pilotage (31.33)
- Air Transportation (29.53)
- Broadcasting (Television, Radio, and Internet) (28.89)
Based on this alternative approach to the FIFR, the Road Transportation industry has the highest FIFR (98.08) based on the 353 fatal injuries and 3.6 billion hours worked it has reported from 2014 to 2023. Notably, the Energy, Mining and Mineral Processing, and Interprovincial Infrastructure industries have reported no fatal injuries over the 10-year period, causing their FIFR values to be 0.
Section 3: Impact of the scale of economic activity on work-related injuries
Comparison between 2022 and 2023
This section examines potential connections between work-related injuries and total hours worked. One commonly considered possibility is that more hours worked at a workplace or organisation may lead to an increase in employees' exposure to safety risks, which in turn may cause an increase in injuries.
Table 3.1 provides industry-specific statistics on total hours worked (in millions of hours) and the number of disabling injuries for both 2022 and 2023. The table also presents percentage changes in these 2 statistics between the 2 years.
As previously mentioned, disabling injuries increased in the federal jurisdiction in 2023 compared to the previous reporting year. The data presented in Table 3.1 aims to identify which industries reported an increase in disabling injuries and determine whether this was proportional to the change in their work activity, measured in hours worked.
| Industry | Total hours worked (millions) in 2022 | Total hours worked (millions) in 2023 | Total disabling injuries in 2022 | Total disabling injuries in 2023 | Change in total hours worked from 2022 to 2023 | Change in disabling injuries from 2022 to 2023 |
|---|---|---|---|---|---|---|
| PUBS | 805.1 | 833.2 | 3,840 | 3,218 | 3.5% | -16.2% |
| BANK | 540.0 | 505.2 | 331 | 312 | -6.4% | -5.7% |
| ROAD | 340.4 | 355.9 | 6,726 | 6,813 | 4.6% | 1.3% |
| AIRT | 173.9 | 206.7 | 3,020 | 4,413 | 18.9% | 46.1% |
| COMM | 178.3 | 159.5 | 946 | 1,041 | -10.5% | 10.0% |
| POST | 92.9 | 92.3 | 1,725 | 1,514 | -0.7% | -12.2% |
| RAIL | 61.7 | 67.3 | 330 | 459 | 9.0% | 39.1% |
| INDG | 34.5 | 46.2 | 91 | 119 | 33.8% | 30.8% |
| BROAD | 54.1 | 45.2 | 194 | 151 | -16.4% | -22.2% |
| LONG | 30.8 | 29.7 | 459 | 289 | -3.5% | -37.0% |
| WATER | 24.2 | 27.4 | 179 | 166 | 13.1% | -7.3% |
| FEED | 17.0 | 19.3 | 159 | 149 | 13.0% | -6.3% |
| GRAIN | 13.5 | 15.2 | 77 | 95 | 12.2% | 23.4% |
| ENER | 13.5 | 13.5 | 43 | 43 | 0.2% | 0.0% |
| PIPE | 11.3 | 11.8 | 10 | 12 | 4.8% | 20.0% |
| BRID | 0.5 | 0.7 | 1 | 2 | 25.6% | 100.0% |
| Canada | 2,391.9 | 2,429.3 | 18,131 | 18,796 | 2.6% | 3.7% |
Chart 3.1 visually depicts which industries reported an increase in disabling injuries and which ones reported a decrease between 2022 and 2023.
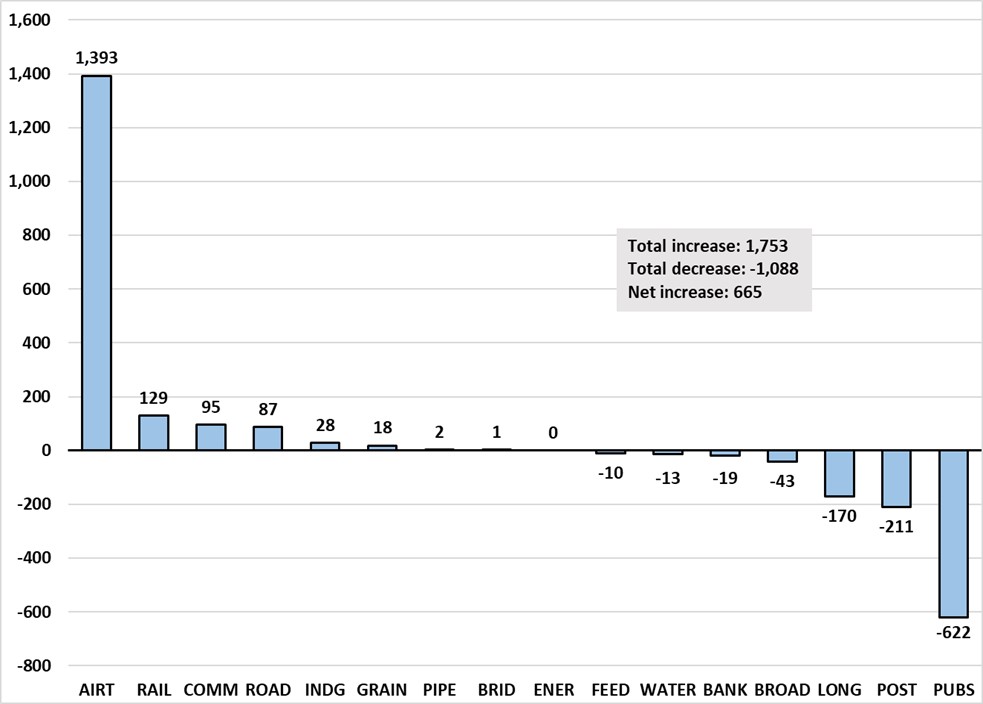
Chart 3.1 - Text description
| Industry | Change in disabling injuries between 2022 and 2023 |
|---|---|
| AIRT | 1,393 |
| RAIL | 129 |
| COMM | 95 |
| ROAD | 87 |
| INDG | 28 |
| GRAIN | 18 |
| PIPE | 2 |
| BRID | 1 |
| ENER | 0 |
| FEED | -10 |
| WATER | -13 |
| BANK | -19 |
| BROAD | -43 |
| LONG | -170 |
| POST | -211 |
| PUBS | -622 |
| Total increase | 1,753 |
| Total decrease | -1,088 |
| Net increase | 665 |
As illustrated in Chart 3.1, the net increase of 665 disabling injuries reported in the federal jurisdiction in 2023 can be overwhelmingly attributed to a significant increase in disabling injuries in the Air Transportation industry. Moreover, the decrease in disabling injuries observed in the Federal Public Service and industries such as Postal Services and Longshoring, along with marginal decreases in several other industries, partially offset the overall increase of 1,753 disabling injuries.
Chart 3.2 presents the percentage changes in total hours worked and the number of disabling injuries reported between 2022 and 2023 for each industry in the federal jurisdiction. The chart shows that while there appears to be correlation between the number of work injuries and the number of hours worked in most industries, the relationship between these statistics is more complex in others.
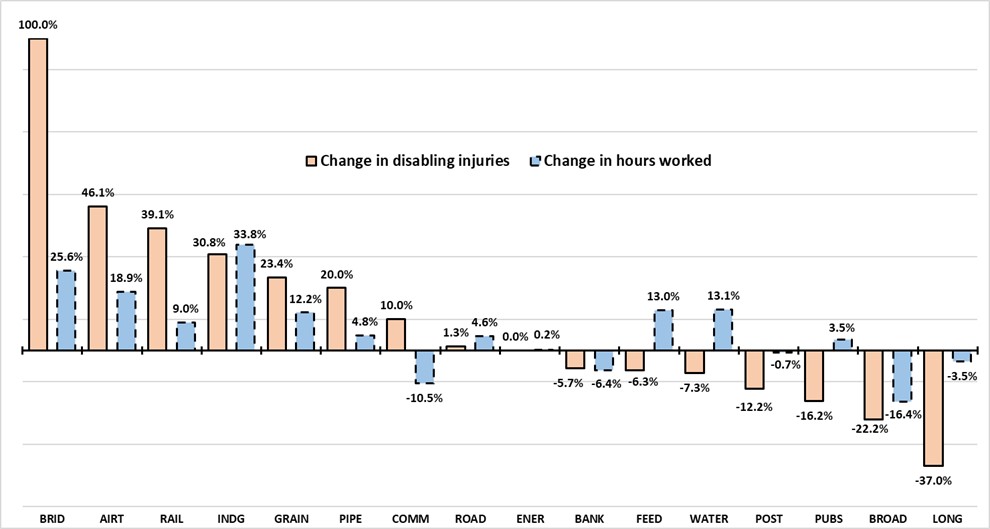
Chart 3.2 - Text description
| Industry | Change in disabling injuries between 2022 and 2023 | Change in hours worked between 2022 and 2023 |
|---|---|---|
| BRID | 100.0% | 25.6% |
| AIRT | 46.1% | 18.9% |
| RAIL | 39.1% | 9.0% |
| INDG | 30.8% | 33.8% |
| GRAIN | 23.4% | 12.2% |
| PIPE | 20.0% | 4.8% |
| COMM | 10.0% | -10.5% |
| ROAD | 1.3% | 4.6% |
| ENER | 0.0% | 0.2% |
| BANK | -5.7% | -6.4% |
| FEED | -6.3% | 13.0% |
| WATER | -7.3% | 13.1% |
| POST | -12.2% | -0.7% |
| PUBS | -16.2% | 3.5% |
| BROAD | -22.2% | -16.4% |
| LONG | -37.0% | -3.5% |
The data for 2023 show some cases where a strong positive correlation between disabling injuries and hours worked was exhibited, indicating that as hours worked increase or decrease, injuries tend to follow a similar pattern. However, the impact of changes in economic activities varied among different industries.
For example, in the First Nations band councils and Indigenous self-governments industry, both hours worked and disabling injuries increased by nearly the same percentage (33.8% and 30.8% respectively). A similar trend was observed in the Banking industry, where both statistics declined at comparable rates (-6.4% and -5.7% respectively).
In contrast, other industries demonstrated weaker correlations, with significant discrepancies between changes in hours worked and changes in disabling injuries. In the Air Transportation industry, disabling injuries rose by 46.1% despite an 18.9% increase in hours worked. Similarly, in Interprovincial Infrastructure, hours worked grew by 25.6% while disabling injuries doubled - though this increase was due to just 1 additional reported disabling injury (from 1 in 2022 to 2 in 2023).
Some industries displayed an inverse relationship, where 1 metric rose while the other fell. For example, in Communications, hours worked declined while disabling injuries increased. Meanwhile in the Federal Public Service and the Feed, Flour and Seed, and Water Transportation industries, hours worked increased, but disabling injuries decreased.
Overall, the relationship between workplace injuries and the amount of time spent working is complex and can vary across industries. Changes in the number of workplace injuries can result from multiple factors beyond fluctuations in the scale of economic activity. While correlations may exist, these 2 metrics alone do not fully explain trends in workplace injuries. Other factors, such as regulatory compliance, workplace safety practices, job complexity, fatigue and stress, technology and automation, and training and skill level can significantly impact the number of workplace injuries. Organisations with strong safety cultures and rigorous adherence to workplace health regulations often report fewer workplace injuries, regardless of the number of hours worked. Adequate training, proper and effective safety protocols, and the use of protective equipment further contribute to a safer work environment.
Comparison between 2019 and 2023
This part of Section 3 explores how economic activity in the federal jurisdiction has changed compared to 2019, the year prior to the COVID-19 global pandemic. It also analyses the possible impact of the changes observed on workplace safety performance. EAHOR data changed significantly during the height of the pandemic from 2020 to 2022, due to federally regulated employers reporting significant decreases in injuries and economic activity. This is why comparing the 2019 and 2023 EAHOR data is an efficient way of analysing the long-term impact of the pandemic on the Canadian federal jurisdiction. However, it should be noted that not all EAHOR data changes between 2019 and 2023 can be attributed to the pandemic.
Table 3.2 presents the statistics and percentage changes in total hours worked and the number of disabling injuries reported between 2019 and 2023 for each federally regulated industry and the entire federal jurisdiction.
| Industry | Total hours worked (millions) in 2019 | Total hours worked (millions) in 2023 | Total disabling injuries in 2019 | Total disabling injuries in 2023 | Change in total hours worked between 2019 and 2023 | Change in disabling injuries between 2019 and 2023 |
|---|---|---|---|---|---|---|
| PUBS | 691.4 | 833.2 | 3,725 | 3,218 | 20.5% | -13.6% |
| BANK | 455.5 | 505.2 | 822 | 312 | 10.9% | -62.0% |
| ROAD | 327.6 | 355.9 | 6,908 | 6813 | 8.6% | -1.4% |
| AIRT | 228.7 | 206.7 | 3511 | 4,413 | -9.6% | 25.7% |
| COMM | 158.9 | 159.5 | 801 | 1041 | 0.3% | 30.0% |
| POST | 92.7 | 92.3 | 2,990 | 1514 | -0.4% | -49.4% |
| RAIL | 69.7 | 67.3 | 726 | 459 | -3.4% | -36.8% |
| INDG | 37.9 | 46.2 | 90 | 119 | 21.9% | 32.2% |
| BROAD | 55.7 | 45.2 | 325 | 151 | -18.8% | -53.5% |
| LONG | 30.7 | 29.7 | 342 | 289 | -3.2% | -15.5% |
| WATER | 26.7 | 27.4 | 269 | 166 | 2.6% | -38.3% |
| FEED | 18.5 | 19.3 | 223 | 149 | 4.0% | -33.2% |
| GRAIN | 15.0 | 15.2 | 92 | 95 | 1.3% | 3.3% |
| ENER | 5.7 | 13.5 | 14 | 43 | 138.6% | 207.1% |
| PIPE | 11.1 | 11.8 | 8 | 12 | 6.7% | 50.0% |
| BRID | 0.8 | 0.7 | 4 | 2 | -19.1% | -50.0% |
| Canada | 2,226.6 | 2,429.3 | 20,850 | 18,796 | 9.1% | -9.9% |
As Table 3.2 demonstrates, while the federal jurisdiction as a whole appears to have recovered and begun to surpass its pre-pandemic scale of economic activity (with a 9.1% increase in total hours worked compared to 2019), the extent of this recovery varies significantly among federally regulated industries.
The percentage changes in total hours worked between 2019 and 2023 have been used to describe the level of economic recovery for each industry using the following thresholds:
- Surpassed pre-pandemic levels: Above +5% change (Yellow in Chart 3.3 (a))
- Recovered or almost recovered to pre-pandemic levels: Between -5% and +5% change (Orange in Chart 3.3 (a))
- Not quite recovered to pre-pandemic levels: Between -5% and -10% change (Blue in Chart 3.3 (a))
- Not yet recovered to pre-pandemic levels: Below -10% change (Grey in Chart 3.3 (a))
.jpg)
*ENER is removed from this chart due to its percentage change being significantly larger than the other industries (138.6%).
Chart 3.3 (a) - Text description
| Industry | Change in hours worked between 2019 and 2023 |
|---|---|
| BRID | -19.1% |
| BROAD | -18.8% |
| AIRT | -9.6% |
| RAIL | -3.4% |
| LONG | -3.2% |
| POST | -0.4% |
| COMM | 0.3% |
| GRAIN | 1.3% |
| WATER | 2.6% |
| FEED | 4.0% |
| PIPE | 6.7% |
| ROAD | 8.6% |
| BANK | 10.9% |
| PUBS | 20.5% |
| INDG | 21.9% |
For comparing workplace safety performance between 2019 and 2023, a similar scale of change scores for thresholds can be applied, measured by the percentage change in the number of disabling injuries between the 2 years:
- Safety performance below pre-pandemic levels: Above +5% change (Grey in Chart 3.3 (b))
- Safety performance as good as pre-pandemic levels: Between -5% and +5% change (Orange in Chart 3.3 (b))
- Safety performance above pre-pandemic levels: Below -5% change (Green in Chart 3.3 (b))
Based on these criteria and the data from Table 3.2, with a change of -9.9% in disabling injuries, the federal jurisdiction overall has experienced a significant improvement in safety performance compared to the pre-pandemic era. However, considerable variations exist among federally regulated industries as demonstrated in Chart 3.3 (b).
.jpg)
*ENER is removed from this chart due to its percentage change being significantly larger than the other industries (207.1%).
Chart 3.3 (b) - Text description
| Industry | Change in disabling injuries between 2019 and 2023 |
|---|---|
| BANK | -62.0% |
| BROAD | -53.5% |
| BRID | -50.0% |
| POST | -49.4% |
| WATER | -38.3% |
| RAIL | -36.8% |
| FEED | -33.2% |
| LONG | -15.5% |
| PUBS | -13.6% |
| ROAD | -1.4% |
| GRAIN | 3.3% |
| AIRT | 25.7% |
| COMM | 30.0% |
| INDG | 32.2% |
| PIPE | 50.0% |
According to the previous 2 charts, the scale of economic activity in 5 industries expanded beyond pre-pandemic levels based on changes in total hours worked from 2019 to 2023. This increase in economic activity may have contributed to safety performance falling below the pre-pandemic level for 3 industries:
- First Nations band councils and Indigenous self-governments (certain activities)
- Pipeline Transportation
- Energy, Mining and Mineral Processing
Although economic activity in the Air Transportation industry has not yet recovered to its pre-pandemic level based on hours worked, its safety performance appears to have worsened based on the increase of disabling injuries compared to 2019. Similarly, although the number of hours worked in the Communications industry in 2023 is nearly equal to the amount worked in 2019, disabling injuries in this industry have risen 30% since then.
It is essential to exercise caution when interpreting the findings for industries whose economic activity has not yet fully recovered from the impact of the COVID-19 global pandemic or has surpassed their pre-pandemic level. The current performance of these industries could be temporary due to business contraction or expansion, which warrants ongoing monitoring. While the pandemic is over, there are enduring operational challenges as businesses adjust to new economic realities.
Section 4: Tracking safety performance trends and exploring regional variations within industries
As stated previously, the Disabling Injury Frequency Rate (DIFR) serves as an efficient metric for assessing workplace safety, which enables comparisons across different organisations and time periods. In the first part of this section, DIFR values are utilised to analyse long-term safety trends for federally regulated industries and explore variations in safety performance across these industries.
Part 2 of this section delves into the regional variations in safety performances that may exist within the industries that have DIFR values above the federal jurisdiction rate. This information can be potentially helpful in identifying where to focus efforts to mitigate workplace safety risks and reduce work-related injuries.
Tracking safety trends for federally regulated industries from 2019 to 2023
Safety trend data from 2019 to 2023 are analysed and presented for the following 4 industries, which reported 84.9% of all disabling injuries in the federal jurisdiction in 2023: Air Transportation, Road Transportation, Postal Services, and the Federal Public Service.
Air Transportation
The Air Transportation industry had a DIFR of 21.38 in 2023, which was the highest rate in the federal jurisdiction. This was an increase from its 2022 rate of 17.38, which was the third-highest rate for a federally regulated industry that year. Among the 4 industries that reported the largest shares of disabling injuries in 2023, Air Transportation is the only one whose DIFR increased from its 2022 value. This notable increase in DIFR is due to reported disabling injuries in this industry increasing by 46.1%, while reported hours worked increased by only 18.9%. The industry reported 4,413 disabling injuries in 2023, which accounted for 23.5% of all disabling injuries in the federal jurisdiction that year. This was the second largest share after the Road Transportation industry. Chart 4.1 (a) illustrates this industry's DIFR variations over the past 5 years from 2019 to 2023.
.jpg)
Chart 4.1 (a) - Text description
| Year | Disabling Injury Frequency Rate (DIFR) |
|---|---|
| 2019 | 15.40 |
| 2020 | 13.34 |
| 2021 | 16.10 |
| 2022 | 17.38 |
| 2023 | 21.38 |
The chart indicates that there was a notable decrease in the DIFR from 2019 to 2020, likely influenced by business contraction due to the COVID-19 global pandemic. However, in 2021 there was a significant increase, reaching a DIFR slightly higher than 2019. This coincides with the gradual post-pandemic business recovery. In 2023, the DIFR for the Air Transportation industry rose further, continuing to surpass the pre-pandemic rate. The data suggest an upward DIFR trend that may warrant closer monitoring of this industry's safety performance.
Road Transportation
The Road Transportation industry had a DIFR of 19.24 in 2023, the second highest within the federal jurisdiction. It also reported 6,813 disabling injuries, which amounted to 36.2% of all disabling injuries in the federal jurisdiction and the largest share of any industry. Chart 4.1 (b) displays the variations in Road Transportation's DIFR values from 2019 to 2023.
.jpg)
Chart 4.1 (b) - Text description
| Year | Disabling Injury Frequency Rate (DIFR) |
|---|---|
| 2019 | 21.20 |
| 2020 | 17.88 |
| 2021 | 18.67 |
| 2022 | 19.89 |
| 2023 | 19.24 |
As the chart demonstrates, there was a notable decrease in the DIFR for 2020. The subsequent years, 2021 and 2022, then show slight increases in the DIFR compared to the lowest value in 2020. The data demonstrate a slight fluctuating trend in the Road Transportation industry's DIFR values during the 5-year timeframe. This possibly shows the impact of the COVID-19 global pandemic and subsequent business recovery.
Postal Services and Postal Contractors
The Postal Services industry had a DIFR of 16.43 in 2023, the third highest DIFR within the federal jurisdiction. This industry's DIFR value decreased from 18.60 in 2022, due to disabling injuries decreasing in 2023 while hours worked remained relatively stable.
Chart 4.1 (c) presents the variations in the DIFR over the 5-year period between 2019 and 2023 for the Postal Services industry.
.jpg)
Chart 4.1 (c) - Text description
| Year | Disabling Injury Frequency Rate (DIFR) |
|---|---|
| 2019 | 32.26 |
| 2020 | 21.29 |
| 2021 | 21.25 |
| 2022 | 18.60 |
| 2023 | 16.43 |
The trend depicted above indicates a significant decrease in the DIFR from 32.26 in 2019 to 16.43 in 2023, suggesting that workplace safety has been improving within this industry. The DIFR decrease from 32.26 in 2019 to 21.29 in 2020 is notable and may reflect the impact of the COVID-19 global pandemic. Because the DIFR for this industry continues to decrease post-pandemic, it suggests a positive trend in improving safety and reducing disabling injuries during that period.
Federal Public Services, Public Service Departments and Crown Corporations
The Federal Public Service had a DIFR of 3.88 in 2023, after having a DIFR of 4.77 in 2022. This decrease in DIFR could potentially indicate that work environments in this sector are becoming safer. A key factor in this decrease is that this sector reported fewer injuries in 2023 than in 2022.
The data illustrated in Chart 4.1 (d) indicate that this sector had a notable DIFR decrease in 2020 and another decrease in 2021. This decline was likely influenced by the impact of telework arrangements due to the COVID-19 global pandemic. However, in 2022, the DIFR increased compared to its 2021 value.
.jpg)
Chart 4.1 (d) - Text description
| Year | Disabling Injury Frequency Rate (DIFR) |
|---|---|
| 2019 | 5.39 |
| 2020 | 3.95 |
| 2021 | 3.49 |
| 2022 | 4.77 |
| 2023 | 3.88 |
During the pandemic, the Federal Public Service expanded its services to meet the challenges arising from the health crisis, rather than experiencing business contraction like other federally regulated industries. As of 2023, the sector reported an increase of approximately 141 million total hours worked compared to 2019.
Overall, the data suggest a marginal fluctuating trend in the sector's DIFR between 2019 and 2023. The post-pandemic decrease in DIFR and disabling injuries despite hours worked increasing suggests that the sector as a whole is growing safer.
Exploring variations in regional safety performance within industries
Employers within federally regulated industries are located throughout Canada. Like many countries, Canadian provinces and territories may exhibit their own unique as well as shared occupational health and safety risks. These regional characteristics contribute to the diverse array of factors that can lead to workplace injuries. While EAHOR, as previously noted, does not gather data on local characteristics, analysing regional differences in safety performance can help shed light on the underlying causes of hazardous incidents.
Moreover, understanding these regional variations can aid in the identification of employers with better safety performance. The experiences and strategies employed by these organisations in managing safety risks can serve as best practices, offering valuable lessons to other employers aiming to enhance their safety records.
This part of Section 4 presents regional variations in DIFR values for several industries, including the Air Transportation, Road Transportation, Postal Services, and Longshoring industries. These 4 industries had a DIFR at the national level that was greater than 7.77, the DIFR for the entire federal jurisdiction.
Air Transportation
The Air Transportation industry had a DIFR of 17.38 at the national level in 2022, which increased to 21.38 in 2023. This was the highest industrial DIFR in the federal jurisdiction. Three provinces and 1 territory had a DIFR above the industry's rate at the national level.
| Region | DIFR | Disabling injuries | Hours worked |
|---|---|---|---|
| Ontario | 27.59 | 1,883 | 68,319,000 |
| Nunavut | 26.22 | 35 | 1,334,816 |
| Quebec | 24.12 | 910 | 37,766,203 |
| British Columbia | 21.44 | 693 | 32,502,388 |
.jpg)
Chart 4.2 (a) - Text description
| Region | Disabling Injury Frequency Rate (DIFR) |
|---|---|
| Ont. | 27.59 |
| Nvt. | 26.22 |
| Que. | 24.12 |
| B.C. | 21.44 |
| Alta. | 17.77 |
| N.S. | 12.39 |
| Sask. | 11.20 |
| Man. | 9.85 |
| N.L. | 8.71 |
| N.W.T. | 7.79 |
| Y.T. | 5.52 |
| N.B. | 5.07 |
| P.E.I. | 0.86 |
| National Air Transportation DIFR | 21.38 |
As depicted in Chart 4.2 (a), Air Transportation employers across provinces and territories displayed significant variations in their safety performance measured by DIFR, ranging from the lowest regional rate of 0.86 (P.E.I.) to the highest regional rate of 27.59 (Ontario).
Road Transportation
The Road Transportation industry had a DIFR of 19.89 at the national level in 2022, which decreased to 19.24 in 2023. Five provinces had a DIFR above the 2023 rate.
| Region | DIFR | Disabling injuries | Hours worked |
|---|---|---|---|
| Newfoundland and Labrador | 28.54 | 54 | 1,927,288 |
| Quebec | 21.54 | 1,618 | 75,264,442 |
| Nova Scotia | 21.29 | 178 | 8,361,176 |
| British Columbia | 21.21 | 698 | 33,193,971 |
| Ontario | 20.20 | 2,751 | 136,728,571 |
.jpg)
Chart 4.2 (b) - Text description
| Region | Disabling Injury Frequency Rate (DIFR) |
|---|---|
| N.L. | 28.54 |
| Que. | 21.54 |
| N.S. | 21.29 |
| B.C. | 21.21 |
| Ont. | 20.20 |
| Y.T. | 17.89 |
| S.K. | 16.51 |
| Alta. | 16.35 |
| Man. | 16.26 |
| P.E.I. | 11.95 |
| N.B. | 9.29 |
| N.W.T. | 8.04 |
| National Road Transportation DIFR | 19.24 |
As illustrated in Chart 4.2 (b), the safety performance of the Road Transportation industry, measured by the DIFR, varies greatly across different provinces and territories. This ranges from 8.04 (Northwest Territories) to 28.54 (Newfoundland and Labrador). Notably, Newfoundland and Labrador had the highest Road Transportation DIFR in 2022 as well.
Postal Services and Postal Contractors
The Postal Services industry had a DIFR of 18.60 at the national level in 2022, which decreased to 16.43 in 2023. Five provinces had a DIFR above the 2023 rate.
| Region | DIFR | Disabling injuries | Hours worked |
|---|---|---|---|
| Saskatchewan | 22.87 | 63 | 2,754,551 |
| New Brunswick | 21.50 | 45 | 2,092,992 |
| British Columbia | 19.90 | 235 | 11,909,111 |
| Nova Scotia | 17.46 | 47 | 2,692,382 |
| Quebec | 16.54 | 308 | 18,626,290 |
.jpg)
Chart 4.2 (c) - Text description
| Region | Disabling Injury Frequency Rate (DIFR) |
|---|---|
| Sask. | 22.87 |
| N.B. | 21.50 |
| B.C. | 19.90 |
| N.S. | 17.46 |
| Que. | 16.54 |
| Alta. | 15.57 |
| N.L. | 15.37 |
| Ont. | 15.20 |
| M.B. | 12.68 |
| P.E.I. | 11.29 |
| Y.T. | 9.72 |
| National Postal Services and Postal Contractors DIFR | 16.43 |
As depicted in Chart 4.2 (c), employers in the Postal Services industry exhibited less variation in their safety performance measured by DIFR across different regions than in Air Transportation and Road Transportation. The regional rates ranged from the lowest of 9.72 (Yukon) to the highest of 22.87 (Saskatchewan).
Longshoring, Stevedoring, Port, Harbour Operations and Pilotage
The Longshoring industry had a DIFR of 14.93 at the national level in 2022, which decreased to 9.75 in 2023. Three provinces had a DIFR above the industry's 2023 rate at the national level.
| Region | DIFR | Disabling injuries | Hours worked |
|---|---|---|---|
| Ontario | 28.11 | 5 | 213,418 |
| British Columbia | 21.73 | 190 | 8,744,883 |
| New Brunswick | 12.96 | 6 | 463,112 |
.jpg)
Chart 4.2 (d) - Text description
| Region | Disabling Injury Frequency Rate (DIFR) |
|---|---|
| Ont. | 28.11 |
| B.C. | 21.73 |
| N.B. | 12.96 |
| N.S. | 6.15 |
| Que. | 4.33 |
| N.L. | 3.20 |
| National Longshoring, Stevedoring, Port, Harbour Operations and Pilotage DIFR | 9.75 |
Chart 4.2 (d) illustrates that Longshoring industry employers located in different provinces and territories vary in their safety performance measured by DIFR. These range from the lowest regional rate of 3.20 (Newfoundland and Labrador) to the highest regional rate of 28.11 (Ontario). Note that the rate in Ontario is nearly triple the industry's national rate and more than 8 times higher than the lowest regional rate in Newfoundland and Labrador.
In summary, the substantial differences in DIFR observed within the industries across various provinces and territories in this section highlight the importance of accounting for regional variations when evaluating workplace safety performance. It is critical that all stakeholders, including governmental bodies and business entities, collaborate to identify any unique factors that contribute to elevated DIFR values in specific regions and implement targeted safety initiatives to address them.
At the same time, employers from provinces or territories exhibiting lower DIFR values are encouraged to share best practices that have been instrumental in fostering a safer working environment, particularly in the Air Transportation industry.
This report strongly advocates for the adoption of region-specific safety interventions, aimed at enhancing workplace safety standards within different industries and fostering inter-regional collaboration. Doing this will help ensure the development and implementation of effective safety practices across the federal jurisdiction.
Section 5: Moving forward
The findings of the 2023 annual report highlight the complexity of occupational health and safety across both the industries under federal jurisdiction and Canada's diverse regions. It should be noted that although more disabling and fatal injuries have been reported than in 2022, both injury types increased by a smaller amount in 2023 than in the previous year. Furthermore, the annual report showcases significant disparities in safety performance across different industries, provinces, and territories. This strongly suggests that industry-specific and regionally tailored safety interventions are needed to reduce the risk of workplace injuries in the federal jurisdiction.
The increase in the number of reports submitted in 2023 compared to 2022 highlights the importance of continued outreach to employers to further increase the number of submissions for the 2024 reporting year. This will help ensure that fewer workplace injuries in the federal jurisdiction are left unreported.
Overall, the 2023 annual report by the Labour Program of ESDC reveals that workplace safety performance has improved in some industries but appears to have declined in others. It emphasizes the need for vigilant, informed, and collaborative efforts to enhance safety standards across all federally regulated industries in Canada. Such efforts could include:
- Continued monitoring: Industries that show worsening safety performance or incomplete economic recovery warrant continuous monitoring and targeted interventions.
- Sharing of best practices: Regions and industries with superior safety records should share their successful strategies and best practices to foster improvement in workplace safety across the federal jurisdiction. For example, the Labour Program could work with employers belonging to industries with low DIFR values like Banking and Pipeline Transportation to potentially share their knowledge of workplace safety with other industries that had high DIFR values in 2023.
- Data utilisation: Employers and policymakers should use the data provided in this report to understand and address the specific safety challenges pertinent to their industries and regions.
- Data quality: The DIFR is calculated using data reported to the Labour Program. Further work is needed to better understand the non-response and selection biases in the data. These are common statistical challenges for data that is produced using voluntary collection. The Labour Program will continue to work with employers to ensure compliance in reporting.
Annex: List of terms
The following definitions are used in this publication.
Disabling injury
"Disabling injury" means an employment injury or an occupational disease that:
- prevents an employee from reporting for work or from effectively performing all the duties connected with the employee's regular work on any day subsequent to the day on which the injury or disease occurred, whether or not that subsequent day is a working day for that employee
- results in the loss by an employee of a body member or part thereof or in the complete loss of the usefulness of a body member or part thereof, or
- results in the permanent impairment of a body function of an employee
Disabling Injury Frequency Rate (DIFR)
The total number of disabling and fatal occupational injuries per 1 million hours worked. The calculation is: (Total Disabling Injuries + Total Fatal Injuries)*1,000,000/Total Hours Worked.
Employee
Any person employed by an employer.
Employer
Any person who employs 1 or more employees and includes an employers' organisation and any person who acts on behalf of an employer.
Employment
"Employment" is defined as:
- all work or activities performed in carrying out assignments or requests made by the employer. It includes related activities not specifically covered by an assignment or request
- any voluntary work or activities undertaken while on duty for the benefit of the employer, or
- any activities undertaken while on duty with the consent or approval of the employer
Fatal Injury
An occupational injury or disease resulting in death.
Fatal Injury Frequency Rate (FIFR)
The total number of fatal occupational injuries per 1 billion hours worked. The calculation is: Total Fatal Injuries*1,000,000,000/Total Hours Worked.
The Fatal Injury Frequency Rate can also be calculated using the fatal injuries and total hours worked reported over a 10-year timespan. The calculation is: Total Fatal Injuries Over 10 Years*1,000,000,000/Total Hours Worked Over 10 Years.
Federal Jurisdiction
Federal jurisdiction covers:
- any work, undertaking or business that is within the legislative authority of Parliament, and
- any work deemed to be for the common good of 2 or more provinces and outside the exclusive authority of provincial legislatures
Full-time Equivalent (FTE)
Refers to the employment of 1 person full time. It may also refer to more than 1 person part time whose total working time is the equivalent of 1 person working full time. For example:
- 100 people employed full time equals 100 FTEs
- 10 people employed half time equals 5 FTEs
- all 110 people combined represent 105 FTEs
Minor Injury
"Minor injury" means an employment injury or an occupational disease for which medical treatment is provided and excludes a disabling injury.
Note: Medical treatment means medical care provided at a medical treatment facility, such as a hospital, medical clinic or doctor's office where a patient in need of emergency care can be treated. Not to be confused with first aid.
Occupational Injury
Any injury, disease or illness incurred by an employee in the performance of, or in connection with, his or her work.
Workplace
Any place where an employee is engaged in work for the employee's employer as per 122(1) of the Code.