
Canada’s National Greenhouse Gas Inventory (1990–2021)
Backgrounder
On April 14, 2023, Environment and Climate Change Canada published Canada's 2023 National Inventory Report. This year's edition covers greenhouse gas emissions from the Canadian economy from January 1, 1990, to December 31, 2021.
The National Inventory Report is a scientific report which, along with other publications such as Canada's Eighth National Communication and Fifth Biennial Report to the United Nations Framework Convention on Climate Change, and Canada's 2030 Emissions Reduction Plan, informs and supports decision-making to reduce Canada's greenhouse gas emissions and combat climate change.
Emissions highlights
In 2021, Canada's greenhouse gas emissions were 670 megatonnes (Mt) of carbon dioxide equivalent (Mt CO2 eq), decreasing by 62 Mt (8.4 percent) from 2005. However, emissions in 2021 increased by 12 Mt (1.8 percent) from 2020, as some parts of the economy saw an increase in activity but remained 53 Mt (7.4 percent) below pre-pandemic (2019) emission levels.
Transport and oil and gas extraction emissions increased by 9.0 Mt (5.0 percent) and 4.0 Mt (4.0 percent), respectively, between 2020 and 2021, while emissions from residential stationary combustion sources and agricultural soils decreased by 1.5 Mt (4.0 percent) and 1.4 Mt (7.0 percent), respectively.
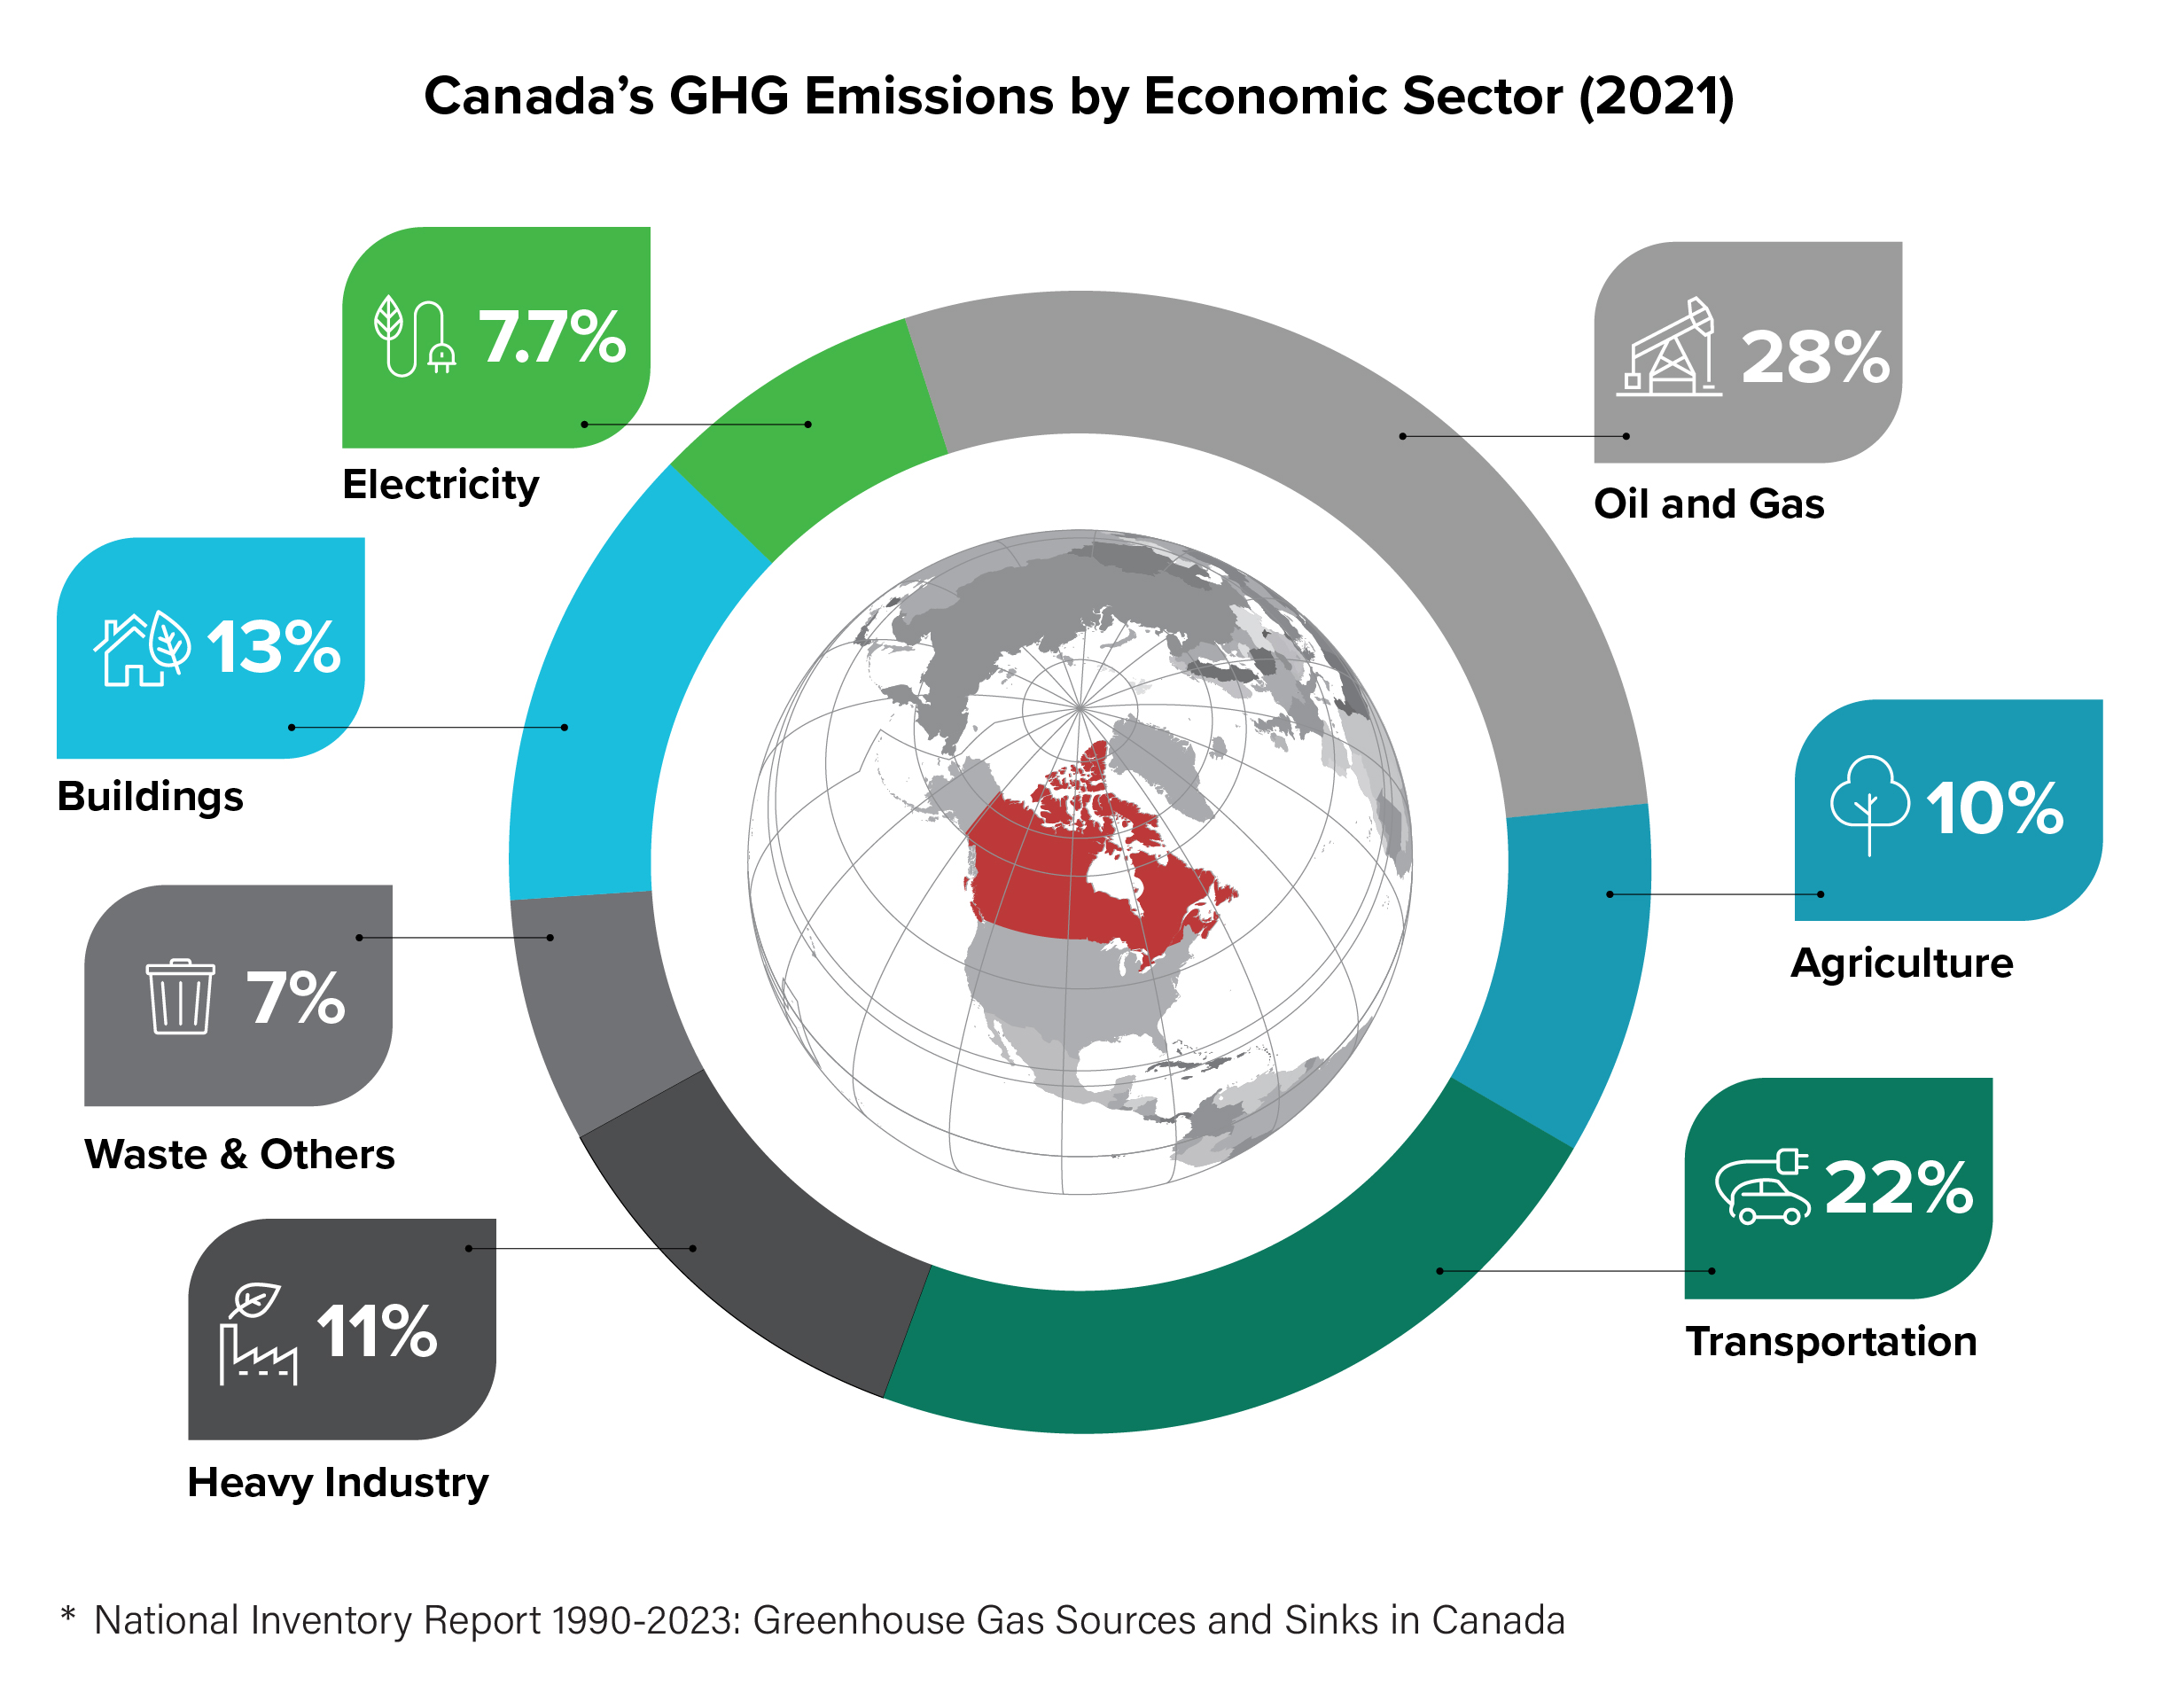
Figure 1: Breakdown of Canada's greenhouse gas emissions by economic sector (2021)
Long description
Canada's GHG emissions by economic sector (2021)
- Oil and gas: 28 percent
- Electricity: 7.7 percent
- Transportation: 22 percent
- Heavy industry: 11 percent
- Buildings: 13 percent
- Agriculture: 10 percent
- Waste and others: 7 percent
* National Inventory Report 1990-2023: Greenhouse Gas Sources and Sinks in Canada
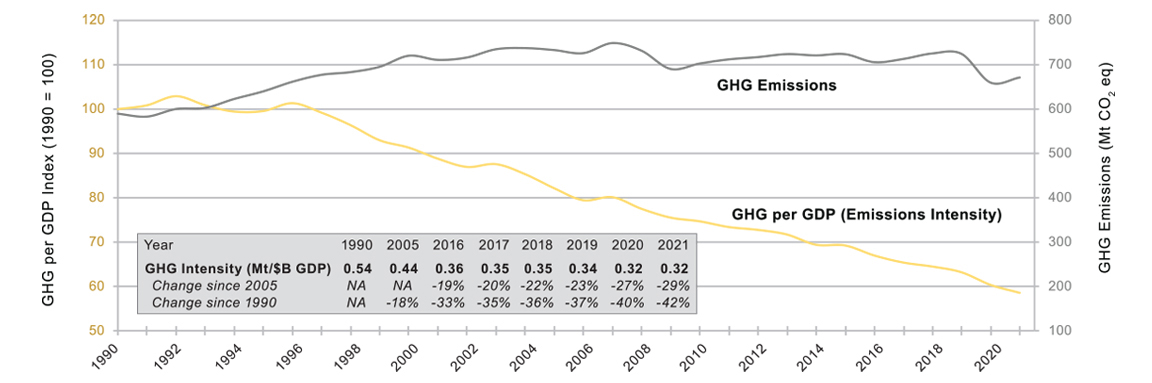
The emissions intensity for the entire Canadian economy (greenhouse gas per gross domestic product) has declined by 42 percent since 1990, and by 29 percent since 2005.
Figure 2: Canadian greenhouse gas emissions and indexed trend emissions intensity (excluding land use, land-use change, and forestry)
Notes:
NA = Not applicable
GDP data source = StatCan (n.d.[b])
Long description
Figure ES-1 is a line graph displaying actual GHG emissions for 1990 to 2021 (Mt CO2 eq) on one line and indexed trends of GHG emissions per GDP (emissions intensity) on another (Index 1990 = 100). The figure shows that GHG emissions were increasing slowly over time, but reduced back to 2009 level in 2020, before increasing slightly in 2021. Though, the emissions intensity was decreasing constantly during the whole time period from 100 in 1990 to 58.5 in 2021. On the figure, there is also a table showing the GHG emissions intensity for the years 1990, 2005 and 2016 to 2021 and the changes in percentage since 1990 and 2005. The following table displays both GHG emissions and indexed GHG emissions per GDP from 1990 to 2021 and the second table is the one appearing on the graph.
| Year | GHG emissions (Mt CO2 eq) | Indexed GHG per GDP (emissions intensity) |
|---|---|---|
| 1990 | 589 | 100 |
| 1991 | 582 | 101 |
| 1992 | 599 | 103 |
| 1993 | 602 | 101 |
| 1994 | 622 | 100 |
| 1995 | 639 | 100 |
| 1996 | 661 | 101 |
| 1997 | 676 | 99 |
| 1998 | 682 | 96 |
| 1999 | 695 | 93 |
| 2000 | 719 | 91 |
| 2001 | 710 | 89 |
| 2002 | 715 | 87 |
| 2003 | 734 | 88 |
| 2004 | 737 | 85 |
| 2005 | 732 | 82 |
| 2006 | 725 | 79 |
| 2007 | 748 | 80 |
| 2008 | 731 | 78 |
| 2009 | 690 | 76 |
| 2010 | 702 | 75 |
| 2011 | 711 | 73 |
| 2012 | 716 | 73 |
| 2013 | 723 | 72 |
| 2014 | 720 | 69 |
| 2015 | 723 | 69 |
| 2016 | 705 | 67 |
| 2017 | 712 | 65 |
| 2018 | 725 | 64 |
| 2019 | 724 | 63 |
| 2020 | 659 | 60 |
| 2021 | 670 | 59 |
| Year | 1990 | 2005 | 2016 | 2017 | 2018 | 2019 | 2020 | 2021 |
|---|---|---|---|---|---|---|---|---|
| GHG Intensity (Megatonne/Billion $ GDP) | 0.54 | 0.44 | 0.36 | 0.35 | 0.35 | 0.34 | 0.32 | 0.32 |
| Change since 2005 | NA | NA | -19 % | -20 % | -22 % | -23 % | -27 % | -29 % |
| Change since 1990 | NA | -18 % | -33 % | -35 % | -36 % | -37 % | -40 % | -42 % |
While the COVID-19 pandemic undoubtedly impacted emissions in recent years, the sustained decline in emission intensities over time can be attributed to fuel switching, increases in efficiency, the modernization of industrial processes, and growth in the clean economy as well as decreasing emissions intensity across the economy.
Transportation emissions
The majority of transport emissions in Canada are related to road transportation, which includes personal transportation (light-duty vehicles and trucks), and heavy-duty vehicles. The general growth trend in road transportation emissions is largely due to an increase in driving— more cars and trucks, using more fuel, and generating greater emissions.
As the pandemic slowed in 2021, travel increased, resulting in a 9 Mt increase in emissions from 2020 from the transport sector; however, emissions remain below the 2019 pre-pandemic levels.
Despite a reduction in kilometres driven per vehicle, the total vehicle fleet in 2021 had increased by 27 percent since 2005, most notably for trucks (both light- and heavy-duty), leading to more kilometres driven overall.
Landfill methane emissions
Emissions from solid and liquid waste treatment and disposal contributed 21 Mt (3.1 percent) of Canada's total greenhouse gas emissions in 2021. Methane emissions from municipal solid-waste landfills made up 82 percent of all waste emissions in 2021 and have decreased by 5.3 percent since 2005.
An increasing amount of methane emissions is being captured by landfill gas collection facilities to be flared or used for energy: 36 percent, or 11 Mt in 2021, compared to 29 percent in 2005.
Land use, land-use change, and forestry
Land-use activities, such as forest management, agricultural practices, and land-use change, can act to both generate greenhouse gas emissions, as well as to remove carbon from the atmosphere. Canada's land use, land-use change, and forestry emissions have fluctuated over recent years, with net emission removals of 39 Mt in 2014, to a small net source of emissions of 24 kt in 2015, and net emission removal of 17 Mt in 2021.
Land-use activities, such as planting trees and regenerative agriculture, can reduce carbon dioxide levels in the atmosphere. These nature-based solutions are an important part of Canada's 2030 Emissions Reduction Plan.
Oil and gas emissions
Since 2005, fugitive greenhouse gas emissions from fossil fuel production (coal mining, oil, and natural gas) have decreased by 15 Mt (21 percent). Between 2019 and 2020, methane emissions from the upstream oil and gas industry decreased by 9 Mt (14 percent). Many factors likely contributed to this, such as federal and provincial methane regulations, decreased oil and gas production, impacts of the pandemic, and the closure of less productive oil and gas wells. There was no significant change in methane emissions between 2020–2021.
Between 2020–2021, combustion emissions from oil and gas extraction increased by 4.0 Mt (4.0 percent), consistent with a rise in crude bitumen (13 percent) and synthetic crude oil (6 percent) from oil sands and natural gas (4 percent).
Agricultural emissions
In 2021, emissions from the agriculture sector accounted for 54 Mt, or 8.1 percent, of total greenhouse gas emissions in Canada. This was unchanged from 2005 levels, but was an increase of 13 Mt, or 32 percent, since 1990. The sector accounted for 31 percent of national methane emissions and 75 percent of national nitrous oxide emissions, up from 30 percent and 43 percent in 1990, respectively.
Fluctuations in livestock populations and continuous increases in the application of inorganic nitrogen fertilizers have the biggest impact on emission trends in the agriculture sector. Nitrous oxide emissions from applying inorganic nitrogen fertilizers increased by 133 percent (from 5.5 Mt in 1990, to 13 Mt in 2021). Likewise, carbon dioxide emissions from using urea-based fertilizers, which has carbon in its chemical formula, increased 266 percent (from 0.8 Mt in 1990, to 2.9 Mt in 2021).
Methodological improvements to the 2023 National Inventory Report
Continuous improvements to quantify and report Canada's emissions are essential to ensure that Canada's inventory estimates are based on the best available science and data. This includes regularly engaging with experts and stakeholders to identify knowledge gaps and prioritize input to the scientific process that underlies greenhouse gas reporting.
This year, significant improvements and revisions were made in the areas of waste landfills and transport emissions, among others. Also, post-meter natural gas fugitives were added as a new source. Post-meter fugitives include methane leaks from residential and commercial natural gas appliances (i.e., stoves, dryers, and heaters), power plants and industrial facilities that consume natural gas, and vehicles powered by natural gas. Overall, these improvements resulted in downward revisions of 9 Mt in 2005, and 14 Mt in 2020.
Planned 2024 National Inventory Report improvements
New and updated data on emissions from harvested areas in Canada's forests between 1890 and 1989 is planned for the 2024 National Inventory Report. The Government of Canada expect significant revisions to anthropogenic forest carbon sinks. Once implemented, the proposed update will result in revisions in the reported carbon removals that occur in Canada's managed forest; as a result, when the gross emissions from harvested wood products are added, the reported anthropogenic net balance for the whole of the forest sector is anticipated to become a net source in all years of the time series.