
Greenhouse gas emissions trends 2012
Environment Canada
August 2012
Table of Contents
Tables and Figures
- Figure ES 1 - Scenarios of Canadian emissions to 2020 (Mt CO2e)
- Figure 1 - Distribution of world carbon dioxide emissions from fuel combustion, 2009
- Figure 2 - Projected GHG emissions under alternative economic assumptions (excluding LULUCF)
- Figure 3 - Total Canadian GHG emissions and projections (with no further government actions): 1990 to 2020 (Mt CO2e - incl. LULUCF)
- Figure 4 - Decoupling of GDP and GHG emissions - 2010 to 2020
- Figure A.1.1 - Crude oil price: WTI, Western Canada Select and Alberta Heavy ($US 2010/bbl)
- Figure A.1.2 - Henry Hub natural gas price ($CDN 2010/GJ)
- Figure A.3.1 - Energy, emissions and economy model for Canada
- Table ES 1 - Canadian GHG emissions and government measures (Mt CO2e)
- Table 1 - GHG emissions by economic sector (Mt CO2e)
- Table 2 - Sensitivity of emissions to changes in GDP and world oil price (excluding LULUCF)
- Table 3 - Change in GHG emissions by economic sector (Mt CO2e)
- Table 4 - Transportation: emissions (Mt CO2e)
- Table 5 - Oil and gas sector: emissions by production type (Mt CO2e)
- Table 6 - Upstream oil and natural gas production: emissions and drivers
- Table 7 - Petroleum refining and upgrading sector: emissions and drivers
- Table 8 - Electricity sector: emissions and drivers
- Table 9 - Electricity generation: emissions by fuel type (Mt CO2e)
- Table 10 - Emissions-intensive and trade-exposed industries: emissions and drivers
- Table 11 - Emissions-intensive and trade-exposed industries: emissions by subsector (Mt CO2e)
- Table 12 - Residential sector: emissions and drivers
- Table 13 - Commercial sector: emissions and drivers
- Table 14 - Agriculture sector: emissions (Mt CO2e)
- Table 15 - Waste and Others: emissions (Mt CO2e)
- Table 16 - Provincial and territorial GHG and per capita emissions: 2005 to 2010
- Table 17 - Provincial and territorial GHG emissions: 2005 to 2020 (Mt CO2e)
- Table 18 - Provincial and territorial per capita emissions: 2005 to 2020
- Table 19 - Projected emissions (+) or removals (-) from the LULUCF sector in 2020
- Table 20 - Selected industries' share of GDP in 2020 (%)
- Table A.1.1 - Macroeconomic assumptions: 1990-2020 average annual growth rates (%)
- Table A.1.2 - Crude oil production
- Table A.1.3 - Oil sands disposition
- Table A.1.4 - Natural gas production
- Table A.1.5 - Electricity generation by fuel
- Table A.1.6 - Mass of carbon dioxide emitted per quantity of energy for various fuels
- Table A.1.7 - GHG: measures reflected in projections (policies in place as of Spring 2012)
- Table A.1.8 - Announced 2020 GHG reduction targets of provincial governments (only announced and implemented measures under these targets are included in projections)
- Table A.2.1 - Sensitivity analysis - Change in GDP and/or world oil/natural gas prices
Overview
When Canada signed the Copenhagen Accord in December 2009, it committed to reduce its greenhouse gas (GHG) emissions to 17% below 2005 levels by 2020, establishing a target of 607 Megatonnes (Mt). This mirrors the reduction target set by the United States.
According to the International Energy Agency, Canada's CO2 emissions from fuel combustion in 2009 accounted for approximately 2% of global emissions. Canada's share of total global emissions, like that of other developed countries, is expected to continue to decline in the face of rapid emissions growth from developing countries.
The Government of Canada's initial focus in tackling GHG emissions has been directed at the largest source of Canadian emissions through regulation of the transportation sector, as well as actions to reduce emissions from electricity generation. The Government is now turning its focus to work with partners in other key economic sectors, in particular, working with our partners in the oil and gas sector to make further progress on meeting our target.
The future path of greenhouse gas emissions in Canada will depend on a number of factors including: economic activity, population, development of energy markets and their influence on prices, technological change, consumer behaviour, and government actions.
Last year, Canada's GHG emissions were projected to be 785 Mt in 2020. Since that time, there have been several key developments and GHG emissions are now projected to be 65 Mt lower at 720 Mt in 2020. This is despite the fact that Gross Domestic Product (GDP) is projected to be slightly higher in 2020 in this year's projection. The decline in projected emissions, when compared to last year, is influenced by four main factors:
- Emissions are increasingly becoming decoupled from economic growth. Changes in behaviour by consumers and businesses, in part due to federal, provincial and territorial actions, are leading to a decline in emissions intensity.
- Projected sectoral shifts in the economy are also contributing to this improvement in emissions intensity. Compared to last year's report, projected growth for the emissions-intensive sectors is now lower, while it is now higher for the less emissions-intensive sectors. This reduces projected emissions in 2020, even though total GDP is projected to be slightly higher.
- For the first time, the contribution of the land use, land-use change and forestry (LULUCF) sector to achieving Canada's target is included in our projections.
- This year's projections also have a new, lower starting point as the most recent data show emissions were significantly lower in 2010 than previously estimated. Last year, emissions were estimated to be 710 Mt and since that time, preliminary data collected by Statistics Canada and assessed for the National Inventory Report 1990-2010: Greenhouse Gas Sources and Sinks in Canada (NIR) put Canada's actual emissions in 2010 at 692 Mt.
Canada's Greenhouse Gas Inventory shows a decoupling of GHG emissions from economic growth
Canada's total greenhouse gas emissions in 2010 were 692 Mt, essentially unchanged from 2009 levels (a 0.25% increase).This means that between 2009 and 2010, Canada's emissions remained steady despite economic growth of 3.2%.
Over the last two decades, technological and structural changes, along with increases in efficiency, have acted to create this decoupling of emissions and economic growth. The Canadian economy has experienced a substantial decline in energy intensity as industrial processes have become more efficient and lower-emissions and service-based industries have grown. As well, emissions from energy generation have declined, primarily due to changes to the generation mix and closure of coal-fired generating units. As a result, economic activity and the level of greenhouse gas emissions are becoming increasingly independent. Between 2005 and 2010, the economy grew by 6.3% whereas Canadian greenhouse gas emissions decreased by 6.5%.
Per capita emissions in 2010 fell to 20.3 tonnes of carbon dioxide equivalent per person, their lowest level since tracking began in 1990. In comparison to the 2005 level (22.9 t CO2 eq/capita), per capita emissions in 2010 are 2.6 tonnes of carbon dioxide equivalent lower. Canada is making steady progress towards its commitment to reduce GHG emissions. Of note, since 2005, annual greenhouse gas emissions have dropped by 48 megatonnes and emissions have declined in almost all sectors, including oil and gas and electricity generation.
Emissions intensity continues to improve through 2020 with help from federal, provincial, and territorial actions
In this year's report, Gross Domestic Product (GDP) is projected to be slightly higher in 2020 than in the previous report (by 0.8%), while GHG emissions are lower (by 5.3%). The projected decline in GHG emissions is thus associated with a reduction in intensity, implying greater de-coupling between GDP and GHGs. The improvements in emission intensity are in part due to: i) increased contribution of the services sector, which typically emits less emissions per dollar of GDP; and ii) actual emissions in 2010 were lower than projected, while actual GDP was higher. The decline in emissions intensity was also due to the fact that consumers and businesses are making more progress in reducing emissions. Government programs are contributing to this by helping to accelerate the adoption of energy efficient technologies and cleaner fuels.
Canada is moving forward to regulate GHGs on a sector-by-sector basis, aligning with the U.S where appropriate. The Government of Canada has started with the transportation and electricity sectors - two of the largest sources of Canadian emissions - and plans to move forward with regulations in partnership with other key economic sectors, including oil and gas. Last year's report included emissions regulations for light-duty vehicles for the model years 2011-2016 as well as an electricity performance standard to phase-out coal-fired electricity, Alberta's Specified Gas Emitters Regulation, British Columbia's carbon tax and Quebec's carbon levy. Provincial policies such as Ontario's phase-out of coal-fired electricity also made important contributions. Projected emissions levels in the 2012 version of the report have further declined, in part through the inclusion of further federal actions on additional emissions regulations for light-duty vehicles for the 2017-2025 period as well as heavy duty vehicle regulations. Recent provincial actions (e.g., Quebec's cap-and-trade, Nova Scotia's emissions cap for electric utilities, increased stringency of building energy codes, equipment standards and requirements for capturing methane from landfill gas) are also included. Total emissions in 2020 are projected to decrease to 720 Mt.
The future trajectory of Canadian GHG emissions can, and will, be influenced by further government actions, technological change, economic conditions, and developments in energy markets. Recognising this, Environment Canada has developed scenarios for projected emissions based on different assumptions regarding future economic and energy market developments.
For the first time, there is recognition of the contribution of the Land Use, Land-Use-Change and Forestry sector
The Land Use, Land-Use-Change and Forestry sector (LULUCF) has been internationally recognised as an important consideration in global accounting frameworks for emissions reductions. Improvements in greenhouse gas related activities within Canada's LULUCF sector can make an important contribution towards reducing national emissions levels, given Canada's large supply of forest and cropland.
This 2012 Emissions Trends Report represents a key milestone for Canada in moving towards the inclusion of the LULUCF sector in accounting of GHG emissions. New projections allow the inclusion of the LULUCF sector in emission projections for the first time. Current estimates suggest a net contribution of 25 Mt of GHG emissions towards the 2020 target. While these estimates are preliminary in nature and will change as a result of ongoing efforts to improve data and methodologies as well as the consideration of alternative accounting approaches, they provide a solid first step toward recognizing the important contribution from LULUCF.
This important step will encourage advancement in policies and measures to make further progress towards Canada's GHG reduction goals.
The report projects that Canada is one half of the way toward meeting its Copenhagen Commitment
Overall, this report demonstrates that Canada is making significant progress towards meeting its 2020 target for GHG emissions. Beyond federal initiatives, provincial and territorial governments are contributing with significant action of their own under their respective jurisdictional targets. Taken together, the measures of the federal and provincial governments, combined with the efforts of consumers and businesses, are projected to have a significant impact on emissions over the coming years.
| 2005 | 2010 | 2015 | 2020 | |
|---|---|---|---|---|
| * Includes the contribution of LULUCF in 2015 and 2020. | ||||
| Emissions - Assuming No Government Measures (2011) | 740 | 718 | 784 | 850 |
| Emissions - with Existing Government measures (2012 update)* | 740 | 692 | 700 | 720 |
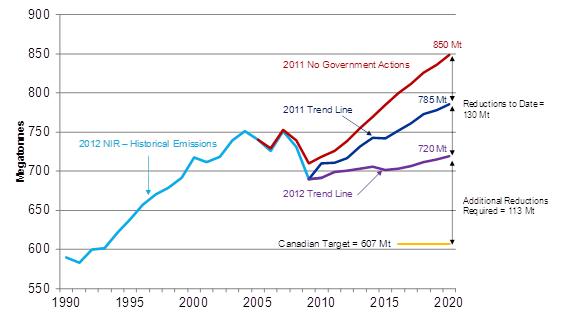
Last year, Canada's GHG emissions were projected to be 850 Mt in 2020 under a scenario assuming no government measures to reduce emissions. Taking into account existing measures of federal, provincial and territorial governments, it was projected that emissions would be 785 Mt in 2020. This reduction of 65 Mt represented one quarter of the reductions needed to meet Canada's target of 607 Mt. This year, GHG emissions are now projected to be 720 Mt in 2020, as a result of all the developments outlined in this report. The gap between the initial projected business-as-usual GHG emissions in 2020 (850 Mt) and the 607 Mt target now has been closed by 130 Mt - one half of the way to meeting Canada's target. Upcoming federal policies, in particular oil and gas regulations, along with further provincial measures, will further contribute to the additional 113 Mt required for Canada to meet its commitments under the Copenhagen Accord.
Figure ES 1 - Scenarios of Canadian emissions to 2020 (Mt CO)
Preface
Consistent with its goal of becoming a “World Class Regulator”, and ensuring greater transparency, Environment Canada has committed to publish emissions projections annually. This is the second annual report, building on last year's publication, Canada's Emissions Trends 2011.
The analysis presented in this report incorporates the most up-to-date statistics on GHG emissions and energy available at the time that the technical modeling was completed[1], and is based on scenarios of emissions projections using a detailed, proven Energy, Emissions and Economy Model for Canada.
Last year, projected emissions were 710 Mt in 2010. Since that time, data collected by Statistics Canada for 2010 has been assessed for the National Inventory Report 1990-2010: Greenhouse Gas Sources and Sinks in Canada (NIR) in accordance with standards set by the Intergovernmental Panel on Climate Change - a United Nations body. Estimates published in the 2012 NIR show that Canada's emissions in 2010 were actually 2.6% lower at 692 Mt. Subsequently, emissions projections in this paper have been revised down compared to the 2011 Report to reflect these changes as well as factors such as slower than expected economic growth for certain emissions-intensive subsectors.
Provincial and federal government departments were consulted during the model's development and were invited to provide their input and suggestions for improvement. Environment Canada also consulted industry experts to improve the model and core technical assumptions.
The majority of data and advice received from sector experts and authorities for the modelled emissions scenarios have been subjected to rigorous consultations. For example, the National Energy Board has extensive consultation processes in place to ensure their assumptions of energy demand and supply growth are robust; the input they provided to Environment Canada reflects those consultations.
In addition, the methodology used to create the projections underwent a peer review by a panel of experts in 2010/2011. In the peer review, the experts assessed the modeling methodology on its reasonableness and robustness, reviewed the sources for the key macroeconomic and energy-related assumptions, and made suggestions on how to continue improving the methodology in future rounds. While we are working with a highly detailed and sophisticated model, as with all projections, the estimates in this paper should be seen as representative of possible outcomes that will, in the end, depend on economic, social and other factors, including future government policy.
Questions and requests for further information on the analysis underlying this report should be directed to: AMD_EAD@ec.gc.ca
Canada's GHG Emissions in a Global Context
It is important to put Canada's situation into context by comparing to other countries. According to the International Energy Agency, Canada's CO2 emissions from fuel combustion in 2009 accounted for approximately 2% of global emissions[2].
Global emissions of CO2 have increased by 38% between 1990 and 2009. Over the same period, Canadian CO2emissions have increased by less than 19%. Canada's share of total global emissions, like that of other developed countries, will continue to decline in the face of rapid emissions growth from developing countries, particularly China and India. By 2005, China had overtaken the U.S. as the world's largest overall greenhouse gas emitter, and by 2020 China's greenhouse gas emissions are expected to account for 27% of global emissions, up from about 20% in 2005.
Figure 1 - Distribution of world carbon dioxide emissions from fuel combustion, 2009
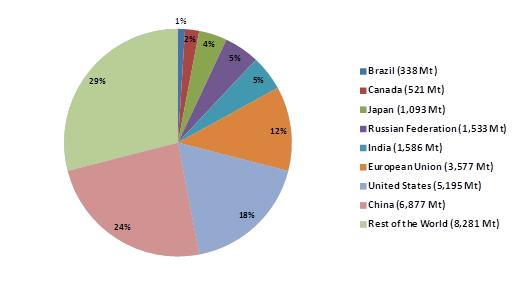
Source: www.ec.gc.ca/indicateurs-indicators/default.asp?lang=en&n=54C061B5-1
The Copenhagen Accord is a critical instrument for addressing such dramatic escalation in global emissions because it is signed by 140 nations, representing 85% of the world's GHG emissions. For example, the Accord was signed by China, the U.S., Brazil and India, which together account for over 40% of global emissions. In contrast, none of these major emitters had commitments under the Kyoto Protocol, an agreement that involved commitments of only 40 nations representing 27% of global emissions.
When Canada signed the Copenhagen Accord in December 2009, it committed to reducing its GHG emissions to 17% below 2005 levels by 2020. This mirrors the reduction target set by the United States, which is also following a sector-by-sector approach. Canada is moving in alignment with the U.S. given the importance of our economic relationship. Every day, $1.8 billion in goods and services crosses the border, and fully 85% of Canada's trade is with the United States. Comparatively, Canada has relatively less trade with other large partners. This makes the United States Canada's primary link into global value chains - which is the transformation process of a product from raw materials to finished good, or the process of developing tradable services. The GHG regulations for light duty and heavy duty vehicles are examples of an aligned approach. With aligned regulations, light duty vehicle and heavy duty vehicle manufacturers face the same rules in each country, providing greater investment certainty and a level playing field. Furthermore, all Canadians benefit from the efficiency of having a single set of regulations in the integrated North American auto sector.
Emissions by Activity and Economic Sector
There are several methods to categorise the sources of greenhouse gas emissions that arise across Canada. In Canada's National Inventory Report (NIR)[3], as specified by the United Nations Framework Convention on Climate Change definitions, greenhouse gas emissions are primarily categorized by emitting activity: e.g., emissions from energy use, fugitive emissions, transportation emissions, and emissions from industrial processes. However, for the purposes of analyzing trends and policies, it is useful to allocate emissions to the economic sector from which they originate. As such, both this report and the 2012 NIR present emissions by economic activity.
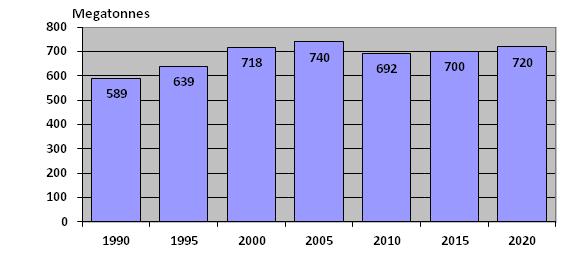
Historical Emissions
Historical emissions estimates within this report are taken from the NIR which is submitted to and reviewed by the United Nations Framework Convention on Climate Change (UNFCCC).Every year the estimates are updated to reflect the availability of data as well as improvements and refinements to data sources and methodological techniques. For this reason, the historical emissions reported here will differ from those reported in Canada's Emissions Trends 2011.
From 1990 to 2005, total emissions grew from 589 Mt to 740 Mt. The majority of this increase occurred in the transportation sector, the oil and gas sector and the electricity sector. In the transportation sector, changes in subsectors including light-duty and heavy-duty vehicles caused an increase in emissions of 42 Mt over this period. Expansion and adoption of new extraction technologies resulted in an increase in emissions of 60 Mt in the oil and gas sector. The electricity sector accounted for a further 29 Mt of the increase in total emissions.
Greenhouse gas emissions have decreased in almost every sector of Canada between 2005 and 2010. This is a result of factors such as the global economic downturn, changes to energy efficiency technology, changes in energy prices, and a decrease in the energy intensity of the economy. Moreover, federal and provincial government actions to reduce emissions had a significant impact on emissions over this time period.
Table 1 shows historical emission levels for selected years up to 2010 (the last available year of historical emissions numbers under the NIR for 2012) for each of the major economic sectors generating emissions.
| Mt CO2equivalent |
1990
|
2000
|
2005
|
2006
|
2007
|
2008
|
2009
|
2010
|
|---|---|---|---|---|---|---|---|---|
| Oil and Gas |
100
|
150
|
160
|
161
|
165
|
160
|
161
|
154
|
| Electricity |
92
|
128
|
121
|
115
|
124
|
112
|
96
|
99
|
| Transportation |
128
|
155
|
170
|
169
|
172
|
172
|
162
|
166
|
| Emissions Intensive & Trade Exposed Industries |
96
|
88
|
90
|
89
|
90
|
87
|
74
|
75
|
| Buildings |
70
|
81
|
85
|
80
|
85
|
85
|
82
|
79
|
| Agriculture |
54
|
65
|
67
|
66
|
68
|
68
|
67
|
69
|
| Waste and Others |
49
|
50
|
48
|
46
|
48
|
47
|
47
|
50
|
| National GHG Total |
589
|
718
|
740
[4]
|
726
|
751
|
731
|
690
|
692
|
Transportation
Emissions from transportation (including passenger, freight, and off-road emissions) are the largest contributor to Canada's greenhouse gas emissions, representing 24% of overall greenhouse gases in 2010.
Between 1990 and 2005, emissions in the transportation sector increased 33% from 128 Mt in 1990 to 170 Mt in 2005. This was largely driven by a strong period of economic growth as well as a shift from cars to light-duty trucks.
Since 2005, transportation emissions have decreased 4 Mt. Light-duty vehicles have become increasingly more fuel efficient. For example, between 2005 and 2010, the sales-weighted on-road fuel economy for new cars has improved from 8.5 litres per 100 km to 6.8 litres per 100 km, while the sales-weighted on-road fuel economy for new light trucks has improved from 12.7 litres per 100 km to 8.5 litres per 100 km. Offsetting factors include an increase in number of vehicles on the road and kilometres driven.
Electricity
Historically over the 1990 to 2005 period, emissions from the electricity sector increased in parallel with rising demand for electricity both domestically and to satisfy export demand from the United States. Additionally, fossil fuel power generation became more prominent in the overall generating portfolio between.
Electricity-related emissions (including heat generation) have generally declined since 2005 due to factors such as a return to service of a number of nuclear units and fuel switching to natural gas, as well as a decline in coal-fired electricity generation in Ontario. These factors coupled with the economic downturn have seen emissions from the electricity sector decrease by 22 Mt between 2005 and 2010.
Oil and Gas
Conventional oil and gas production and petroleum refining emissions are related primarily to the production, transmission, processing, refining and distribution of all oil and gas products. In 2010, the Oil and Gas economic sector produced the second largest share of greenhouse gas emissions in Canada (22%).
Emissions from this sector increased by 60 Mt over the 1990 to 2005 time period as the sector expanded and adopted new extraction processes. However, GHG emissions from the Oil and Gas sector have fallen by 6 Mt between 2005 and 2010. This more recent decrease in the emissions from the oil and gas sector is the result of a number of factors including a lower global demand for petroleum products during the economic downturn, as well as the gradual exhaustion of conventional natural gas and oil resources in Canada.
Emissions-Intensive and Trade-Exposed Industries (EITE)
Emissions from the Emissions-Intensive Trade-Exposed Industry sector[5] were responsible for 16% of total Canadian emissions in 1990 falling to 12% in 2005. In more recent years, emissions have fallen further as a result of the economic downturn and the continued evolution of Canadian production towards other sectors and services, representing an additional decrease of 15 Mt between 2005 and 2010 (11% of total emissions).
The decline in emissions was also due to the contribution of several factors such as the installation of nitrous oxide abatement technology in Canada's only adipic acid manufacturing plant and the improved emission control technologies for perfluorocarbons within the aluminum industry. Energy efficiency measures, replacement of raw materials with recycled materials, and use of unconventional fuels such as biomass and waste in the production processes, were also responsible for the reductions.
Buildings
Emissions in Canada's service industry and residential buildings increased by 15 Mt overall between 1990 and 2005. However, more recently, between 2005 and 2010, emissions decreased by 6 Mt. This was driven by a 5 Mt decrease in commercial buildings, mainly due to improved energy standards and the adoption of higher-efficiency furnaces and other improved appliances.
Agriculture
Canada's agricultural emissions consist mainly of methane and nitrous oxide from animal and crop production systems. Emissions have remained relatively stable over the 2005 to 2010 time period increasing by only 2 Mt or 3%, following an increase of 13 Mt from 1990 to 2005. Increasing emissions from on-farm fuel use and crop production have been partially offset by decreasing emissions from animal production since 2005.
Waste and Others
Emissions from the Waste and Others sector have remained relatively stable over the period. GHG emissions from landfills increased only slightly over the time period, as provincial government measures aimed at capturing landfill gas from solid waste helped to slow growth. In contrast, emissions from coal production have nearly doubled over the 2005 to 2010 time period increasing by nearly 3 Mt.
Emissions Scenarios and Key Drivers
Greenhouse gas emissions in Canada are driven by a number of economic drivers (e.g., energy demand and supply mix, economic growth, among others). Looking ahead, projections of future emissions are greatly influenced by the underlying assumptions about the expected development of these economic drivers over time[6]. Changing assumptions about any of these factors will alter the future path of emissions.
The approach adopted for development of the emissions scenarios presented here relies on a baseline set of assumptions. In this respect, the economic projections are calibrated to those used by Finance Canada in Budget 2012. The longer-term projections incorporate productivity growth projections and Statistics Canada's population growth projections. Similarly, forecasts of major energy supply projects from the National Energy Board were incorporated for key variables and assumptions in the model (e.g., oil sands production, large hydro capacity expansions, nuclear refurbishment and additions). Supply forecasts are based on consultation with industry experts and reflect the Government's most recent views regarding the evolution of Canada's energy supply sector. The projections also incorporate data from the National Inventory Report 1990-2010: Greenhouse Gas Sources and Sinks in Canada (NIR), Natural Resources Canada, and the U.S. Energy Information Administration. For a more detailed summary of key economic data and assumptions see Annex 1.
It is impossible to predict Canada's greenhouse gas emissions with certainty, given the importance of the economic drivers and the intrinsic uncertainty related to the evolution of these drivers (e.g. GDP, energy prices) in the future. Government policy also has a significant impact on emissions, (including expected future policies) along with changes in behaviour as individuals place more importance on environmentally-friendly products and businesses adopt more environmentally-friendly processes. While the modeling explicitly recognizes technological progress (e.g., known advanced energy efficient technologies will become more cost-effective over time), it is virtually impossible to predict what new technologies will be developed and commercialized in the future. In this respect, future emissions will be shaped by existing government measures, as well as future measures that will be implemented as part of Canada's plan to reduce emissions to the target established in the Copenhagen Accord.
Taking into account the economic drivers described above, with no major technology changes and factoring in current government measures and land use, land-use change and forestry (LULUCF), results in a baseline scenario whereby emissions reach 720 Mt by 2020 (or 20 Mt below 2005 levels).
Given the uncertainty regarding the economic drivers, this scenario should be seen as one estimate within a set of possible emissions outcomes in 2020, depending on economic developments and underlying assumptions. To get a sense of the sensitivity of emissions to economic developments, emissions were calculated under a series of alternative assumptions involving relatively minor variations in assumed economic growth rates for Canada and world oil prices[7].
For example, under a scenario of high GDP growth, reference world oil prices and no further government action, Canadian emissions, before accounting for contributions from LULUCF, could reach almost 771 Mt by 2020. Alternatively, with low GDP growth and high world oil, 2020 emissions, before accounting for contributions from LULUCF, could be as low as 705 Mt. Figure 2 illustrates these alternative emissions pathways. For a more detailed explanation of this sensitivity analysis, see Annex 2.
Figure 2 - Projected GHG emissions under alternative economic assumptions (excluding LULUCF)
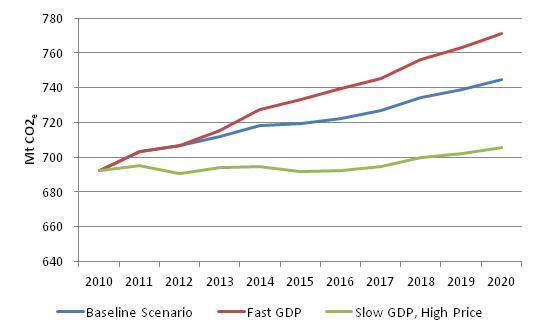
These sensitivities illustrate that Canada's emissions projections should not be interpreted as a precise prediction or forecast of our emissions since, as outlined above, actual emissions will be determined by a range of as yet unknown developments in key drivers. Rather, the projections should be viewed as one plausible outcome for future emissions that provides a reference point for evaluating the impact of economic and technological developments, as well as assessing the impact of existing and future government measures.
It is important to note that the projection of emissions in this report is based on existing government measures as of the spring of 2012 only, and does not reflect the impact of further federal measures that are under development as part of the government's plan to reduce GHG emissions to 607 Mt by 2020, nor new provincial measures that could be undertaken in the future. The impact of government measures on emissions is described in more detail in a later section.
| Cases | Impact on GHG emissions relative to the reference scenario (Mt CO2e) | ||
|---|---|---|---|
| 2005 | 2020 | Change, 2005 to 2020 |
|
| Slow GDP - High World Oil Prices |
740
|
705
|
-35
|
| Fast GDP - Reference World Oil Prices |
740
|
771
|
31
|
| Baseline Scenario |
740
|
745
|
5
|
| Sensitivity Range (including all scenarios examined - see Annex 2) |
740
|
705 to 771
|
-35 to 31
|
National Emissions Projections
Figure 3 depicts the total projected Canadian greenhouse gas emissions[8] in the absence of further government actions for selected years from 1990 to 2020. The projection suggests that Canadian emissions peaked in 2005. By 2020, emissions, including the contribution of LULUCF, are projected to be 720 Mt. This is comparable to the emissions level in 2000.
Figure 3 - Total Canadian GHG emissions and projections (with no further government actions): 1990 to 2020 (Mt CO2e - incl. LULUCF)
Emissions Projections by Sector
Over the last two decades, the Canadian economy has become significantly less energy intensive and there continues to be an accelerated decoupling between economic growth and greenhouse gas emissions levels. Canada's total greenhouse gas emissions in 2010 were 692 Mt, and were essentially unchanged from 2009 levels with only a 0.25% increase.This means that between 2009 and 2010, Canada's emissions remained steady despite economic growth of 3.2%.
However, since a strong connection still remains between economic growth and greenhouse gas emissions, emissions are projected to rise over the period, but at a rate lower than economic growth. As the economy grows beyond 2010, total emissions are expected to begin to increase. Absent further government action, by 2020 emissions are projected to reach 720 Mt, a decrease of 20 Mt from 2005.
Table 3 illustrates how the trends in each economic sector vary based on how economic drivers and government policies shape emissions in that sector. Electricity generation is the one major economic sector that is projected to reduce emissions significantly, in large part due to the combined impact of government measures to create a cleaner electricity system. Electricity emissions are projected to decline by 41 Mt (34%) between 2005 and 2020. On the other hand, increased production in the oil sands is expected to result in overall oil and gas emissions increasing by 44 Mt (28%) between 2005 and 2020.
The following pages provide more detail on expected emissions trends by economic sector.
| 2005 | 2020 | Change, 2005 to 2020 |
|
|---|---|---|---|
| Transportation | 170 | 171 | 1 |
| Electricity | 121 | 80 | -41 |
| Oil and Gas | 160 | 204 | 44 |
| Emissions-Intensive Trade- Exposed Industries | 90 | 83 | -7 |
| Buildings | 85 | 91 | 6 |
| Agriculture | 67 | 65 | -2 |
| Waste and Others | 48 | 51 | 3 |
| Sub-Total | 740 | 745 | 5 |
| Expected LULUCF Contribution | N/A | -25 | -25 |
| Total | 740 | 720 | -20 |
Transportation
Total transportation emissions are projected to increase by about 1 Mt - from 170 Mt in 2005 to 171 Mt by 2020 - a marked deceleration of growth from the historical long-term trend. This deceleration is expected to occur as a result of higher gasoline and refined petroleum prices, and greater fuel efficiency in vehicles being accelerated by federal vehicle emissions regulations[9].
As depicted in Table 4, the transportation sector is comprised of several distinct subsectors - passenger, freight, and air and others (e.g., rail and marine)[10]. Each sector exhibits different trends and responds to a very different mix of technological options. For example, emissions from passenger transportation are projected to decrease by 11 Mt between 2005 and 2020, while those for ground freight and off-road are projected to grow by 11 Mt.
Under both phases of light duty vehicle regulations, spanning model years 2011 to 2025, the fuel efficiency of passenger vehicles will increase by some 35%. The sales-weighted fuel economy of new passenger vehicles is projected to improve from 7.9 L/100km in 2010 to 6.0 L/100km in 2020 and to 5.0 L/100km by 2025.
Likewise, emissions from freight are expected to decrease as a result of various federal, provincial and territorial programs. The recently announced Heavy Duty vehicle regulations will improve the average fuel efficiency of trucks from 2.5 litres/100 tonne-km to 2.1 litres/100 tonne-km by 2020.
“Drilldown” - Light-Duty Vehicle Emissions and Regulations
Transportation is a significant source of GHG emissions in Canada. In 2010, transportation sources accounted for 24% of total Canadian GHG emissions, of which 55% were emissions arising from the light-duty vehicle sub-sector (i.e. cars; small trucks). This has led the Government of Canada to target light-duty vehicles as a high priority for regulations.
In recognition of the integrated North American economies and transportation industry, the governments of Canada and the U.S. have established aligned policies for national regulations to reduce emissions from the transportation sector.
In October 2010, the Government of Canada released the final Passenger Automobile and Light Truck Greenhouse Gas Emission Regulations (LVD1), which prescribes progressively more stringent annual emission standards for new vehicles of model years 2011 to 2016. The Government also published a Notice of Intent for “phase 2” of the regulations to develop more stringent GHG emissions standards for light-duty vehicles of model years 2017 to 2025 (LVD2).
These regulations will achieve significant and sustained GHG reductions and fuel saving benefits. By 2020, preliminary estimates suggest that Canadian regulations for model years 2011 to 2016 will lead to annual reductions of between 9 and 10 Mt in Canada. Preliminary estimates also suggest that the proposed regulations for model years 2017 to 2025 will contribute to achieving the Copenhagen 2020 target by reducing GHG emissions by an additional 2 to 3 Mt in 2020. Greenhouse gas emissions are expected to be reduced further beyond 2020, as the 2021 to 2025 reductions come into effect.
Under the first phase of the regulations, the average fuel efficiency of new vehicles is projected to increase by 15% between 2010 and 2016. The regulations continue to establish progressively stringent annual fleet average emission standards. Under the second phase of the regulations, average fuel efficiency of new vehicles is projected to increase by 37% between 2016 and 2025. Overall, the cumulative improvement from LDV1 and LDV2 is projected to increase the average fuel efficiency of new vehicles by 57% over the period from 2010 to 2025.
Unconventional vehicles (those that use diesel, alternative fuels, and/or hybrid electric systems) are projected to play a significant role in meeting more stringent fuel economy standards. This means that companies will continue to offer a full range of vehicle types to meet the transportation needs of Canadians, but that consumers can expect to see a greater choice of alternative vehicles available for sale. As a result, it is anticipated that the market penetration of existing advanced technology vehicles, such as hybrid-electric vehicles (e.g. Toyota Prius), plug-in hybrid-electric vehicles (e.g. Chevrolet Volt) and fully-electric vehicles (e.g. Nissan Leaf), will increase in Canada.
These vehicles have the potential to allow driving habits to change significantly, but, at the same time, reduce CO2emissions significantly. Moreover, electric vehicles offer zero tail pipe emissions since electricity is generated at centralized utilities which would significantly reduce localized smog and other air pollutant emissions.
Consumers that purchase a vehicle would be expected to recover any higher upfront costs through fuel savings between 5 to 8 years for passenger cars, and a period of only 2 to 4 years for light trucks. In fact, the lifetime fuel savings for a vehicle is projected to be 2 to 3 times the estimated increase in vehicle cost or approximately $1,950 in 2025. Thus, the performance standard represents an economically efficient and low cost approach to emissions reductions. Under these regulations, greenhouse gas emissions from light-duty vehicles are projected to decrease by 16% between 2005 and 2020. Moreover, these regulations will have a significant impact on total transportation emissions. Canadian average annual Transport greenhouse gas emissions increased at 1.9% per year over 1990 to 2000 while they are projected to increase by only 0.4% on average over 2010 to 2020. As the second phase of the regulations take hold, and regulations for Heavy Duty Trucks increasingly impact other transport subsectors, average annual transport GHG emissions decrease by 4% from 2020 to 2030.
It is projected that there will be almost 26 million vehicles on the road by 2025. The emissions reduction of 15% due to the full phase in of LDV1 and LDV2 over the period from 2010 to 2025 would be equivalent to removing approximately 3.7 million vehicles from the road.
Oil and Gas
This projection does not include the impact of future oil and gas regulations. While work is currently underway, we have not yet reached a point where the effects can be reliably quantified. It is anticipated that these regulations will be included in Canada's Emission Trends in the future, and this inclusion will result in significant additional reductions by 2020 relative to the projections herein.
Upstream Oil and Gas Production
Absent further government action, emissions from upstream oil and gas production, including pipelines but excluding refining and upgrading[11], are estimated to grow from 125 Mt in 2005 to 160 Mt in 2020. This increase is primarily driven by the growth in bitumen production, where emissions are expected to increase from 19 Mt in 2005 to about 80 Mt by 2020. Specifically, emissions from oil sands mining are projected to double while emissions from in situ production are expected to increase more than five times from 10 Mt in 2005 to 55 Mt in 2020.
Over this same period, emissions from conventional crude oil production are expected to fall from 33 Mt in 2005 to 27 Mt in 2020, while those from natural gas production and processing are expected to fall from about 57 Mt in 2005 to 44 Mt by 2020.
Emissions from the pipeline transport of oil and natural gas are expected to fall from about 16 Mt in 2005 to 9 Mt by 2020. The emissions associated with the upgrading of oil-sands bitumen[12] are expected to rise from 14 Mt in 2005 to 23 Mt by 2020. Further details on emissions from oil-sands upgrading are reported in the section below dealing with the refining industry.
| 2005 | 2010 | 2020 | Absolute Change 2005 to 2020 |
||
|---|---|---|---|---|---|
| Natural Gas Production and Processing | 57 | 46 | 44 | -13 | |
| Conventional Oil Production | 33 | 29 | 27 | -6 | |
| Conventional Light Oil Production | 10 | 9 | 9 | -1 | |
| Conventional Heavy Oil Production | 21 | 18 | 15 | -6 | |
| Frontier Oil Production | 2 | 2 | 2 | 0 | |
| Oil Sands | 32 | 48 | 104 | 73 | |
| Bitumen In situ | 10 | 18 | 55 | 45 | |
| Bitumen Mining | 9 | 13 | 25 | 16 | |
| Bitumen Upgrading | 14 | 17 | 23 | 9 | |
| Oil and Natural Gas Transmission | 16 | 11 | 9 | -7 | |
| Downstream Oil and Gas | 22 | 20 | 20 | -2 | |
| Petroleum Products | 20 | 18 | 18 | -2 | |
| Natural Gas Distribution | 2 | 2 | 2 | 0 | |
| Total | 160 | 154 | 204 | 44 | |
| 2005 | 2010 | 2020 | |
|---|---|---|---|
| Conventional Oil Production | |||
| Emissions (Mt CO2e) | 33 | 29 | 27 |
| Production (1,000 barrels/day) | 1361 | 1228 | 1112 |
| Natural Gas Production [13] and Processing (including Pipelines) | |||
| Emissions (Mt CO2e) | 57 | 46 | 44 |
| Production (billion cubic foot (BCF))[14] | 6951 | 5868 | 4711 |
| Bitumen Production | |||
| Emissions (Mt CO2e) | 19 | 31 | 80 |
| Production (1,000 barrels/day) | 1064 | 1614 | 3263 |
Petroleum Refining and Upgrading
Table 7 displays emissions associated with petroleum refining and upgrading. As noted above, the greenhouse gas emissions from upgrading bitumen into synthetic crude oil are included in the petroleum refining industry category. From 2005 to 2020, emissions from bitumen upgrading are projected to increase by 9 Mt, while emissions from petroleum refining are projected to decline by 2 Mt.
| 2005 | 2010 | 2020 | |
|---|---|---|---|
| Traditional Refineries | |||
| Emissions (Mt CO2e) | 20 | 18 | 18 |
| Refined Petroleum Processed (1,000 barrels/day) | 2165 | 2144 | 2359 |
| Upgraders | |||
| Emissions (Mt CO2e) | 14 | 17 | 23 |
| Upgraded Products (1,000 barrels/day) | 611 | 865 | 1359 |
Electricity Generation
Emissions from electricity generation and distribution have historically increased over time as a result of the need to increase generating output to supply a growing economy. However, emissions from this sector are now declining, and that trend is expected to continue over the next decade. Between 2005 and 2020, electricity generation emissions are expected to decrease by 41 Mt, from 121 Mt in 2005 to 80 Mt in 2020, as a result of the federal Emissions Performance Standard for coal-fired electricity generation as well as provincial measures to shift away from coal as a fuel source and measures to encourage the development of renewables.
| 2005 | 2010 | 2020 | |
|---|---|---|---|
| Emissions (Mt CO2e) | 121 | 99 | 80 |
| Generation (TWh) | 557 | 529 | 598 |
Against a backdrop of decreasing coal power usage, fossil fuel generation is expected to vary with the availability of electricity from hydro, nuclear and renewable power sources such as wind. Hydro power generation is expected to increase throughout Canada, although the growing demand for electricity in Alberta is expected to continue being met primarily through increased generation from coal and natural-gas-fuelled power plants[15]. On a national level, electricity generation from natural gas, a relatively cleaner form of energy than coal, is expected to double between 2005 and 2020.
| 2005 | 2010 | 2020 | Absolute Change 2005 to 2020 |
|
|---|---|---|---|---|
| Coal | 98 | 80 | 57 | -41 |
| Refined Petroleum Products | 9 | 2 | 3 | -6 |
| Natural Gas | 13 | 16 | 19 | 6 |
| Non-combustion | 0 | 0 | 0 | 0 |
| Total | 121 | 99 | 80 | -41 |
The proportion of utility electricity generation coming from wind power and other renewable sources (other than hydro and nuclear) increases in the 2005 to 2020 period, starting at only about 0.3% in 2005 and reaching 6% of total generation by 2020. These forms of electricity generation are assumed to be emissions free.
Emissions-Intensive and Trade-Exposed Industries
As shown in Tables 10 and 11, emissions in the emissions-intensive trade-exposed (EITE) industries (which include, among others, chemicals, pulp and paper, cement and iron and steel) are expected to experience modest growth as the economy recovers in 2010 and onwards. By 2020 emissions are projected to be 7 Mt lower than 2005 levels, at 83 Mt.
| 2005 | 2010 | 2020 | |
|---|---|---|---|
| Emissions (Mt CO2e) | 90 | 75 | 83 |
| Gross Output of EITE sectors (1997 $billions) | 139 | 121 | 134 |
Emissions remain stable over the 2005 to 2020 projection period in most of the EITE subsectors, owing to modest growth and continued improvements in emission intensities. Emissions are expected to decrease in the pulp and paper and base metal smelting subsectors while mining is increasing.
Buildings
Residential
As shown in Table 12, greenhouse gas emissions from the residential sector (e.g., houses, apartments and other dwellings) are expected to remain stable between 2005 and 2020.
The number of households, which is a key driver of growth in residential sector emissions, is expected to increase by 2.8 million from 2005 to 2020 but residential emissions are almost flat throughout this period. This is largely due to federal and provincial measures aimed at increasing the energy efficiency of residential buildings (e.g., building code regulations and incentives/rebates for energy efficiency improvements).
| 2005 | 2010 | 2020 | |
| Emissions (Mt CO2e) | 42 | 41 | 43 |
| Households (Millions) | 12.1 | 13.0 | 14.74 |
Service Industry
Greenhouse gas emissions from Canada's service industry are expected to increase by 5 Mt from 2005 to 2020 to 48 Mt (Table 13), mainly as a result of expansion of commercial floor space. As in the residential sector, emissions growth in the commercial sector is significantly dampened by federal and provincial measures incorporated into this analysis, such as building code regulations, energy efficiency standards, and other programs.
| 2005 | 2010 | 2020 | |
|---|---|---|---|
| Emissions (Mt CO2e) | 43 | 38 | 48 |
| Floor space (Millions m2) | 1106 | 1248 | 1552 |
Agriculture
The agriculture sector produces emissions of three greenhouse gases: carbon dioxide, methane and nitrous oxide. Carbon dioxide emissions are released from fossil fuel combustion in farm machinery; methane emissions arise from livestock manure and ruminant animals; and nitrous oxide emissions arise from fertilizer usage, crops and manure and crop residue burning. Emissions from the agriculture sector are projected to decrease by 4 Mt from 69 Mt in 2010 to 65 Mt in 2020.
| 2005 | 2010 | 2020 | |
|---|---|---|---|
| Agriculture[16] | |||
| On-Farm Fuel Use | 9 | 13 | 10 |
| Crop Production | 19 | 22 | 22 |
| Animal Production | 39 | 33 | 33 |
| Total | 67 | 69 | 65 |
Waste and Others
This sector includes emissions from waste management as well as from non-emissions-intensive industrial sectors. Emissions from this sector are projected to grow moderately, leading to emissions growth of 3 Mt between 2005 and 2020.
Emissions from waste management arise from three sources: emissions from the decomposition of solid waste in landfill sites, emissions from wastewater treatment and incineration of waste. These emissions represent 6% of total GHG emissions in 2010. For these emissions, population and households are the main drivers. Provincial measures aimed at recycling and emissions capture from landfill sites are projected to help keep emissions growth below the growth in population and household formation. Emissions from waste are projected to remain stable.
Emissions from other industrial sectors represent a wide variety of operations and include construction, forestry as well as light-manufacturing facilities (e.g. food and beverage, and electronics) and coal production. These industries are projected to grow moderately, leading to emissions growth of 2 Mt between 2005 and 2020.
| 2005 | 2010 | 2020 | |
|---|---|---|---|
| Waste & Others | |||
| Waste | 22 | 22 | 23 |
| Coal Production | 2 | 5 | 3 |
| Light Manufacturing, Construction & Forest Resources | 23 | 23 | 25 |
| Total Waste and Others | 48 | 50 | 51 |
Emissions by Province
Emissions vary significantly by province, driven by diversity in population size, economic activities, and resource base among other factors. For example, provinces where the economy is oriented more toward resource extraction have more uncertainty around the timing of large projects and will tend to have higher emission levels whereas more manufacturing or service-based economies tend to have lower emissions levels. Electricity generation sources also vary, with provinces that rely on fossil fuels for their electricity generation having higher emissions than provinces that rely more on hydroelectricity. Table 16 shows the provincial/territorial distribution of emissions in absolute terms as well as their per capita emissions.
The provinces oriented toward resources extraction and/or are highly reliant on fossil fuels for their electricity generation (i.e., Alberta, Saskatchewan, New Brunswick, and Nova Scotia) have per capita emissions above the national average. The provinces oriented toward manufacturing or services or are highly reliant on hydroelectricity or less emission intensive sources for their electricity generation (i.e., Quebec, British Columbia, Ontario, Newfoundland and Labrador and Manitoba) have per capita emissions below the national average.
| GHG Emissions (Mt CO2e) | Per Capita Emissions (t/capita) | |||
|---|---|---|---|---|
| 2005 | 2010 | 2005 | 2010 | |
| British Columbia | 63 | 56 | 15.0 | 12.4 |
| Alberta | 232 | 236 | 69.8 | 63.4 |
| Saskatchewan | 71 | 73 | 71.1 | 69.8 |
| Manitoba | 21 | 20 | 17.9 | 16.3 |
| Ontario | 206 | 172 | 16.4 | 13.0 |
| Quebec | 86 | 82 | 11.4 | 10.4 |
| New Brunswick | 22 | 18 | 29.8 | 24.5 |
| Nova Scotia | 24 | 20 | 25.3 | 21.7 |
| Newfoundland | 10 | 9 | 19.8 | 16.9 |
| Prince Edward Island | 2 | 2 | 16.2 | 13.8 |
| Territories | 2 | 2 | 21.9 | 18.8 |
| Canada | 740 | 692 | 22.9 | 20.3 |
Table 17 displays projected provincial and territorial greenhouse gas emissions from 2005 to 2020. The projected emissions reflect a diversity of economic factors and government measures to reduce GHG emissions. These include public education campaigns, energy efficiency and renewable electricity programs, greening government operations carbon taxes or levies (i.e., British Columbia, Alberta and Quebec), regulatory measures, and legislated renewable electricity targets[17].
It should be noted that the increase in emissions in British Columbia and Alberta are driven by large natural resource projects; oil sands in the case of Alberta and natural gas in the case of British Columbia. For the most part, the oil and natural gas production projections reflect the views of the National Energy Board outlook for projects in these provinces, but there is an intrinsic level of uncertainty as to the timing of them that affects the projected GHG emissions[18]. The decline in emissions from 2005 to 2020 in Saskatchewan, Ontario, New Brunswick and Nova Scotia are due in large part to government measures related to coal-fired electricity.
| 2005 | 2010 | 2020 | Change 2005 to 2020 |
|
|---|---|---|---|---|
| British Columbia | 63 | 56 | 72 | 9 |
| Alberta | 231 | 237 | 285 | 53 |
| Saskatchewan | 71 | 73 | 64 | -7 |
| Manitoba | 21 | 20 | 21 | 0 |
| Ontario | 206 | 172 | 167 | -39 |
| Quebec | 86 | 82 | 85 | -1 |
| New Brunswick | 23 | 19 | 17 | -5 |
| Nova Scotia | 24 | 20 | 17 | -7 |
| Prince Edward Island | 2 | 2 | 2 | 0 |
| Newfoundland | 10 | 9 | 10 | 0 |
| Territories | 2 | 2 | 3 | 1 |
| LULUCF | -25 | |||
| Canada | 740 | 692 | 720 | -20 |
Table 18 displays projected provincial and territorial per capita greenhouse gas emissions in 2020 and compares them to actual emissions in 2005 and 2010. Per capita emissions are projected to fall in all provinces in 2020, except for British Columbia and Alberta. British Columbia's per capita emissions are projected to increase due to the pace of natural gas development. Despite this increase, British Columbia's per capita emissions are projected to remain below the national average.
| 2005 | 2010 | 2020 | |
|---|---|---|---|
| British Columbia | 15.0 | 12.4 | 14.3 |
| Alberta | 69.8 | 63.4 | 63.6 |
| Saskatchewan | 71.1 | 69.8 | 54.7 |
| Manitoba | 17.9 | 16.3 | 15.1 |
| Ontario | 16.4 | 13.0 | 11.7 |
| Quebec | 11.4 | 10.4 | 10.0 |
| New Brunswick | 29.8 | 24.5 | 21.8 |
| Nova Scotia | 25.3 | 21.7 | 18.1 |
| Prince Edward Island | 16.2 | 13.8 | 12.3 |
| Newfoundland | 19.8 | 16.9 | 20.3 |
| Territories | 21.9 | 18.8 | 26.8 |
| Canada | 22.9 | 20.3 | 19.2 |
Importance of the LULUCF Sector
The United Nations Framework Convention on Climate Change (UNFCCC) has recognized the important role of the “land use, land-use change and forestry” (LULUCF) sector in addressing climate change. The LULUCF sector involves greenhouse gas (GHG) fluxes between the atmosphere and Canada's managed lands, as well as those associated with land-use change. Globally, land-use change was responsible for estimated net carbon flux to the atmosphere of about 1.47 GtC in 2005. In comparison, global carbon dioxide (CO2) emissions from fossil-fuel burning and cement manufacture emitted about 8.09 GtC in 2005[19].
Land management activities can either act as a carbon dioxide sink (i.e., remove CO2 from the atmosphere) or a GHG source (emit CO2 and other GHGs to the atmosphere). For example, afforestation, or planting trees on non-forest land, removes carbon from the atmosphere as the trees grow; but deforestation, or conversion of forest land to other land uses, will increase CO2 emissions due to decomposition or burning of the biomass.
LULUCF is a particularly important sector for Canada given that 10% of the world's forests are in Canada and our managed forest covers 229 million hectares, more than the managed forest of the entire European Union. Canada also has 47 million hectares of cropland.
Over the last two decades, important changes have occurred in land management practices in Canada that have reduced CO2 emissions or enhanced their removals from the atmosphere. For example, farmers have increasingly adopted no-till practices and reduced summer fallow practices, thereby increasing the rate of soil carbon sequestration. Best practices have also been adopted by the forestry sector, primarily as a result of provincial policies and/or regulations in their areas of jurisdiction.
Although these policies and regulations are aimed broadly at improving sustainability in the sector, they also reduce carbon emissions and increase sequestration. They include: relatively more reliance on tree planting as opposed to natural regeneration; more use of improved seed stock for tree planting; more and faster rehabilitation of harvest roads and landings; and adjustment in management practices to reduce soil compaction. Recently, economic factors have had a large impact on the forest sector which experienced a 43% decline in harvest levels between the peak year of 2004 and 2009, resulting in the lowest harvest since 1975[20].
Accounting for the LULUCF Sector
While GHG emissions from the LULUCF sector are included in Canada's annual National Inventory Report, the sector was left out of Canada's first national Emissions Trends report published in 2011, primarily as a result of technical challenges in forecasting emissions and removals from LULUCF and because accounting approaches for the sector had not yet been determined.
A unique challenge in forecasting LULUCF emissions resides in addressing the effects of natural disturbances (e.g. wildfires, insect infestations such as the mountain pine beetle), which can result in significant variations in the annual emission and removal estimates but are very difficult to project. The impact of natural disturbances also makes it difficult to discern the effects of improved management practices.
Environment Canada's National Inventory Report, which is used to measure current Canadian GHG emissions, currently includes estimates of emissions and removals with natural disturbances. The National Inventory Report is submitted to the United Nations Framework Convention on Climate Change (UNFCCC) on an annual basis.
The difficulties related to accounting for LULUCF emissions and removals are widely-recognized in the international community. In particular, challenges related to natural disturbances have been the subject of considerable technical work over the past several years. Acknowledging that natural disturbances are out of human control, it was finally agreed at the 2011 UNFCCC Climate Conference in Durban, South Africa, that the impacts of natural disturbances can be removed in accounting for forest management in 2013 and thereafter.
The UNFCCC guidelines for GHG inventory reporting were also updated in Durban to allow reporting estimates that better represent the direct effect of human activities, taking into account national circumstances. These new guidelines will come into effect for the 2015 National Inventory Report submission. Going forward, and on the basis of these new decisions, Canada will continue to explore options for revised reporting that provides a more accurate representation of emissions arising from human activities.
In a spring 2012 submission to the UNFCCC, Canada, along with a number of other countries, stated its intent to include the LULUCF sector in its accounting of GHG emissions towards its 2020 target, noting that emissions and related removals resulting from natural disturbances would be excluded from the accounting.
This 2012 Emissions Trends Report represents a key milestone for Canada in moving towards the inclusion of the LULUCF sector in projecting GHG emissions. While the estimates presented are preliminary in nature and will change as a result of ongoing efforts to improve data and methodology, as well as continued analysis of various approaches to accounting for LULUCF, they provide a solid first step toward understanding the underlying trends of LULUCF that will enable a policy discussion and the implementation of new measures to make further progress towards Canada's GHG reduction goals.
Subsector Analysis
Environment Canada, in partnership with Natural Resources Canada and Agriculture and Agri-Food Canada, has undertaken research and analysis over the past year to develop preliminary projections of LULUCF emissions and removals. Projected business-as-usual emissions and removals (i.e. in the absence of new policies that contribute to mitigation) have been estimated to 2020 for each of the following subsectors: forest management, cropland management, deforestation and afforestation[21]. Table 19 below shows preliminary results for each of the subsectors assessed.
| (In Mt of GHG emissions/removals) | 2020 Projected Emissions/ Removals | 2005 Estimate/ Reference Level | Expected Contribution to 2020 Emissions |
|---|---|---|---|
| * For forest management, a 2020 reference level is used for comparison (explained in further detail below). ** As a conservative estimate, the total is rounded down to 25 Mt, given that estimates are preliminary and will be revised as modeling methodology, accounting approaches and data are further refined. |
|||
| Forest Management | -148.7 | -122.6* | -26.1 |
| Cropland Management | -9.8 | -10.0 | +0.2 |
| Deforestation | +13.8 | +14.2 | -0.4 |
| Afforestation | -1.3 | -0.6 | -0.7 |
| Totals | -146 | -119 | ≈-25** |
Each subsector's contribution to Canada's 2020 emissions reduction target is estimated using an accounting approach that compares projected business-as-usual 2020 emissions/removals to 2005 emissions/removals, with the exception of forest management, where 2020 projected emissions/removals are compared to a 2020 reference level.
The rules agreed in Durban for LULUCF included a reference level for forest management, proposed by Canada, for the 2013 to 2020 period[22]. Canada's reference level is consistent with data in the National Inventory Report and was derived by assuming that future harvests in 2013 to 2020 would be the same as the average historical level between 1990 and 2009. As well, the reference level excluded all natural disturbance impacts after 2009, except a low background level expected to occur every year. As Canada's target is focused on the single year of 2020, the 2020 value used in constructing the reference level is used here. The reference level approach factors out highly variable natural disturbance impacts.
In Durban, parties agreed to LULUCF accounting rules for the Kyoto Protocol's second commitment period. Parties to the UNFCCC that will not take a second commitment period may follow these rules but are not bound to do so. The U.S., for example, in a submission to the UNFCCC in 2012, indicated it will include LULUCF when accounting for its 2020 target and that it will use a net-net approach for the LULUCF sector with a 2005 base-year. Canada's submission stated that LULUCF will be accounted for using either a 2005 base-year or a reference level.
Given this context, Canada's work to analyze alternative accounting approaches is ongoing, and adjustments to the accounting approach may be made in future Emissions Trends reports. In particular, alternative accounting approaches may need to be considered given that accounting approaches for LULUCF continue to vary internationally and there remains uncertainty with respect to future approaches under a proposed new climate change agreement beyond 2020.
Subsector Emission Trends and Methodologies
Further detail on Canadian emission trends and methodologies used are provided for each of the subsectors below:
- Forest Management[23]. As per Table 19, the Forest Management subsector dominates the expected LULUCF contribution in 2020, as a result of declining harvest rates. Harvesting is the human activity with the most impact on emissions in the managed forest. Harvest levels declined by 43% between the peak harvest year of 2004 and a 35-year low in 2009 before recovering somewhat in 2010. Current projections suggest that harvests will remain below the recent average historical level used in estimating the reference level. The projected value for the forest management sink in 2020 is derived by using projected harvests to 2020 and assuming no natural disturbances from 2010 onward except a low background level expected to occur every year, compared with the reference level.
- Cropland Management[24]. Due largely to the uptake of new farming practices (e.g. the increased adoption of no-till), soil carbon sequestration in Canada has increased over time from a rate of 1.5 Mt per year in 1990 to 1.3 Mt per year in 2010 (NIR, 2012). Currently, most of the land where no-till makes economic sense is already using this practice, so there is limited scope for increased uptake. Furthermore, the potential for land that has been in no-till for a long time (i.e. in excess of 20 years) to sequester more carbon decreases over time. Therefore, while soils will continue to sequester carbon (at a projected rate of 9.8 Mt in 2020), they will do so at a lower annual rate than in 2005 (when the rate was 10 Mt). Because accounting for emissions/removals for cropland management is on a net basis relative to 2005, this results in a small reduction in the overall LULUCF contribution in 2020. However, this does not indicate that a reversal of the stock of carbon in the soil has occurred.
- Deforestation/Afforestation[25]. Current deforestation rates in Canada are estimated at 44,000 hectares per year, down from 65,000 hectares per year in 1990. Part of the emissions due to deforestation occurs immediately upon the deforestation event, while the remaining emissions take place over subsequent years and decades. Deforestation emissions are projected to decline slightly to 2020 relative to 2005, whereas afforestation removals are expected to increase as a result of a slow increase in the area planted since 1990 and growth of the trees. The circumstances surrounding deforestation activities in Canada are extremely varied and involve a wide range of economic sectors (agriculture, urban expansion, resource extraction). As such, projections presented in this report will be adjusted as a result of revised projections of economic growth and conditions for each of these sectors.
Work is currently underway to also develop estimates for Peatland Management that will be added to next year's LULUCF estimates.
Contribution of the LULUCF Sector to 2020 Projected Emissions
On the basis of preliminary estimates, the projected contribution of the LULUCF sector to achieving the 2020 target is approximately 25 Mt. This estimated contribution, while illustrative of the potential, may change as subsector projections are refined over time as a result of further analysis, new data, updated projections, or adjusted accounting approaches.
As the Government of Canada works towards achieving its climate change objectives, it will consider, along with its provincial and territorial partners, policy actions to achieve further mitigation results from the LULUCF sector. Key LULUCF activities in Canada with potential for increasing mitigation benefits through reducing emissions or increasing removals include changing forest management practices, increasing afforestation, decreasing deforestation, enhancing agricultural practices that sequester carbon and possibly restoring managed peatlands. In addition to climate change mitigation, such efforts could positively impact other environmental or economic objectives. For example:
- Deforesting one hectare of forest emits on average approximately 300 tonnes of CO2e; policies aimed at reducing deforestation would have climate change benefits and could also address other environmental issues, such as biodiversity conservation.
- Increased adoption of farming practices such as no-till will also provide long-term benefits to farmers by improving soil quality and reducing erosion while increasing soil carbon sequestration.
- Mitigation practices such as increasing afforestation, reducing deforestation or restoring abandoned peatlands can also lead to creation and protection of wildlife refuges.
Emissions Intensity Improvements and Federal, Provincial and Territorial Actions
Last year, Canada's 2020 GHG emissions were projected to be 785 Mt in 2020. Since that time, there have been several key developments and GHG emissions are now projected to be 65 Mt lower at 720 Mt in 2020. This is despite the fact that GDP is projected to be slightly higher in 2020 in this year's projection. This reduction in GHG intensity implies a greater decoupling of emissions and economic growth.
As shown in Figure 4, while GDP growth is similar when compared with last year's report, emissions growth is slower. While GDP is expected to grow approximately 2.3% per year between 2010 and 2020, GHG emissions are only expected to grow 0.4% per year over the period. This leads to a total emissions intensity improvement of 14% over the period - an increase over the 13% improvement in last year's report.
In addition to the inclusion of reductions associated with LULUCF, there are a number of factors contributing to the increased emissions intensity improvement.
Figure 4 - Decoupling of GDP and GHG emissions - 2010 to 2020
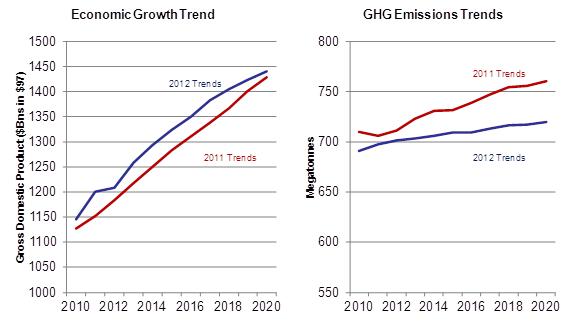
First, this year's projections have a new, lower starting point as the most recent data show emissions were significantly lower in 2010 than previously estimated. Last year, emissions were estimated to be 710 Mt and since that time, preliminary data collected by Statistics Canada and assessed for the National Inventory Report put Canada's actual emissions in 2010 at 692 Mt. Contributing factors to this change were lower than expected natural gas production and slower growth in some emissions-intensive sectors.
Secondly, economic growth is projected to be slower in some emissions-intensive and light industry sectors. Projected sectoral shifts in the economy are contributing to the improvement in emissions intensity. Compared to last year's report, projected growth for the EITE sectors, specifically iron and steel and pulp and paper, is now lower, while it is now higher for the service industries which are less emissions intensive. GDP in Canada's services industry, where emissions intensity is low, increases as a share of the total. This reduces projected emissions in 2020, even though total GDP is projected to be slightly higher.
| 2011 Trends | 2012 Trends | Change from last year's report |
|
|---|---|---|---|
| Electricity | 1.7 | 1.9 | +0.2 |
| Oil and Gas | 2.5 | 2.6 | +0.1 |
| Emissions-Intensive Trade- Exposed Industries | 4.2 | 3.9 | -0.3 |
| Light Industry | 18.7 | 17.8 | -0.9 |
| Agriculture | 1.3 | 1.4 | +0.1 |
| Total Goods | 28.5 | 27.6 | -0.9 |
| Total Services | 71.5 | 72.4 | +0.9 |
Thirdly, progress is being made to reduce emissions. Supported by existing government measures, there is greater response from consumers and businesses to reduce emissions. Emissions are also declining with additional federal, provincial and territorial measures. In addition, additional federal emissions regulations for light-duty vehicles for the 2017-2025 period as well as heavy-duty vehicle regulations were included as well as recent provincial actions (e.g., Quebec's cap-and-trade, Nova Scotia's emissions cap for electric utilities, increased stringency of building energy codes, equipment standards and requirements for capturing methane from landfill gas). Additional details on these existing federal and provincial measures are provided in Annex 1.
More work is required to achieve the reductions required to meet the Canadian target. Work is underway that will lead to additional reductions. As the government advances additional measures under its climate change plan, future emission reductions will continue to accumulate, thereby pushing projected emissions in 2020 down towards the levels required to meet the 2020 target. For example, the Government of Canada is currently working in partnership with the oil and gas industry to regulate greenhouse gas emissions. Once the details of these measures have been announced and they are taken into account in the baseline scenario, projected emissions in 2020 will decline further below the projected levels shown here. Similarly, once additional measures in other sectors and additional provincial actions are announced and taken into account, projected emissions in 2020 will decline even further.
Key Economic Drivers and Assumptions
Many factors influence the future trends of Canada's greenhouse gas emissions. These key factors include the pace of foreign and domestic economic growth as well as its composition, population and household formation, energy prices (e.g., world oil price and the price of refined petroleum products, regional natural gas prices, and electricity prices), technological change, and policy decisions. Varying any of these assumptions could have a material impact on the emissions outlook.
In constructing the emissions projections, Environment Canada developed alternative views of changes in key drivers (e.g., world oil price, the pace of economic growth) that result in a range of plausible emissions growth trajectories. The baseline emissions projections scenario represents the mid-range of these variations, but remains conditional on the future path of the economy, world energy markets and government policy. The assumptions and key drivers are listed in this section. Alternative cases are explored in the sensitivity analysis in Annex 2 of the paper.
The emissions projections baseline scenario is designed to incorporate the best available information about economic growth as well as energy demand and supply into the future. The projections capture the impacts of future production of goods and services in Canada on greenhouse gas emissions.
Economic assumptions are based on the Government of Canada's short-term economic outlook contained in Finance Canada's Budget 2012 private sector economic survey. Long-term economic projections were developed using The Informetrica Macro-Economic Model(TIM) and are tuned to productivity growth projections and Statistics Canada's population growth projections. With respect to major energy supply project assumptions, Environment Canada typically adopts either the National Energy Board or Natural Resources Canada's view regarding the evolution of Canada's energy supply sector. For the emissions outlook in this report, forecasts of major energy supply projects are based on the National Energy Board's Fall 2011 Outlook, as their assumptions reflect their most recent views regarding the evolution of Canada's energy supply sector.
The projections also incorporate data from the National Inventory Report 1990-2010: Greenhouse Gas Sources and Sinks in Canada, the National Energy Board, and the U.S. Energy Information Administration for the latest information on key parameters.
Economic Growth
Canadian real gross domestic product (GDP) in 2010 was an estimated $1,146 billion ($1997). This represents an average annual real GDP growth rate of about 2.4% over the twenty previous years.
The short-term economic outlook underlying the emissions reference case is grounded in the GDP growth forecast contained in Budget 2012. The Department of Finance regularly surveys private sector economic forecasters on their views on the outlook for the Canadian economy. The economic forecasts reported in this fiscal update, and which also form the basis of the department's fiscal forecasts, are based on a survey from March 2012 and includes the views of 14 private sector economic forecasters[26].
The Canadian economy is expected to show strong growth of about 3.1% per year to 2014. This growth is expected to continue at a slightly slower pace into the future, as annual rate of growth in real GDP decreases to approximately 1.8% in the period 2014 to 2020.
| 1990-2005 | 2005-2010 | 2010-2020 | |
|---|---|---|---|
| Gross Domestic Product | 2.8% | 1.2% | 2.3% |
| Industrial Gross Output | 2.8% | 0.8% | 2.3% |
| Real Disposable Personal Income | 1.6% | 4.2% | 2.4% |
| Consumer Price Index | 2.1% | 1.6% | 1.8% |
Gross output, which is a proxy for industrial production, is also projected to show significant growth. It is expected to increase by about 16% by 2015 and 26% by 2020, relative to 2010 levels.
The growth in the labour force and changes in labour productivity influence the changes in Canada's real gross domestic product (GDP). For example, the slowing growth in the labour force contributes to a reduced GDP growth rate after 2014. The deceleration of the GDP growth rate is, however, not as pronounced as that of the labour force, as labour productivity is expected to increase owing to higher capital formation. Labour productivity is expected to increase on average by 1.4% per year between 2010 and 2020.
Population Dynamics and Demographics
The population size and its characteristics (e.g., age, sex, education, household formation, among others), and their evolution through time, have important impacts on energy demand. Canada's overall population is projected to grow on average at an annual rate of 1% between 2010 and 2015, slowing to 0.9% between 2015 and 2020. Major demographic factors that can have measurable impacts on energy consumption are summarized below:
- Household formation. This is the main determinant of energy use in the residential sector. The number of households are expected to increase on average by 1.3% per year between 2010 and 2015, and by 1.2% between 2015 and 2020.
- Labour force. This is expected to have a decelerating growth rate, reflecting the aging population. Its annual average growth rate is expected to be 1.1% between 2010 and 2015 falling to 0.6% between 2015 and 2020.
- Population of driving age. This is an important factor in determining gasoline and diesel consumption. It is expected to increase on average by 1.1% per year between 2010 and 2015, by 0.9% between 2015 and 2020.
World Crude Oil Price
A major factor in projected greenhouse gas emissions is the assumption made about future world oil prices. Canada is a price taker in crude oil markets as its shares of world oil production and consumption are not large enough (4% and 2% respectively) to significantly influence international oil prices. West Texas Intermediate (WTI) crude oil is used as an oil price benchmark. North American crude oil prices are determined by international market forces and are most directly related to the WTI crude oil price at Cushing, which is the underlying physical commodity market for light crude oil contracts for the New York Mercantile Exchange (NYMEX). WTI crude has an American Petroleum Institute gravity[27](API) of 40 degrees and a sulphur content of less than 0.5%. It should be noted that the increase in North American supply and the resulting transportation bottleneck at Cushing have created a historic disconnect between the WTI and Brant. As such, the North American oil market is currently being priced differently from the rest of the world.
The emissions outlook's reference case is anchored by the world oil price assumptions developed by the National Energy Board. According to the National Energy Board, the world crude oil price for WTI is projected to increase slightly from about US$80/bbl in 2010 to about US$102/bbl in 2020. A higher price scenario, in which 2020 prices are US$142/bbl, is used for sensitivity analysis. Under the higher price case, greenhouse gas emissions are expected to be lower.
Figure A.1.1 - Crude oil price: WTI, Western Canada Select and Alberta Heavy ($US 2010/bbl)
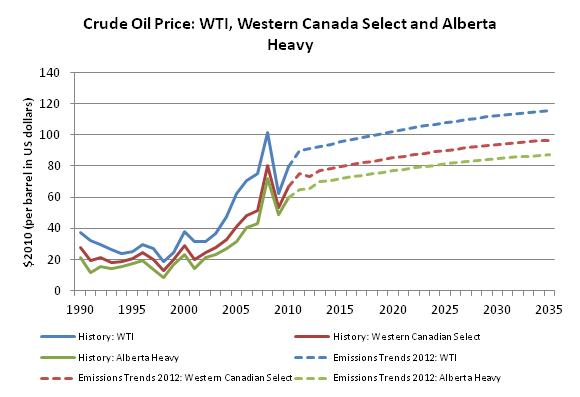
Figure A.1.1 shows crude oil prices for light crude oil (WTI), for Western Canadian Select, which is a Hardisty based blend of conventional and oilsands production managed by Canadian Natural Resources, Cenovus Energy, Suncor Energy, and Talisman Energy and for Heavy oil. As shown in Table A.1.4, historically the price of heavy oil/bitumen has followed the light crude oil price (WTI), but at a discount of between 50 and 60%. However, in 2008 and 2009 the differentials between the prices of light and heavy crude oils narrowed significantly owing to a global shortage of heavier crude oil supply. The bitumen/light-medium differential averaged 22% over the 2008 to 2009 period, compared with 44% over the five-year average from 2003 to 2007.
Alberta's Energy Resources Conservation Board expects the bitumen/light-medium differential to average 26% over the forecast period, compared with the five-year average of 36% and the 2009 average of 17%[28]. Using this price difference, the Western Canada Select price is increasing slightly from about US$60/bbl in 2010 to about $US$87/bbl in 2020.
As shown in Figure A.1.2, the Henry Hub price for natural gas in Alberta (the benchmark for Canadian prices) declined in 2010 to about four Canadian dollars per gigajoule (GJ). In the projection, it begins to recover to reach about six Canadian dollars per GJ by 2020, still well below its peak of almost $10 in 2005. This reflects the National Energy Board's assumptions regarding pipeline expansions (e.g., Mackenzie and the Alaska pipelines).
Figure A.1.2 - Henry Hub natural gas price ($CDN 2010/GJ)
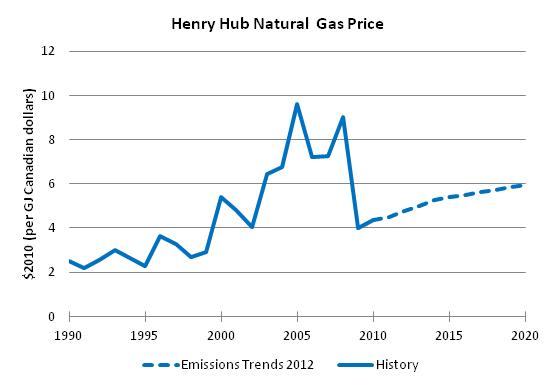
Energy Production
Historically, growth has occurred in all areas of oil and gas production, with over half the growth coming from natural gas production. However, our projections show that both natural gas and conventional oil production will decrease over time as a result of declining supply, but that the projected increase in production from oil sands operations will more than make up for this decline. As such, under assumed prices and absent further government policy actions, it is expected that from 2010 to 2020 oil sands in situ production will almost triple and oil sands mining production will increase by 50% (see Table A.1.2, below).
| Thousand Barrels Per Day | 2005 | 2010 | 2020 |
|---|---|---|---|
| Crude and Condensates | |||
| Conventional Heavy | 526 | 425 | 363 |
| Conventional Light | 511 | 512 | 524 |
| C5 & condensates | 173 | 148 | 137 |
| Frontier Light (offshore + northern) | 324 | 291 | 225 |
| Oil Sands - Primary | 150 | 194 | 211 |
| Oil Sands - In-situ | 286 | 563 | 1607 |
| SAGD | 82 | 319 | 1267 |
| CSS | 204 | 244 | 340 |
| Oil Sands Mining | 628 | 857 | 1445 |
| Total Production (gross) | 2,598 | 2,990 | 4,512 |
Table A.1.3 illustrates oil sands disposition. There are two main products from oil sands production: synthetic crude oil (or upgraded bitumen) and non-upgraded bitumen, which is sold as heavy oil. Synthetic crude oil production (A.1.3) from Alberta is projected to increase from about 794,000 barrels per day in 2010 to about 1.29 million barrels per day by 2020. Synthetic crude oil from Saskatchewan is projected to remain constant at 70,000 barrels per day. Non-upgraded bitumen will increase from 612,000 barrels per day in 2010 to 1.69 million barrels per day by 2020. This non-upgraded bitumen is either sold as heavy oil to Canadian refineries or transported to U.S. refineries for upgrading to refined petroleum products.
| Thousand Barrels Per Day | 2005 | 2010 | 2020 |
|---|---|---|---|
| Synthetic - Alberta | 546 | 794 | 1,288 |
| Synthetic - Saskatchewan | 64 | 70 | 70 |
| Non-upgraded Bitumen | 368 | 612 | 1,694 |
| Oil Sands (net) | 978 | 1,476 | 3,052 |
| Own use | 86 | 138 | 211 |
| Oil Sands (gross) | 1,064 | 1,614 | 3,263 |
Projections show gross natural gas production will decline modestly to some 4.7 TCF in 2020, as new production and non-conventional sources such as shale gas and coal-bed methane come to market[29] to offset conventional declines.
| Billion Cubic Feet | 2005 | 2010 | 2020 |
|---|---|---|---|
| Supply[30] | |||
| Gross Production | 6,951 | 5,868 | 4,711 |
| Own-use Consumption | 689 | 648 | 493 |
| Marketable Gas | 6,262 | 5,221 | 4,219 |
| Imports | 346 | 828 | 828 |
| Total Supply | 6,608 | 6,049 | 5,047 |
The emissions outlook reflects plans by provincial and territorial utilities with respect to key electricity capacity expansions.
Taking into account these provincial utility expansion plans, plus additional units forecast to be built by Environment Canada's Energy, Emissions and Economy Model for Canada (E3MC) to meet growth in electricity demand, aggregate electricity generation is also expected to increase substantially, by about 13% from 2010 to 2020, with fuel mix changes as generation increases. Table A.1.5 describes, that the proportion of generation coming from wind power and other renewable sources is expected to increase from 2005 to 2020, starting at only about 0.3% in 2005 and reaching 6% of total generation by 2020. Importantly, though, the proportion of natural gas-fired generation is projected to double its 2005 levels.
Government actions, such as the introduction of the Electricity Performance Standard, will cause fuel switching in the overall electricity generating portfolio. As noted above, it is expected that natural gas-fired generation will double its 2005 levels by 2020, because of its appeal as a relatively cleaner source of power generation and a reliable means to cover peak loads. The lower natural gas price also makes it an affordable choice. Coal and petroleum coke generation fall from 18% of the generation in the Canadian portfolio in 2005 to 10% in 2020.
| TWh | 2005 | 2010 | 2020 |
|---|---|---|---|
| Coal and Petroleum Coke |
105
|
79
|
61
|
| Refined Petroleum Products |
12
|
5
|
5
|
| Natural Gas |
22
|
30
|
47
|
| Hydro |
329
|
321
|
362
|
| Nuclear |
87
|
86
|
87
|
| Other Renewables |
2
|
9
|
34
|
| Total Generation |
557
|
529
|
598
|
Emissions Factors
Table A.1.6 provides a rough estimate of carbon dioxide emitted per unit of energy consumed by fossil fuel type. These numbers are estimates, as specific emission factors can vary slightly by year, sector, and province.
| Fuel name | CO2 eq. emitted (g/106 Joules) |
|---|---|
| Natural gas | 49.7 |
| Liquefied petroleum gas | 61.0 |
| Non-marketable natural gas | 66.5 |
| Propane | 59.8 |
| Aviation gasoline | 69.6 |
| Automobile gasoline | 67.6 |
| Kerosene | 67.3 |
| Light fuel oil | 70.3 |
| Heavy fuel oil | 74.0 |
| Tires/tire-derived fuel | 80.8 |
| Wood and wood waste | 0[31] |
| Coal (bituminous) | 88.1 |
| Coal (subbituminous) | 91.6 |
| Coal (lignite) | 92.4 |
| Petroleum coke | 86.4 |
| Coal (anthracite) | 97.6 |
Federal, Provincial and Territorial Measures
Since 2006, the Government of Canada has invested more than $11.5 billion to reduce greenhouse gas emissions through investments in green infrastructure, energy efficiency, clean energy technologies and the production of cleaner energy and cleaner fuels. These include expenditures through the eco-action initiatives, clean energy fund, green infrastructure fund, transit pass program, marine shore power program, biofuels and bioproducts initiatives and programs, national vehicle scrapping program, and initiatives such as the National Renewable Diesel Demonstration Initiative - to name just a few.
In addition, regulations are being enacted to reduce emissions from key sources, and joint initiatives and investments have been undertaken with the provinces and territories to assist them in addressing their unique challenges and to facilitate coordinated approaches.
Table A.1.7 below identifies the major federal, provincial and territorial measures that are included in the Canada's Emissions Trends' reference case. It includes federal measures that have been implemented or announced in detail as of May 2012. Where program funding is set to end, the projections assume that the impacts of these programs, other than those embodied in consumer behaviour, cease when the approved funding terminates.
The analysis also includes existing provincial and territorial measures. Environment Canada monitors provincial/territorial initiatives, and strives to take them into account in its analysis and modeling (for the purposes of this report, provincial measures announced and fully implemented as of May 2012 have been included wherever possible).
While the emissions outlook's baseline scenario includes those existing measures that have been implemented or announced in specific detail, it does not take into account the impact of broader strategies or future measures within existing plans where significant details are still under development.
The federal government's climate change plan involves the development of measures to address emissions on a sector-by-sector basis, and some measures under development as part of this plan have not yet been included in the baseline scenario: for example, the government has committed to regulate the emissions of the Oil and Gas sector, but the details of the regulations are under development, so this measure is not yet included.
Similarly, broad provincial policy initiatives such as the B.C. Energy Plan, Manitoba's Beyond Kyoto plan, and under the Western Climate Initiative provincial announcements where the structure of the trading regime has yet to be released, are not taken into account in the baseline scenario.
Some of the key existing federal measures that have been taken into account in the baseline scenario include:
- Performance Standard for Coal-Fired Electricity Generation - In June 2010, the Government announced its intention to regulate coal-fired electricity generation. The regulations impose a performance standard on new coal-fired electricity generation units and those units that have reached the end of economic life. The new regulations, which are scheduled to take effect in 2015, will encourage electric utilities to transition towards lower- or non-emitting types of generation. The proposed regulations send a critical signal to industry in advance of expected significant capital stock turnover. By affecting capital investment decisions now, the regulations will help avoid a legacy of higher-emitting facilities being built. The gradual phase-out of old and dirty coal units is expected to significantly reduce emissions from the electricity generation sector and improve air quality for all Canadians.
- Passenger Automobile and Light Truck Greenhouse Gas Emission Regulations - In October 2010, the Government published its final Passenger Automobile and Light Truck Greenhouse Gas Emission Regulations, which establish progressively stringent standards, harmonized with the U.S., for GHG emissions from new cars and light trucks for the 2011 to 2016 model years. The Government also published a Notice of Intent for “phase 2” of the regulations to develop more stringent GHG emissions standards for light-duty vehicles of model years 2017 to 2025.
- Renewable Fuels Regulations - In 2006, as part of the Renewable Fuels Strategy, the Government of Canada announced its intention to regulate an annual average renewable fuel content of 5% in gasoline by 2010, and in a second phase, a 2% requirement for renewable content in diesel fuel and heating oil by 2011. The Strategy's two regulatory requirements combined with provincial regulations will ensure a total volume of renewable fuel that will reduce annual greenhouse gas emissions by up to four Mt - about the equivalent of taking one million vehicles off the road.
- Energy efficiency regulations, codes and standards for buildings and homes - The Government continues to update and strengthen energy efficiency standards for products under the Energy Efficiency Act and is working with provinces to update the National Energy Code for Buildings. These actions, combined with targeted incentive programs, have proven to be effective at reducing energy use and GHG emissions in this sector.
| Provincial/Territorial Measures | Federal Measures |
|---|---|
Alberta:
B.C.:
Manitoba:
Nova Scotia:
Ontario:
Quebec:
|
|
| Additional Provincial Policies - Trends 2012 | Additional Federal Policies - Trends 2012 |
Alberta:
BC:
Manitoba:
New Brunswick:
Newfoundland & Labrador:
Nova Scotia:
Ontario:
Saskatchewan:
Quebec:
|
|
| Province/Territory | Target |
British Columbia Alberta Saskatchewan Manitoba Ontario Quebec New Brunswick Nova Scotia Newfoundland[33] Prince Edward Island[34] |
33% below 2007 50 Mt below BAU 20% below 2006 15% below 2005 15% below 1990 20% below 1990 10% below 1990 10% below 1990 10% below 1990 10% below 1990 |
Alternate Emissions Scenarios
Emissions projections are subject to uncertainty, and are most appropriately viewed as a range of plausible outcomes. Many of the events that shape emissions and energy markets cannot be anticipated. In addition, future developments in technologies, demographics, and resources cannot be foreseen with certainty. Typically, these key uncertainties are addressed through alternative cases.
The sensitivity analysis presented here focuses on two key uncertainties:
- The growth of the economy
- The evolution of world oil prices and their impacts on macroeconomic growth and energy consumption
The emissions outcomes of these alternative cases are presented as stand-alone and in combinations in Table A.2.1. These alternative cases explore the interaction of energy markets and economic growth, and their impact on emissions, under a range of assumptions. As such, they show the resulting emissions relative to the baseline scenario excluding LULUCF (745 Mt).
The higher GDP case assumes stronger economic growth in the goods producing sector. By 2020, Canadian GDP in the high GDP case is some 34% higher than 2010 levels, compared with 26% higher in the baseline scenario.
By 2020, Canadian GDP in the low GDP case is some 17% higher than 2010 levels, compared with 26% higher in the baseline scenario.
In the baseline scenario, the world oil price is projected to grow from $79/bbl ($US) in 2010 to $102/bbl ($US) in 2020. A higher price scenario, in which 2020 prices are $142/bbl ($US), is used alone and in combination with different GDP growth assumptions. A low price scenario is also included where the world oil price remains fairly stable at $72/bbl ($US) after 2015.
Greenhouse gas emissions in the fast GDP growth scenario are about 11% higher in 2020 than 2010 levels. This compares with 8% higher emissions in the baseline scenario over the same period. As economic activity increases, there will unquestionably be a higher demand for energy and a corresponding increase in emissions. In contrast, emissions are expected to be much lower if the Canadian economy grows at a slower pace. When combined with high oil prices, emissions could be some 1.8% higher than 2010 levels by 2020. Expected growth of the economy is the primary driver of expected emission growth. Any variation in this path will lead to a different set of projections about expected future emissions.
| Cases | GHG emissions (in Mt CO2 e. - Excluding LULUCF) | |
|---|---|---|
| 2015 | 2020 | |
| Slow GDP | 705 | 718 |
| Fast GDP | 733 | 771 |
| Low World Oil Prices | 729 | 741 |
| High World Oil Prices | 706 | 732 |
| Slow GDP - Low World Oil Prices | 714 | 714 |
| Slow GDP - High World Oil Prices | 692 | 705 |
| Fast GDP - Low World Oil Prices | 743 | 770 |
| Fast GDP - High World Oil Prices | 718 | 756 |
| Baseline Scenario | 719 | 745 |
| Sensitivity Results | 692 - 743 | 705 - 771 |
The growth in emissions is expected to slow down as the world price of oil increases since overall economic activity would decline as the price of oil rose. However, the increase in price drives higher production in the oil and gas sectors which generally offsets this effect. Emissions from the oil and gas sector in the high world oil price case rise by 69 Mt from 2010 to 2020; whereas they only rise by 50 Mt in the baseline scenario and by 34 Mt in the low price scenario.
The range in total projected emissions from all scenarios rises as we extend our projection further into the future. As a result of the assumptions made about the growth in Canadian GDP and the future world oil price, in 2020 the range is 66 Mt.
Under all scenarios over the forecast period, emissions are expected to grow the fastest in oil sands extraction and upgrading. Electricity generation and the conventional oil and gas sectors are projected to see an emissions decrease. Emission changes in the transportation sector show a deceleration from the long-term growth trend in all scenarios.
The oil sands sector displays the fastest growth in emissions, but it also displays the greatest range of uncertainty about future emissions depending on the assumptions used. Emissions could rise by as much as 82 Mt - or as little as 54 Mt - over the 2005 to 2020 period. The baseline scenario projects that oil sands emissions would increase by 73 Mt.
Methodology for Development of Emissions Scenarios
The scenarios developed to support Environment Canada's GHG emissions projections derive from a series of plausible assumptions regarding, among others, population and economic growth, prices, demand and supply of energy, and the evolution of energy efficiency technologies. The projections also assume no further government actions to address greenhouse gas emissions beyond those already in place or imminently pending as of May 2012.
The emissions projections presented in this report cannot be viewed as a forecast or prediction of emissions at a future date. Rather, this report presents a simple projection of the current structure and policy context into the future, without attempting to account for the inevitable but as yet unknown changes that will occur in government policy, energy supply, demand and technology, or domestic and international economic and political events.
The approach to developing Environment Canada's Emissions Trends involves three main features:
- Using the most up-to-date statistics on GHG emissions and energy use, and sourcing key assumptions from the best available public and private expert sources.
- Developing scenarios of emissions projections using a detailed, proven Energy, Emissions and Economy Model for Canada.
- Consulting with industry experts on results.
Up-to-date Data and Key Assumptions
Each year, Environment Canada updates its models using the most recent data available from Statistics Canada's Report on Energy Supply-Demand and Environment Canada's National Inventory Report. For these projections, the most recent historical data available were for 2010. For the first time, emissions for Environment Canada's projections and historical data in the NIR are aligned based by economic sector.
In addition to the most recent historical information, the projections are based on expert-derived expectations of key drivers (e.g. world oil price). These assumptions are based on the latest energy and economic data, with key modeling assumptions aligned to Government of Canada views:
- National Energy Board views on energy prices and large scale energy projects
- Economic growth from Finance Canada's Budget 2012 Update of Economic and Fiscal Projections
- Statistics Canada's population growth projections
- Productivity growth projections
Even with the benefit of external expert assumptions, there is considerable uncertainty surrounding energy price and economic growth assumptions, particularly over the medium- to long-term. As such, a range of emissions is presented representing a series of sensitivity analyses. These cases were based on high and low GDP growth as well as high and low oil prices and productions levels.
Energy, Emissions and Economy Model for Canada
The projections presented in this chapter were generated from Environment Canada's Energy, Emissions and Economy Model for Canada, also known as E3MC.
E3MC has two components: Energy 2020, which incorporates Canada's energy supply and demand structure, and The Informetrica Model (TIM), a macroeconomic model of the Canadian economy.
- Energy 2020 is an integrated, multi-region, multi-sector North American model that simulates the supply, price and demand for all fuels. The model can determine energy output and prices for each sector, both in regulated and unregulated markets. It simulates how such factors as energy prices and government measures affect the choices that consumers and businesses make when they buy and use energy. The model's outputs include changes in energy use, energy prices, greenhouse gas emissions, investment costs and possible cost savings from measures, which are used to identify the direct effects stemming from greenhouse gas reduction measures. The resulting savings and investments from Energy 2020 are then used as inputs into TIM.
- The Informetrica Model is used to examine consumption, investment, production, and trade decisions in the whole economy. It captures the interaction among industries, as well as the implications for changes in producer prices, relative final prices, and income. It also factors in government fiscal balances, monetary flows, and interest and exchange rates. More specifically, TIM incorporates 133 industries at a provincial and territorial level. It also has an international component to account for exports and imports, covering about 100 commodities. The model projects the direct impacts on the economy's final demand, output, employment, price formation, and sectoral income that result from various policy choices. These, in turn, permit an estimation of the effect of climate change policy and related impacts on the national economy.
E3MC develops projections using a market-based approach to energy analysis. For each fuel and consuming sector, the model balances energy supply and demand, accounting for economic competition among the various energy sources. This ensures consistent results among the sectors and regions. The model can be operated in a forecasting mode or an analytical mode. In forecasting mode, the model generates an annual energy and emissions outlook to 2050. In analytical mode, it assesses broad policy options, specific programs or regulations, new technologies or other assumptions.
The model's primary outputs are tables showing energy consumption, production and prices by fuel type, year and region. The model also identifies many of the key macroeconomic indicators (e.g., GDP or unemployment) and produces a coherent set of all greenhouse gas emissions (such as carbon dioxide, methane, and nitrous oxide) by sector and by province.
Figure A.3.1 shows the general structure of E3MC. The component modules of E3MC represent the individual supply, demand, and conversion sectors of domestic energy markets and also include the macroeconomic module. In general, the modules interact through values representing the prices of the energy delivered to the consuming sectors and the quantities of end-use energy consumption.
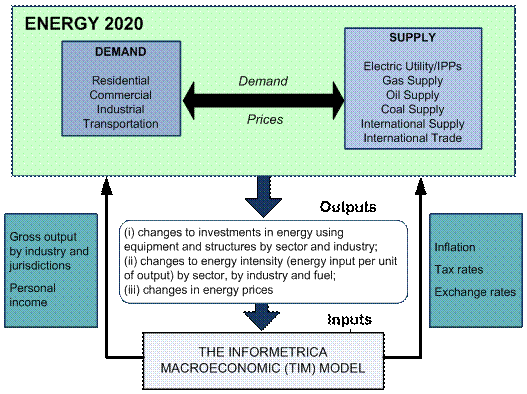
To develop this projection of energy use and related emissions, it was necessary to provide a view of the Canadian economy to 2020. The level and composition of energy supply and demand, and the resulting greenhouse gas emissions, are determined based on many assumptions that influence the overall size and growth rate of the economy.
Treatment of Interaction Effects
Estimates of the net impact of government measures incorporated in the modelling scenarios need to take into account major interaction and behavioural affects. The analytical approach permitted by E3MC addresses these key modeling challenges, namely additionality, free ridership, rebound effects, and policy-interaction effects.
- Additionality. This issue relates to the question of what would have happened without the initiative in question. Problems of additionality arise when the stated emissions reductions do not reflect the difference in emissions between equivalent scenarios with and without the initiative in question. This will be the case if stated emissions reductions from an initiative have already been included in the reference case - emissions reductions will effectively be double-counted in the absence of appropriate adjustments. The E3MC model controls for additionality by basing its structure on incremental or marginal decision-making. The E3MC model assumes a specific energy efficiency or emission intensity profile at the sector and end-use point (e.g., space heating, lighting, or auxiliary power). Under the E3MC modeling philosophy, if the initiative in question were to increase the efficiency of a furnace, only the efficiency of a new furnace would be changed. The efficiency of older furnaces would not change unless those furnaces are retired and replaced with higher efficiency ones. As such, any change in the model is incremental to what is reflected in the business-as-usual assumptions.
- Free ridership. A related problem, free ridership, arises when stated reductions include the results of behaviour that would happen regardless of the policy. This can occur when subsidies are paid to all purchasers of an item (e.g., a high efficiency furnace), regardless of whether they purchased the item because of the subsidy. Those who would have purchased the product regardless are termed free riders. In the E3MC model, the behaviour of free riders has already been accounted for in the reference case. Thus their emissions are not counted toward the impact of the policy. Instead, the E3MC model counts only the incremental take-up of the emissions-reducing technology.
- The rebound effect. This describes the increased use of a more efficient product resulting from the implied decrease in the price of its use. For example, a more efficient car is cheaper to drive and so people may drive more. Emissions reductions will generally be overestimated by between 5% and 20% unless estimates account for increased consumption because of the rebound effect. Within the model, we have mechanisms for fuel choice, process efficiency, device efficiency, short-term budget constraints, and cogeneration, which all react to changes in energy and emissions costs in different timeframes[35]. All these structures work to simulate the rebound effect - in the example above, the impact of extra kilometres that may be driven as a result of improved fuel efficiency are automatically netted out of the associated emissions reduction estimates.
- Policy interaction effects. This describes impacts on the overall effectiveness of Canada's emissions-reduction measures when they interact with each other. A policy package containing more than one measure or policy would ideally take into account this impact to understand the true contribution that the policy package is making (in this case, to emission reductions).
E3MC is a comprehensive and integrated model focusing on the interactions between sectors and policies. In the demand sectors, the fuel choice, process efficiency, device efficiency, and level of self-generation are all integrally combined in a consistent manner. The model has detailed equations to ensure that all the interactions between these structures are simulated with no loss of energy or efficiency. For example, the electric generation sector responds to the demand for electricity from the energy demand sectors, so any policy to reduce electricity demand in the consumer sectors will impact the electricity generation sector. The model accounts for emissions in the electricity generation sector as well as for emissions in the consumer demand sectors. As the electricity sector reduces its emissions intensity, policies designed to reduce electricity demand in the consumer sectors will cause less of an emissions reduction. The natural gas and oil supply sectors similarly respond to the demands from the consumer sectors, including the demands for refined petroleum products for transportation. The model also simulates the export of products by supply sectors.
Taken as a whole, the E3MC model provides a detailed representation of technologies that produce goods and services throughout the economy and can simulate, in a realistic way, capital stock turnover and choices among technologies. The model also includes a representation of equilibrium feedbacks, such that supply and demand for goods and services adjust to reflect policy. Given its comprehensiveness, E3MC covers all the greenhouse gas emissions sources, including those unrelated to energy use.
Simulation of capital stock turnover
As a technology vintage model, E3MC tracks the evolution of capital stocks over time through retirements, retrofits, and new purchases, in which consumers and businesses make sequential acquisitions with limited foresight about the future. This is particularly important for understanding the implications of alternative time paths for emissions reductions.
The model calculates energy costs (and emissions) for each energy service in the economy, such as heated commercial floor space or person-kilometre traveled. In each period, capital stocks are retired according to an age-dependent function (although the retrofitting of unretired stocks is possible, if warranted by changing economic conditions). Demand for new stocks grows or declines depending on the initial exogenous forecast of economic output (i.e., a forecast that is external to the model and not explained by it) and the subsequent interplay of energy supply-demand with the macroeconomic module. A model simulation iterates between energy supply-demand and the macroeconomic module until there is a convergence. The global convergence criterion is set at 0.1% between iterations. This convergence procedure is repeated for each year over the simulation period.
The E3MC model simulates the competition of technologies at each energy service node in the economy based on a comparison of their cost and some technology-specific controls, such as a maximum market share limit in cases where a technology is constrained by physical, technical, or regulatory means from capturing all of a market. The technology choice simulation reflects the financial costs as well as the consumer and business preferences, revealed by real-world technology acquisition behaviour.
Model Limitations
While E3MC is a sophisticated analytical tool, no model can fully capture the complicated interactions associated with given policy measures between and within markets or between firms and consumers. Unlike computable general equilibrium models, however, the E3MC model does not fully equilibrate government budgets and the markets for employment and investment. That is, the modeling results reflect rigidities such as unemployment and government surpluses and deficits. Furthermore, the model, as used by Environment Canada, does not generate changes in nominal interest rates and exchange rates, as would occur under a monetary policy response to a major economic event.
[1] Emissions inventory data used for this analysis is derived from National Inventory Report 1990-2010: Greenhouse Gas Sources and Sinks in Canada.
[2] As the most recent total greenhouse gas emissions by countries are for 2005, CO2 emissions are being used as they are more recent.
[3] Canada submits an annual National Inventory Report on Greenhouse Gases Sources and Sinks to the United Nations Framework Convention on Climate Change per the reporting methodology requirements of the International Panel on Climate Change.
[4] Canada's target of 607 Mt is based on the 731 Mt for 2005 that was included in the 2011 NIR. Using 2012 data (740 Mt), and the same 17% reduction, would have increased the target to 614 Mt.
[5] The Emissions-Intensive Trade-Exposed Industry sector represents emissions from mining activities, smelting and refining, and the production and processing of industrial goods such as chemicals, fertilizers, paper or cement.
[6] For detailed information about individual key drivers, assumptions and key response dynamics, see Annex 1.
[7] Since sensitivity analyses have been performed around variables that affect energy and industrial production and consumption, LULUCF emissions are not included in these estimates. The inclusion of LULUCF contributions will reduce overall emissions levels.
[8] The projection period, 2011 to 2020, includes the contribution of land use, land-use change and forestry.
[9] See a description of federal Light-Duty Vehicle and Heavy-Duty vehicle regulations in the following section; as well as the “Drilldown” text box describing trends in light-duty vehicles.
[10] There are many alternative approaches for treating and grouping the transportation activities. For example, passenger transportation could be included in the residential sectors. Likewise, moving of industrial freight could be included with each industry.
[11] Includes natural gas, conventional light and heavy crude oil, and in situ bitumen from oil sands.
[12] By UNFCCC convention, emissions from the production of synthetic crude oil are linked to the petroleum refining industry.
[13] Due to the increased prospects of shale gas in the United States and Canada (mostly British Columbia), the in-production date of natural gas from the Mackenzie Valley has been deferred until 2025.
[14] For the most part, the oil and natural gas production projections reflect the views of the National Energy Board outlook for projects in these provinces. However, some adjustments have been made to reflect more recent market conditions. For example, the growth in shale gas production in British Columbia has been reduced.
[15] Note that four new coal fired plants are assumed to be constructed or refurbished with carbon capture capabilities in Saskatchewan.
[16] Includes emissions not related to energy use such as methane from livestock manure and ruminant animals and nitrous oxide from fertilizer usage, crops and manure.
[17] While provincial and territorial have announced a diverse range of measures, only measures which could be readily modeled or have an announced regulatory or budgetary dimension were modeled. Aspirational goals and targets that were not supported by measureable, real and verifiable actions were not included.
[18] The growth in shale gas production in British Columbia has been reduced to reflect more recent market conditions.
[19] Carbon Dioxide Information Analysis Center, Oak Ridge National Laboratory, U.S. Department of Energy, Oak Ridge, Tenn., U.S.A. http://cdiac.ornl.gov/trends/landuse/houghton/houghton.html
[20] National Forestry Database Program, www.nfdp.ccfm.org.
[21] Cropland management projections have been modeled by Agriculture and Agri-Food Canada; Forest Management and Afforestation projections have been modeled by Natural Resources Canada, and Environment Canada developed projections for Deforestation based on analysis provided by Natural Resources Canada.
[22] Canada's submission on its reference level for 2013-2020 is described in a submission to the UNFCCC at http://unfccc.int/bodies/awg-kp/items/5896.php.
[23] The category of “forest management” includes only the area of forest managed for timber and non-timber resources (including parks) or subject to fire protection.
[24] Cropland management applies to land that is used for crop production as well as land temporarily not being used for crops.
[25] The categories of deforestation and afforestation refer to a permanent change in the way that land is used. Deforestation is the permanent conversion of forest land to other land uses such as agricultural land, transportation infrastructure, mines or urban areas. Forest clearing due to harvesting is expected to be temporary and is not included in this category - it is included in forest management. Conversely, afforestation is the permanent conversion of non-forest land (usually agricultural land in Canada) to forest.
[26] http://www.budget.canada.ca/2012/plan/chap2-eng.html#a22
[27] API gravity is a measure of how heavy or light a petroleum liquid is compared to water.
[28] http://www.ercb.ca/data-and-publications/statistical-reports/st98
[29] For the purposes of this document, shale gas development has been included under natural gas production. As more data and information on likely shale gas production trends become available, consideration will be given to modeling shale gas separately.
[30] For the most part, the oil and natural gas production projections reflect the views of the National Energy Board outlook for projects in these provinces. However, some adjustments have been made to reflect more recent market conditions. For example, the growth in shale gas production in British Columbia has been reduced.
[31] While the emissions intensity of burning wood is 81.3 g/106Joules, biofuels such as wood can be considered carbon-neutral since carbon dioxide was absorbed from the atmosphere as the trees were growing.
[32] ** Western Climate Initiative (WCI) and revised/enhanced complementary policies are included in 2012 BAU; Apply to BC, MB, ON, QC.
[33] Under the auspices of the Conference of New England Governors and Eastern Canadian Premiers (NEG-ECP) partnership, the four Atlantic provinces have committed to a regional goal of achieving 10% below 1990 levels by 2020.
[34] Prince Edward Island has not established its own official provincial emissions reduction target, so the common NEG-ECP target is applied for the purposes of this analysis.
[35] A shift in energy prices will cause cogeneration to shift in the short to medium term, device efficiency to adjust over the short to mid-term, process efficiency to adjust in the mid-term, and fuel choice to react in the mid- to long-term. The actual adjustment times depend on the particular sector.