
Quarterly climate impacts and outlook for the Gulf of Maine Region: March 2020
Gulf of Maine region significant events – December 2019 to February 2020

Long description
The image shows the map of the Gulf of Maine region. It highlights significant weather and climate events that occurred in the months of December 2019 to February 2020.
The region experienced a mild winter with several significant storms that brought mixed precipitation.
December
A December 2 to 4 storm dropped up to 90 cm (36 in.) of snow on New England, with snowfall rates exceeding 5 cm (2 in.) per hour. Coastal Maine had up to 50 mm (2 in.) of sleet and 6 mm (0.25 in.) of ice from freezing rain. The storm caused difficult travel, flight cancellations, and school closures.
The region saw more than 50 mm (2 in.) of rain from a December 9 to 10 storm. Flooding and road and culvert washouts occurred in southern New Brunswick. Wind gusts in excess of 90 km/h (55 mph) damaged roofs and knocked out power to more than 50,000 customers in Nova Scotia. Record-setting mild temperatures of 10 to 14°C (50 to 58°F) accompanied the storm.
From December 13 to 15, southern Maine and New Hampshire saw 75 to 125 mm (3 to 5 in.) of rain, leading to flash flooding and a pileup on Interstate 95. December 14 was Portland's third wettest December day on record. In the Maritimes, there were flight and ferry cancellations and record warm temperatures of 10 to 17°C (50 to 63°F).
January
Many areas saw unusually mild temperatures of 10 to 21°C (50 to 70°F) on January 11. It was among Boston and Portland's ten warmest January days on record. On January 12, southern New England remained mild. Boston's high of 23°C (74°F), which was 21°C (38°F) above normal, made it the site's warmest January day, while Concord had its fourth warmest day. In northern/central Maine and the Maritimes, where it was colder, a storm brought snow, ice pellets, and freezing rain. Snow totals were up to 37 cm (15 in.), with Caribou having its eighth snowiest January day. The storm created poor road conditions and disrupted air travel.
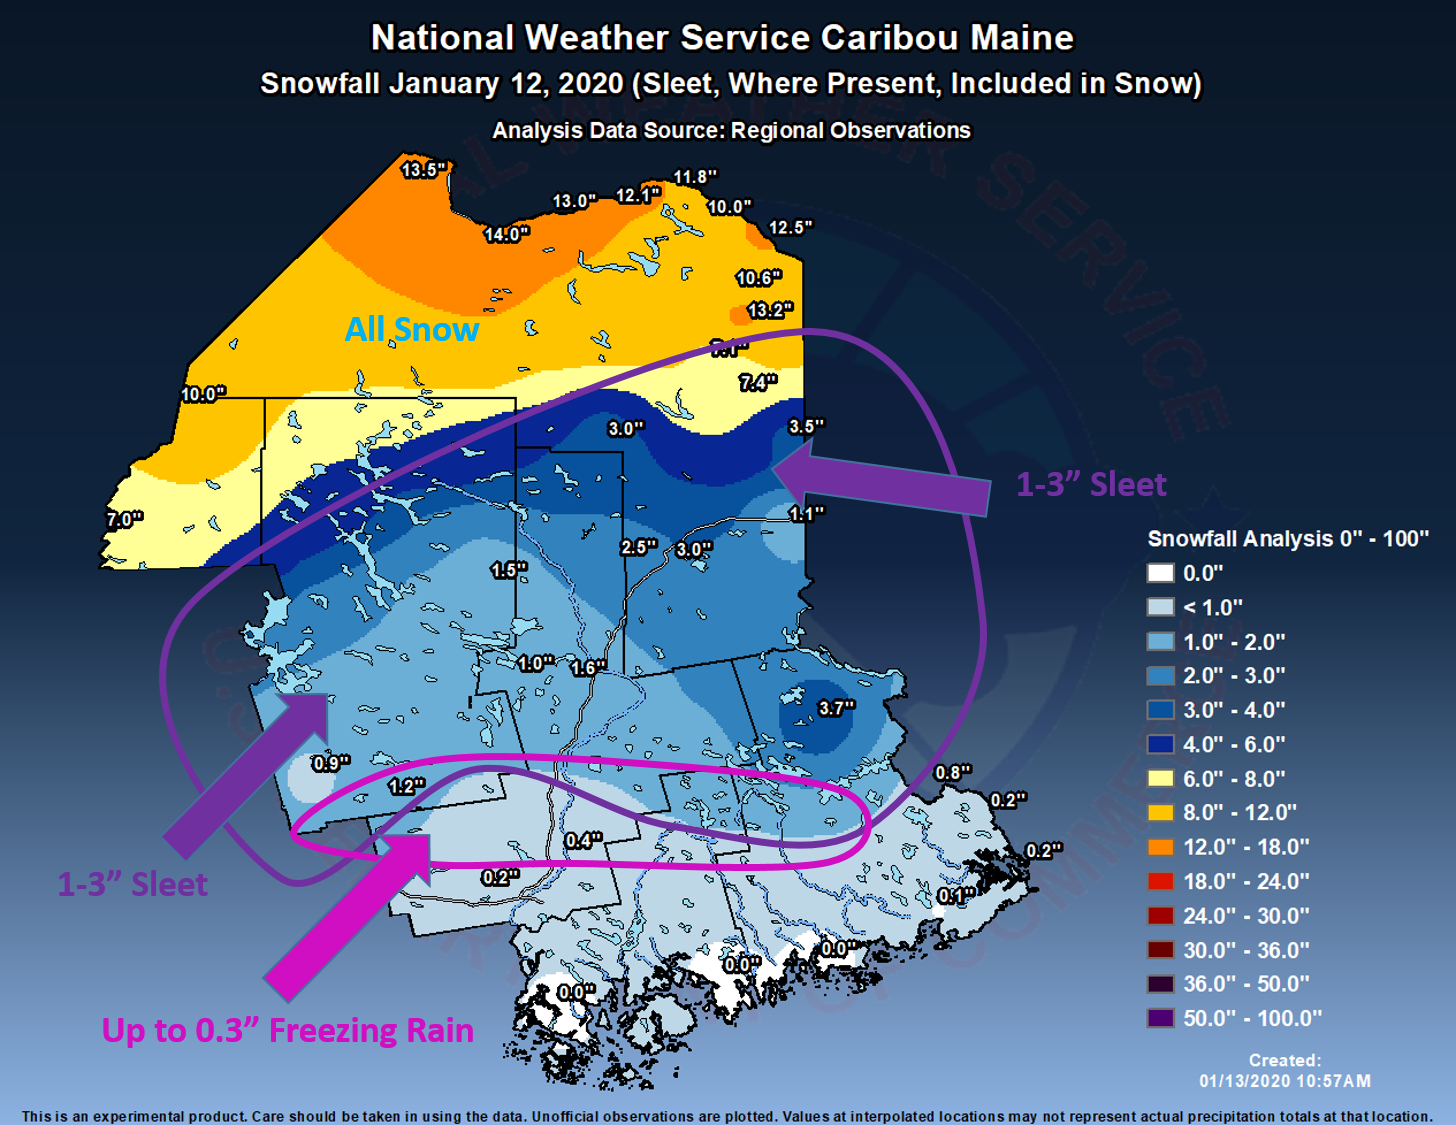
A storm on January 16 brought up to 30 cm (12 in.) of snow and wind gusts of up to 105 km/h (65 mph) to the region. Whiteout conditions caused the Cobequid Pass, which connects Nova Scotia to the rest of Canada, to be shut down for 14 hours.
A storm from January 25 to 26 dropped up to 50 mm (2 in.) of rain on much of the region. Northern Maine and parts of New Brunswick saw freezing rain, with ice accumulations of over 10 mm (0.40 in.) creating hazardous travel conditions.
February
A rapidly-strengthening storm from February 6 to 7 brought snow, ice, and wind gusts of up to 137 km/h (85 mph) to the region. The greatest snow totals of up to 58 cm (23 in.) were in northern Maine (PNG), where whiteout conditions occurred. The storm downed trees and wires and left nearly 155,000 customers in New England without power. Over 20 hours of freezing rain was reported in Nova Scotia where 135,000 customers lost power, a sports dome collapsed, and a historic building was damaged.
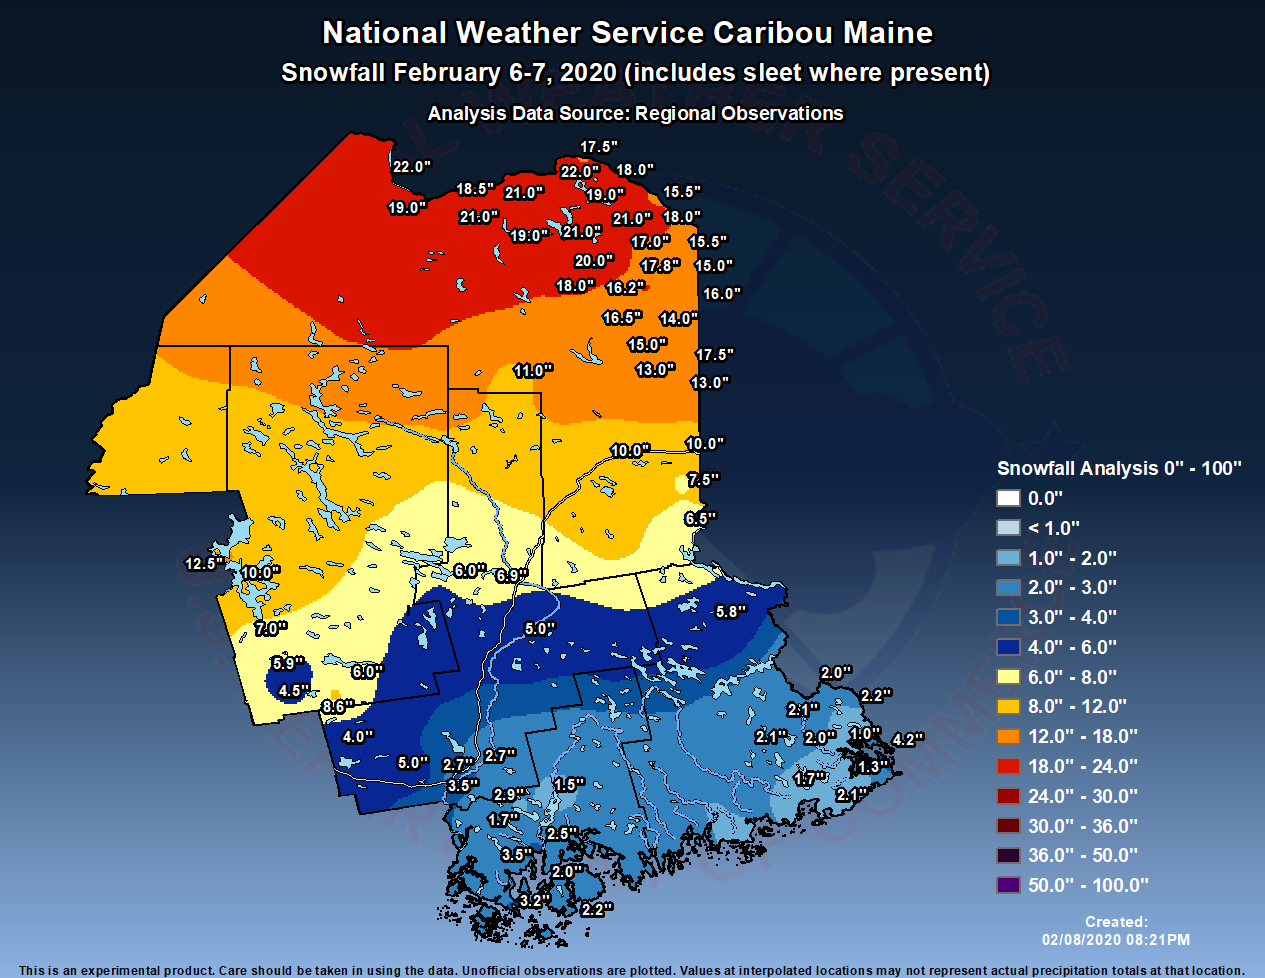
A storm from February 26 to 28 dropped up to 40 cm (16 in.) of snow in mountainous areas of New England and up to 45 mm (2 in.) of rain in Nova Scotia. Wind gusts of up to 120 km/h (75 mph) were reported, with Les Suêtes winds in Cape Breton reaching 229 km/h (142 mph). The storm downed trees and wires, left more than 40,000 Maritimes customers without power, and caused coastal flooding in Maine.
Regional climate overview - December 2019 to February 2020
Temperature: winter departure from normal

Long description
The map of winter temperature departure from normal, averaged over December 2019 to February 2020, shows that most of Gulf of Maine region was warmer than normal on average. Much of Maine and New Brunswick were as much as 4 degrees warmer than normal, on average. The rest of the region was generally 1 to 2 degrees above normal on average except for Cape Breton and coastal sections of eastern Nova Scotia, which were near normal or up to 1 degree above normal.
The scale to the right defines the map colours. Shades of red represent positive anomalies (above normal), to +5 degrees Celsius and above. Shades of blue represent negative anomalies (below normal), to negative 5 degrees Celsius and below. White indicates near-normal conditions (+0.5 Celsius to -0.5 Celsius).
Winter temperatures (averaged over December, January, and February) were as much as 4°C (7°F) above normal. This winter was Boston's second warmest, Caribou's fourth warmest, and Portland's seventh warmest. This is only the second winter on record that Boston's low temperature failed to drop below -11°C (12°F).
December temperatures were near normal for most areas but up to 3°C (5°F) above normal in parts of New Brunswick, Maine, and northern New Hampshire.
January was mild, with temperatures up to 5°C (9°F) above normal. This January ranked among the ten warmest on record for several sites.
February temperatures were as much as 3°C (5°F) above normal. It was Boston's third warmest February and Yarmouth’s eighth warmest.

Long description
The time series graph displays the daily average temperature over the months of December 2019 to February 2020 compared to normal for Portland, Maine. It shows that the temperature was generally above normal except for occasional days throughout the period.
The vertical scale is in Celsius, from -15 to +15 degrees. The bottom scale indicates the dates from December 2019 to February 2020.
Precipitation: winter percent of normal

Long description
The map displays total precipitation as a percentage of normal precipitation over the months of December 2019 to February 2020. Conditions were generally near normal overall. It shows that central New Brunswick, southwestern Maine, southern New Hampshire, parts of Massachusetts, and parts of the Nova Scotia coastline along the Atlantic were wetter than normal. Small areas of drier than normal are shown in central Massachusetts, northwestern New Hampshire, northern and southern New Brunswick, central and eastern Nova Scotia, and eastern Prince Edward Island.
The scale on the right has above normal (110% of normal and above) shown in shades of green, below normal (90% of normal and less) in shades of brown, and near normal (90% to 110% of normal) in white.
Winter precipitation (accumulated from December to February) ranged from 50% of normal to 150% of normal. In Nova Scotia, this winter ranked among the ten driest for the Greenwood and Truro areas.
In December, the Maritimes and northern/western Maine saw 50% to 110% of normal precipitation while southern/eastern Maine and New England saw 110% to 200% of normal. Portland had its fifth wettest December.
Much of the region saw 25% to 110% of normal precipitation in January. However, northeastern Maine and northwestern New Brunswick saw 110% to 150% of normal.
February precipitation ranged from 50% of normal in parts of the Maritimes to 175% of normal in parts of Maine and New Hampshire.
Sea surface temperatures: winter departure from normal

Long description
The map of the departure from normal of the sea surface temperature, averaged over December 2019 to February 2020, shows that the Gulf of Maine waters and coastal waters of Nova Scotia were warmer than normal especially over the deeper waters of the eastern Gulf of Maine and in the Bay of Fundy.
The scale to the right defines the map colours. Shades of red represent positive anomalies (above normal), to +3 degrees Celsius. Shades of blue represent negative anomalies (below normal), to -3 degrees Celsius. White indicates near-normal conditions (departures near 0 degrees Celsius).
Sea surface temperature anomalies over the entire Gulf of Maine region were above normal. These positive anomalies were strongest [1.4°C (2.6°F)] over deeper areas of the eastern Gulf and in the Bay of Fundy and weaker [less than 0.5°C (0.9°F)] in nearshore regions along the entire coast.
Regional impacts – December 2019 to February 2020
Winter Conditions
This winter's unusual warmth was tied to the polar vortex and an atmospheric circulation pattern called the Arctic Oscillation. The polar vortex is an area of low pressure and extremely cold air at the Earth's poles. At the outermost edge of this cold air mass is the polar jet stream. When the polar vortex is strong, the jet stream (and storm track) is farther north and the cold air is contained. The strength of the polar vortex and the phase of the Arctic Oscillation are closely related. When there is lower-than-average air pressure over the Arctic and higher-than-average air pressure over the mid-latitudes, the Arctic Oscillation is positive. Driven by a strong polar vortex, the Arctic Oscillation was persistently positive this winter. In fact, in early February, the Arctic Oscillation reached its highest daily value on record.

Long description
The map of winter (December to February) total snowfall as a percent of normal shows above normal snowfall amounts in northeastern Maine, central New Brunswick, and well above normal for eastern Nova Scotia into Cape Breton. Southwestern Nova Scotia, central Prince Edward Island and the coastal regions bordering the Bay of Fundy and the Gulf of Maine were all below normal to well below normal. Elsewhere the snowfall amounts were near normal.
The scale has above normal (110% of normal and above) shown in shades of green, below normal (90% of normal and less) in shades of brown, and near normal (90% to 110% of normal) in white.
December snowfall in the Maritimes, western Maine, and northern New Hampshire was below to well below normal. Several Maine sites had a snowfall deficit of 30 to 60 cm (12 to 24 in.), including Fort Kent, which had its seventh least snowy December. However, snowfall was above to much above normal for southern Maine, southern New Hampshire, and Massachusetts, mostly due to a major snowstorm in early December.
With mild temperatures in January, the few storms that moved through the region generally brought mixed precipitation. For many areas, January snowfall was below to near normal. Snowfall deficits in eastern Massachusetts and southern New Hampshire were up to 30 cm (12 in.). In contrast, northern Maine and parts of Nova Scotia saw a snowfall surplus of 30 cm (12 in.) or more. It was the snowiest January on record for Sydney.
February snowfall was below normal in southern parts of New England and southwestern Nova Scotia. Snowfall deficits of up to 30 cm (12 in.) were found in Massachusetts, with Boston having its seventh least snowy February. However, snowfall was above normal in northern parts of New England, much of New Brunswick and P.E.I., and central/eastern Nova Scotia. Much of northern Maine saw a snowfall surplus of up to 30 cm (12 in.) and several Maritimes sites reported up to 60% more snow than normal.
Thinner than normal ice was reported on some of the region's lakes and rivers this winter, prompting warnings from officials. There were reports of several people and vehicles falling through the ice. Ice observations have been taken on the Saint John River at Fredericton since 1825 and maintained by Environment and Climate Change Canada for many years. This year's freeze-up occurred on January 13, 2020, making it the fifth latest freeze-up on record (based on records since 1968 following the installation of the Mactaquac Dam west of Fredericton). Based on this record of ice observations in Fredericton, it is clear that there is long term trend toward later freeze-up and earlier break-up of the river ice due in part to gradually warming climatic conditions.

Long description
The photo is of broken power poles in Saint John, New Brunswick with NB Power trucks in place to make repairs.
Climate Change in the Gulf of Maine Region
A report found that climate change is accelerating in Maine (PDF). The state has become warmer and wetter since 1895, with these changes occurring faster since 1960. Changes in Maine's winters include warmer temperatures, more precipitation falling as rain, weather extremes, and earlier ice-out dates. These changes have affected Maine's natural environment and its people. The report noted an increase in heavy rainfall events and a longer growing season as the first fall frost occurs later, two things that present challenges for potato growers.

Long description
The map shows the trend in the number of days with precipitation greater than 50 mm, 1950 to 2013. The map represents the Maine to Massachusetts region by county. It shows that most counties have had an increasing number of days with heavy precipitation except for the Cape Cod area, which had a decreasing number. The trend for most counties was 0.00 to 0.23 days per decade.
The scale defines the map colours for trend in the number of days/decade. Shades of blue represent positive trends to greater than 0.42. Shades of yellow to brown represent negative trends to less than negative 0.42. White indicates no trend.
A recent study indicated that birds are migrating earlier in spring due to climate change, particularly in areas that have seen greater warming. This could be a problem if the timing of migration does not align with the emergence of plants and insects that some birds rely on. Similarly, warming waters in the Gulf of Maine have changed the availability of certain fish that some birds feed on, which can severely impact species such as the endangered Northeast population of the Roseate Tern. Ocean warming has also been linked to a shift in the feeding locations of right whales. Scientists believe a lack of food stressed the whales' bodies, causing females to give birth less frequently. The Canadian government implemented additional measures to protect right whales in the North Atlantic.
NOAA Fisheries Ecosystem Report
According to scientists at the U.S. National Oceanic and Atmospheric Administration (NOAA)’s Northeast Fisheries Science Center, "The changing position of the Gulf Stream north wall directly influences oceanic conditions in the Gulf of Maine (GOM). Since the mid-2000s, warmer, saltier slope water associated with the Gulf Stream has dominated the input into the GOM at the Northeast Channel, with 2017 and 2019 consisting of 99% warm slope water, the highest estimated in the time series. The changing proportions of source water affect the temperature, salinity, and nutrient inputs to the system. While further study is needed to determine if these short-term trends are related to climate change, analyses of global climate models suggest that these trends are evident in long-term (century-scale) climate change projections."
Regional outlook – spring 2020
Temperature and precipitation

Long description
The map of the temperature outlook for March to May 2020 for New England (left) shows the entire area with a 33 to 40% probability of above-normal temperatures.
The map of the temperature outlook for March to May 2020 for the Maritimes (right) shows increased probabilities of above-normal temperatures over most of the Maritimes except for eastern sections where there is a 40 to 50 % probability of near-normal temperatures. The probabilities of above-normal increase toward the south, with 40 to 50% over northern New Brunswick and 60 to 70% over southern Nova Scotia.
For March to May, NOAA's Climate Prediction Center (CPC) and Environment and Climate Change Canada (ECCC) favor increased chances of above-normal temperatures for New England, New Brunswick, parts of Nova Scotia, and western P. E. I. Near-normal temperatures were predicted for central and eastern P.E.I. and eastern sections of Nova Scotia.
An increased likelihood of above-normal precipitation is forecast for New England for March to May. ECCC predicts an increased chance of below-normal precipitation for southwestern New Brunswick and equal chances of below-, near-, or above-normal precipitation for the rest of the Maritimes.
Spring Flood Potential
NOAA indicates the flood risk during spring is normal for Maine and northern New Hampshire, where normal snow water equivalent conditions exist, and below normal for southern New Hampshire and Massachusetts, where snow cover is below normal. The ice jam flooding potential in interior Maine and northern New Hampshire is also normal. Very heavy rain can cause flooding at any time of the year, even in areas that have little to no snow cover.
The New Brunswick River Watch app for the Saint John River basin has been enhanced to provide real-time and forecast water levels for more communities, with forecasts out to six days.
El Niño/Southern Oscillation (ENSO)

Long description
The time series graph shows the probabilities of El Niño, La Niña, and Neutral conditions through the next 12 months. The forecast probabilities are plotted as vertical bars. The climatological probabilities are plotted as lines. The colours blue, grey, and red, represent La Niña, Neutral, and El Niño conditions, respectively. Each bar represents probabilities over 3 months. Each interval overlaps by 2 months. The first 3-month interval is February-March-April 2020. The months of June-July-August 2020 are in the middle of the graph. The last 3-month interval is October-November-December 2020.
The table below gives the forecast probabilities of La Niña, Neutral, and El Niño conditions for each 3-month interval.
Season |
La Niña |
Neutral |
El Niño |
|---|---|---|---|
FMA 2020 |
1% |
60% |
39% |
MAM 2020 |
2% |
67% |
31% |
AMJ 2020 |
8% |
66% |
26% |
MJJ 2020 |
16% |
60% |
24% |
JJA 2020 |
25% |
53% |
22% |
JAS 2020 |
31% |
48% |
21% |
ASO 2020 |
35% |
45% |
20% |
SON 2020 |
38% |
43% |
19% |
OND 2020 |
40% |
41% |
19% |
The climatological probabilities of La Niña, Neutral, and El Niño conditions are as follows:
- La Niña: about 25% in the spring and summer, and about 35% in the fall
- Neutral: 50% in the spring and summer, then near 30% in the fall
- El Niño: about 20% in the spring and summer, and about 35% in the fall
During February, El Niño-Southern Oscillation (ENSO)-neutral conditions were observed in the equatorial Pacific Ocean. NOAA's Climate Prediction Center indicates that ENSO-neutral conditions are expected to persist, with a 65% chance they will continue through spring and a 55% chance they will continue through summer.
Contacts
Environment and Climate Change Canada
Email: ec.enviroinfo.ec@canada.ca
National Oceanic and Atmospheric Administration
Northeast Regional Climate Center
Name: Ellen Mecray
Email: Ellen.L.Mecray@noaa.gov
Name: Samantha Borisoff
Email: sgh58@cornell.edu
Gulf of Maine partners
- Gulf of Maine Council on the Marine Environment, Climate Network
- University of Maine, School of Marine Sciences
- State Climatologists
- National Integrated Drought Information System
- Northeast Regional Association of Coastal Ocean Observing Systems
Receive this publication every quarter
Quarterly Climate Impacts and Outlook Reports – online
#regionalclimateoutlooks