Turkey Lakes watershed study: lakes
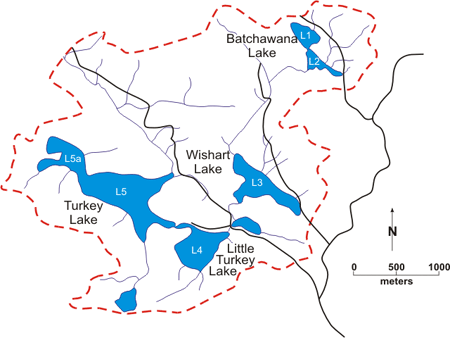
Batchawana Lake is the headwater (highest elevation) lake in the TLW (Figure 1). It has two distinct basins, north and south. Norberg Creek flows out of Batchawana Lake South and traverses a large change in elevation (497-388 m AMSL) prior to entering Wishart Lake.

Figure 1: Lakes in TLW
Norberg Creek then continues through Little Turkey Lake and Turkey Lake, and finally discharges into the Batchawana River. The lakes range from 5.8 hectares (Batchawana S.) to 52 hectares (Turkey) in area, and from 4.5 m (Wishart) to 37 m (Turkey) in depth. See Table 1 for other physical characteristics of the lakes. Figure 2 presents bathymetric or water depth maps for each of the lakes (click on the lake name to view each map). The relatively high precipitation quantity received at the TLW causes the lakes to flush fairly rapidly (i.e. low water renewal times in Table 1). Stations for monitoring chemical and physical characteristics are situated at the deepest point in each lake.
|
Lake
|
Drainage basin area (ha)
|
Lake surface area (ha)
|
Maximum depth (m)
|
Mean depth (m)
|
Perimeter
(km) |
Lake volume (m3.105) |
Water renewal time (yr) |
|---|---|---|---|---|---|---|---|
| Batchawana North | 24.0 | 5.88 | 11.3 | 3.87 | 1.31 | 2.27 | 1.22 |
| Batchawana South | 85.6 | 5.82 | 10.9 | 3.27 | 1.61 | 1.90 | 0.29 |
| Wishart | 337 | 19.2 | 4.5 | 2.19 | 3.14 | 4.21 | 0.17 |
| Little Turkey | 491 | 19.2 | 13.0 | 6.04 | 2.15 | 11.6 | 0.28 |
| Turkey | 803 | 52.0 | 37.0 | 12.2 | 5.91 | 63.4 | 1.03 |
Figure 2: Bathymetric (water depth) maps of the lakes. (Batchawana, Wishart, Little Turkey, Turkey)
The lakes are considered "dimictic" (i.e. experiencing complete mixing of the water column in spring and autumn), although spring mixing is sometimes incomplete. Thermal stratification develops in Batchawana, Little Turkey and Turkey Lakes during summer and winter each year. Due to Wishart Lake's shallow nature, wind-induced mixing generally prevents thermal stratification. The sediments and undisturbed bottom waters of the lakes exert a dissolved oxygen (DO) demand resulting in reduced bottom water DO during periods of thermal stratification and even anoxia in the case of Batchawana and Little Turkey Lakes.
| Lake | pH | Ca | Mg | Na | K | NH4 | Alk | SO4 | NO3 | Cl | DOC |
|---|---|---|---|---|---|---|---|---|---|---|---|
| Batchawana South | 6.0 | 128 | 34 | 20 | 5.2 | 3.6 | 53 | 106 | 10.3 | 9.4 | 5 |
| Turkey | 6.67 | 272 | 39 | 26 | 6 | 1.7 | 192 | 113 | 16 | 9 | 3.5 |
There is a gradient in the pH and major element chemistry of the lakes. Thin soils devoid of calcium carbonate dominate higher elevations in the TLW while lower elevations have thicker soils with a small amount of calcium carbonate (see Geology and Geomorphology). As a result, waters draining into and out of Batchawana Lake have calcium and alkalinity concentrations that are approximately half those observed in Turkey Lake (Table 2). Alkalinity is a measure of a lake's ability to neutralize acid. Hence Batchawana Lake is more sensitive to the effects of acid rain than Turkey Lake. In contrast to calcium and alkalinity, sulphate concentrations (an indicator of acid rain input) are almost equal in Batchawana Lake and Turkey Lake. Changes in major element chemistry observed over time are presented in the "Streams" section.
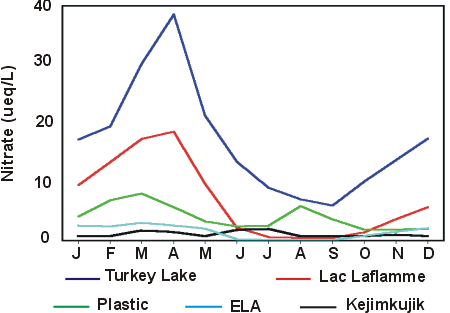
Lake water phosphorus concentrations are low (6-8 mg/L), and as is the case with most lakes, phosphorus availability limits algal growth in the TLW. Nitrogen (e.g. ammonium and nitrate in Table 2) varies irregularly between lakes, but concentrations (particularly nitrate) exhibit a pronounced annual cycle (Figure 3). The seasonal pattern observed for nitrate indicates that nitrogen-based acidification is more important in the TLW than in any of the other sites shown in Figure 3.
Lake water phosphorus concentrations are low (6-8 mg/L), and as is the case with most lakes, phosphorus availability limits algal growth in the TLW. Nitrogen (e.g. ammonium and nitrate in Table 2) varies irregularly between lakes, but concentrations (particularly nitrate) exhibit a pronounced annual cycle (Figure 3). The seasonal pattern observed for nitrate indicates that nitrogen-based acidification is more important in the TLW than in any of the other sites shown in Figure 3.

Figure 3: Long Description
Average monthly nitrate in Turkey Lake and other monitoring sites in eastern Canada. Nitrogen varies irregularly between lakes, but concentrations (particularly nitrate) exhibit a pronounced annual cycle. The seasonal pattern observed for nitrate indicates that nitrogen-based acidification is more important in the TLW than in any of the other sites.

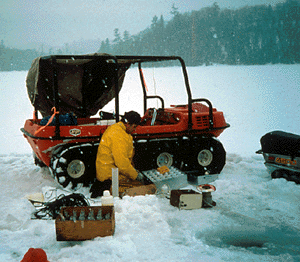
Winter sampling water chemistry on Batchawana Lake

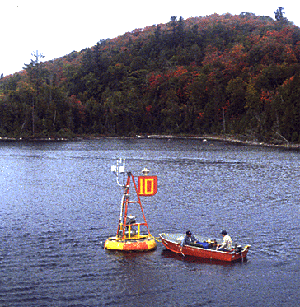
Sampling water chemistry on Little Turkey Lake