It is with great pleasure that I present the 2022-2023 Canada Water Act Annual Report to Parliament and Canadians. In the spirit of transparency and accountability, and as required by the Canada Water Act, this report describes operations under the Act for 2022-2023.
This is a unique time for freshwater governance in Canada with the creation of the Canada Water Agency within Environment and Climate Change Canada. This is an interim step, as the Government of Canada introduced legislation in 2023 that would establish the Canada Water Agency as a stand-alone entity. The Agency provides leadership, effective federal collaboration, and improved coordination and collaboration with provinces, territories, and Indigenous peoples to proactively address national and regional transboundary freshwater challenges and opportunities. Budget 2023 announced significant investments in the Canada Water Agency and major waterbodies across the country, including the Great Lakes, Lake Winnipeg, Lake of the Woods, the St. Lawrence River, the Fraser River, the Wolastoq/Saint John River, the Mackenzie River, and Lake Simcoe.
Water challenges have increased due to population growth, industrial development, and agricultural intensification. Climate change has advanced, exacerbating water issues. In addition, the United Nations Declaration on the Rights of Indigenous Peoples Act came into force in 2021, requiring the Government of Canada, in consultation and cooperation with Indigenous peoples, to “take all measures necessary to ensure the laws of Canada are consistent with the Declaration.” In addition, the Agency has initiated a review of the Canada Water Act to reflect Canada’s freshwater reality.
This report describes the varied operations conducted under the authority of the Act, including, for example, the work of various water boards created through federal-provincial-territorial agreements and arrangements concluded under the Act. Important water quantity and quality monitoring and research in Canada’s diverse watersheds are key activities also documented by the report.
We are fortunate as Canadians to be the stewards of millions of rivers and 20 percent of the world’s fresh water. The Government of Canada is committed to protecting these waters today, and for future generations.
The Honourable Steven Guilbeault Minister of Environment and Climate Change
1 Introduction
The Canada Water Act (the Act) is administered by the Minister of Environment and Climate Change. It provides a framework for collaboration among federal, provincial and territorial governments in matters relating to water resources. To date, over 40 agreements on water quality and quantity have been formally authorized under the Act. Environment and Climate Change Canada’s (ECCC) scientific efforts in water management are enabled by these agreements, allowing ECCC to conduct water research and monitor the conservation, development, and use of Canada’s water resources.
Part I of the Act provides for the establishment of federal-provincial/territorial arrangements and programs in relation to water resource management. It also enables the Minister of Environment and Climate Change, independently or with others, to conduct research, collect data, and establish inventories on water resources. This part of the Act has been used since the Act came into force in 1970.
Part II of the Act provides for the establishment of federal-provincial/territorial management agreements applicable to designated water quality management areas that are federal waters, or where water quality has become a matter of urgent national concern. It also allows for the planning and implementation of water quality management programs and prohibits pollution in the designated areas. This part of the Act has never been used.
Part III of the Act provided for regulating the concentration of nutrients in cleaning agents and water conditioners. This part was repealed in 1985 and is now incorporated into the Canadian Environmental Protection Act, 1999 (sections 116–119).
Part IV of the Act contains provisions for the general administration of the Act, including annual reporting to Parliament, inspection and enforcement, advisory committees, and public information programs.
Water management in Canada is a responsibility shared between federal, provincial, territorial, and Indigenous governments. The federal government is involved in water-related areas such as fisheries, pollution prevention, shipping and navigation, international relations, domestic transboundary waters, and the creation and management of protected areas. The federal government is also responsible for management of water on federal lands.
The Act is one piece of a legislative framework providing the federal government extensive water management authorities across Canada. Other key pieces of federal legislation with direct links to water management include the following: Department of the Environment Act; Fisheries Act; Migratory Birds Convention Act, 1994; Canadian Environmental Protection Act, 1999; Arctic Waters Pollution Prevention Act; International Boundary Waters Treaty Act; International River Improvements Act; and Canadian Navigable Waters Act.
Canadian provinces and territories have significant responsibility over areas of water management and protection within their borders, including water allocation and use, drinking water and wastewater services, source water protection, managing inland fisheries, aquatic species at risk, and invasive species.
Under many historic and modern treaties, and self-government agreements, Indigenous peoples have water-related rights. Indigenous peoples are also involved in transboundary water management, including through water management boards. Water management also intersects with Aboriginal and treaty rights recognized and affirmed by section 35 of Canada’s Constitution Act, 1982.
This report describes a wide range of federal operations conducted under the authority of the Act between April 1, 2022 and March 31, 2023. This includes participation in federal-provincial/territorial agreements and arrangements, significant water monitoring and research, and public information programs. It also includes work done under the Act to safeguard the water quality and quantity of Canada’s watersheds.
1.1 Highlights of the 2022–2023 annual report
This year marked the successful completion of the prediction component of Environment and Climate Change Canada’s National Hydrological Service (NHS) – Transformation Initiative. As a result, the National Surface and River Prediction System (NSRPS), an integrated atmospheric, land surface and streamflow prediction system is now operational and available online. The new predictive products and services developed by ECCC are used to support modelling activities for transboundary studies and provincial/territorial water management and flood/drought forecasting.
The Government of Canada created the Canada Water Agency to improve freshwater management in Canada by providing leadership, effective collaboration federally, and improved coordination and collaboration with provinces, territories, and Indigenous peoples to proactively address national and regional transboundary freshwater challenges and opportunities.
The application of Canadian Aquatic Biomonitoring Network (CABIN) monitoring by non-government organizations and Indigenous groups and governments is growing. Interest in CABIN has broadened to include non-scientists and citizen scientists. In 2022-2023, ECCC focused on evolving and adapting the CABIN training and certification program and resources to be more accessible and inclusive of all participants. Participants are trained to collect data using nationally standardized protocols, share data through a web-accessible CABIN database, and assess freshwater health using specific analytical tools.
In 2022-2023, Environment and Climate Change Canada (ECCC) completed work on 53 cableways across Canada. Since the start of the NHS Transformation Initiative in 2018, the total number of cableways requiring remedial attention has been significantly reduced. Cableway remediation has reached a stage where there can be sustainable operations, with continued and vigilant life-cycle management. It is important to note that impacts from natural disasters (e.g., floods and fires) are starting to be an imposition on regular operational life cycle management requirements.
1.2 Freshwater action
The Government of Canada remains committed to advancing the federal freshwater agenda, which includes strengthening and expanding the Freshwater Action Plan, creating a Canada Water Agency, and advancing the review of the Canada Water Act.
In Budget 2023, the Government of Canada announced a major investment in fresh water, including:
$650 million over ten years, starting in 2023-2024, to support monitoring, assessment, and restoration work in the Great Lakes, Lake Winnipeg, Lake of the Woods, St. Lawrence River, Fraser River, Saint John River, Mackenzie River, and Lake Simcoe
$22.6 million over three years, starting in 2023-2024, to support better coordination of efforts to protect freshwater across Canada
$85.1 million over five years, starting in 2023-2024, and $21 million ongoing thereafter to support the creation of the Canada Water Agency
Budget 2023 also committed to the involvement of Indigenous peoples in the implementation of the Freshwater Action Plan, through greater engagement, and seeking Indigenous advisory expertise, especially from women who are the traditional “water carriers” in Indigenous communities.
Following the establishment of a Canada Water Agency, the Government of Canada has initiated review of the Canada Water Act to reflect Canada’s freshwater reality.
2 Freshwater monitoring
ECCC is the federal department responsible for collecting, interpreting, and providing critical standardized water quantity and water quality information that Canadians and their institutions need to make informed water management decisions to protect and provide stewardship of fresh water in Canada.
ECCC, in collaboration with provincial and territorial governments and others, conducts three types of monitoring in fresh water across Canada to obtain information on water quantity, freshwater quality, and biological condition. In a few cases, Indigenous peoples, institutions, or volunteers assist with monitoring. Hydrometric agreements concluded under the authority of the Canada Water Act provide the framework for these monitoring activities.
2.1 Water quantity monitoring
ECCC provides for the collection, interpretation, and dissemination of surface water quantity data and information that is vital to meet both water management and environmental needs across the country.
Hydrometric agreements
ECCC relies on agreements with the provinces and territories to support the evolution of the hydrometric network and associated services to respond to the needs of Canadian populations. These agreements have been administered cooperatively since 1975 and, except for Newfoundland and Labrador, New Brunswick, and Saskatchewan, have been renewed since 2008. In addition, ECCC is a co-signee of the annual Memorandum of Agreement on Water with the province of Prince Edward Island. The intent of the Agreement is to coordinate the efforts of the provincial and federal governments to monitor the health of aquatic ecosystems, including water quantity, on PEI to ensure that the sustainability of the province’s water resources is maintained for environmental, social, and economic benefit.
2.1.1 National hydrometric monitoring network
During 2022-2023, a number of small adjustments were made to the national hydrometric monitoring network. Detailed hydrometric monitoring network changes are provided in section “2.4 Monitoring information by region”. The national hydrometric monitoring network consisted of 2922 hydrometric monitoring stations (see Table 1 and Figure 1). During this period, ECCC operated 2256 of these hydrometric stations. Of the ECCC-operated stations, 1164 were fully or partially federally funded. The remaining stations were operated by ECCC on behalf of provincial and territorial governments or a third-party interest, and cost-sharing was based on specific needs and requirements (see Table 1). In Quebec, the Ministry of Sustainable Development, Environment and the Fight against Climate Change operated 236 stations, some funded in whole or in part by the Government of Canada. The provinces of Manitoba and Saskatchewan also operate a significant portion of the stations in their jurisdictions.
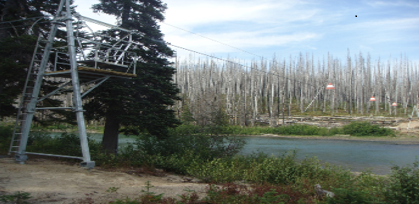
What is a cableway?
A cableway is a structure that allows technicians to conduct a streamflow measurement above a river cross section. The cable car houses the technician and their measuring equipment. The technician pulls themselves across the river cross section stopping to take streamflow measurements at defined intervals based on the width of the river.
The National Hydrometric Service Transformation Initiative, which began in 2018, received funding to address 360 deteriorating cableways and other contaminated hydrometric monitoring sites across Canada. In 2022-2023, although there were still minor lingering effects from COVID-19 on the delivery of the national work plan, ECCC was able to complete work on 53 cableways. This work included the repair/retrofitting of 38 cableways and the removal/decommissioning and site remediation at 15 locations. Significant progress has been made since 2018; to date 224 cableways have been either repaired, repurposed, or replaced with alternative technologies through the Initiative. (Note that this number has decreased since last year as a few previously repaired stations were damaged during environmental disasters and now require repair once again.)
The total number of cableways requiring remedial attention is much lower than five years ago. Currently, the status of the cableway remediation has reached a stage where there can be sustainable operations with continued and vigilant life-cycle management of the infrastructure. It is important to note, that impacts from more frequent natural disasters (e.g., floods and fires) is starting to be an imposition on managing regular operational life cycle management requirements, as infrastructure has been, and may continue to be, destroyed or damaged by these events.
In addition to the work on cableways, ECCC has remediated and decommissioned 27 sites in the past year, including legacy abandoned creosote wells and sites with residual contaminants, such as mercury and poly-aromatic hydrocarbons.
Figure 1: National hydrometric monitoring network
Long description for Figure 1
Figure 1 is a map of Canada indicating the location of 2,922 hydrometric monitoring stations.
ECCC-operated monitoring stations that are federally funded, cost-shared, and provincially or territorially funded are indicated by symbols.
Table 1: Stations within the National hydrometric monitoring network (ECCC-operated by cost arrangement)
Province/territorya
Federal
Cost-sharedb
Province/territory
Third party
Non-ECCC-operated (various cost arrangements)
Total by province or territory
Alberta
80
159
159
42
57
497
British Columbia
50
186
216
1
6
459
Manitoba
31
81
112
0
178
402
New Brunswick
14
17
29c
1
0
61
Newfoundland & Labrador
16
32
64
0
3
115
Nova Scotia
10
6
15
0
0
31
Northwest Territories
43
23
21
17
0
105
Nunavut
13
6
3
3
0
25
Ontario
128
68
336
9
44
585
Prince Edward Island
0
5
1
4
0
10
Quebec
15
0
0
0
236
251
Saskatchewan
95
51
18
3
142
306
Yukon
9
26
30
10
0
75
TOTAL
504
660
1005
87
666
2922
a Hydrometric monitoring stations located within the boundaries of each province, no matter which office operates them.
b Stations that are partially funded by the federal government, provincial/territorial governments, and third parties. The cost-share ratio varies by station.
c Nine of these stations are groundwater stations.
Notes: The actual total change in the network for 2021–2022 is +9 stations. An error in the total for 2020–2021 missed 37 stations from Alberta’s count.
The network also includes a small number of designated International Gauging Stations located in the United States that are not included here as they support International Joint Commission activities not covered under the Canada Water Act.
2.1.2 Data dissemination
In 2022-2023, the ECCC published a pre-release of the National Hydrometric Network (NHN) basin delineation polygons on the collaboration site, which can be accessed through WaterOffice. This pre-release version of the dataset contains drainage area polygons for over 7300 of the 7896 active and discontinued hydrometric stations. ECCC also released its the offline historical databases four times throughout the year in April, July, October 2022, and January 2023.
Watershed boundaries
There are more than 1382 basins covering the entire Canadian landmass. Accurate delineation of a watershed plays an extremely important role in the management of the watershed. The delineated boundaries form the nucleus around which the management efforts such as land use, land change, soil types, geology and river flows are analyzed, and appropriate conclusions drawn. It is also an important step in the study of flooding.
A drainage basin is an area that drains all precipitation received as a runoff or base flow (groundwater sources) into a particular river or set of rivers. A drainage area polygon is the geographical extent of a land surface that drains to a given point, ECCC’s Water Survey of Canada (ECCC WSC) drainage basin polygons delineate the watershed boundaries upstream of its gauges.
ECCC WSC recently updated and completed its national drainage basin polygons dataset using consistent input datasets and geographical information system (GIS) tools and methods.
ECCC strives to continually improve the dissemination of hydrometric information. This year changes were made to improve the visualization and functionality to WaterOffice Map Search. WaterOffice users can now view the drainage basin delineation of a selected station to better understand the contributing area of that station. The map symbology was also updated to provide better visualization for seasonal station operation schedules, when a seasonal station is not operating the map icon is now colored orange to indicate it is out of season. The WaterOffice Map Search functionality was improved to allow users to filter the search based on the station name, station number, province/territory, region, major basin, parameter type (water level vs. discharge), the operation schedule (seasonal vs. continuous) and the operating agencies. This change allows site users to modify the map view according to their interests and a new action button allows users to Export the Metadata for Displayed Stations based on the filter selections.
Provincial and territorial agencies are largely responsible for issuing flood forecasts and warnings in Canada. The hydrometric data provided by ECCC is critical to support the provinces and territories flood forecasting and monitoring efforts across the country. To ensure that hydrometric data were available when needed during critical high-water periods 24/7, after-hours technical support was provided during the 2022 spring freshet.
2.2 Freshwater quality monitoring
Freshwater quality monitoring has been a core ECCC program since the Department’s inception in the early 1970s. The Department’s monitoring and surveillance activities are critical for assessing and reporting on water quality status and trends, in addition to fulfilling federal domestic and international commitments and legislative obligations. ECCC monitors freshwater quality on federal lands, transboundary watersheds, and inland waters in partnership with provinces and territories, as well as contributing to the understanding of water quality of priority ecosystems and programs. Data are also used to support the water quality indicator developed under the Canadian Environmental Sustainability Indicators program (CESI) (see Section 3).
Many of the Freshwater Quality Monitoring Program’s activities are carried out through federal-provincial/territorial agreements, ensuring cost-effective and non-duplicative program delivery. ECCC has water quality monitoring agreements with British Columbia, Yukon, Manitoba, Quebec, Prince Edward Island, New Brunswick, and Newfoundland and Labrador.
The objectives of the federal-provincial/territorial water quality monitoring agreements are to:
achieve a long-term commitment for the acquisition of water quality data;
obtain comparable, scientifically-sound water quality data that are reliable to inform water resource management; and
disseminate water quality information in a timely manner to the public, government agencies, industry, and the scientific community.
Additional long-term freshwater quality monitoring activities are implemented through on-going collaborations with other Government of Canada departments and agencies. ECCC partners with the Parks Canada to monitor freshwater quality on federal lands in 16 national parks and works with Crown-Indigenous Relations and Northern Affairs Canada (CIRNAC) towards understanding cumulative impacts on aquatic ecosystem health in the mainland Nunavut region. The freshwater quality monitoring program also contributes to monitoring and assessment activities in waterbodies of significant national interest including the Great Lakes, St. Lawrence River Basin, Lake Winnipeg, and Lake of the Woods (Section 5); and through participation in initiatives such as the Oil Sands Monitoring Program.
In 2022-2023, 626 sites were sampled as part of ECCC’s long-term freshwater quality monitoring networks, compared to 227 sites the previous year. The observed increase in monitoring sites in 2022-2023 is largely due to the inclusion of sites that were not previously included in the Canada Water Act report, but do provide a more complete picture of the Government of Canada’s freshwater quality monitoring activities: 1) individual sampling sites from large lake monitoring activities, which form part of water quality monitoring and surveillance program activities for the Great Lakes and Lake of the Woods, and; 2) previously established sites monitored through long-standing partnerships with other federal departments such as CIRNAC and Parks Canada.
Federal-provincial and federal-territorial water quality monitoring agreements continue to be an important element of ECCC’s freshwater quality monitoring program, accounting for roughly half of all ECCC river monitoring sites, in addition to sites that are included as part of ECCC’s primary long-term freshwater quality monitoring network in Great Lakes inter-connecting channels and rivers (Figure 2). The map also displays long-term sampling sites carried out in collaboration with Parks Canada (96 sites) and CIRNAC (five sites), as well as stations monitored at various times within priority ecosystems areas contributing to programs such as the Freshwater Action Plan and the Oil Sands Monitoring program (Table 2). Roughly one third of the 626 sites, were sampled in international (Canada-US) and domestic (inter-provincial and territorial drainage regions) transboundary watersheds and boundary waters, including those monitored in fulfillment of ECCC’s obligations to the Prairie Provinces Basin Board (Section 5.1).
Figure 2: Long-term water quality monitoring sites
Long description for Figure 2
Figure 2 is a map of Canada indicating the location of long-term water quality monitoring sites. The long-term freshwater quality monitoring network consists of federal, federal-provincial and federal-territorial sampling sites across Canada. They are situated in the following ocean drainage areas: Arctic Ocean, Atlantic Ocean, Gulf of Mexico, Hudson Bay and Pacific Ocean.
Large lakes are presented as a single marker representing a network of individual monitoring sites sampled on a rotational basis.
The Long-Term Freshwater Quality Monitoring Network consists of 180 federal, federal-provincial and federal-territorial sampling sites across Canada (see Figure 2). The map also displays 32 sites that are monitored in Canada-US Transboundary Waters, as well as the location of sites monitored at various times under the Federal Great Lakes Program. Water quality samples are routinely collected at these sites for physical and chemical water quality parameters such as temperature, pH, alkalinity, turbidity, major ions, nutrients, and metals. Pesticides, bacteria, and additional parameters of concern are also monitored where site-specific water quality issues exist. The National Long-Term Water Quality Monitoring Data are published online. ECCC’s Freshwater Quality Monitoring Program is aligned with Canada’s major watersheds (Pacific, Arctic/Athabasca, Hudson Bay, and Atlantic watersheds). This program promotes robust water resource management across Canada.
Table 2: Sites within ECCC’s long-term water monitoring networks (Monitoring mechanisms)
Province/territory
ECCC
Federal- provincial/
territorial agreement
ECCC-
Parks Canada
ECCC-CIRNAC
Canada-Alberta
Total by province or territorya
ECCC Priority Ecosystem & Program areasb
Alberta
3
4
7
0
7
21
21 (Oil Sands, Lake Winnipeg Basin)
British Columbia
0
47
0
0
0
47
0
Manitoba
22
3
0
0
0
25
25 (Lake Winnipeg
Basin)
New Brunswick
5
15
21
0
0
41
0
Newfoundland & Labrador
0
24
17
0
0
41
0
Nova Scotia
13
0
29
0
0
42
0
Northwest Territories
9
0
12
0
1
22
1 (Oil Sands)
Nunavut
2
0
8
5
0
15
0
Ontario
296
0
0
0
0
296
296 (Lake Winnipeg, Lake of the Woods, Great Lakes, St. Lawrence River Basin)
Prince Edward Island
0
3
0
0
0
3
0
Quebec
11
39
0
0
0
50
50 (St. Lawrence River Basin)
Saskatchewan
1
7
0
0
0
8
6c (Lake Winnipeg Basin)
Yukon
0
13
2
0
0
15
0
TOTAL
362
155
96
5
8
626
399
a Total number of sites by province and territory through ECCC, Federal-Provincial and Federal-Territorial agreements, Memorandums of Understanding with Parks Canada and CIRNAC, and the Joint Canada-Alberta Oil Sands Monitoring Program. b Indicates the number of sites located in Priority Ecosystems and Program areas among long-term freshwater quality monitoring networks including riverine and lake sites. c Only six of the Saskatchewan sites are part of the Lake Winnipeg Basin. The remaining two sites are part of the Churchill River watershed.
ECCC conducts monitoring and surveillance activities based on the level of risk to water quality in a watershed. Risk is assessed based on the nature, probability, frequency and severity of stress. Through a risk-based adaptive management framework (RBAMF), ECCC optimizes its activities to reach results that are more targeted and better adapted to the needs of users and the Canadian population. To improve reporting outcomes the RBAMF:
defines monitoring responsibilities.
identifies risks to water quality at monitoring sites and across Canada’s drainage basins.
optimizes monitoring operations.
ensures data quality and data access.
Existing long-term monitoring sites have been classified under a series of national scale networks, namely Large Rivers, Large Lakes Priority, Transboundary Rivers, Reference, and High Stress, where each network includes a set of specific national monitoring objectives. Each network was developed to improve comparability of monitoring data.
In 2021-2022, following recommendations of the Commissioner of Environment and Sustainable Development (CESD AuditFootnote 1), ECCC initiated a five-year review of the RBAMF elements as they apply to each drainage basin, to ensure continuous improvement of its freshwater monitoring approach. The freshwater quality monitoring program continued to improve and refine the RBAMF approach for the Pacific, Arctic, and Athabasca region in 2022-2023. In the first year of the review, ECCC focused on the Atlantic and Quebec region.
The Canadian Aquatic Biomonitoring Network (CABIN) is a collaborative network led and maintained by ECCC. It is a component of the Freshwater Quality Monitoring Program that assesses the health of freshwater ecosystems in Canada with standardized biomonitoring using benthic macroinvertebrates. CABIN benthic macroinvertebrate samples provide information about biological conditions that complement water quality monitoring by characterizing current health status and detect changes in types and numbers of benthic macroinvertebrates that may reflect long-term exposure to disturbances, to help Canadians assess aquatic ecosystem health. CABIN participants include federal departments, provincial and territorial governments, industry, academia, and non‑governmental organizations such as community watershed groups. They are trained to collect data using nationally standardized protocols, share data through a web-accessible CABIN database, and assess freshwater health using specific analytical tools. Participation in CABIN reduces the resources required by any single organization to perform comparable assessments of aquatic ecosystem health across Canada.
In 2022, CABIN sampling occurred at 716 sites in various sub-basins across the country, an increase of 296 sites from 2021 (Figure 3, Table 3). The increase in sites is due, in part, to the inclusion of CABIN samples collected by industry and environmental consultants, which were not previously including in Canada Water Act reporting. Thirty percent (30%) of CABIN monitoring in 2022 was conducted by federal departments and 70% of monitoring conducted by other organizations, or in partnership with ECCC. While CABIN aims to provide open data that is machine-readable, freely shared, used, and built on without restrictions, CABIN also recognizes Indigenous data sovereignty, including the First Nation principles of OCAP (ownership, control, access, and possession). Data collected by the network since the early 1990s from over 12 000 locations across the country are stored in the CABIN database.
The application of CABIN monitoring by non-government organizations and Indigenous groups and governments is growing. Interest in CABIN has broadened to include non-scientists and citizen scientists. In 2022-2023, ECCC focused on evolving and adapting the CABIN training and certification program and resources to be more accessible and inclusive of all participants. ECCC also participated in collaborative research with academia and community-based monitoring groups to evaluate the potential for new technology in biological monitoring, such as DNA metabarcoding, as well as the use of new protocols for other freshwater habitats including wetlands and large rivers.
Figure 3: 2022 CABIN monitoring sites
Note: Reference sites represent habitats that are closest to “natural” before any human impact. The data from these sites are used to create reference models. CABIN partners use these models to evaluate their test sites in an approach known as the Reference Condition Approach (RCA). The extent of the differences between the test site communities and the reference site communities allows CABIN partners to estimate the severity of the impacts at those locations.
Long description for Figure 3
Figure 3 is a map of Canada that shows the location of the CABIN monitoring sites across the country.
Table 3. 2022 CABIN sites sampled across Canada by various network partners (CABIN network contributions)
Province/
territory
Federal
Federal- provincial/
territoriala
Provincial,
territorial, and municipal
governments
Indigenous
groups and governments
Industry & environmental consultants
NGOs
Other authorityb
Total by province or territoryc
Alberta
49
82
0
0
15
16
23
185
British Columbia
26
10
55
26
201
18
4
340
Manitoba
0
0
0
0
0
0
0
0
New Brunswick
32
0
0
0
0
4
0
36
Newfoundland & Labrador
10
7
0
0
0
0
0
17
Nova Scotia
29
0
0
0
0
6
1
36
Northwest Territories
17
0
0
0
0
0
0
17
Nunavut
0
0
0
0
0
0
0
0
Ontario
22
0
0
0
0
0
0
22
Prince Edward Island
10
8
0
0
0
0
0
18
Quebec
14
0
0
0
0
0
0
14
Saskatchewan
0
0
0
0
0
0
0
0
Yukon
0
5
4
0
22
0
0
31
Total
209
112
59
26
238
44
28
716d
a Includes CABIN sampling carried out through federal-provincial and federal-territorial agreements as well as sampling through a collaborative agreement between ECCC, Alberta, and Industry (Joint Canada-Alberta Oil Sands Monitoring Program).
b Indicates CABIN sites sampled as part of academic studies or by unknown authorities.
c Total number of samples contributed to CABIN shared database by province and territory.
d A large portion of the additional 296 stations in 2022-2023, compared to 2021-2022, is due to the inclusion of samples collected by Industry and Environmental Consultants not in previous Canada Water Act annual reports.
2.4 Monitoring information by region
Summaries of the monitoring conducted in the various regions across Canada are discussed below on a region-by-region basis, noting that some jurisdictions may overlap regional boundaries (e.g., Yukon overlaps both the Pacific Coast and Northern Canada regions), as follows:
water quantity monitoring
water quality monitoring
CABIN monitoring
2.4.1 Pacific coast
Water quantity monitoring
As a result of the catastrophic British Columbia (BC) flooding in November of 2021, there was an increased awareness and demand for ECCC’s water quantity monitoring data from the general public, and government/other officials.
In BC, the seasonal snowpack was slightly below normal by mid-winter 2021-2022, however, cold and wet conditions throughout March and April resulted in higher-than-normal snowpacks across the province in the lead up to the 2022 Freshet.
Figure 4a: Basin Snowpack Indices March 1st, 2022
Long description for Figure 4a
This map of BC indicates snow basin indices in: Basin Snowpack Indices March 1st, 2022 using colours to indicate levels of water contained within the snowpack. The colours range from red (indicating high snow water equivalent [SWE]) to dark green (indicating lower SWE).
The figure shows higher than normal SWE in March 2022.
Figure 4b: Basin Snowpack Indices April 1, 2022
Long description for Figure 4b
This map of BC in April 2022 indicates snow basin indices using colours to indicate levels of water contained within the snowpack. The colours range from red (indicating high snow water equivalent [SWE]) to dark green (indicating lower SWE).
The figure shows higher than normal SWE and higher-than-average spring peak flows.
Temperatures in most of BC remained moderate into the spring, prolonging seasonal melt. The above-normal snowpack resulted in higher-than-average spring peak flows in areas such as the Fraser River Valley, Skeena River Region, Fort Nelson, the Southern Interior, and the Boundary Region. Many communities issued states of emergency due to prolonged flooding as heavy rains extended the high-water level period late into the spring.
After a wet spring, the summer of 2022 was hot and dry. Many river systems recorded some of the lowest water levels on record, specifically on Vancouver Island and in the Okanagan. The province experienced very little rain over the summer months and extreme droughts persisted late into the fall in many regions.
The onset of winter was gradual across BC in 2022 and no major atmospheric rivers were recorded on the south coast of the province until late into December, for which localized flooding was minimal.
The water quantity monitoring network in BC consists of 459 hydrometric monitoring stations. Ninety-six percent of the 459 stations transmit data in real-time via telemetry. Fifteen stations have remote satellite cameras to assist operational activities.
In 2022-2023, three (3) stations were added to the network, one to reestablish monitoring on the Nicola River at a new location following the November 2021 flood. Five (5) stations were removed from the network, two due to the complete loss of infrastructure during the November 2021 flooding event.
In 2022-2023, ECCC conducted joint monitoring with the provincial Ministry of Environment and Climate Change Strategy at 47 active sites, which include 44 sites in the Pacific watershed and three sites in the Mackenzie watershed. Twenty of these sites are co-located with hydrometric gauging stations and five of these sites are operated in cooperation with Parks Canada in Glacier, Yoho, Mount Revelstoke, and Kootenay National Parks. Twenty-one sites are in the international transboundary watersheds of the Columbia River, including the Okanagan and Similkameen Rivers, the Salmon, Sumas and Iskut Rivers. An additional four sites are located within the Mackenzie River watershed, including three in the Peace-Athabasca sub-basin and one in the Petitot River. ECCC also operates three real-time automated monitoring buoys, two in Osoyoos Lake and one on the Fraser River that provide real-time continuous water quality data.
Annual water monitoring activities were negotiated and documented in the British Columbia Water Quality Monitoring Agreement Business Plan (2022-2023). Highlights include:
ECCC established relationships with First Nations communities in the Nechako and Fort Nelson areas, and trained community members in water quality sampling techniques.
BC and ECCC presented data from the long-term water quality program, including trends in phosphorus and chloride in the Okanagan River, and dissolved oxygen concentrations and temperature in the Osoyoos Lake at the Osoyoos Lake Forum in October
ECCC collaborated with BC to update the Canada-BC website hosted by British Columbia with Water Quality Index scores and new sites (Canada-B.C. Water Quality Monitoring Program – Province of British Columbia). This website aims to present water quality information, including links to data and trend results through a single ArcGIS online tool.
CABIN monitoring
British Columbia
In BC, CABIN monitoring is jointly conducted under the Canada-British Columbia Water Quality Monitoring Agreement. Under the Agreement, ECCC and the provincial Ministry of Environment and Climate Change Strategy continued to collaborate on data collection for reference model maintenance as well as development and site assessment.
In 2022-2023, ECCC conducted CABIN monitoring at 10 long-term water quality monitoring sites in BC under the Canada-BC Water Quality Monitoring Agreement. Of those, four sites were co-located with ECCC sites, four were transboundary sites, and two were in National Parks.
There are nine reference models available to all CABIN users in BC. These models provide baselines for biological assessments in nearly all watersheds across BC. The reference models were developed collaboratively by ECCC, Parks Canada, and the British Columbia Ministry of Environment and Climate Change Strategy. In 2022-2023 the Central/North Coast reference model was updated to include an additional seven years (86 samples) of reference data. The update was led by the BC Ministry of Environment and Climate Change Strategy with model review, database support and model testing from ECCC.
Twelve sites were sampled in 2022 to contribute to the maintenance and revision of reference models. In addition, four former reference sites were sampled to track the impacts of recent flooding and forestry on their condition.
2.4.2 Northern Canada
Water quantity monitoring
Northwest Territories (105 stations)
The community of Hay River and adjacent K’atl’odeeche First Nation experienced significant flooding in 2022. Peak water levels exceeded those on record since 1963Footnote 2 by over two (2) metres and were a result of river ice processes and associated snowmelt. The community was evacuated with significant damage occurring to homes and structures. Other communities along the Mackenzie River experienced high water events during break-up and were under evacuation notices at various points during the break-up period. Persistent high-water levels on Great Slave Lake returned to seasonal normals in the late summer and early fall of 2022. The return to seasonal conditions in the fall will help reduce transportation issues along the Mackenzie River, a major supply route for northern communities. The data and information collected by ECCC was used by the Government of Northwest Territories emergency response agency to issue flood advisories and evacuation notices.
The water quantity monitoring network in this region was adjusted as follows:
Two (2) new stations were added to the NWT hydrometric network in 2022.
Remote satellite cameras were deployed at two (2) stations to support Government of Northwest Territories flood forecasting activities.
Yukon (75 stations)
Record high snowpack conditions were again a significant contributing factor to extreme events in the Yukon. The Southern Lakes district once again experienced high water levels. Although, they did not reach 2021 levels, high water levels persisted for a longer duration in 2022 and caused significant erosion in some areas. The flow on the Yukon River at Whitehorse was elevated for a significant portion of the summer season increasing the risk of ice-related flooding at freeze up. Localized flood watches and warnings were issued in several communities – Carmacks, Ross River, Dawson City, Mayo, Teslin and Upper Liard – as a result of spring freshet and river ice processes during break-up. ECCC staff based in the Yukon were active during high water events, ensuring data were available and representative of conditions.
The water quantity monitoring network in this region was adjusted as follows:
No stations were added or removed from the Yukon network in 2022.
Remote satellite cameras were installed at two (2) locations to support operational activities and the Yukon Government flood forecasting.
Nunavut (25 stations)
ECCC staff based in Yellowknife were once again active in supporting the City of Iqaluit by operating a small network of gauges to support water diversion activities to replenish the city’s water supply reservoir. These activities are in accordance with a revenue agreement between ECCC and the City of Iqaluit. The hydrometric network in Nunavut is currently co-managed by ECCC and CIRNAC through a Memoradum of Understanding. Discussions have begun to transfer responsibility to the Government of Nunavut as part of the devolution process.
The water quantity monitoring network in this region is as follows:
Within Nunavut, the 25 hydrometric stations are run by ECCC in accordance with the established cost-share agreement between ECCC, CIRNAC, Parks Canada and the City of Iqaluit. ECCC provided critical data to support the City of Iqaluit’s water supply strategy.
Water quality monitoring
Many of the High Arctic sites are considered relatively pristine and provide an important baseline and reference for comparison with respect to long-range transport of atmospheric pollutants to high-latitude areas, as well as for any potential future influences from human activities in the North. ECCC operates water quality sites on major rivers in the North, some associated with transboundary rivers (e.g. Mackenzie River, Slave River, Liard River, Yukon River) and other significant northern watersheds (e.g. Coppermine River, Thelon River, Great Bear Lake/River).
In 2022-2023, ECCC monitored 52 sites within the Arctic watershed and across the North: 22 in the Northwest Territories, 15 in Nunavut, 15 in Yukon. Twenty-eight of these sites were operated under several agreements with Parks Canada and CIRNAC and thirty-two of these sites are co-located with ECCC’s hydrometric gauge stations.
Yukon
Water quality monitoring in the Yukon is conducted under the Canada-Yukon Water Quality and Aquatic Ecosystem Monitoring Agreement.
In 2022-2023, ECCC conducted joint monitoring with the Yukon Government at 15 active stations which include 11 stations in the Pacific Watershed and 4 stations in the Arctic watershed. Eight of these sites are co-located with hydrometric gauge stations. Three sites are operated in cooperation with Parks Canada in Kluane and Ivvavik National Parks and thirteen sites are in the international transboundary watersheds including the Yukon River and two small coastal watersheds draining into the Pacific (Alsek River) and Arctic (Firth River). An additional two sites are located within the Peel and Liard River sub-basins of the Mackenzie River watershed. ECCC also operates one automated water quality station on the Klondike River.
The annual water monitoring activities were negotiated and documented in the Canada-Yukon Operational Plan (2022-2023). Highlights include:
ECCC conducted risk-based assessments on five water quality monitoring sites in the Yukon to support ECCC’s Risk Based Adaptive Management Framework.
Yukon Government published the South McQuesten River Cumulative Impact Study using data and trend analysis from the long-term federal-territorial site on the South Mcquesten River.
Northwest Territories
Water quality monitoring was conducted in the Northwest Territories under agreements with ECCC and Parks Canada’s Nahanni National Park Reserve and Western Arctic Parks Field Unit. Nine river sites were monitored in collaboration with ECCC-NHS and 12 river sites were monitored in three National Parks. There is also a sampling site at the mouth of the Slave River as part of the Oil Sands Monitoring Program that is co-located with a buoy that monitors in-situ parameters with a water quality sonde.Footnote 3
Nunavut
Water quality monitoring was conducted in Nunavut under agreements with ECCC, CIRNAC and Parks Canada’s Eastern Arctic Parks. Two river sites were monitored in collaboration with ECCC, five river sites were monitored in the Baker Lake Basin in collaboration with CIRNAC, and eight river sites were monitored in three National Parks in collaboration with Parks Canada.
CABIN monitoring
CABIN monitoring in Northern Canada is done where possible to complement water quality monitoring under established agreements.
Yukon
Yukon CABIN reference model is available to all Yukon CABIN users to conduct biological assessments; it was designed to assess test sites related to placer mining activities specifically. The Yukon model was developed collaboratively by federal and territorial agencies (ECCC, Department of Fisheries and Oceans, and Government of Yukon).
In 2022-2023, ECCC conducted CABIN monitoring at five long-term water quality monitoring sites in Yukon under the Canada-Yukon Water Quality Monitoring and Reporting Agreement. Of those, three (3) sites were co-located with ECCC Water Survey of Canada sites.
Northwest Territories
CABIN sampling was conducted in Nahanni National Park Reserve (NNPR) under the Nahanni National Park Reserve CABIN monitoring program. NNPR staff conducted CABIN sampling at 17 stations within the park. Many of the samples collected in 2022-2023 were reference samples to support the maintenance and revision of the South Nahanni Basin CABIN Reference model.
Nunavut
No CABIN monitoring was completed in Nunavut in 2022-2023.
2.4.3 Prairie region
Water quantity monitoring
Alberta
Sustained cold temperatures in the mountain regions resulted in a small spring freshet in the mountains. However, extended rain events in the Rocky Mountains and foothills in mid-June caused rapid and above average runoff, with some regions recording the highest observed discharge measurements in decades. Daily updates with measurement plans were provided by ECCC to Alberta Environment and Protected Areas River Forecast Center (RFC) to provide the necessary information for flow forecasts.
Northwestern Alberta and parts of the Peace River experienced significant flooding in the spring of 2022. Multiple flood warnings were issued and some areas around the town of High Level were evacuated. Local states of emergency were declared in the Paddle Prairie Métis Nation settlement, Chateh, and Little Red River Cree areas due to localized flooding.
The Birch River Basin (WSC station 07KE001 Birch River below Alice Creek) was affected by significant meltwater contribution to the basin. Water levels broke out from the steep banks and spilled onto the surrounding floodplain, resulting in levels not seen in over 30 years of ECCC operating this site.
A prolonged absence of precipitation in much of the province through the summer months caused low water conditions and associated water use challenges warranting additional surveillance from Operations. Low flow conditions were more pronounced due to a relatively dry spring. The Pine Coulee Reservoir near Stavely reached new historic lows.
At the beginning of 2023, staff installed a Nupoint satellite camera at Clearwater River above Christina River (07CD005). These cameras provide a daily photo of the area, which not only assist with data computations, but also provide an illustration of onsite conditions daily. This camera captured ice breakup in 2023.
The water quantity monitoring network in this region was adjusted as follows:
Alberta (497 stations)
Five (5) stations were relocated to a new location.
Seven (7) stations had improvements performed, such as new shelters installed.
A new passenger-operated cableway was installed at McLeod River Near Whitecourt (07AG004).
Two (2) passenger-operated cableways were retrofit to a bank-operated cableway.
Six (6) cableways were decommissioned.
Four (4) sites were remediated due to mercury contamination.
Eight (8) wells were decommissioned.
Six (6) stations were upgraded to Geostationary Operational Environmental Satellites (GOES) from cellar modem or land line communications to improve data collection.
Data contributed from Alberta Environment and Protected Areas is available at nine (9) new stations.
Saskatchewan (306 stations)
The snowpack in most of the south and central Saskatchewan was below average to average. During the freshet there was ice jamming along the Qu’Appelle River in the Craven Area. There were also some late spring and early summer snow and rainfall events in the Eastern area of Saskatchewan that led to higher flows. This precipitation also brought an end to drought conditions in the region. However, drought conditions continued in Western areas of the province. The northern portions of the province had moderate snowpack and saw near normal to above normal runoff responses.
The water quantity monitoring network in this region was adjusted as follows:
Twelve (12) precipitation sensors were bought by the Saskatchewan Water Security Agency (WSA) and installed at ECCC-operated stations.
One (1) site was remediated due to mercury contamination and moved to a new location.
One (1) station changed designation from federal to third-party and is now funded by SaskPower.
One (1) camera was installed at a United States Geological Survey hydrometric station, the camera is operated by the WSA.
Manitoba (402 stations)
In the winter of 2021-2022, the majority of Manitoba received very high amounts of snowfall, with parts of the province seeing upwards of 156.6 cm of snow – the third highest amount since 1872. There was a relatively slow snow melt in most basins, however between April 1st to June 19, 2022, nearly all of southern Manitoba received near record precipitation resulting in a prolonged spring flood period. Much of the Red River basin received more than 330 mm of rain, which is over 200% of normal during that period. In April and May, Manitoba experienced six Colorado Low weather systems with high precipitation and strong winds, leading to major flooding across the province. A major Colorado Low that occurred in late April on top of frozen ground with substantial snow cover created major flooding in much of southern and central Manitoba. The fourth largest flood in history was recorded on the Red River while record flooding was observed on the Winnipeg River system, the Whiteshell Lakes, and Fisher River. Record flooding was also observed in the Parklands Region and along the tributaries of the Red River. The Assiniboine River saw moderate flooding this spring.
The water quantity monitoring network in this region was adjusted as follows:
Three (3) stations’ operating schedules changed from seasonal to annual (year-round) operation
One (1) station was added to the network at the request of Public Service and Procurement Canada
Operations were ceased at two (2) provincial stations, jointly funded by Manitoba Transportation and Infrastructure and Manitoba Hydro, at the request of Manitoba Hydro.
Water quality monitoring
Alberta
Oil Sands & Wood Buffalo National Park
ECCC collected 62 samples from 10 stations in the Lower Athabasca, Peace and Slave River watersheds in Alberta. Three of these stations have been part of ECCC’s long-term monitoring network since the 1960’s and are monitored along with the remaining seven in partnership with Alberta Environment and Protected Areas under the Oil Sands Monitoring program. Four sites are also co-located with buoys that monitor in-situ parameters with water quality sondes. The monitoring work done under this program was designed to track the cumulative effects of oil sands development in air, water, wildlife, and biodiversity to help inform government and industry decision-making.
Mountain National Parks & Waterton Lake National Park
Water quality monitoring was conducted under a Memorandum of Understanding with Parks Canada at sites in Banff, Jasper, and Waterton Lake National Parks. Two river sites were monitored in Waterton Lake National Park, two river sites were monitored in Jasper, and three river sites were monitored in Banff. These sites provided water quality information to Parks Canada and were used as reference sites as part of ECCC’s Long-term Water Quality Monitoring Program. Analysis of low-level Phosphorous was available and actual values were collected where it had been below the detection level for the previous 40 years.
Alberta/Saskatchewan/Manitoba
As part of the National Long-Term Freshwater Quality Monitoring Network and in support of the Prairie Provinces Water Board Master Agreement on Apportionment (PPWB MAA), ECCC monitors 12 sites along the main rivers crossing between the Alberta, Saskatchewan, and Manitoba provincial boundaries (Section 5.1). In 2022-2023, monthly samples were collected for 11 rivers and quarterly samples were collected from one river in this network. Water quality objectives have been established at the 12 major interprovincial eastward flowing river reaches in Schedule E of the PPWB MAA. Data from this monitoring are used to meet annual reporting obligations on water quality objectives for nutrient, metal, major ion, and pesticide parameters established by Canada, Alberta, Saskatchewan, and Manitoba under the PPWB MAA. These data are also used to support the Lake Winnipeg Basin Program (Section 6.1).
Saskatchewan
Under the International Joint Commission’s International Souris River Board (Section 5.4), ECCC monitored the Souris River at the transboundary monitoring station at Sherwood, North Dakota. A joint water quality sample with the United States Geological Survey (USGS) is taken annually for methodology comparison.
Manitoba
Under the International Joint Commission’s International Red River Watershed Board (IRRWB) (Section 5.4), ECCC monitored the Red River at the transboundary monitoring station at Emerson, Manitoba. Grab-sample monitoring for water quality parameters of interest (nutrients, metals, pesticides, salinity) was conducted at least monthly during ice-cover season and more frequently during the open water season and spring freshet. ECCC also maintains a real-time continuous water quality transboundary monitoring station for select parameters. Continuous and grab-sample monitoring data are made available through the Government of Canada Open Data Portal. Compliance against binational water quality objectives, targets, and alert levels are summarized in annual IRRWB reporting to the International Joint Commission (IJC). New in 2022-2023 are the inclusion of nutrient concentration objectives and nutrient loading targets, which were recently adopted by the Canadian and US governments.
Under the IJC’s International Souris River Board (Section 5.4), ECCC monitored the Souris River at the transboundary monitoring station at Westhope, North Dakota. Grab-sample monitoring for water quality parameters of interest (nutrients, metals, pesticides, salinity) was conducted eight times per year and a joint water quality sample with USGS is taken annually for methodology comparison. Compliance against binational water quality objectives and alert levels are summarized in annual IRRWB reporting to the IJC and regular monitoring updates were provided to the Board in 2022-2023.
As part of the Canada-Manitoba Agreement and under the Science Subsidiary Arrangement made pursuant to the Canada-Manitoba Memorandum of Understanding Respecting Lake Winnipeg and the Lake Winnipeg Basin, ECCC conducted transboundary monitoring on the Pembina River at the Canada-US boundary and the Winnipeg River near the Ontario-Manitoba border. These rivers were monitored 8-12 times per year in 2022-2023 for parameters of concern including nutrients, metals, pesticides, and salinity.
Under the Lake Winnipeg Basin Program, Lake Winnipeg nearshore monitoring was carried out in three seasonal surveys in 2022. Each survey included water quality and aquatic biota monitoring (phytoplankton, zooplankton, benthic macroinvertebrates) at 20 sites within the littoral zone and coastal wetlands. Nearshore aquatic monitoring data had been identified as a gap in knowledge after the previous phase of the Lake Winnipeg Basin Program (Section 6.1).
CABIN monitoring
Alberta
In partnership with Alberta Environment and Protected Areas under the Oil Sands Monitoring program, 82 CABIN samples were collected. The monitoring work done under this program was designed to track the cumulative effects of oil sands development in air, water, wildlife, and biodiversity to help inform government and industry decision-making.
CABIN is also conducted by Parks Canada at other long-term physical-chemical monitoring sites. There is a reference model available to all CABIN users to conduct biological assessments in the Rocky Mountain Parks watersheds developed by Parks Canada which overlaps the British Columbia-Alberta border.
The Alberta Eastern Slopes collaborative (AES) is a partnership of non-governmental organizations, Indigenous groups, ECCC, and Parks Canada working towards the development of a CABIN reference model for the head waters of the Peace, Athabasca, North and South Saskatchewan watersheds. AES obtained the Alberta EcoTrust Funding grant and have established a three-year action plan. Partner organizations will complete necessary training, identify local study objectives and sites, and collect data from streams using CABIN.
Saskatchewan
No CABIN monitoring was completed in Saskatchewan in 2022-2023. The Water Security Agency has its own water quality monitoring and biomonitoring programs and protocols.
Manitoba
No CABIN monitoring was completed in Manitoba in 2022-2023.
2.4.4 Ontario region
Water quantity monitoring
Ontario (544 stations)
There were significant high-water events in 2022-2023 in both southern and northern Ontario. High water in north-west Ontario and the far north of Ontario persisted from March to late May 2022 during the spring freshet. This required emergency flying contracts and additional travel for staff across the province to see several areas operated out of the Thunder Bay sub-office. Southern Ontario saw multiple rain-driven events in the early spring (March) of 2023. This allowed for many opportunities to confirm historical high and medium high flows and determination of stage-discharge relationships.
In 2022-2023, with the lifting of most local public health and federal government restrictions and directives due to COVID, operations gradually returned to pre-pandemic processes. Construction and infrastructure continued to focus on decommissioning of legacy sites, decontamination of remaining mercury gauge locations, and gauge reinstallations to support lifecycle maintenance in addition to planning for large weir rehabilitation projects.
The water quantity monitoring network in this region was adjusted as follows:
Nine (9) new provincially funded gauges were installed to provide real-time flood warning data within the Trent-Severn and Rideau River Watersheds in 2021-2022, were switched to 100% operations in 2022-2023.
Four (4) stations changed operational schedules.
Three (3) gauges were discontinued.
Water quality monitoring
Ontario
In Ontario, coordination of federal-provincial and Canada-United States water quality monitoring is supported through the Canada-Ontario Agreement on Great Lakes Water Quality and Ecosystem Health and the Great Lakes Water Quality Agreement (GLWQA) between Canada and the United States (Section 6.2). Monitoring results generated by ECCC contributed to indicators as part of the State of the Great Lakes 2022 ReportFootnote 4 assessing the status of toxic chemicals in water, sediments and fish, as well as indicators on the status of nutrients, water quality and algae. The core monitoring programs in the Great Lakes also serve as a foundation which supports other federal programs such as the Chemicals Management Plan and the Freshwater Action Plan. In 2022-2023, ECCC water quality monitoring activities continued to be impacted by the pandemic as outbreaks resulted in the interruption of the spring surveillance cruises on Lake Erie and Lake Huron and no annual survey for Lake Superior. Full water quality surveillance cruises on board the CCGS LIMNOS were completed on Lake Ontario (spring) and lakes Erie and Huron (summer). Monitoring of the connecting channels (St. Clair River, Niagara River, and at Wolfe Island) was conducted throughout the year characterizing nutrient transport between Lake Huron, Erie, and Ontario, as well as monitoring for toxic pollutant releases along the St. Clair and Niagara River, and a monitoring site in the St. Lawrence River at Cornwall.
Rainy River – Lake of the Woods
Lake of the Woods water quality monitoring was supported through the Freshwater Action Plan and informed by the International Rainy - Lake of the Woods Watershed Board (Section 5.4). Water quality was monitored at three locations on the Rainy River, and one location on the Winnipeg River at the outflow of Lake of the Woods. A summer lake-wide survey of 21 locations and a winter lake-wide water quality survey of 9 locations were conducted, contributing data to the long-term monitoring database, and supporting various research projects, such as EO Lake Watch. (EOLakeWatch: Satellite earth observations for lake monitoring - Canada.ca).
CABIN monitoring
CABIN monitoring in Ontario region occurred at 22 sites in both stream and wetland habitats. Sampling by Department of National Defense was done at 16 locations (stream and wetland), at Canadian Forces Training Area Burwash and 4th Canadian Division Support Base Petawawa, while Parks Canada sampled six stream stations in Pukaskwa National Park.
The Ontario Ministry of the Environment, Conservation, and Parks has its own water quality monitoring and biomonitoring programs and protocols.
2.4.5 Quebec region
Water quantity monitoring
Quebec (251 stations)
There are 15 stations in Quebec operated by the NHP (see Ontario region for details) and the remaining 236 are operated by Environnement et Lutte contre les changements climatiques Québec. ECCC cost shares stations operated by the province. Streamflow amount and water level for 2022-2023 were generally near normal for the stations operated by ECCC in Quebec.
The water quantity monitoring network in this region was adjusted as follows:
no major changes to the network, with extra travel to the Ungava as a special project, as well as continued isotope sampling
Water quality monitoring
In 2022-2023, the Quebec region's activities under the Canada Water Act were largely carried out under the aegis of the following agreements:
Agreement between the Government of Canada and the Government of Quebec concerning water quality monitoring in Quebec - Canada-Quebec Agreement on the St. Lawrence (2011-2026) (St. Lawrence Action Plan 2011-2026)
In addition, the region has a Memorandum of Understanding between the Direction de la Politique en matière de durabilité and the Direction Sciences et technologie de l'Eau concerning water quality in the Canadian rivers of the Canadian Environmental Sustainability Indicators.
2022-2023 was a year of transition, with the resumption of sampling activities following the cessation of field activities due to the COVID-19 pandemic, and the implementation of recommendations arising from the Risk-Based Adaptive Management Framework. In this respect, the aquatic ecosystem quality monitoring network has been modified to be more optimal. This transition will continue over the next few years.
In 2022-2023, 50 stations located along the St. Lawrence River corridor (from Beauharnois to Lévis) and in the main tributaries were sampled monthly. Sampling began in May rather than April, due to the pandemic. Thirty-nine of these stations were sampled by the province of Quebec, in collaboration with ECCC, as part of the Agreement between the Government of Canada and the Government of Quebec concerning water quality monitoring in Quebec. At nine of these stations, physical parameters, nutrients, chlorophyll, fecal coliforms, and metals were analyzed. The remaining eleven stations, including six new ones, were sampled by ECCC to better identify certain environmental issues related to the St. Lawrence River, such as discharges from major riverside urban agglomerations and pesticide concentrations in tributary rivers draining agricultural land.
The latest analytical results for certain perfluoroalkyl compounds and bisphenols, as well as metals and pesticides, show that water quality in the river section is good in relation to water quality guidelines for the protection of aquatic life. Although pesticides, metals, perfluorooctane sulfonates and perfluorooctanoic acids were detected in over 98% of samples, no exceedance of guidelines was observed in 2022.
Activities carried out in 2022-2023 led to the publication of a fact sheet entitled "Freshwater Wetlands" (PDF), and to the drafting of the Global Portrait of the State of the St. Lawrence River 2024 (as part of ECCC's commitments under the St. Lawrence Action Plan 2011-2026 (Section 5.3). In addition, these activities will enable the calculation of Water Quality Indicators for Canadian rivers, including the calculation of trends and the drafting of a report covering the period between 2019 and 2021.
CABIN monitoring
In the St. Lawrence River Priority Ecosystem, six (6) macroinvertebrates samples were collected by ECCC in Lake St-Pierre wetlands using the CABIN protocol. Eight small tributaries in soft-bottom agricultural streams were sampled for macroinvertebrates by ECCC around Lake St. Pierre as part of the Living Lab Quebec Initiative.
The Quebec Ministry of the Environment and the Fight Against Climate Change has its own water quality monitoring and biomonitoring programs and protocols.
2.4.6 Atlantic region
Water quantity monitoring
Water level and flow conditions in Atlantic Canada for the year were within the normal ranges expected seasonally, with no significant flooding events or historic records set. What remained of the spring freshet at the beginning of 2022-2023 fiscal year was very typical for the entire region. Summer period low water flows were on the low side of normal on the island of Newfoundland during the summer months. Conditions during the winter of 2022-2023 were drier than average in Nova Scotia, with New Brunswick having a normal/slightly above normal snowpack. Low to moderate snowpack was recorded on the island of Newfoundland, with Labrador experiencing typical snowpack amounts.
The noteworthy storm event of the year in Atlantic Canada was Hurricane Fiona, which hit the region in September 2022. It is worth mentioning that Fiona was more damaging from a wind and storm surge perspective along the coast and did not result in historic flow rates in any location. In Newfoundland, Hurricane Fiona made landfall in the Port aux Basque region. There were no major network issues and water levels did rise but not to annual peak or historic levels. In New Brunswick, the hurricane again had some devastating wind damage and ocean surges, which caused widespread coastal flooding and damage. Prince Edward Island and Nova Scotia saw more rain from this event than other regions, and flows were high in several locations but not historic.
An area of focus in 2022-2023 was the ongoing implementation of the continuous data production initiative, which resulted in better data being available to the public sooner. Discussions and planning also began for some relatively significant planned hydrometric network expansion in Nova Scotia, anticipating future investments by the province as well as a third party.
The water quantity monitoring network in this region was adjusted as follows:
New Brunswick (61 stations)
One (1) federal water level station in New Brunswick was decommissioned shortly after the end of the 2022-2023 fiscal year.
Newfoundland & Labrador (115 stations)
Three (3) federal-provincial stations and one (1) provincially funded station were not used for the year in Newfoundland and Labrador.
Nova Scotia (31 stations)
No major changes.
Prince Edward Island (10 stations)
No major changes.
Water quality monitoring
Prince Edward Island
Water Quality Monitoring was conducted in Prince Edward Island under the Canada-Prince Edward Island Memorandum of Agreement. The annual water monitoring activities were negotiated and documented in the 2022-2023 Work Plan under that Agreement.
The PEI Department of Environment, Energy and Climate Action (EECA) conducted monitoring on behalf of ECCC at three sites in the province, and joint ECCC-EECA sampling was conducted at one real time (automated) site on the Wilmot River, which was co-located with a hydrometric station. Data are available on the Government of Prince Edward Island’s website.
Nova Scotia
Water quality monitoring was conducted in Nova Scotia under numerous initiatives and partners including Parks Canada and the Nova Scotia Department of Environment and Climate Change (NSECC).
In 2022-2023, ECCC managed the collection of water quality samples at 13 federal sites (including two automated sites) in Nova Scotia in support of the Canadian Environmental Sustainability Indicator (CESI) pertaining to water quality. NSECC provided support on data collection at three (3) additional sites in support of the Canadian Environmental Sustainability Indicator. The sites are located across the province and cover major watersheds within the Maritime Major Drainage Area, including two (2) rivers flowing into the Bay of Fundy. Samples were collected in all four (4) seasons. In addition, pesticide surveillance was conducted at four (4) high risk sites within the province during the growing season (May to October) as part of the regional freshwater quality monitoring program. A sampling collaboration occurred in both of Nova Scotia’s National Parks with ECCC providing laboratory funding for samples at 29 sites twice a year.
Newfoundland and Labrador
Water Quality Monitoring was conducted in Newfoundland and Labrador under the Canada-Newfoundland and Labrador Water Quality Agreement. The annual water monitoring activities were negotiated and documented in the 2022-2023 Work Plan under that Agreement.
Twenty-four federal-provincial sites across the major drainage areas were sampled four to ten times in 2022-2023, including transboundary sites in tributaries of the Saint Augustine and Petit Mécatina Rivers that flow south into Quebec. Data and station information from the sites are available on the Newfoundland and Labrador Water Resources website. Water quality sampling was also carried out in collaboration with Parks Canada in Terra Nova National Park (6 sites) and Gros Morne National Park (11 sites).
New Brunswick
Under the Canada-New Brunswick Water Quality Agreement during 2022-2023, annual water monitoring activities were negotiated and documented in the 2022-2023 Work Plan.
Fifteen federal-provincial sites were monitored on international and inter-provincial transboundary rivers or their tributaries in the Saint John River (Wolastoq) and Restigouche River watersheds. Three (3) additional real-time automated sites in the Saint John River (Wolastoq) watershed were also maintained by ECCC at the borders of the transboundary Big Presque Isle Stream, Aroostook River and Meduxnekeag River. There is also a buoy deployed seasonally (May-October) in the Saint John River (Wolastoq) near Musquash Island that collects in-situ data using a water quality sonde. Water quality sampling was also conducted in Fundy National Park (15 sites) and Kouchibouguac National Park (5 sites) in collaboration with Parks Canada.
The International St. Croix River Watershed Board, under the IJC, plays an important role in managing water levels, water quality, and fisheries between Maine and New Brunswick (Section 4.4). The Board works collaboratively with stakeholders within the watershed by preventing and resolving disputes. ECCC monitored water levels at seven stations in the watershed and real time (automated) water quality at two (2) stations and provided input to the Board’s annual report.
CABIN monitoring
In the Atlantic Provinces, 107 stream and river sites were monitored by ECCC and CABIN-certified partners in 2022, including other federal departments or Parks Canada, provincial governments (Newfoundland and Labrador; Prince Edward Island) and non-governmental organizations. This work supported federal-provincial water quality monitoring agreements with New Brunswick, Prince Edward Island, and Newfoundland and Labrador. The monitoring allowed partners to conduct assessments in transboundary watersheds and federal lands.
To help with the interpretation of CABIN data collected in the maritime provinces, ECCC produced a reference document entitled “Atlantic Benthic Normal Range Metrics (2002-2021), Metric Reference Values for use in CABIN Assessments”, shared with Atlantic CABIN participants. The Atlantic Reference Model is also available to assist participants with assessing CABIN data.
Prince Edward Island
In Prince Edward Island (PEI), 18 macroinvertebrates samples using CABIN protocol were collected. CABIN sampling was conducted by the Province of PEI in eight sites as part of a Federal-Provincial agreement between ECCC and the provincial government. Ten other sites were monitored in the Prince Edward Island National Park by Parks Canada.
Nova Scotia
In Nova Scotia, 36 macroinvertebrates samples using CABIN protocol were collected. CABIN sampling was conducted by ECCC in 11 sites. Parks Canada also collected five samples in Kejimkujik National Park and 13 samples in Cape Breton Highlands National Park. Six other samples were collected by a non-governmental organization (ACAP Cape Breton) and one under an academic study.
Newfoundland and Labrador
In Newfoundland and Labrador, 17 macroinvertebrates samples using CABIN protocol were collected. CABIN sampling was conducted by the Province Newfoundland and Labrador in seven sites as part of a Federal-Provincial agreement between ECCC and the provincial government. Ten other sites were monitored by Parks Canada in the Terra Nova National Park.
New Brunswick
In New Brunswick, 36 macroinvertebrates samples using CABIN protocol were collected. CABIN sampling was conducted by ECCC in 13 sites. Parks Canada also collected eight samples in Fundy National Park and eleven samples in Kouchibougouac National Park. Four other samples were also collected by two non-governmental organizations.
3 Water quantity and quality indicators
The Canadian Environmental Sustainability Indicators (CESI)Footnote 5 program provides data and information to track Canada's performance on key environmental sustainability issues including climate change and air quality, water (including water quality and quantity), biodiversity and pollution. The program updates many of its indicators annually, with others on an occasional basis based on data availability. Due to the time required to collect and analyze the data, and draft the indicators, the data used in the indicators are from timeframes before the indicator’s publication. Much of the data used to develop these water indicators derives from monitoring activities conducted pursuant to hydrometric agreements concluded under the Canada Water Act.
3.1 Water quantity in Canadian rivers indicator
The water quantity in Canadian rivers indicator is published every two (2) years. The last publication was in April 2022. It provides a summary of trends in water quantity in rivers across Canada from 2001 to 2019. The general trends illustrated in Figures 5a and 5b are as follows.
From 2001 to 2019:
Most Canadian rivers had normal water quantity.
Since 2010, there has been an increase in sites with a higher-than-normal water quantity.
The percentage of stations with a lower-than-normal water quantity has declined since 2001.
Figure 5a: Water quantity at monitoring stations, Canada, 2001 to 2019
Note: The water quantity classification for a station is based on a comparison of the most frequently observed flow condition in a given year with typical water quantity at that station between 1981 and 2010. Data from Alberta from 2015-2017, as well as recent data from northern Canada are missing for 2019 because of delays in getting data into the database. The results for this indicator vary slightly from those in the Trends in annual water quantity in Canadian rivers indicator and the Trends in the number of flood days in Canadian rivers indicator because of differences in the methods used to calculate the indicators. For more information, please see Data sources and methods (PDF).
Figure 5b shows water quantity monitoring stations on a map of Canada for 2019. Symbols indicate amounts of high, normal and low amounts of water yearly, seasonally under natural conditions, and under regulated conditions.
Water quantity in Canadian rivers is measured as water flow, or the volume of water moving over a point, over a fixed period of time. Water flows in rivers generally follow changes in temperature, rainfall, and snowfall throughout the year. These flows can result in flooding or water shortages. Overall, in 2019, the higher-than-normal water quantity was more frequent at monitoring stations in the interior of southern British Columbia, central Alberta and northern Saskatchewan and Manitoba. The lower-than-normal water quantity was seen more frequently at monitoring stations in south-western British Columbia and scattered stations in northern British Columbia and the southern Prairies.
3.2 Water quality in Canadian rivers indicator
The water quality indicator provides an overall measure of the ability of river water to support plants and animals. The indicator is calculated using the water quality index endorsed by the Canadian Council of Ministers of the Environment to summarize the status of surface freshwater quality in Canada. This indicator reflects the extent to which water quality guidelines for the protection of aquatic life are being met at selected river monitoring sites throughout Canada. Water quality at a monitoring station is considered excellent when substances in a river are very rarely measured above their guidelines. Conversely, water quality is rated poor when measurements are usually above their guidelines.
The water quality in Canadian rivers indicator released in February 2023 is based on data collected from 2002 to 2020 at 185 water monitoring stations across Canada,Footnote 6 and reflects the diversity of watersheds in the country. The data were assembled from 16 federal, provincial, territorial, and joint water quality monitoring programs. The National Water Quality Indicator was calculated using a core national network of 173 river sites, selected to be representative of surface freshwater quality across southern Canada where human pressure is most intense (Figure 6a).
For the 2018 to 2020 period, water quality in rivers in Canada was rated fair to excellent at 83% of the monitored sites. More specifically, water quality measured at these river sites across southern Canada was rated as excellent or good at 45% of monitoring sites, fair at 38% of sites, marginal at 14% of sites, and poor at 2% of sites (Figure 6a). Land development through agriculture, mining, forestry, high population density or a combination of these (mixed pressures) tends to have a negative impact on water quality (Figure 6b).
Figures 6a, 6b: Water quality in Canadian rivers, national and by land use category, 2018 to 2020 period
Source: Data assembled by Environment and Climate Change Canada from federal, provincial and joint water quality monitoring programs. Population, forestry, mining and land cover statistics for each site's drainage area were provided by Statistics Canada, Natural Resources Canada, Environment and Climate Change Canada, Agriculture and Agri-Food Canada, the Government of Alberta and the University of Maryland.
Note: Water quality was evaluated at 172 sites across southern Canada using the Canadian Council of Ministers of the Environment's water quality index. For more information on water quality categories, land use classification and monitoring sites selection, consult the Data sources and methods section.
Long description for Figures 6a and 6b
This table gives the specific numbers of sites nationally under each category by land use (for example, agriculture) and level of quality (from excellent to poor).
Figure 6a, 6b: Water quality in Canadian rivers, national and by land use category, 2018 to 2020 period
Land use category
Excellent (number of sites)
Excellent (percentage of sites)
Good (number of sites)
Good (percentage of sites)
Fair (number of sites)
Fair (percentage of sites)
Marginal (number of sites)
Marginal (percentage of sites)
Poor (number of sites)
Poor (percentage of sites)
Agriculture
2
1
14
8
13
7
2
1
0
0
Forestry
4
2
7
4
6
3
0
0
0
0
Mining
0
0
3
2
4
2
2
1
0
0
Populated
0
0
0
0
1
1
3
2
0
0
Mised pressures
5
3
22
13
39
22
17
10
4
2
Undeveloped
6
3
15
9
3
2
0
0
0
0
Total
17
10
61
35
66
38
24
14
4
2
Trends in water quality
Overall, water quality has not changed between 2002 and 2020 at over half of the sites (60%) across southern Canada. There was improvement in water quality at 10% and deterioration at 30% of the 142 sites. (Figure 7).
Figure 7: Trends in water quality, Canada, 2002 to 2020
Source: Data assembled by Environment and Climate Change Canada from federal, provincial and joint water quality monitoring programs.
Long description for Figure 7
Figure 7 shows a graphic of trends in water quality in Canada between 2002 and 2020.
Figure 8 Trends in water quality
Changes
Number of sites
Percentage
Improving
14
10
Deteriorating
43
30
No change
85
60
Total
142
100
4 Groundwater
In Canada, there is more water underground than on the surface. Groundwater continues to be a cornerstone of the Canadian economy and vital to the health and safety of Canadians, providing 30 percent of the population with potable water and up to 80 percent in rural Canada. Even in the surface-water-rich area of the Laurentian Great Lakes Basin over 1.2 million Canadians rely on groundwater. Today, about 10 million Canadians depend daily on groundwater as their source of freshwater.
As 40-60 percent of stream flow is from groundwater contributions, groundwater is also important in agriculture, natural resource extraction, and ecosystem services. However, only a small fraction of groundwater is available for sustainable pumping without depleting the resource. Changes in precipitation amount, seasonality, state (rain, snow), and temperature regime, will likely change the timing of groundwater recharge, and may affect the overall recharge rate and hence groundwater availability. Groundwater study is critical, not only to determine the effects of climate change, but to understand and respond to all other contributing factors to groundwater quality and quantity.
Federal government activity in groundwater is led by Natural Resources Canada (NRCan) and ECCC, with NRCan’s Groundwater Geoscience Program (GGP) playing a key role because of the connection between groundwater and geology.
Groundwater research, monitoring and modeling benefits from data gathered through monitoring activities conducted pursuant to hydrometric agreements concluded under the Canada Water Act.
4.1 NRCan Groundwater Geoscience Program
Historical context (2002-2022)
In response to recommendations of the 2005 Senate reportFootnote 7, the GGP focused on the following topics:
Key Canadian Aquifer Inventory: No complete inventory of groundwater resources in Canada exists. The vastness of the country, and the inherent difficulty and cost of assessing groundwater quantity limit our collective capacity to have a comprehensive understanding. NRCan and provincial and territorial collaborators prioritized 30 key aquifers for detailed characterization to begin to build a national inventory. The nature of the characterization varies from aquifer to aquifer, and the methods vary from field work to modelling, but significant results were obtained for 23 aquifers and results are available online at the Groundwater Information Network.
Groundwater Information Network (GIN): Data access difficulties are consistently reported as a barrier to effective sustainable groundwater management. Critical factors are the interconnected nature of water, which crosses jurisdictional boundaries, as well as the distribution of related data amongst multiple agencies operating under different mandates and jurisdictions. In response, GIN is a data network for Canadian groundwater data. Data providers across Canada, including all pertinent provinces, territories, and NRCan, make their data available online. The data are available from each source, and from a single access point (including a web portal) using international standards, from where the collective data can be viewed, queried, and downloaded. GIN develops and maintains the central access point and disseminates GGP results. Thirteen distinct layers of data are available, with a focus on water wells, water level monitoring, and key aquifers. The standards-based approach also allows seamless integration with the US National Groundwater Monitoring Network and the Internet of Water, and the Global Groundwater Monitoring Network. GIN participants also have leadership roles in the development and deployment of the underlying international standards, primarily GroundWaterML2 and WaterML2.
The Gravity Recovery and Climate Experiment (GRACE): a unique satellite pair providing a monthly measurement of the earth’s gravity field, with a component for the changing mass and distribution of water. GRACE measures changes in groundwater storage on a seasonal, multi-annual and decadal scale. It provides knowledge on groundwater fluxes that were previously unavailable, and analysis is being integrated with Canada1Water to provide increased resolution.
Figure 8: The long-term trend in total water storage (right) and mean seasonal change in water storage (left) from two decades of GRACE and GRACE Follow-On satellite gravity data (2002-2022)
Long description for Figure 8
The Canadian Geodetic Survey of Natural Resources Canada calculates monthly estimates of water storage change with global coverage using the GRACE satellite mission data. This graphic provides two images of Canada that show long-term trends in total water storage (right) and mean seasonal changes in water storage (left), calculated using data between 2002 to 2022. For the long-term trend the scale ranges from negative 4 to plus 4 cm of equivalent water thickness (EWT) per year. For the change in seasonal water storage the scale ranges from zero to plus 20 cm EWT. The image for Canada shows strong regional trends from both north to south and east to west using a red (minimal or negative) to blue (positive or greatest) colour scale.
Methods Development: A core objective, in concert with provincial and territorial collaborators, has been technical innovations focused on Earth Observation, field-based approaches, and modelling. Collaboration with Surveyor General Branch (SGB) of NRCan and Canadian Centre for Mapping and Earth Observation (CCMEO) on analysis of GRACE has led to improved closures of Canadian water budgets, due to the explicit integration of groundwater. Field-based geophysical methods, including airborne electromagnetic, ground based seismic reflection, and borehole geophysics, have enhanced characterization of aquifer geometry and properties. Modelling approaches, including numerical, tomographic, geostatistical, and machine learning, have also improved characterization of aquifer properties and groundwater flow.
National Synthesis: Groundwater experts across Canada completed an authoritative reference in 2014 entitled “Canada’s Groundwater Resources”, which is an update to the previous national synthesis (1967). Contributions range from government, to academia, to industry, and cover thematic, research, and geographical aspects. Highlighted are the significant advances made in understanding Canadian groundwater systems. The need for further research, data, and policy, as well as institutional cooperation and thematic integration to ensure the future safety and availability of the resource, is also emphasized.
Recent results (2022-2023)
Key Canadian Aquifer Inventory: In 2022-2023 activities continued in: (1) the continued characterization of certain key aquifers and environmentally sensitive areas, such as the Oak Ridges Moraine (ON) and Fox Creek (AB); (2) various regional and significant models were developed for most of southern Ontario, targeting groundwater flow and aspects of the geology; and (3) thematic work was carried out on the nature of Ottawa area glaciomarine muds with limited water content and flow. Additional thematic work has advanced understanding of factors controlling water resources in the Yamaska River watershed (Quebec).
Figures 9a, 9b and 9c: Illustrative example of hydrogeological terrains in southern Ontario showing features of a case study watershed
Figure 9a) terrain setting
a) Terrain setting (geology)
Long description for Figure 9a
The figures illustrate how seven representative hydrogeological landscapes in southern Ontario partition water, on and below the land surface, according to their distinct terrain characteristics. Three components of the figure describe the flux of water within a representative watershed of a hydrogeological terrain.
Figure 9a shows a selected watershed that typifies one of the seven hydrogeological terrains. It presents the geology, a climate station, a stream gauge to measure flow through the watershed, and a well to measure groundwater levels. Each of the seven typical watersheds are small (~50-100 km 2) to improve comparisons of the relationships between precipitation, stream flow, and groundwater levels.
Figure 9b) Hydrology with 3-D Hydrology model
b) block diagram of hydrostratigraphy
Long description for Figure 9b
An artistic sketch providing a conceptual 3D perspective of the watershed geology, showing soil/ sediment overlying bedrock. This hydrogeology model displays uplands, valleys, sediment and rock types, a drilled well with subsurface geology, in addition to proportional arrows of water movement within and below the watershed. The example is predominately till uplands, underlain by sand, overlying limestone bedrock.
Figure 9c) Hydrology
c) hydrology: (i) precipitation and temperature; (ii) streamflow (as gauged at the outflow point of the watershed outline); (iii) groundwater level (relative to an annual average). Details are available in Sharpe (2022).
Long description for Figure 9c
Three graphs illustrating linked elements of water movement (hydrology): (i) precipitation and temperature; (ii) streamflow as gauged at the outflow point of the watershed; (iii) groundwater level (relative to an annual reference level). The graphs portray water fluxes on a daily scale for a 12-month cycle. Each of the seven representative hydrogeological terrains has a different flow response related to its geology and topographic characteristics.
Groundwater Information Network: Significant achievements include: (1) major additions of content to most data layers; (2) expansion of the data network with the addition of new data providers (e.g. NL); (3) expansion of the reach of the data network with integration into the Federal Geospatial Platform, and the Open Science Data Platform; (4) steady and modest online usage; and (5) initiation of an upgrade to the web portal, expected to be prototyped by April 2024, and released publicly as soon as possible thereafter.
National Water Modelling – CanadaOneWater (C1W): A shortcoming identified in the 2022 Canadian Climate Change report, which concluded there was a lack of information to assess past and future changes to groundwater resources in Canada is being addressed. In response, and due to the integrated nature of the water cycle, C1W has developed a water model for continental Canada and Baffin Island. The model is climatically driven, physically based, and fully coupled across the groundwater and surface water regimes. The goal is to forecast climate-based scenarios for the state of water (groundwater and surface water) across Canada in fixed time increments:
2022-2023 is the second year of C1W’s three-year pilot phase. Partners include Natural Resources Canada (NRCan), Agriculture and Agri-Food Canada (AAFC), Aquanty Inc., and the universities of Waterloo and Toronto. Core funding is from the Canadian Safety and Security Program of Defence Research Development Canada.
Canada is modelled based on seven water basins and includes transboundary watersheds with the USA.
Historical runs are for 1979-2020, future scenarios will be run for mid- and end-century.
Model results are being tested and verified with ECCC hydrometric network data and provincial groundwater monitoring sites.
The data will be available under an open government data license in the latter part of 2023-2024.
Figure 10: Seven large water basin domains for continental Canada, Baffin Island and transboundary watersheds with US.
Long description for Figure 10
The image shows a map of Canada divided into six large watershed domains that individually cover from 1.5 M to 2.3 M km2; and provide focus on the Pacific, Mackenzie, Arctic, Nelson River, Hudson, and Great Lakes-Atlantic regions. It also shows a seventh model domain for Baffin Island which is a relatively unique climatic and physiographic region and has a spatial extent of 800,000 km2.
Methods development:
Earth Observation - advances were made in GRACE processing to better separate groundwater flux from the total water flux, due to improved estimates of change to surface water bodies made by Canadian Centre for Mapping and Earth Observation. GRACE analysis will continue to be refined over the course of C1W.
Field-based - several field test sites are maintained, including: (1) at Bells Corners, Ottawa, for national downhole geophysical calibration; (2) near Embrun, ON, to study glacial esker aquifers; and (3) at Valcartier, near Quebec City, for littoral sediment aquifers. These sites support a range of hydrogeophysical and machine-learning analysis to understand aquifer storage. Ongoing international collaboration (HYDROSCAN) with the University of Rouen (France) focusses on innovative aquifer characterization methods.
Modelling - studies are ongoing in the application of machine-learning techniques to the integration of water and geophysical data, and to the modeling of aquifers. A notable collaboration with AAFC, as well as Aquanty Inc. is advancing water resource modelling in an agricultural-dominated watershed. Progress to predict key hydrogeological characteristics using this method is underway via a PhD project with the Institut National de la Recherche Scientifique (INRS).
Communication: national, regional, and provincial forums continued in collaboration with provincial and territorial agencies, with an aim to exchange information, discuss issues, and plan joint activities:
National Dialog on Groundwater: GGP has coordinated this national quarterly online meeting of provincial and federal groundwater experts for the past four years.
Prairie Province Water Board: GGP co-developed a workshop on groundwater issues in the Prairie Provinces and more generally in western Canada with associated delegates.
Groundwater Geoscience in Southern Ontario Open House is an annual meeting of with 600 registrants over 1.5 days in 2022. It is held by the Ontario Geological Survey, and supported by GGP and Conservation Ontario
GGP renewal workshops: GGP conducted external and internal workshops to consult with stakeholders on the future direction of the program.
5 Inter-jurisdictional water boards
Inter-jurisdictional water boards have been established to focus on specific water issues that have implications for more than one province or territory. Domestic inter-jurisdictional boards include the Mackenzie River Basin Board (MRBB), the Prairie Provinces Water Board (PPWB), the Lake of the Woods Control Board (LWCB) and the Ottawa River Regulation Planning Board (ORRPB). The 2022-2023 activities of each are described in this section. Apart from the LWCB, each of these boards was created under the authority of the Canada Water Act.
A number of federal/provincial/territorial drainage basin boards were also created to manage designated water issues. Examples include the Mackenzie River Basin Board for one of our major northern watersheds and the Prairie Provinces Water Board for the prairies. Canada’s progress is expanding in more integrated approaches to water management. Recently, several provinces have produced comprehensive provincial water policies, e.g., Alberta, Saskatchewan, Ontario, and Quebec. These policies focus on integrated water resources management on a drainage basin basis. Other complementary activities include Ontario’s source water planning and the IJC’s pilot watershed boards on the Red and St. Croix Rivers.
There are also many international transboundary and inter-jurisdictional water boards in which Canada participates, most of which are led by the IJC. While the work of the IJC is not pursuant to the Canada Water Act, ECCC reports on progress under the Environment and Climate Change Canada-International Joint Commission Memorandum of Understanding. An overview of ECCC support to IJC water boards is provided in this section. Of note, in 2022 ECCC supported the IJC in the finalization of the Lake Champlain-Richelieu River Study and the public dissemination and archiving of data and products from the study.
Signatory governments: Canada, Alberta, Saskatchewan and Manitoba
Board: Prairie Provinces Water Board (PPWB)
The purpose of the MAA is to apportion water between the provinces of Alberta, Saskatchewan, and Manitoba, and to protect surface water quality and transboundary aquifers. It also provides for cooperation among governments with respect to transboundary water management and for the establishment of the PPWB and its responsibility to administer the Agreement.
The overarching deliverable for the PPWB is to report on the achievement of the terms of the MAA. The MAA provides for an equitable sharing of available waters for all eastward flowing streams, including lakes that cross provincial boundaries. The Schedules to the Agreement describe the role of the PPWB and stipulate the amount and quality of water that shall pass from Alberta to Saskatchewan and from Saskatchewan to Manitoba.
In support of the MAA, ECCC monitors stream flows, water quality and meteorological conditions on eastward flowing streams on the provincial borders (see Figure 11). The PPWB computes apportionable flows based on the natural flow of a river, as if that river had never been affected by human activity. Excursions (i.e., deviations) to the MAA water quality objectives are calculated annually.
Figure 11: PPWB water quantity and quality monitoring stations and basins
Long description for Figure 11
Figure 11 is a map of Alberta, Saskatchewan and Manitoba that shows the Prairie Provinces Water Board water quantity and quality monitoring stations and basins. PPWB water quantity and/or quality monitoring is performed in the following areas: 1. Cold River; 2. Beaver River; 3. North Saskatchewan River; 4. Battle River; 5. Red Deer River A/S; 6. South Saskatchewan River; 7. Battle Creek; 8. Middle Creek; 9. Lodge Creek; 10. Churchill River; 11. Saskatchewan Rvier; 12. Carrot River; 13. Red Deer River S/M; 14. Assiniboine River; 15. Qu'Appelle River; 16. Pipestone Creek.
Activities and accomplishments of the PPWB and its four standing technical committees on hydrology, water quality, groundwater, and flow forecasting in 2022-2023 include the following:
ECCC water quality monitoring that had previously been paused due to COVID-19, resumed. Discussions were held on the resilience of water quality monitoring.
A new Schedule to the MAA – Schedule F on groundwater – was advanced to final review.
Work advanced on the formal basin review for the Qu’Appelle River Basin at the Saskatchewan-Manitoba boundary. Calculations for this basin are now done monthly. This review is looking at all aspects of the apportionable flow calculations and options for improvements.
The formal basin review for the South Saskatchewan River Basin at the Alberta-Saskatchewan boundary was put on hold. Previous scoping work had identified five phases for this basin review. Phase one is almost complete.
A lake evaporation study to help understand the high importance of evaporation in calculating the apportionable water flows was concluded.
The 2021 excursion report was recommended to the Board and approved. This was the first year for reporting against the new water quality objectives (2021).
A mercury monitoring pilot proceeded after a year of delays due to the pandemic.
Planning continued for the 2025 water quality objectives review (a review and update of the water quality objectives is completed approximately every five years).
Work continued on developing a method to classify transboundary aquifers according to the Risk Informed Management (RIM)Footnote 8 approach. Planning continued on foundational data collection and harmonization of data across borders, as first steps for the analysis of groundwater wells within 30 kilometers of transboundary borders.
Planning continued for a virtual workshop on groundwater with partners agencies.
Validation of the MESH (Modélisation Environmentale Communautaire - Surface and Hydrology) hydrological land surface forecasting model for the South Saskatchewan River Basin continued.
For 2022-2023, all PPWB meetings of the Board and its four standing committees were held mostly virtually due to COVID-19 restrictions, but later in the year some meetings returned to in-person as restrictions eased and then lifted.
International Agreement: Canada-US treaty (Convention and Protocol for Regulating the Level of the Lake of the Woods, 1925)
International Board: International Lake of the Woods Control Board (ILWCB)
The Lake of the Woods Control Board (LWCB) does not fall under the Canada Water Act since it pre-dates the Act, but it is included in this report to provide a more complete picture of federal-provincial water management in Canada. The LWCB is responsible for the regulation of the water levels of Lake of the Woods and Lac Seul, as well as the flows in the Winnipeg and English Rivers downstream of these lakes to their junction (the Winnipeg River drainage basin). To assist in determining these levels and flows, the Board maintains a full-time Secretariat (the Lake of the Woods Secretariat that includes four engineers) that monitors conditions in the basin, provides information and analysis, and recommends regulating strategy and/or specific outflows. The Secretariat is responsible for implementing the regulation strategy and maintaining communications with basin users, including the public.
The water level of the Lake of the Woods is normally regulated solely by the LWCB. However, its decisions are subject to the approval of the International Lake of the Woods Control Board (ILWCB), co-chaired by Canadian and US representatives, whenever the level of the lake rises above or falls below certain (extreme) levels specified in the Lake of the Woods Convention and Protocol. In 2022, when the level of the Lake of the Woods rose above the defined threshold, the ILWCB was activated, and approved the decisions of the LWCB. Information about the ILWCB can be found on the IJC website.
The LWCB met on multiple occasions in 2022-2023, after not having met in person since March 2020 due to the COVID-19 pandemic. Regulation meetings to establish the seasonal operating strategy were held in person (with virtual attendees as well) in June 2022, October 2022, and March 2023 with invitations to First Nations specific interest groups and resource agencies. Typical annual outreach activities, such as visits to areas of the basin and public open houses were extended in both number and locations, given the extreme high-water event that occurred in 2022, and the need for additional public communication and information. In total, four public open houses were held in the basin in 2022.
2022 High Water Event
The Winnipeg River basin experienced a period of extreme high water in the spring and summer of 2022. Streamflows, lake inflows and water levels across the basin broke many records or were the highest in many years. The flooding event lasted for months on the major lakes and along the English and Winnipeg Rivers, resulting in wide-ranging impacts to residents, communities, businesses and to the environment. Exacerbating the situation and conditions being felt by the community was the fact that spring and summer 2021 had been one of the longest persisting and most severe droughts in the last century. Throughout the event, the LWCB held emergency meetings multiple times a week and regularly provided emergency management agencies with information for flood messaging and to make decisions on emergency orders. The Secretariat increased data availability and information by publishing basin data seven days per week and posting high water conditions and lake level forecasts three times per week.
5.3 Ottawa River Regulation Planning Board
Agreement: Agreement Respecting Ottawa River Basin Regulation (1983)
The Planning Board was constituted to ensure the integrated management of the flows from the 13 principal reservoirs of the Ottawa River basin to minimize the impacts of floods and droughts along the Ottawa River and in the Montreal region, while maintaining beneficial water uses within the watershed. Under the 1983 Agreement, the governments also established two other entities that report to the Planning Board: the Ottawa River Regulating Committee and the Ottawa River Regulation Secretariat (the Secretariat). The Committee is made up of representatives from the major dam operators in the Ottawa River basin. The Secretariat, which is housed by ECCC, supports the integrated or cooperative management of the principal reservoirs that is done throughout the year.
The 2022 spring melt began in March with snowmelt progressing gradually from south to north. The South Nation and Rideau rivers, the southernmost tributaries of the Ottawa River, peaked in late March. The snow water content (the amount of water held in the snow cover) at the end of March was near average in the central and northwest portions of the basin, and above average in the headwater areas of the Ottawa, Gatineau, and Lièvre rivers. Water levels started rising on the Ottawa River during the second week of April because of increased snowmelt and runoff from precipitation. Over the next three weeks, two rainfall events combined with snowmelt, led to two distinct peaks along the main stem of the Ottawa River. The highest of the two was observed at Carillon on April 30 and was characterized as average.
The snowpack on the northern portion of the basin remained above normal in early May. Above normal precipitation amounts in the last two weeks of May and early June, combined with the melting of the significant snowpack, led to several of the northern reservoirs observing some of the highest flow volumes ever recorded. This above normal spring runoff led the Gatineau River to overflow its bank during the third week of May.
To help reduce the flooding situation on the Gatineau River, the Committee and the Planning Board approved the diversion of 160 cubic metres per second at the Barrière dam on May 20th. This dam is located at the watershed divide between the Gatineau River basin and the upper Ottawa River basin. Flooding was avoided along the main stem of the river due to the gentler freshet in the southern portion of the basin.
Like other years, dam operators undertook flood reduction measures in preparation for the spring runoff. Typically, this involves emptying the principal reservoirs during the winter period with reservoirs being at their lowest levels before the spring snowmelt begins. This available storage volume is then used to reduce downstream flows as the spring melt progresses.
Throughout the 2022 spring freshet, the Committee met regularly using an online meeting tool to perform cooperative management of the system. The observed and forecast hydrological conditions were analyzed, and a regulation strategy to use the available reservoir storage volume to reduce flood risk was developed.
Apart from ensuring the cooperative management of the system, the Planning Board also ensures that the hydrological forecasts are made available to government agencies involved in issuing flood-related messages and the deployment of emergency measures. As such, the Committee worked closely with provincial agencies and the Secretariat participated in conference calls with responsible authorities.
Flows of the Ottawa River can have a considerable effect on the flows of the St. Lawrence River in the vicinity of the Montreal Archipelago. This is why the provision of hydrological forecasts on the Ottawa River is important to the Great Lakes - St. Lawrence Regulation Office, which is responsible for carrying out the day-to-day regulation activities for the International Lake Ontario - St. Lawrence River Board.
The Planning Board uses its website as the main tool for issuing hydrological forecasts to the public. Again, this year, it regularly published basin maps of the amount of water held in the snow cover compared to normal. In addition, the Committee published three bulletins to keep the public informed about basin conditions. The Committee issued a news release on April 8 to announce the start of the freshet. News releases and bulletins are still available on the Planning Board website (see Information and Documentation, Archives).
5.4 ECCC support of international water boards
Agreement: Environment and Climate Change Canada-International Joint Commission Memorandum of Understanding (consistent with the Government of Canada’s commitments under the Department of Environment Act and the Boundary Waters Treaty)
Signatory Agencies: ECCC and the IJC
Boards: All transboundary Boards and Committees under the jurisdiction of the IJC
Figure 12: Areas covered by International Joint Commission (IJC) Boards and Committees
Long description for Figure 12
Figure 12 shows a map showing areas covered by International Joint Commissions Boards and Committees.
International Osoyoos Lake Board of Control
International Columbia River Board of Control
International Kootenay Board of Control
Accredited Officers of the St. Mary-Milk River and Study Board
International Souris River Board and Study Board
International Red River Board and Study Board
International Rainy-Lake of the Woods Watershed Board and Water Level Committee
International Lake Superior Board of Control
Great Lakes – St. Lawrence Adaptive Management Committee, plus the Great Lakes Water Quality and Science Advisory Boards (GLWQA)
International Niagara Board of Control
International Lake Ontario – St. Lawrence River Board
International Lake Champlain-Richelieu River Study Board
International St. Croix River Watershed Board
ECCC contributes to the management of international transboundary water by carrying out the orders of the IJC under the Boundary Waters Treaty as per the Department of Environment Act. In 2022-2023, ECCC continued to provide engineering and technical support to the many IJC water boards and committees across the international border.Footnote 9 In accordance with the ECCC-IJC MOU, ECCC also provides scientific expertise to support the IJC’s Great Lakes Water Quality Board and the Great Lakes Science Advisory Board as per responsibilities under the 2012 Great Lakes Water Quality Agreement.
In 2022-2023, ECCC continued contributions to the work planning and initiation of an IJC Reference Study for the International St. Mary and Milk Rivers, launched in November 2021, to explore options to improve access to apportioned waters by each country, in recognition of climate change and challenges to apportionment since the original 1921 Order was issued. Through multiple modeling endeavors and meaningful engagement with Indigenous Nations and the public, these collective efforts are expected to yield long-term benefits, to optimize the efficient utilization of available water resources for the well-being of all who depend on the shared waters of the St. Mary and Milk Rivers.
ECCC provides support to the Great Lakes-St. Lawrence River Adaptive Management (GLAM) Committee which supports the Great Lakes Boards by providing the on-going review and evaluation of the regulation plans for the outflows from Lake Superior and Lake Ontario. ECCC staff provide on-going support to the International Lake Superior Board of Control and to the International Lake Ontario-St. Lawrence River Board through water management activities such as: monitoring water levels and flows; performing weekly or monthly regulation computations; providing monthly assessments of hydrological conditions, forecasts and weekly or monthly briefings; supporting ice management; and conducting public information and communication.
As a result of extremely high water in 2017 and 2019, which caused damage and disruption throughout the Lake Ontario-St. Lawrence River system, the IJC requested a special study for an expedited review of Plan 2014. Plan 2014 is a regulation plan that defines the management of water outflow for Lake Ontario, influencing water levels on the lake and portions of the St. Lawrence River. The expedited review of Plan 2014 is being performed by the GLAM Committee. ECCC significantly contributed to the completion of Phase 1 of the expedited review in November 2021 with products available on the IJC website. In 2022, ECCC actively supported Phase 2 of the expedited review. Efforts included:
working towards developing a range of plausible water supply sequences required to test the robustness of various regulation plan options;
working with optimization models to develop alternative candidate regulation plans to be evaluated;
developing and assessing various performance indicators across various sectors, such as coastal interests, recreational boating and tourism, commercial navigation, hydropower, municipal and industrial water uses and a range of ecosystem indicators for evaluating plan performance;
developing a sophisticated geospatial “Integrated Socio-Economic and Ecosystem” (ISEE) model for assessing the impacts of various water levels and flows; and
working to engage the public and to engage Indigenous communities to integrate Indigenous perspectives in the review of the regulation plans.
The International Rainy Lake of the Woods Watershed Board (IRLWWB), through the Water Levels Committee (WLC), monitors compliance with the Rule Curves for Namakan and Rainy lakes. ECCC supports the Board in monitoring water levels and flows and compliance with the rule curve and with water quality parameters in the Rainy River against 1965 criteria. In the spring and summer of 2022, major flooding was experienced in the Rainy-Lake of the Woods watershed. Rainy Lake reached record breaking water levels and Namakan Lake ranked as the third highest water level on record. The IRLWWB released a draft of its 2022 Post Flood Report in March 2023 for public comment. The draft report serves as a review of the conditions that led to the high-water event in 2022, a summary of WLC actions, and provides answers to questions raised by the public, including analysis on what would have happened if the High Flood Risk Rule Curve had been employed starting March 10, 2022.
The International Red River Watershed Board monitors water quantity and quality in the watershed. ECCC provides the Canadian Co-Chair and Co-Secretary, and representation on the Board and on two technical Committees. ECCC also supports the Board through monitoring of water quality at the international boundary. The Board has six International Watershed Initiative projects in-progress. A very notable milestone this year was approval by governments of one component of a nutrient management study which resulted in four nitrogen and phosphorous objectives. These new objectives will be added to the existing five water quality objectives for the Red River at the International Boundary. ECCC provided support throughout this eleven-year study.
The Master Agreement states that the waters of the Mackenzie River Basin should be managed to preserve the ecological integrity of the aquatic ecosystem and to facilitate reasonable, equitable, and sustainable use of this resource for present and future generations. It contains provisions for seven bilateral agreements between adjacent jurisdictions in the basin. As of March 31, 2023, bilateral agreements had been completed between:
British Columbia and Northwest Territories
Alberta and Northwest Territories
Northwest Territories and Yukon
British Columbia and Yukon
In August of 2022, the governments of Yukon and the Northwest Territories signed an updated version of the 2002 Bilateral Water Management Agreement for the Peel and Mackenzie Delta sub-basin and signed a new Bilateral Water Management Agreement for the Liard sub-basin. MRBB members and Secretariat appreciate the time and effort that went into both Agreements.
The MRBB represents all parties to the Master Agreement and administers the provisions of the Master Agreement. The MRBB has 13 members. Three members, one each from Crown-Indigenous Relations and Northern Affairs Canada, ECCC, and Parks Canada represent the Government of Canada. Each of the five provincial and territorial jurisdictions in the basin appoint one Indigenous member and one government member.
The MRBB currently has two active committees and one task team that support work on duties and priorities: the State of the Aquatic Ecosystem and the Traditional Knowledge and Strengthening Partnerships Steering Committees, and the Water Quality Task Team.
Notable activities and accomplishments of the MRBB and the committees and task team that supported MRBB work in 2022-2023 include the following:
2022 marked the 25th anniversary of the signing of the Mackenzie River Basin Transboundary Waters Master Agreement. In October, MRBB members met in Yellowknife and spent time with staff from the Prince of Wales Northen Heritage Centre to learn about Indigenous place names, the effects of changing climate and moose skin boats. Members also dedicated time to reflecting on the successes of the MRBB.
Guided by priorities outlined in the interim Strategic Plan, MRBB members dedicated time to learning about actions that support Reconciliation. There were a number of presentations from MRBB members outlining ongoing work (“Towards Reconciliation: 10 calls to action for natural scientists working in Canada”), and a presentation by the developer of the Land and Peoples Relationship Model.
A summary of ECCC monitoring operations in the Mackenzie River Basin from provincial and territorial jurisdictions follows:
Saskatchewan (9 stations)
Normal flows were experienced in the basin.
A remote-controlled boat (QPod) was used to collect discharge over the past year.
Alberta (176 stations)
Northwestern Alberta between Grande Prairie and High Level experienced significant flooding in the spring of 2022. Parts of the Peace River area were also affected near Manning.
Multiple flood warnings were issued and some areas around High Level were evacuated. Local states of emergency were declared in the Paddle Prairie Métis Nation settlement, Chateh and Little Red River Cree areas due to localized flooding.
The Peace Athabasca Delta region, Fort McMurray and local surrounding areas experienced a relatively mild ice breakup with no significant events. Water levels were average, and minimal damage was incurred to infrastructure during breakup.
A few large precipitation events occurred throughout the year; however, overall it was a relatively dry year in the region. This resulted in a consistent and steady decline to lower than anticipated water levels to the end of the open water season. As a result, additional measurements at Athabasca River below Fort McMurray (07DA001) were taken during ice conditions at the end of the season. This was based on substantially lower water levels when compared to previous years by season’s end. The threshold number of 150 m3/s was assigned, and bi-weekly measurements were conducted to ensure forecast modelling was accurate.
In the Birch River basin, Birch River below Alice Creek (07KE001) was affected by significant meltwater contributions to the basin. Water levels broke out from the steep banks and spilled onto the surrounding floodplain, resulting in levels not seen in the more than 30 years that ECCC has been operating the site.
At the beginning of 2023, staff installed a Nupoint satellite camera at Clearwater River above Christina River (07CD005). These cameras provide a daily photo of the area, which not only assist with data computations but also provide an illustration of site conditions daily. This camera captured ice breakup in 2023.
British Columbia (46 stations)
Five (5) stations received water level sensor upgrades as part of NHS’s station modernization agreement with BC Ministry of Environment and Climate Change Strategy.
Cableway infrastructures at three (3) stations were refurbished and returned to operational service.
The 2022 freshet flows were later than typical for some stations and the magnitude tended to be at or above median flow. After the freeze-up period (Oct/Nov 2022), most stations in the basin recorded flow rates below median flow.
Northwest Territories and Yukon (108 stations)
The 2022 breakup period in the Mackenzie River basin resulted in significant flooding within the communities of Hay River and adjacent K’atl’odeeche First Nation. Peak water levels exceeded those on record by over two metres and were the result of river ice processes and associated snowmelt. The community was evacuated with significant damage occurring to homes and infrastructure.
Other communities along the Mackenzie River experienced high water events during river ice breakup and were under evacuation notices at various points during the breakup period.
Persistent high water levels on Great Slave Lake returned to seasonal normal in late summer, early fall, of 2022. The return to seasonal conditions in the fall helped reduce transportation and navigation issues along the Mackenzie River, a major supply route for northern communities.
ECCC staff responded to critical events to support the Government of Northwest Territories emergency services and flood forecasting efforts. They deployed remote-controlled boats to collect discrete observations of discharge to ensure staff safety in challenging river conditions. They were also successful in the installation of two additional NuPoint satellite cameras to supplement or replace water level data in the event of gauge failure (e.g., Hay River gauge was inundated).
Figure 13: NHS hydrometric monitoring stations within the Mackenzie River Basin
Long description for Figure 13
Figure 13 is a map showing the locations of active NHS hydrometric stations within the Mackenzie River Basin.
6 Ecosystem-based approaches to water quality management
This section describes several key cooperation-based ecosystem approaches through which ECCC works to ensure that Canadians have access to clean, safe, and healthy water, and that the country’s water resources are used wisely, both economically and ecologically. While not all these initiatives are formalized under the Canada Water Act, they do contribute to the objectives of the Act through improving the management of water resources in Canada.
ECCC’s Ecosystem Initiatives are cooperative, place-based programs designed to deliver environmental results in targeted ecosystems. The objective of the Ecosystem Initiatives is to enhance or maintain ecosystem sustainability by addressing a range of local or regional environmental challenges through partnership-based work. Local activities are coordinated by ECCC and undertaken in collaboration with a range of local partners and stakeholders that may include other federal departments, provinces and territories, regional, municipal, and local governments, Indigenous peoples, federal and state governments in the United States, businesses, non‑governmental and community organizations, and colleges and universities.
6.1 Lake Winnipeg Basin Program
The Lake Winnipeg Basin Program (LWBP) (2017-2023) is the Government of Canada’s response to addressing water quality issues in Lake Winnipeg. The LWBP aims to engage citizens, scientists, and domestic and international partners in actions to restore the ecological health of Lake Winnipeg, reduce nutrient pollution and improve water quality. It achieves this through the following three program priorities: collaborative governance, Indigenous engagement, and nutrient reduction.Footnote 10
Some key program highlights from 2022-2023 include the following:
Twenty-five new contribution agreements were signed to provide almost $1.6M in financial support for stakeholder-led nutrient-reducing actions, advancements in science, information sharing, Indigenous engagement, and collaboration. All projects were completed by
March 31, 2023.
ECCC, in collaboration with Manitoba, initiated dialogue with Indigenous partners to explore opportunities to enhance Indigenous participation in freshwater decision making through the Canada Manitoba Memorandum of Understanding Respecting Lake Winnipeg and Lake Winnipeg Basin.
Under the LWBP Science Plan, research is aimed at improving knowledge of nutrient export to streams and understanding impacts of climate variability and invasive species on the lake. The science plan has four priority areas including reporting, monitoring to track changes, researching nutrient sources and lake ecosystem components. Ongoing scientific projects continuing in 2022-2023 include:
Monitoring water quality in the Lake Winnipeg basin includes measuring nutrient concentrations (and other parameters) in rivers crossing boundaries between Canada and the United States, in rivers that cross provincial boundaries within the basin, and three eastern tributaries to Lake Winnipeg. Monitoring data are made available through the Government of Canada Open Data Portal.
Three seasonal surveys monitoring Lake Winnipeg’s nearshore areas were carried out in 2022. Each survey included water quality and aquatic biota monitoring (phytoplankton, zooplankton, benthic macroinvertebrates) at 20 sites within the littoral zone and coastal wetlands. Nearshore aquatic monitoring data had been identified as a gap in knowledge after the previous phase of the Lake Winnipeg Basin Program. Monitoring data is made available through the Government of Canada Open Data Portal.
Edge-of-field research continued in 2022, in collaboration with Agriculture and Agri-Food Canada, focusing on understanding the contribution of nutrients to surface waters. This included assessing the stability and resilience of legacy phosphorus stored in sediments within edge-of-field constructed wetlands in collaboration with Agriculture and Agri-Food Canada and the Swan Lake First Nation.
Assessing changes in water availability with future climate scenarios. Modelling studies of the Red and Assiniboine watershed for improved understanding and prediction of nutrient loading under climate change and beneficial management practices scenarios continued. Research also continued, using modelling to improve understanding of total phosphorus in the Red-Assiniboine sub-watersheds. Uncertainty estimates are in progress. In addition, climate change impacts on timing of snow fall, accumulation, and melt in the Assiniboine-Red sub-basin of the Lake Winnipeg basin were evaluated.
A lake ecosystem model, developed under previous phases of the program, was further developed and coupled with a watershed-based model in the Assiniboine and Red River Basins for simulating biological and biogeochemical processes (such as dissolved oxygen, algae, invasive mussels). This work assists in gaining a better understanding of zebra mussel distribution, density, biomass and population characteristics and their corresponding impacts on water quality.
Satellite image products and derived algal bloom indices for Lake Winnipeg continued to be produced operationally by ECCC on a daily basis, distributed in near-real-time through the EOLakeWatch web portal, and compiled into Annual Algal Bloom (PDF) reports for the lake, and published to the Government of Canada Open Data Portal.
The LWBP also supports the Lake Winnipeg Research Consortium, which operates and maintains an in-lake science platform on Lake Winnipeg, and the Canadian Watershed Information (CanWIN), a web-based open access data and information network, hosted by the University of Manitoba.
Efforts to reduce phosphorus amounts reaching Lake Winnipeg
Over the past six years, the LWBP contributed over $10 million to support targeted stakeholder-driven projects that demonstrate an effective means of reducing phosphorus loading, while also increasing public knowledge and engagement on water quality issues within the basin. This includes activities such as:
building retention ponds that intercept water flow across the landscape and capture nutrients
stabilizing riverbanks and lake shorelines
restoring wetlands
using natural infrastructure and innovative technologies to reduce nutrient loading
Projects funded by ECCC and completed between 2010 and 2023 have prevented an estimated 390,445 kilograms of phosphorus from reaching Lake Winnipeg.
Figure 14: Estimated cumulative reduction in the amount of phosphorus reaching Lake Winnipeg, Canada April 2011 to March 2023
Source: Environment and Climate Change Canada (2023) Lake Winnipeg Basin Program
Notes: Previously reported estimated cumulative phosphorus reductions for 2020 and 2021 have been revised to reflect updated information submitted by project proponents. The estimated reduction in phosphorus load is based on the proponent reported results of LWBP-funded projects completed between April 2010 and March 2023. Estimated phosphorus reductions for each project are summed to calculate the total. Year refers to fiscal year, which runs from April 1 to March 31. The year 2023 therefore refers to April 1, 2022 to March 31, 2023.
Long description for Figure 14
Figure 14 shows the estimated cumulative reduction in the amount of phosphorus reaching Lake Winnipeg as a result of projects implemented through Environment and Climate Change Canada’s Lake Winnipeg basin programming, Canada, April 2011 to March 2023.
Estimated cumulative reduction in the amount of phosphorus reaching Lake Winnipeg as a result of projects implemented through Environment and Climate Change Canada’s Lake Winnipeg basin programming, April 2011 to March 2023
(Kilograms of phosphorus)
Year
Estimated phosphorus removal (Kilograms of phosphorus)
Estimated one-time phosphorus removal (Kilograms of phosphorus)
Total estimated phosphorus removal over all years (Kilograms of phosphorus)
2011
4 906
n/a
4 906
2012
1 586
n/a
11 398
2013
0[A]
n/a
17 890
2014
122
n/a
24 504
2015
8 194
n/a
39 312
2016
7 403
21 345
82 869
2017
7 504
n/a
112 583
2018
0[A]
n/a
142 298
2019
9
n/a
172 022
2020
1 609[B]
n/a
203 355[B]
2021
14 881
n/a
249 569[B]
2022
23 164
n/a
318 947
2023
2 120
n/a
390 445
Note: n/a = not applicable.
[A] No new phosphorus reduction projects were funded that year.
[B] The value has been updated as a result of a correction in the reported value from a completed project.
6.2 Great Lakes Protection Initiative
The Great Lakes Protection Initiative is ECCC’s primary regional program targeting federal water quality and aquatic ecosystem priorities in the Great Lakes. Through the Initiative, ECCC combines science and action to address the most significant threats to Great Lakes water quality and ecosystem health. Priorities for action in 2022 continued to be restoring water quality and ecosystem health in Areas of Concern, preventing toxic and nuisance algae, improving the health of coastal wetlands, identifying at-risk nearshore waters, reducing releases of harmful chemicals, engaging Indigenous peoples in addressing Great Lakes issues, and engaging the public through citizen science.
Freshwater management of the Great Lakes is a responsibility shared by multiple levels of government. To coordinate efforts on water management, restoration and protection, ECCC works in close collaboration with other implicated federal departments, the governments of Ontario and the United States, local governments, Indigenous partners and many other organizations and individuals. This is accomplished through leading and coordinating implementation of the:
2021 Canada-Ontario Agreement on Great Lakes Water Quality and Ecosystem Health (COA), an instrument under the Canadian Environmental Protection Act, 1999 that provides the governments of Canada and Ontario with a shared short-term (five-year) action plan for achieving Canada’s commitments under the GLWQA. The 2021 COA came into effect on June 1, 2021, and will expire May 31, 2026.
Key actions completed during the 2022-2023 reporting period include:
Canada, together with the United States, hosted the triennial Great Lakes Public Forum from September 27-29, 2022, in Niagara Falls, Ontario to celebrate the 50th anniversary of the GLWQA and deliver on important commitments under the Agreement to discuss with the public the state of the Great Lakes, progress made under the Agreement, and proposed priorities to guide science and action over the next three years. The event was a success and was attended by representatives of federal, provincial, state, and local governments, First Nations, Tribes, Métis, nongovernment organizations, academia and the public from Canada and the United States.
Canada and the United States issued the triennial State of the Great Lakes and Progress Report of the Parties, required under the GLWQA.
Canada, in cooperation with the Province of Ontario and other partners, continued to implement the Lake Erie Action Plan to reduce phosphorus loads to Lake Erie from Canadian sources.
Canada, in cooperation with the Province of Ontario and other partners, continued to implement actions identified in the binational strategies for Chemicals of Mutual Concern risk management.
Areas under high cumulative stress and of high ecological value within Canadian nearshore waters were identified under the Great Lakes Nearshore Framework. The Framework is a systematic, integrated and comprehensive approach for assessing the nearshore health of the Great Lakes and identifying and communicating cumulative impacts and stresses.
Restoring water quality and ecosystem health in Great Lakes Areas of Concern
Areas of Concern (AOCs) are specific locations, such as rivers, harbours, and embayments, where water quality and ecosystem health have been severely degraded by human activity at the local level.
What is a Beneficial Use Impairment?
Beneficial Use Impairments are the measures of the environmental, human health or economic impact of poor water quality. The GLWQA defines 14 Beneficial Use Impairments that contribute to a location’s designation as an AOC:
Restrictions on Fish and Wildlife Consumption
Tainting of Fish and Wildlife Flavour
Degradation of Fish Wildlife Populations
Fish Tumours or Other Deformities
Bird or Animal Deformities or Reproduction Problems
Degradation of Benthos (Organisms living on lake bottoms)
Restrictions on Dredging Activities
Eutrophication (Undesirable Algae)
Restrictions on Drinking Water Consumption, or Taste and Odour Problems
Beach Closings
Degradation of Aesthetics/Visual Appearance
Added Costs to Agriculture or Industry
Degradation of Phytoplankton and Zooplankton Populations (Organisms that provide a crucial source of food to fish)
Loss of Fish and Wildlife Habitat
Environmental quality in all of Canada's Great Lakes Areas of Concern has improved since the restoration program began. Of the 157 specific Beneficial Use Impairments (BUI) initially identified for remedial actions or further study across all AOCs, 98 have been addressed and removed from the list. Efforts continue to restore and assess the remaining 59.
In 2022-2023, Canada, in cooperation with the Province of Ontario and other partners, continued to restore BUIs in AOCs and confirmed the following impairments had been addressed:
Thunder Bay – Beach Closures
Niagara River – Beach Closures
In 2022-2023, examples of activities which Canada (through ECCC or others) led or supported to restore water quality and ecosystem health in Canadian AOCs include:
In the Hamilton Harbour AOC, tertiary upgrades to the Woodward Wastewater Treatment Plant were completed and the plant entered the commissioning phase. When fully operational, the plant will meet effluent objectives for phosphorus, ammonia and suspended solids under the Hamilton Harbour Remedial Action Plan and will advance progress towards addressing the Undesirable Algae BUI. The Randle Reef contaminated sediment management project moved into its third and final stage. A capping pilot project was completed and tendering for Stage 3 was initiated to place an environmental cover on top of the Environmental Containment Facility where the sediments removed from the other parts of Randle Reef were placed.
In the Toronto and Region AOC, the first phase of the Don River and Central Waterfront project is nearing completion. As of February 2023, the Coxwell Bypass Tunnel, the Ashbridges Bay landform, and the new Ashbridges Bay Treatment Plant Outfall project were more than 75 percent complete. With an overall budget of more than $3 billion, this project will keep combined sewer overflows out of the Lower Don River, Taylor-Massey Creek and Inner Harbour. To advance progress on improving fish and wildlife habitat, the Gibraltar Point restoration project was completed on the Toronto Islands. This involved creating a 30 000 square metre nearshore reef and importing 55 000 tonnes of sand to recreate a two-hectare beach-dune system. The Toronto and Region Conservation Authority and partners developed a Waterfront Integrated Restoration Prioritization framework that uses existing data to prioritize restoration opportunities that could contribute most to improving aquatic habitat along the Toronto waterfront and achieve habitat restoration targets.
In the Bay of Quinte AOC, the Lower Trent Conservation Authority continued implementation of agricultural landowner stewardship programs, which resulted in 640 hectares of cover crops planted and the completion of several other rural best management practices on private lands. These projects will reduce phosphorus from rural and urban non-point sources, and advance progress towards addressing the Undesirable Algae and Degradation of Phytoplankton and Zooplankton BUIs.
In the St. Lawrence River AOC, planning and design efforts were undertaken for a project to restore the Bainsville Bay Marsh coastal wetland to advance progress towards addressing the Loss of Fish and Wildlife Habitat BUI. Baseline conditions for vegetation, fish and wildlife communities were identified and designs for an erosion control reef were developed. Additionally, 40 Mallard duck and swallow boxes have been constructed for nesting birds throughout the marsh. The Mohawk Council of Akwesasne delivered community engagement and outreach to share the findings and solicit feedback on a status change for the Beach Closing BUI. Surveys revealed that the Akwesasne community were supportive of changing the beneficial use status of the Beach Closing to “no longer impaired”.
In the St. Lawrence River AOC, monitoring of mercury in sediment and benthic invertebrates was conducted to assess the rate of recovery from mercury contamination.
In the Detroit River AOC, planning, permitting, and design efforts were undertaken for projects designed to protect the wetland complex at the Canard River mouth and to re-create wetland habitat at the south end of Fighting Island. Monitoring efforts included conducting wetland surveys for marsh birds, water quality, submerged vegetation, and aquatic macroinvertebrates at seven sites to assess fish and wildlife habitat in the AOC. These projects advance progress towards addressing the Loss of Fish and Wildlife Habitat, and Degradation of Fish and Wildlife Populations BUIs.
In the Niagara River AOC, all remedial actions for habitat restoration were completed by March 2022. Evaluation of project results started in 2022-2023 with the drafting of an assessment report on the Loss of Fish and Wildlife Habitat Impairment. Water and sediment quality fieldwork and data analysis concluded in 2022-2023 and is supporting the assessment of the Restrictions on Fish and Wildlife Consumption Impairment. Monitoring to measure contaminant concentrations and benthos in Lyons Creek East, the last contaminated sediment site on the Canadian side of the Niagara River AOC, is underway. Monitoring activities continue to help determine the extent of natural recovery, and appropriate next steps.
In the Niagara River AOC (Lyons Creek), monitoring of polychlorinated biphenyls (PCBs) in sediment and benthic invertebrates was conducted to assess the rate of recovery from PCB contamination.
In the St. Marys River AOC, the Contaminated Sediment Management Strategy is in place to advance progress toward addressing the Degradation of Benthos Impairment. The Strategy provides a summary of the history, current status, and management actions appropriate for addressing contaminated sediment within the Canadian portion of the AOC. In 2022-2023, activities included planning and scoping of fieldwork for 2023 to assess the state of natural recovery within the water lot owned and managed by Transport Canada.
In the Jackfish Bay AOC in Recovery, monitoring the effectiveness of natural recovery in Moberly Bay continued and a Community Advisory Committee established in 2021 continued their work in 2022-2023 to engage local governments, First Nations, Métis and the public in the assessment and decision-making for redesignating BUIs. This included developing an approach to assess the status of the Loss of Fish and Wildlife Habitat Impairment.
In the Thunder Bay AOC, ECCC worked with community partners to develop the Thunder Bay Wildlife Habitat Strategy (finalized in December 2022). The Strategy was produced in partnership with all levels of government, First Nation and Métis communities, and local residents to identify the final restoration efforts needed to redesignate the Loss of Fish and Wildlife Habitat Impairment. Remedial projects were implemented in 2022-2023, including at Fisherman’s Park West located at the mouth of the Current River on Lake Superior. This former industrial brownfield site is being revitalized with 3.5 hectares of new riparian and coastal habitat featuring grassland prairie, shoreline, and wetland features.
Scientific research and monitoring
ECCC undertakes research, modelling and monitoring to support decision making in the Great Lakes. In 2022-2023, monitoring for nutrients, toxic chemicals, excessive and/or harmful algae, and other measures of water quality, largely resumed after COVID-19 restrictions were lifted. Science activities continued to focus on analysis and interpretation of existing data collected to investigate the factors contributing to excessive algal growth in the nearshore areas of lakes Erie and Ontario. Data and syntheses were used to improve and refine integrated watershed-lake models, and informed binational task teams assessing in-lake response of hypoxia and algae to the changes in nutrient loads and measuring progress towards achieving objectives for Lake Erie.
Data collection for research assessing the influence of agricultural best management strategies, such as cover crops, on nitrogen and phosphorus losses from agricultural land continued through 2021-2023. This data is being used to train machine learning models to quantify nitrogen and phosphorus mitigation attributable to the implementation of best management practices.
Knowledge and data sharing also continued between federal, provincial, and municipal researchers as well as United States researchers including the National Oceanographic and Atmospheric Administration (NOAA) and U.S. Environmental Protection Agency (US-EPA) to advance research to fill in knowledge gaps related to physical and biogeochemical in-lake processes contributing to the growth of nuisance and toxic algae in the nearshore and offshore water of Great Lakes with a particular focus on Lake Erie and Lake Ontario.
Research efforts advanced the development of new modelling capability for understanding the effect of catchment inputs on local water quality and benthic algae (Cladophora) and improving our understanding of major drivers of variation. Improved modelling efforts were continued to assist the development of east basin nutrient objectives. Integrated watershed-lake models were further refined for Lake Erie to improve understanding of the factors responsible for hypoxia and algae, including a new sediment diagenesis modelling framework to better assess the effectiveness of nutrient load reduction on seasonal hypoxia in central Lake Erie.
Continued collaborative research with Ontario and academia on identifying and understanding sources of groundwater contamination (including nutrients, road salt, and contaminants of emerging concern, like per- and polyfluoroalkyl substances [PFAS]) that threaten Great Lakes waters and their ecosystems. A recent noteworthy finding is the high concentrations of PFAS found in historic landfills, even for those closed 60 years ago, which are commonly situated near surface water bodies and often lack infrastructure to prevent groundwater contamination and its offsite transport.
Reducing the amount of phosphorus from reaching Lake Erie
Through the Great Lakes Protection Initiative, ECCC provides funding for partner-led projects that increase participation in the application of phosphorus load reduction measures by promoting and demonstrating innovative approaches and best management practices. In 2022-2023, the initiative launched a two-year modelling effort in a priority watershed to map the highest source areas for phosphorus loss at the field scale, which will allow for the implementation of best management practices that maximize phosphorus loading reductions at the lowest cost.
The 20-tonne edge-of-field reduction in total annual phosphorus from Canadian sources to Lake Erie continued to be met in 2022-2023.
The indicator Phosphorus loading to Lake Erie was updated in December 2021 with data up to 2020. Lake Erie phosphorus loads are publicly reported annually through various mechanisms.
Figure 15: Total estimated phosphorus loadings to Lake Erie, 2008 to 2021
Source: Environment and Climate Change Canada (2022)
Note: Basin total values include loadings from runoff and tributaries in Canada and the United States, flows from Lake Huron and atmospheric sources of phosphorus. Half of the total phosphorus loadings from atmospheric sources and half of those from Lake Huron were allocated to each country.
Long description for Figure 15
Figure 15 shows estimated phosphorus loading to Lake Erie from 2008 to 2021.
Total estimated phosphorus loading to Lake Erie, 2008 to 2021
Year
Canada (tonnes per year)
United States (tonnes per year)
Basin total (tonnes per year)
2008
1525
9026
10551
2009
2158
6242
8400
2010
903
4768
5672
2011
2758
8817
11575
2012
1305
7161
8466
2013
1987
6648
8634
2014
2594
6497
9091
2015
1456
5342
6798
2016
1133
4613
5747
2017
1792
8993
10785
2018
2405
9395
11800
2019
2588
10944
13533
2020
1939
7701
9640
2021
1562
5746
7308
Citizen science
In 2022-2023, ECCC continued to support the application of environmental DNA (eDNA) in community-based water monitoring through the STREAM project (Sequencing the Rivers for Environmental Assessment) to observe aquatic biodiversity as a measure of river and wetland ecosystem condition. This involved a range of partners across the country including non-government organizations and Indigenous communities. Data was collected and can be visualized through the Open Data Portal.
6.3 St. Lawrence Action Plan
The St. Lawrence Action Plan is an agreement for collaboration between the Canadian and Quebec governments intended to strengthen collective efforts for the integrated management of the St. Lawrence Basin, and to carry out joint actions to conserve and enhance its ecosystem. These efforts focus on three priorities:
biodiversity conservation
improved water quality
sustainable use
The Canada-Quebec Agreement on the St. Lawrence (2011-2026) allows for implementation of the St. Lawrence Action Plan that covers a span of 15 years, with five-year planning cycles. The program focuses on all the St. Lawrence River’s ecosystems and on the mouths of its main tributaries, from Lake Saint-François, straddling the border between Quebec and Ontario, to the eastern reaches of the Gulf of St. Lawrence. It produces concrete results through cooperative efforts from the private sector, universities, research centres, Areas of Prime Concern committees (zones d’intervention prioritaire, known as ZIP committees), non-governmental organizations and riverside communities.
In 2022-2023, three factsheets related to the St. Lawrence Action Plan were published:
Safety of potential freshwater St. Lawrence River swimming sites – 3rd edition
Freshwater Wetlands – 4th Edition
Zebra Mussel Response Planning Guide for the Saint-François River Basin
In 2022-2023, work on projects identified in the Canada Water Act Annual Report for 2021-2022 continued, including:
the development and implementation of response plans for priority species
a study of the species targeted by sport and commercial fisheries in Quebec
the measure of the recruitment index of Rainbow Smelt in Fjord du Saguenay
the monitoring of summer sport fishing on the Saguenay
the implementation of a discussion group on the management of ecological risks related to maritime transportation of oil and gas on the St. Lawrence
a study of the synergistic effects of pesticides and cyanotoxins as stressors in Lake Saint-Pierre
the assessment of health risks pertaining to the microbial quality of bathing sites in the
Lawrence River
A network of governmental and non-governmental collaborators continued to conduct sampling campaigns through the State of the St. Lawrence River Monitoring Program to obtain scientific data on the river. In 2022-2023, two of the three data collection activities that were delayed in 2020-2021 and in 2021-2022 due to the COVID-19 pandemic were reinstated (seabird populations and toxins in the St. Lawrence). The only research activity that did not resume is on water contamination by organic toxins at the mouths of the Richelieu and Yamaska rivers. In the last year, scientists concluded that analyzing these organic toxins through fish samples was more reliable than analyzing this data through water samples. As such and considering the limited territory that could be covered by the resources planned for the related water sampling campaign, this activity has been officially cancelled.
Community involvement and awareness
Under the St. Lawrence Action Plan, ECCC and Quebec’s Ministry of Environment, Fight against Climate Change, Wildlife and Parks (Ministère de l’Environnement, de la Lutte contre les changements climatiques du Québec, de la Faune et des Parcs) are implementing the Community Interaction Program (CIP), which provides funding to non-governmental organizations and Indigenous communities for projects that aim to conserve and enhance the ecosystem of the St. Lawrence.
In 2022-2023, ECCC distributed $431,046 in funding for 10 projects. These projects involved riverside communities, including municipalities, First Nations, and relevant provincial and federal departments. Specifically, the projects funded were intended to:
raise public awareness on the importance of the St. Lawrence ecosystems
promote sustainable fishing practices
detect and control the invasion of exotic plant species
protect important ecological systems (i.e. wetlands, rivers, coastal environment)
restore aquatic and riparian habitats and improve water quality
The Areas of Prime Concern Program supports Stratégies Saint-Laurent and its 12 ZIP committees in their collaborative actions to engage and support local stakeholders working to improve the quality of the surrounding environment. In addition to empowering and mobilizing partners, these cohesive activities raise their awareness of the state of the St. Lawrence.
6.4 Lake of the Woods Science Program
The ECCC Lake of the Woods Science Plan was implemented from 2016-2020. Data collected during this time led to 12 publications in the February 2023 special section on Lake of the Woods – Five Years of Research (2016-2021), in the Journal of Great Lakes Research. The initiative aimed to engage citizens, scientists, and domestic and international partners, and resulted in the development of an ecosystem model to project the lake’s response to nutrient reductions, which was subsequently used to develop nutrient reduction scenarios.
In 2022-2023, ECCC continued to implement key priorities for the lake, including monitoring water quality conditions, remote sensing of algal blooms, advancing the understanding of in-lake processes such as winter bloom conditions, and engaged with partners including Indigenous communities on nutrients and aquatic ecosystem health.
7 Research and development
Significant water-related research and development activities are conducted by ECCC across Canada. Many of them benefit from data gathered through monitoring activities conducted pursuant to hydrometric agreements concluded under the Canada Water Act.
7.1 Research on the impacts of climate change on aquatic systems
In 2022-2023, ECCC undertook activities to quantify and predict local, regional, and national sensitivities of hydrological regimes and aquatic ecosystems to climate change, including:
continuing the development and implementation of a National Water Quality Modelling Framework, which will conduct research, modelling, and monitoring for short and long-term prediction and synthesis of water quality conditions and trends that will contribute to future national assessments, and can be used to identify vulnerable regions to known stressors
assessing hydro-climatic and ecological impacts of river ice jams and open-water floods, with focus on the Peace-Athabasca River, Peace-Athabasca Delta ecosystems, and the Wood Buffalo National Park Action Plan
continuing assessment of climate variability/change and flow regulation/water abstraction on the flow regime of the Peace River, Athabasca River, Peace-Athabasca Delta ecosystem, and the Wood Buffalo National Park Action Plan
assessing the climate variability and change on Prairie wetlands and hydrology, including resulting impacts on the water quality availability in the Prairie’s watershed
investigating the effect of future snowpack loss on the predictability of summer maximum flow and mean flow over river basins in western Canada
assessing the historical variability and trends in river water temperature over Western Canada with continued expansion to the entire country
examining the sensitivity of lakes to changing climatic conditions to identify spatial and temporal patterns of projected changes in lake-ice phenology and water temperature profiles
examining linkages between groundwater discharge, chemistry and freshwater aquatic habitats in a subarctic lake (Kluane Lake, Yukon) that has undergone recent and dramatic hydrological change
conducting research to evaluate the impact of permafrost degradation and changing land cover and flow pathways on water cycling and chemistry in the Arctic and subarctic Canadian Shield
assessing environmental factors associated with extent, severity and persistence of permafrost thaw slumping in the Arctic on riverine benthos and ecological functioning
contributing to the Arctic Marine Assessment Report (AMAP) on Freshwater and Cryosphere in a Changing Climate and Conservation of Arctic Flora and Fauna (CAFF)
7.2 Technology development
National Hydrological Service’s Renewal Initiative and the Innovation Component
The five-year $15.5M National Hydrological Service’s (NHS) Renewal initiative has completed its final year. It was launched in the summer of 2018. This initiative involved an $89.7M investment in the ECCC’s NHS in four areas or components: forecasting water quantity, infrastructure, rebuilding capacity, and innovation. The broad objective of the innovation component was to enhance monitoring and hydrological services by evaluating and testing innovations in measurement technology and data quality management.
In 2022-2023, the innovation component included:
improving the timeliness of hydrometric data production through improved workflows and management of data from the field
improving products and services delivered through wateroffice and other means such as datamart and Geomet
working towards the publication of the site characterization database
improving data computation methods for winter records
improving the accuracy and reliability of water level data by improving quality control and use of non-contact measurement methods
investigating the incorporation of uncertainty into hydrometric data products
standardizing the vertical reference for all NHS hydrometric stations
bringing further improvements to the NHS data production system
investigating means to improve resiliency of telemetry systems
looking at additional methods to improve the estimation of river discharge
testing the use of non-contact technology, such as surface velocity radars and cameras (using images from both drones and fixed station cameras) for improved water level and flow monitoring. Roughly 60 drone-based comparison measurements were made to assess the performance of drone-based discharge measurements, using portable surface velocity radar
Hydrometric instrumentation, data collection and data production
In 2022-2023, ECCC continued its work as follows:
investment at the operational level, in field technologies, including hydroacoustic equipment and advanced deployment platforms, such as bank-operated cableway systems and remote-control boats as manned cableways across the country are being decommissioned.
testing of routine instrument quality assurance of hydroacoustic devices (both field- and laboratory-based)
development of in-house tow tank capacity for routine validation testing of acoustic Doppler velocimeters (ADVs), which is the device that accounts for more than 60% of all discharge measurements across Canada
operation of more than 90 transmitting cameras and more than 200 lower-cost time-lapse cameras through ECCC’s NHS (including predominately satellite cameras and a handful of cell modem cameras)
using drone-based comparison measurements to assess the performance of drone-based discharge measurements, with roughly 60 comparison measurements being made using portable surface velocity radar to assess the technology
examination of ways to support information management and dissemination plans for station images, including working with the ECCC’s Access to Information and Privacy (ATIP) group to minimize the risk of inadvertently capturing personal information
transition from land-based telecommunications systems to cellular or satellite services in coordination with territorial and provincial partners, keeping abreast of emerging satellite telemetry technologies and coordinating risk analysis with other Canadian environmental monitoring agencies through an interagency telemetry working group.
exploration of options to make more accessible, the results of a 2022 site characterization survey that has yielded important information to optimize various aspects of the day-to-day operations of the network
Surface Water and Ocean Topography (SWOT) Mission
In 2022-2023, ECCC continued work related to the development of space-based monitoring technologies for water resources in Canada, through participation in the SWOT satellite mission. The SWOT satellite, a joint mission between National Aeronautics and Space Administration (NASA) and Centre National d'Etudes Spatiales with support from other international space agencies including the Canadian Space Agency (CSA), includes novel radar altimetry technology that promises to provide the first global survey of the Earth’s freshwater. ECCC’s formal contributions to this important mission are detailed in an MOU between ECCC and the CSA (2019-2024). Canadian SWOT team members made significant progress on several fronts, including model development and hydrodynamic modelling runs at several test sites, the analysis of data collected for the North Saskatchewan River, and analysis of previously collected data from the Peace-Athabasca Delta and Redberry Lake, among others.
Other ECCC activities related to the SWOT mission include participation on both Canadian and international SWOT working groups, collaboration with academic researchers from Canadian and US universities and SWOT-related research projects by ECCC scientists. Specific ECCC endeavors related to SWOT in 2022-2023 included continued preparation for field-based activities, acquisition and testing of field monitoring equipment and strategies, participation in an international SWOT calibration/validation field trial, and continued refinement of models. The SWOT satellite successfully launched in December 2022 kicking off the official start of the three-year mission.
Improving our understanding of aquatic communities
Researchers continued to advance work to better understand bacterial, cyanobacterial, algal, and macroinvertebrate diversity and their role in ecosystem health, in association with the complexities of physical-chemical processes. Critical to these investigations are the implementation and incorporation of rapidly developing ‘omics’ (genomics, transcriptomics, metabolomics) tools, which more holistically enhance our understanding of aquatic ecosystem processes, services, biodiversity, biogeochemical functioning, and responses to various environmental stressors. Such ‘omics’ data is important for foundational understanding and modelling of aquatic ecosystems and the ability to forecast and/or appropriately plan for mitigation of climate change effects. Further, omics studies help to support One Health principles, the globally accepted framework that considers the interconnectedness between animal and human health and the environment. In 2022-2023, this type of research was directly supported by ECCC’s participation within the Genomics Research and Development Initiative (GRDI), which develops Shared Priority Projects (SPPs) across government departments.
The federal GRDI SPP ‘Metagenomic-Based Ecosystem Biomonitopring (EcoBiomics) involved a large-scale study on macroinvertebrate biodiversity in rivers of the Canadian Maritimes, in collaboration with the Canadian Aquatic Biomonitoring Network (CABIN) and Sequencing the Rivers for Environmental Assessment and Monitoring (STREAM) program. Data gathered by ECCC researchers in collaboration with CABIN partners will support future modelling of river biodiversity in relation to climate change, and will enable a new generation of biomonitoring tools to be developed to support local communities monitor and assess the health of their rivers.
7.3 Program development
Quality assurance
ECCC continued its commitment to quality assurance and continual improvement in 2022-2023. Efforts to increase education and awareness amongst ECCC staff on practices, policies and procedures that ensure quality assurance throughout the program, were a priority in 2022-2023.
In winter 2023, ECCC also participated in the International Standards Organization Quality Management System (ISO 9001) surveillance audit as part of maintaining certification in the globally recognized standard. ECCC also completed internal quality assurance audits for the four largest regions of the program, which examine whether procedures have been followed during both field and office operations and identify areas for improvement.
The update of quality management documents is in an on-going activity. New technology and methods are regularly explored to improve data quality, increase technician safety, and provide measurement solutions for conditions where existing methods and technologies are ineffective or impractical. A document describing requirements to consider new methods and technologies valid for acquiring and producing hydrometric data were produced following broad internal consultation.
Other documentation investments focused on improving national consistency, efficiency, and data quality. Office procedures for producing water level data were published, and online all-staff awareness sessions were attended by the vast majority of ECCC staff. This new approach to socializing new procedures through presentations, question and answer sessions and associated quizzes enabled staff to learn about new procedures and informed the national support team about areas requiring further guidance and training.
Hydrometric science and development
The ECCC’s NHS continued to collaborate among other internal ECCC groups as well as with external government and academic partners to improve flow prediction capability under the auspices of its federal obligations related to transboundary water management, and through the recently completed prediction component of the NHS-Transformation Initiative. Operationalization of hydrodynamic and ecohydraulic models in rivers of federal significance also continued through collaborations with key academic partners. NHS continued efforts with academia, industry, and provincial and territorial partners to continue updates to the “Modélisation Environnementale communautaire - Surface Hydrology” (MESH) model and is working with these groups to ensure ECCC modelling tools and its data services are compatible within their operating environments for flow forecasting.
ECCC’s NHS also continued outreach and engagement efforts with operational practitioners from the provincial and territorial river forecasting centres and worked with other ECCC groups to provide products and services in support of their flood forecasting and early warning activities. ECCC and its provincial and territorial partners continued to actively participate in the”Community of Practice on Operational Hydrological Prediction in Canada”, which was established in the fall of 2021. The community met every three months during the past year and informally in between meetings, encouraging interactions, collective learning, inter-jurisdictional support, and collaboration among its members. Collectively this will help build relationships and strengthen collaboration between the river forecasting centres and ECCC and ensure ongoing prediction research and development efforts are aligned with the needs and requirements of end-users. ECCC’s end-of-year survey of Community members indicated they value the opportunity to connect with other flow forecasting practitioners from other regions across the country and saw value in maintaining the initiative.
Through the NHS-Transformation Initiative, ECCC also continued developing and enhancing its water quantity prediction capacity. The National Surface and River Prediction System (NSRPS), an integrated atmospheric, land surface and streamflow prediction system developed by research hydrologists and physical scientists from ECCC’s Meteorological Research Division (MRD) and Canadian Centre for Meteorological and Environmental Prediction (CCMEP) over the past several years, was successfully delivered to operations in the fall of 2021. In 2022-2023, flow predictions from this system were extended into three additional basins, including the Columbia and Skeena Rivers, and the Bay of Fundy drainage area, bringing the total basin coverage to nine (includes the previously implemented Yukon, Mackenzie, Nelson, and Churchill rivers, the Great Lakes – St. Lawrence River basin, and the terrain draining into the Gulf of St. Lawrence). Dissemination of important land-surface prediction data from NSRPS to external partners, including soil moisture and snowpack information, was also completed in 2022-2023. ECCC also supported several provincial and territorial forecasting centres in conducting preliminary evaluations and assisted them in integrating NSRPS products into their operational systems during the past year.
ECCC and provincial and territorial partners also continued to evaluate and integrate products from the Regional Deterministic Reforecasting/Reanalysis System (RDRS, v2.1), a re-analysis covering the period 1980-2018 for North America. RDRS provides a source of continuous historical data describing the main meteorological variables required for land surface and hydrology applications, such as near-surface air temperature and precipitation. Further innovations to RDRS continued during 2022-2023.
Through ongoing coordination between ECCC’s NHS and MRD, the NHS’ support of a community-based version of the National Surface and River Prediction System (NSRPS) via the “Modélisation Environnementale Communautaire – Surface Hydrology” (MESH) model, allows ECCC to continue efforts at maintaining and providing updated versions of its operational land surface and flow modelling systems to academic partners, such as Université Laval and Université de Sherbrooke, for continued mutually-beneficial innovation. In 2022-2023, the NHS moved the code of MESH to an external project management platform to improve coordination of collaboration with academia and other partners.
Hydrometric Monitoring Needs Index
Having been developed over the last five years, the Needs Index was not further refined in 2022-2023. The over-arching themes of (i) safe and resilient communities; (ii) natural resource economies; (iii) cryosphere; (iv) Indigenous obligations; and (v) monitoring for climate change were presented to provincial and territorial partners throughout the summer and fall of 2022. Provincial and territorial partners generally approved of the concept and approach for the Needs Index. However, in some cases the partners questioned the validity/currency of the input data, noting that results are strongly dependent on data availability. Our provincial and territorial partners noted that some updated data sets may be available for future iterations of the Needs Index. One challenge that has been identified for this tool is the requirement for current national data sets. ECCC has provided documentation and geospatial models for partners to develop their own provincial/territorial needs index models as desired.
Outreach
ECCC supports openness and interoperability of information and data access across various systems. Through the department’s efforts, real-time unit values of water level and discharge are now available to general public via the Wateroffice web service, facilitating automatic downloading in .csv format via scripting.
ECCC also increased the sharing of information with key partners and stakeholders. Metadata such as data corrections, field visits, rating curve summary, application periods, rating curve shifts, and the rating curve/table are available to login users via the Wateroffice web service. The sharing of this information has greatly improved the data exchange between ECCC and its key partners and stakeholders, such as provincial/territorial partners and USGS.
7.4 Modelling and studies
For several years, researchers and scientists at ECCC and many partner organizations have used atmospheric and weather data as input for day-to-day operational forecasting models, and hydrologic data collected under the hydrometric agreements as input for hydrologic models. These models demonstrate how regional hydrometeorological modelling can help improve water resources management.
Great Lakes
ECCC collaborates with the United States Army Corps of Engineers (USACE), the National Oceanographic and Atmospheric Administration (NOAA), and the USGS to operationalize various modelling systems for historical analysis and future predictions of the water balance in the Great Lakes – St. Lawrence River system.
In 2022-2023, ECCC continued to improve methods for coupled hydrometeorological modelling and prediction systems under an expanded environmental prediction framework. These efforts enable an improved understanding of interactions between the atmosphere, land surface, basin stream network and the Great Lakes themselves, and support ongoing critical monitoring, multiple forecasting initiatives, and overall improved water management activities in the region. Highlights during the past year include the addition of water supply predictions from ECCC's new National Surface and River Prediction System and Regional Deterministic Reforecast/Reanalysis System to the statistical model. These products have also been evaluated for use in operational Great Lakes forecasting, adaptive management efforts, and to support communications within the basin.
Methods for using a combination of the ECCC Canadian Precipitation Analysis (CaPA)-based products and various NOAA precipitation analyses to replace the currently coordinated precipitation product also continue to be evaluated. Efforts to operationalize the bi-nationally merged product are ongoing on both sides of the border.
ECCC continues to provide support in verification of flows through the Great Lakes connecting channels in collaboration with USACE and USGS. Binational field verification measurement efforts in the St. Marys, St. Clair, Detroit, Niagara and St. Lawrence Rivers increased in 2022-2023 compared to the previous year where COVID-19 pandemic restrictions limited the ability to perform the measurements, with ECCC and US crews covering off required verification measurements. It was agreed that US and Canadian crews would limit working in close proximity to each other (e.g. together on boats) and a measurement plan was implemented that allowed the required measurements to be taken with separate US and Canadian crews, despite continued restrictions on travel across the US – Canada border in 2022-2023.
Verification analysis of past measurements continued. ECCC efforts continued to ensure quality assurance and Canada-US coordination of connecting channels hydrometric station measurements. Measurement accuracy of Great Lake connecting channel flows continue to support development of water balance prediction models and accounting for binational water use.
Under the Coordinating Committee on Great Lakes Basic Hydraulic and Hydrologic Data, a comprehensive plan to update the International Great Lakes Datum of 1985 (vertical datum) for the Great Lakes-St. Lawrence system has been developed. An extensive binational field survey that had previously been postponed, was completed in 2022. The efforts for the update are ongoing and is anticipated to be completed by 2027.
International rivers
In 2022-2023, ECCC finalized the Champlain-Richelieu River Study with the production of a public version of an integrated modelling tool (ISEE-Integrated Socio-Economic and Environmental system) that allows for a robust quantitative analysis of mitigation solutions for both sides of the US – Canada border. Numerous performance indicators were integrated in ISEE and developed in collaboration with experts, they cover the environment, flood damage and population vulnerability. Online maps of performance indicators were produced and made available to the public. Also, a large number of high-definition flooding maps were produced and made publicly available on the IJC web site.
Basin scale soil and water assessment modelling was conducted in 2021-2023 for the Lake of Woods, Red River, and Assiniboine watersheds for identifying critical contaminant source areas and predicting nutrient loading from major tributaries based on historical climate, land use, and land management data.
Arctic
In 2021-2022 the Arctic HYCOS Phase I project was completed. The project enabled the most recent assessment of freshwater flux to the Arctic Ocean, demonstrating an increasing trend since 1975 on the order of 5 – 10 km3/year/year (Durocher et al, 2019). The project also enabled development of the Swedish Global Hydrological Predictions for the Environment (HYPE) model (SMHI, 2022) which provides basin-level global scale open access hydrological information.
In 2022-2023, WMO Secretariat engaged ECCC to consider a second phase of Arctic HYCOS. WMO proposed that Phase II initiatives could include topics such as Earth-System-Model infrastructure components (such as WMO Integrated Global Observing System Station Identifiers, OSCAR/Surface metadata entry, and Global Basic Observing Network requirements), cryosphere data for the Arctic basins, or a Hydrological Supply and Outlook System (HydroSOS) pilot. The Arctic states deliver relatively advanced hydrologic programs, but a clear need for these proposed initiatives has not yet been identified by the Arctic states. Talks to develop Phase II are ongoing.
Global
ECCC continued support for the restructuring of the World Meteorological Organization (WMO) in 2022-2023. Several experts from ECCC and from Canadian universities have been nominated to the WMO expert database, and approximately six hydrologists are serving on new WMO task teams related to water under the new structure. Canada’s hydrological experts are contributing to teams focused on modelling, urban hydrology, and hydrometric technologies.
In 2022-2023, ECCC advised the Canadian permanent representative to the WMO on Executive Congress matters including:
The WMO Hydrological Observing System operational implementation;
WMO contributions to the United Nations 2023 Water Conference; and,
United Nations Early Warnings for All program.
The WMO also initiated a pilot program for centennial hydrologic stations in 2022. Canada was asked by the WMO Secretariat to nominate three hydrometric stations which meet specific criteria regarding length of record, data continuity, metadata availability, and operational consistency. The recognition of centennial stations globally will result in a strong reliable global data set for climate change science and will also contribute to sustaining networks. Canada nominated three stations including:
05BB001 Bow River at Banff
01EO001 St. Mary’s at Stillwater
04LJ001 Missinaibi at Mattice
As of March 2023, the WMO program was still evaluating all station entries. Canada’s Hydrological Advisor participated in two WMO Region IV (RAIV) meetings virtually, contributing to discussions on the hydrological needs and plans for RAIV.
8 Water data online
The Government of Canada’s Water website provides content on ECCC’s water-related activities and program areas as well as general information on a wide range of water-related topics and the full text of key water publications (such as the Great Lakes-St. Lawrence River water levels). In addition, the site provides links to laws and regulations.
ECCC’s Wateroffice website provides public access to real-time and archived hydrometric data collected in Canada.
ECCC's Canadian Environmental Sustainability Indicators (CESI) program provides data and information to track Canada's performance on key environmental sustainability issues including climate change and air quality, water quality and availability, and protecting nature. The environmental indicators are based on objective and comprehensive information and convey environmental trends in a straightforward and transparent manner. CESI provides this data on two platforms:
ECCC’s EOLakeWatch provides access to near real time satellite observations of inland water algal blooms, with links to annual summary reports of algal bloom conditions on priority Canadian lakes.
Federal Water Quality Monitoring and Surveillance data are available through various mechanisms:
1) Freshwater quality data collections on the Government of Canada Open Data Portal:
2) Two internal interactive websites allow search and extraction of freshwater quality monitoring and surveillance regional data that can easily be shared as required:
3) The Gordon Foundation’s DataStream integrates federal datasets with community-based water quality monitoring data. ECCC has provided technical advice and expertise (with respect to water quality data) to support the expansion of and improvements in the platforms for Lake Winnipeg DataStream, Mackenzie DataStream, Atlantic DataStream and the Great Lakes DataStream.
9 Additional information
To obtain further information or publications and to submit questions or comments concerning the Canada Water Act, please contact ECCC’s Inquiry Centre.
Environment and Climate Change Canada
Public Inquiries Centre
7th Floor, Fontaine Building
200 Sacré-Cœur Boulevard
Gatineau QC K1A 0H3
Telephone: 819-938-3860
Toll Free: 1-800-668-6767 (in Canada only)
Email: enviroinfo@ec.gc.ca
The following media relations contact is also available to provide information.
Environment and Climate Change Canada
Media Relations
Toll-free within Canada: 1-888-908-8008
Outside Canada: 1-819-934-8008
Email: media@ec.gc.ca