
Health Canada Quarterly Financial Report - For the quarter ended December 31, 2021
Table of Contents
- Introduction
- Basis of Presentation
- Highlights of Fiscal Quarter and Fiscal Year-to-Date Results
- Risks and Uncertainties
- Significant Changes in Relation to Operations, Personnel and Programs
- Statement of Authorities (unaudited)
- Departmental Budgetary Expenditures by Standard Object (unaudited)
Introduction
Health Canada is the federal department responsible for helping Canadians maintain and improve their health. In keeping with the Department's commitment to making this country's population among the healthiest in the world as measured by longevity, lifestyle and effective use of the public health care system, its main responsibilities are as a regulator, a service provider, a catalyst for innovation, a funder, and an information provider. A summary of Health Canada's programs may be found in Part II of the Main Estimates. Health Canada administers the Canada Health Act which embodies national principles to ensure a universal and equitable publicly-funded health care system.
This quarterly financial report has been prepared by management as required by section 65.1 of the Financial Administration Act in the form and manner prescribed by the Treasury Board, and should be read in conjunction with the Main Estimates, Supplementary Estimates A and Supplementary Estimates B.
This quarterly report has not been subject to an external audit or review.
Basis of Presentation
This quarterly report has been prepared by management using an expenditure basis of accounting. The accompanying Statement of Authorities includes the Department's spending authorities granted by Parliament, and those used by the Department consistent with the Main Estimates and Supplementary Estimates for the 2021-22 fiscal year. This quarterly report has been prepared using a special purpose financial reporting framework designed to meet financial information needs with respect to the use of spending authorities.
The authority of Parliament is required before money can be spent by the Government. Approvals are given in the form of annually approved limits through appropriation acts, or through legislation in the form of statutory spending authority for specific purposes.
The Department uses the full accrual method of accounting to prepare and present its annual departmental financial statements that are part of the departmental results reporting process. However, the spending authorities voted by Parliament remain on an expenditure basis.
Highlights of Fiscal Quarter and Fiscal Year-to-Date Results
This quarterly financial report reflects the results of the current fiscal period in comparison to the authorities provided in the Main Estimates, Supplementary Estimates A and Supplementary Estimates B for fiscal year 2021-22, as well as budget adjustments approved by Treasury Board up to December 31, 2021.
A. Significant Changes to Authorities
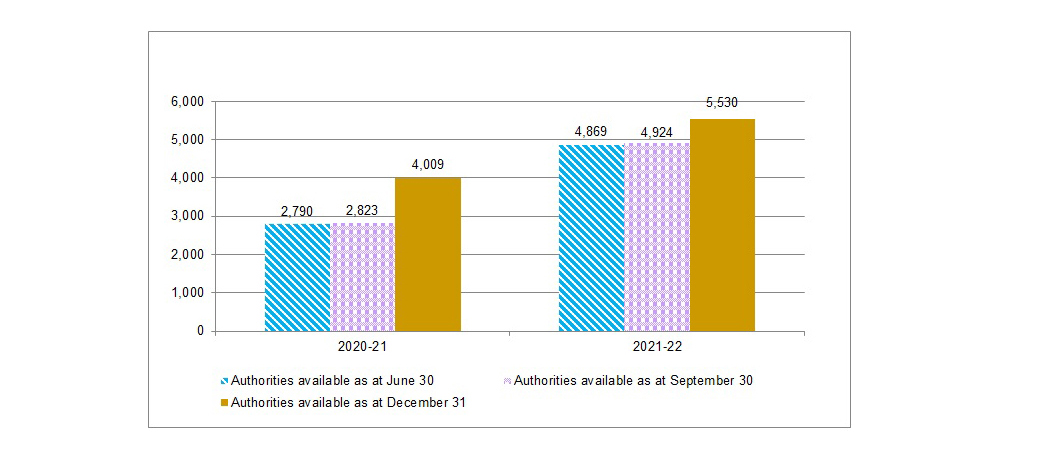
The following graph provides a comparison of net budgetary authorities available for spending at the end of each quarter of the current and previous fiscal years.
Comparison of Net Budgetary Authorities as at June 30, September 30 and December 31 of Fiscal Years 2020-21 and 2021-22 (in millions of dollars)
Text Description
Comparison of Net Budgetary Authorities as at June 30, September 30 and December 31 of Fiscal Years 2020-21 and 2021-22 (in millions of dollars)
Bar chart showing a comparison of net budgetary authorities as at June 30, September 30 and December 31 of fiscal years 2020-21 and 2021-22 in millions of dollars.
2020-21 Authorities available as at June 30 = 2,790; 2020-21 Authorities available as at September 30 = 2,823; 2020-21 Authorities available as at December 31 = 4,009; 2021-22 Authorities available as at June 30 = 4,869; 2021-22 Authorities available as at September 30 = 4,924; 2021-22 Authorities available as at December 31 = 5,530.
The following table provides a comparison of total authorities available by vote at the end of the third quarter of the current and previous fiscal years.
| Authorities available (in millions of dollars) | 2020-21 | 2021-22 | Variance |
|---|---|---|---|
| Vote 1 – Operating expenditures | 1,272 | 1,833 | 561 |
| Vote 5 – Capital expenditures | 21 | 20 | (1) |
| Vote 10 – Grants and contributions | 2,059 | 3,471 | 1,412 |
| Statutory | 657 | 206 | (451) |
| Total authorities | 4,009 | 5,530 | 1,521 |
Authorities available for spending in fiscal year 2021-22 are $5,530 million at the end of the third quarter as compared with $4,009 million at the end of the third quarter of 2020-21, representing a net increase of $1,521 million, or 38%. This increase is primarily attributable to the following:
- $1,008.6 million in funding for investments in long-term care (COVID-19);
- $386.0 million in Treasury Board Central Vote 5 funding to procure rapid test kits (COVID-19);
- $250.0 million increase in funding to strengthen Canada's Home and Community Care and Mental Health and Addiction Services Initiative;
- $80.6 million in funding to improve mental health supports and services (COVID-19);
- $79.5 million in funding for regulatory and operational functions and to support critical COVID-19 focused operations;
- $57.6 million in funding to address the opioid overdose crisis and problematic substance use;
- $53.0 million in funding for mental health and substance use in the context of COVID-19;
- $22.5 million in funding for innovative approaches to testing (COVID-19);
- $16.8 million increase in the Operating and Capital budget carry forwards compared to previous year; and,
- $15.0 million increase in funding to support access to sexual and reproductive health care information and services.
These increases in authorities are partially offset by the following decreases:
- $247.5 million decrease in funding for the creation of a critical drug reserve in collaboration with provinces and territories to support access to drugs which treat COVID-19 symptoms for Canadians;
- $138.2 million decrease in funding for drugs, medical devices and virtual care (COVID-19); and,
- $120.4 million decrease in funding for the Safe Restart Agreement for federal investments in testing, contact tracing and data management (COVID-19).
The fluctuations in authorities available for spending are most notable in the following standard objects: transfer payments, utilities, materials and supplies, personnel, professional and special services, and acquisition of machinery and equipment, and in revenues netted against expenditures for services of a regulatory nature and rights and privileges.
B. Significant Changes in Year-to-Date Expenditures
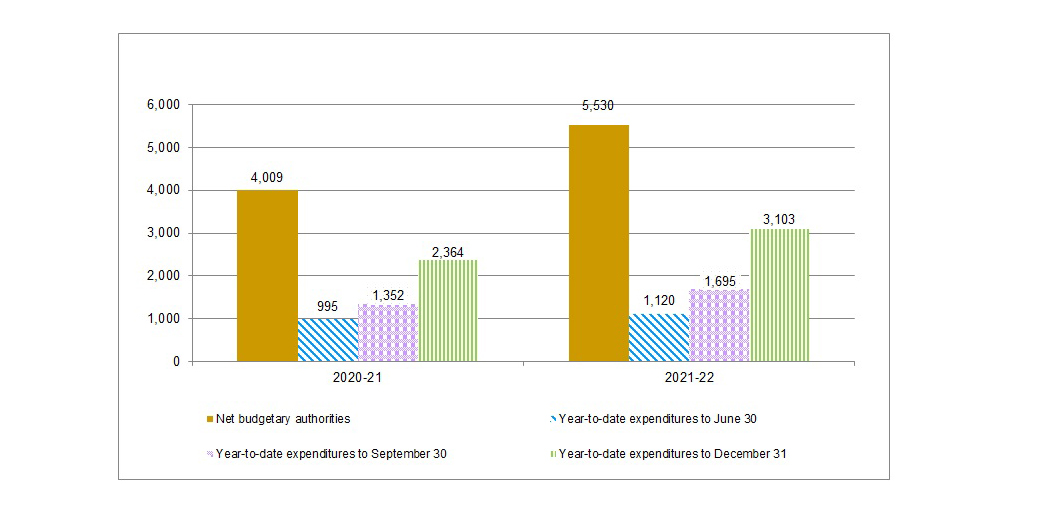
The following graph provides a comparison of net budgetary authorities and year-to-date spending by quarter for the current and previous fiscal years.
Comparison of Net Budgetary Authorities and Year-to-Date Expenditures for the Quarters Ended June 30, September 30 and December 31 of Fiscal Years 2020-21 and 2021-22 (in millions of dollars)
Text Description
Comparison of Net Budgetary Authorities and Year-to-Date Expenditures for the Quarters Ended June 30, September 30 and December 31 of Fiscal Years 2020-21 and 2021-22 (in millions of dollars)
Bar chart showing a comparison of net budgetary authorities and year-to-date expenditures for the quarters ended June 30, September 30 and December 31 of fiscal years 2020-21 and 2021-22 in millions of dollars.
2020-21 Net budgetary authorities = 4,009; 2020-21 Year-to-date expenditures to June 30 = 995; 2020-21 Year-to-date expenditures to September 30 = 1,352; 2020-21 Year-to-date expenditures to December 31 = 2,364; 2021-22 Net budgetary authorities = 5,530; 2021-22 Year-to-date expenditures to June 30 = 1,120; 2021-22 Year-to-date expenditures to September 30 = 1,695; 2021-22 Year-to-date expenditures to December 31 = 3,103.
The following table provides a comparison of year-to-date spending by vote at the end of the third quarter of the current and previous fiscal years.
| Year-to-date expenditures (in millions of dollars) |
2020-21 | 2021-22 | Variance |
|---|---|---|---|
| Vote 1 – Operating expenditures | 551 | 801 | 250 |
| Vote 5 – Capital expenditures | 6 | 5 | (1) |
| Vote 10 – Grants and contributions | 1,619 | 2,141 | 522 |
| Statutory | 188 | 156 | (32) |
| Total year-to-date expenditures | 2,364 | 3,103 | 739 |
At the end of the third quarter of 2021-22, total budgetary expenditures were $3,103 million compared with $2,364 million reported for the same period of 2020-21, representing an increase of $739 million or 31%.
Year-to-date net operating expenditures have increased by approximately $250 million or 45% when compared to the third quarter of 2020-21. The significant variances in operating expenditures are as follows:
- $96.8 million increase in utilities, materials and supplies, primarily due to advance payments for rapid test kits, and the acquisition of pharmaceutical and other medicinal products related to the critical drug reserve initiative;
- $91.6 million increase in personnel expenditures, primarily due to an increase in the number of personnel to address COVID-related initiatives and for continued growth in the Cannabis, Controlled Substances and Opioid Programs, annual salary increments for inflation and step increases, and one-time payments to employees related to Phoenix damage claims;
- $91.5 million increase in professional and special services, due mainly to an increase in psychologist and mental health services which were statutory expenditures in the prior year; an increase in other professional services supporting COVID-19 initiatives including contact tracing, data collection and modelling, and supply chain support, and the purchase of software as a service for Microsoft M365 Licenses; and,
- $27.9 million increase in revenues, which results in a decrease in net operating expenditures, mainly the result of increased fees related to the drugs and medical devices regime, and change in timing of cash receipts for licensing applications, which can vary from year to year.
There was an increase in Vote 10 – Grants and contributions year-to-date expenditures of $522 million or 32%, resulting from the following offsetting factors:
- $376.2 million increase in contributions for Strengthening Canada's Home and Community Care and Mental Health and Addiction Initiative (Home Care and Mental Health) and Virtual Care Services Initiative, due mainly to an increased amount of funding available in 2021-22 and timing of payments;
- $121.5 million increase in contributions for the Safe Restart Agreement for federal investments in testing, contact tracing and data management (COVID-19), due to timing of payments;
- $14.4 million increase in contributions to Canada Health Infoway, due mainly to an increased amount of funding available in 2021-22 and timing of payments;
- $13.3 million increase in contributions for the Substance and Addictions Program, due mainly to an increased amount of funding available in 2021-22 and timing of payments; and,
- $13.5 million decrease in grants due to timing of payments for the Territorial Health Investment Fund.
Statutory year-to-date expenditures have decreased by $32 million or 17% from $188 million in 2020-21 to $156 million in 2021-22 that is mainly comprised of the following offsetting components:
- $50.7 million decrease in statutory spending for COVID-19 initiatives including professional and special services for psychologist and mental health services, which are voted expenditures in 2021-22; and,
- $15.1 million increase in information services mainly due to advertising services for public announcements regarding COVID-19 on behalf of the Public Health Agency of Canada under the Shared Services Partnership agreement.
C. Quarterly Variances
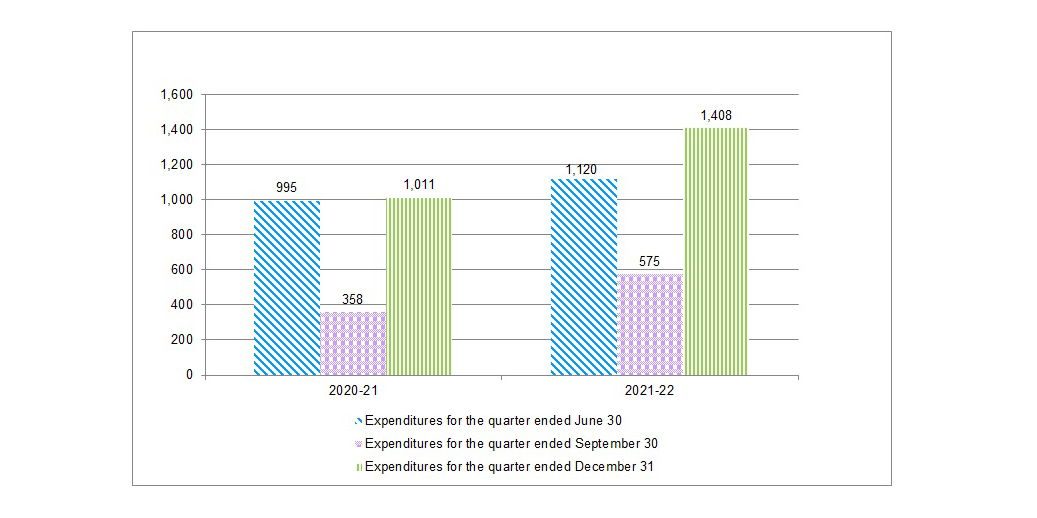
The following graph presents a comparison of quarterly spending by quarter and by fiscal year.
Comparison of Quarterly Expenditures for the Quarters Ended June 30, September 30 and December 31 of Fiscal Years 2020-21 and 2021-22 (in millions of dollars)
Text Description
Comparison of Quarterly Expenditures for the Quarters Ended June 30, September 30 and December 31 of Fiscal Years 2020-21 and 2021-22 (in millions of dollars)
Bar chart showing a comparison of quarterly expenditures for the quarters ended June 30, September 30 and December 31 of fiscal years 2020-21 and 2021-22 in millions of dollars.
2020-21 Expenditures for the quarter ended June 30 = 995; 2020-21 Expenditures for the quarter ended September 30 = 358; 2020-21 Expenditures for the quarter ended December 31 = 1,011; 2021-22 Expenditures for the quarter ended June 30 = 1,120; 2021-22 Expenditures for the quarter ended September 30 = 575; 2021-22 Expenditures for the quarter ended December 31 = 1,408.
Expenditures in the third quarter of fiscal year 2021-22 were $1,408 million compared with $1,011 million for the third quarter of 2020-21, representing an increase of $397 million or 39% in quarterly spending.
The increase in quarterly spending is primarily attributable to:
- $266.5 million increase in grants and contributions resulting from:
- $152.1 million increase in funding for Strengthening Canada's Home and Community Care and Mental Health and Addiction Initiative (Home Care and Mental Health) and Virtual Care Services Initiative; and,
- $109.3 million increase in contributions for the Safe Restart Agreement for federal investments in testing, contact tracing and data management (COVID-19), due to timing of payments;
- $72.5 million in advance payments for the procurement of rapid test kits (COVID-19);
- $24.4 million increase in personnel expenditures primarily due to increase in the number of personnel to address COVID-related initiatives and for continued growth in the Cannabis, Controlled Substances and Opioid Programs, annual salary increments for inflation and step increases, and one-time payments to employees related to Phoenix damage claims; and,
- $20.1 million increase in professional and special services including COVID-19 initiatives such as contact tracing, data collection and modelling, and supply chain support, and the purchase of software as a service for Microsoft M365 Licenses.
Risks and Uncertainties
Health Canada operates in a complex and dynamic environment, facing several challenges as it works to deliver results for Canadians. Many of these challenges – such as the COVID-19 pandemic and the opioid overdose crisis – are beyond the sole control of the Department and involve working collaboratively with federal partners, provinces and territories, Indigenous organizations, industry and international regulators.
As COVID-19 continues to challenge Canadians and health systems across the country, the Department has mobilized and leveraged all its resources to minimize the impacts of the pandemic on Canadians' health and safety. Health Canada has led a whole-of-government response to ensure a coordinated and multi-faceted effort to minimize serious illness and death; provided support for health care systems and at-risk populations; introduced agile and effective regulatory measures; provided critical information and innovative digital tools and services; and supported a national effort on COVID-19 testing, contact tracing and data management.
Health Canada recognizes that successfully fulfilling its mandate is directly related to effective management of risk. The Department has a well-established risk management process that enables the organization to be proactive and quickly respond to change and uncertainty, and has appropriate internal control systems in place, proportionate to the risks being managed.
The Department employs an integrated risk management framework and tools, and maintains a comprehensive and up-to-date Corporate Risk Profile, to support risk-based decision-making. Sound risk management can also lead to more effective service delivery, better project management, an increase in value for money, and ultimately better results for Canadians.
Health Canada manages risks and uncertainty through effective engagement across the organization with agile and sound governance structures, as well as long-term planning. The executive-level committee on Finance, Investment Planning and Transformation recommends overall direction for financial management and control, and ensures alignment of investments with departmental strategies and transformation initiatives.
As the pandemic continues to unfold, Health Canada will closely monitor departmental risks associated with COVID-19, as well as its environment and operations, ensure appropriate mitigation strategies are in place, and effectively deliver results.
Significant Changes in Relation to Operations, Personnel and Programs
Mr. Jean-Yves Duclos was appointed Minister of Health on October 26, 2021.
Ms. Carolyn Bennett was appointed Minister of Mental Health and Addictions and Associate Minister of Health on October 26, 2021.
There have been no other significant changes in relation to operations, personnel and programs during this quarter.
Approved by:
Original signed by Stephen Lucas
Stephen Lucas
Deputy Minister
Ottawa, Canada
Date: February 18, 2022
Original signed by Serena Francis
Serena Francis
Assistant Deputy Minister and Chief Financial Officer
Ottawa, Canada
Date: February 17, 2022
Statement of Authorities (unaudited)
| Authority | Total available for use for the year ending March 31, 2022Table 3 Footnote * |
Used during the quarter ended December 31, 2021 |
Year-to-date used at quarter-end |
|---|---|---|---|
| Vote 1 – Operating expenditures | 1,832,541 | 328,348 | 801,551 |
| Vote 5 – Capital expenditures | 20,272 | 3,623 | 4,667 |
| Vote 10 – Grants and contributions | 3,470,925 | 1,015,699 | 2,140,816 |
| (S) Contributions to employee benefit plans | 134,790 | 28,439 | 85,315 |
| (S) Minister of Health – Salary and motor car allowance | 90 | 38 | 83 |
| (S) Collection agency fees | 3 | 1 | 3 |
| (S) Spending of proceeds from the disposal of surplus Crown assets | 209 | - | - |
| (S) Spending of revenues pursuant to section 4.2 of the Department of Health Act | 70,773 | 31,962 | 70,773 |
| Total authorities | 5,529,603 | 1,408,110 | 3,103,208 |
(S) – Statutory Vote |
|||
| Authority | Total available for use for the year ending March 31, 2021Table 4 Footnote * |
Used during the quarter ended December 31, 2020 |
Year-to-date used at quarter-end |
|---|---|---|---|
| Vote 1 – Operating expenditures | 1,272,280 | 182,323 | 551,319 |
| Vote 5 – Capital expenditures | 21,307 | 4,860 | 5,801 |
| Vote 10 – Grants and contributions | 2,059,352 | 749,208 | 1,618,927 |
| (S) Contributions to employee benefit plans | 120,932 | 27,840 | 83,520 |
| (S) Minister of Health – Salary and motor car allowance | 89 | 22 | 67 |
| (S) Collection agency fees | 11 | 6 | 11 |
| (S) Payment pursuant to section 24(1) of the Financial Administration Act | 23 | 11 | 23 |
| (S) Spending of proceeds from the disposal of surplus Crown assets | 186 | - | - |
| (S) Spending of revenues pursuant to section 4.2 of the Department of Health Act | 51,463 | 27,305 | 53,452 |
| (S) Payments to support Canada's initial response to COVID-19 pursuant to the Public Health Events of National Concern Payments Act | 4,952 | 1,605 | 4,508 |
| (S) Payments for drugs, medical devices and virtual care pursuant to the Public Health Events of National Concern Payments Act | 151,928 | 6,941 | 34,977 |
| (S) Safe Restart Agreement | 18,500 | 2,052 | 2,052 |
| (S) Medical Research | 308,372 | 9,199 | 9,199 |
| Total authorities | 4,009,395 | 1,011,372 | 2,363,856 |
(S) – Statutory Vote |
|||
Departmental Budgetary Expenditures by Standard Object (unaudited)
| Standard Object | Planned expenditures for the year ending March 31, 2022 |
Expended during the quarter ended December 31, 2021 |
Year-to-date used at quarter-end |
|---|---|---|---|
| Expenditures: | |||
| Personnel | 1,058,739 | 242,424 | 720,045 |
| Transportation and communications | 23,138 | 2,782 | 6,388 |
| Information | 36,322 | 14,355 | 45,962 |
| Professional and special services | 327,594 | 84,240 | 182,002 |
| Rentals | 18,245 | 6,574 | 18,806 |
| Repair and maintenance | 29,005 | 8,882 | 13,544 |
| Utilities, materials and supplies | 720,229 | 80,185 | 104,540 |
| Acquisition of land, buildings and works | 3,056 | 51 | 447 |
| Acquisition of machinery and equipment | 27,409 | 9,343 | 15,358 |
| Transfer payments | 3,470,925 | 1,015,700 | 2,140,816 |
| Other subsidies and payments | 12,740 | 1,073 | 6,248 |
| Total gross budgetary expenditures | 5,727,402 | 1,465,609 | 3,254,156 |
| Less revenues netted against expenditures: | |||
| Rights and privileges | 45,064 | 26,656 | 33,340 |
| Services of a non-regulatory nature | 30,802 | 8,639 | 25,952 |
| Services of a regulatory nature | 116,234 | 22,204 | 91,656 |
| Other fees and charges | 5,699 | - | - |
| Total revenues netted against expenditures | 197,799 | 57,499 | 150,948 |
| Total net budgetary expenditures | 5,529,603 | 1,408,110 | 3,103,208 |
| Standard Object | Planned expenditures for the year ending March 31, 2021 |
Expended during the quarter ended December 31, 2020 |
Year-to-date used at quarter-end |
|---|---|---|---|
| Expenditures: | |||
| Personnel | 967,276 | 218,020 | 637,403 |
| Transportation and communications | 21,566 | 1,067 | 3,181 |
| Information | 28,022 | 10,333 | 29,022 |
| Professional and special services | 303,008 | 42,711 | 130,244 |
| Rentals | 16,516 | 5,942 | 11,928 |
| Repair and maintenance | 15,760 | 3,398 | 6,935 |
| Utilities, materials and supplies | 489,057 | 4,627 | 8,124 |
| Acquisition of land, buildings and works | 2,375 | 1,437 | 1,561 |
| Acquisition of machinery and equipment | 64,972 | 26,287 | 33,271 |
| Transfer payments | 2,259,352 | 749,219 | 1,618,950 |
| Other subsidies and payments | 10,334 | 1,255 | 6,258 |
| Total gross budgetary expenditures | 4,178,238 | 1,064,296 | 2,486,877 |
| Less revenues netted against expenditures: | |||
| Rights and privileges | 37,150 | 19,528 | 23,674 |
| Services of a non-regulatory nature | 30,896 | 7,055 | 21,779 |
| Services of a regulatory nature | 95,098 | 26,341 | 77,568 |
| Other fees and charges | 5,699 | - | - |
| Total revenues netted against expenditures | 168,843 | 52,924 | 123,021 |
| Total net budgetary expenditures | 4,009,395 | 1,011,372 | 2,363,856 |
Page details
- Date modified: