
Regulatory Directive DIR2010-05, Revisions to the Residue Chemistry Crop Field Trial Requirements
21 December 2010
ISSN: 1197-7396 (print version)
ISSN: 1498-5926 (PDF version)
Catalogue number: H113-3/2010-5E (print version)
Catalogue number: H113-3/2010-5E-PDF (PDF version)
Table of Contents
- 1.0 Purpose
- 2.0 Background
- 3.0 Crop Selection
- 4.0 Integration of Agricultural Data into Crop Field Trial Regions
- 5.0 Determination of the Number of Field Trials by Crop
- 6.0 Implementation Strategies
- Appendix I
- Appendix II
- Table 1.1 Minimum Number of Crop Field Trials and Treated Samples on Individual Crops, Crop Areas and Dietary Share
- Table 1.2 Number of Field Trials by Crop and Region
- Table 1.3 Area of Crops by Region (Hectares) - 2006 Census of Agriculture
- Table 1.4 Area of Crops by Region (Acres) - 2006 Census of Agriculture
1.0 Purpose
The purpose of this document is to communicate to industry and other interested parties revisions to the crop field trial requirements used by Health Canada's Pest Management Regulatory Agency (PMRA) to support the domestic registration of a pesticide on a crop. The revised crop field trial requirements will replace those currently specified in Section 9 of Regulatory Directive DIR98-02, Residue Chemistry Guidelines. The PMRA will adopt the revised trial requirements for studies conducted after January 2012.
2.0 Background
Supervised crop field trials are conducted to determine the amount and type of agricultural chemical left in/on the plant material as a result of the chemical's use. Data from these field trials are used to estimate the dietary exposure to agricultural chemicals and determine maximum residue limits (MRLs) for enforcement purposes.
The total number of crop field trials required for a given crop is determined by the total production area and the dietary share. The specific locations of the field trials are distributed according to the share of total crop area reported in each region (see Appendix I). The current supervised crop field trial requirements listed in DIR98-02 were based on production data from the 1991 Census of Agriculture and the 1995 Fruit and Vegetable Survey.
Updated crop production data were determined as part of the 2006 Census of Agriculture (CEAG). The PMRA, in collaboration with Statistics Canada, has revised the field trial requirements of the crops listed in DIR98-02. These revisions also expand the existing list of crops by adding new commodities.
3.0 Crop Selection
The crops listed in DIR98-02 represented crops with production areas greater than 250 ha according to the 1991 Census of Agriculture. Additional crops were included from the 1995 Fruit and Vegetable Survey, which represented production areas greater than 205 ha.
In addition, crops grown in greenhouses and growing houses (i.e. cucumbers, lettuce, mushrooms, peppers and tomatoes) were included.
Several new crops were identified in the 2006 CEAG, which are not listed in DIR98-02. These include: blackberries, borage, chickpeas, corn (pop), garlic, linola, peanuts, sweet cherries, tart cherries, walnuts and wild rice.
As these crops have significant production areas and/or are important contributors to the diet, these will be added to the revised crop field trial requirements.
4.0 Integration of Agricultural Data into Crop Field Trial Regions
When establishing the initial field trial requirements listed in DIR98-02, the Spatial Analysis and Geomatics Application (SAGA) section of the Agriculture Division of Statistics Canada used Census Consolidated Subdivision (CCS) level geography to distribute the agricultural data from the 1991 Census of Agriculture and 1995 Fruit and Vegetable Survey to appropriate field trial regions.
In contrast, the crop production data from the 2006 CEAG was extracted from unsuppressed crop acreage at the census geography dissemination area (DA) level. These dissemination areas (DAs) are the smallest geographic areas for which all census data are provided. Therefore, the use of DAs instead of CCS level geography results in a more accurate distribution of the agricultural data to appropriate field trial regions. In cases where the DAs fell outside the field trial regions, those within a 15-km range were assigned to the nearest field trial region.
As the field trial regions do not extend beyond the main agricultural areas, some farms within specific DAs located in the northern parts of the provinces fell outside the field trial regions. Given that the hectareage of these farms was low, the impact of these farms on the total production areas for each crop is considered minimal.
5.0 Determination of the Number of Field Trials by Crop
The number of crop field trials required for a given crop is determined based on production area and dietary share. The first step involves assigning a base number of field trials based on total production area, as indicated in Section 9 of DIR98-02 (see Table 1).
| Area in Hectares | Area in Acres | Base Number of Field Trials |
|---|---|---|
| > 4,046,860 | > 10,000,000 | 16 |
| > 404,690 ≤ 4,046,860 | > 1,000,000 ≤ 10,000,000 | 12 |
| > 121,410 ≤ 404,690 | > 300,000 ≤ 1,000,000 | 8 |
| > 12,140 ≤ 121,410 | >30,000 ≤ 300,000 | 5 |
| > 810 ≤ 12,140 | > 2000 ≤ 30,000 | 3 |
| > 81 ≤ 810 | > 200 ≤ 2000 | 2 |
| ≤ 81 | ≤ 200 | 1 |
The next steps involve increasing or decreasing the base number of trials, based on the dietary share of the crop.
Revised trial requirements for the commodities listed in DIR98-02 were determined based on the updated production figures from the 2006 CEAG, as well as updated dietary share information, where available. The residue trial requirements for >57% of the crops specified in DIR98-02 remain unchanged. Decreases in field trial requirements were noted in 19% of the crops, while increased field trial requirements were noted for <24% of the crops. The trial requirements for the new commodities identified in the 2006 Census of Agriculture were determined using the same criteria.
The number of field trials (Table 1.1, Appendix II) was distributed among the regions according to the share of crop area reported in each region in the 2006 CEAG. The number of field trials by crop and region is presented in Table 1.2 (Appendix II). The areas of crop by region on a hectareage basis and acreage basis are presented in Table 1.3 (hectares, Appendix II) and in Table 1.4 (acres, Appendix II), respectively.
6.0 Implementation Strategies
A phase-in period will be permitted to provide petitioners with the time necessary to conduct residue trials as per the revised requirements. Supervised crop residue trials initiated after January 1, 2012 should be in conformance with the new requirements specified herein. The PMRA will consider, on a case-by-case basis, a reduction in the number of trials or acceptance of trials conducted in different NAFTA zones to fulfill Canadian registration requirements, provided a sound, scientific rationale is submitted to the Agency.
Appendix I
North American Major and Minor Crop Field Trail Regions
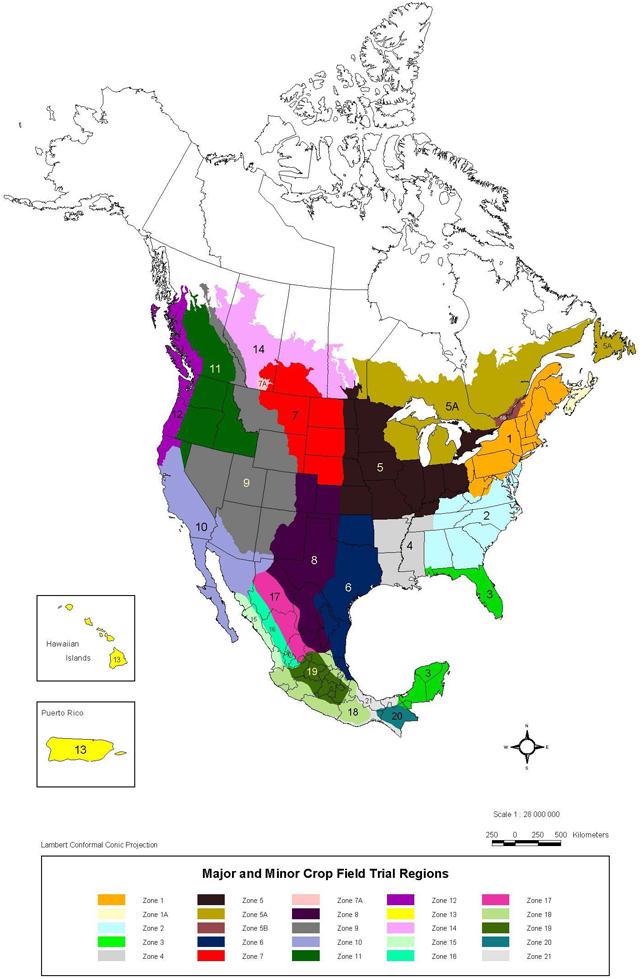
Text description
North American Field Trial Regions.
This map represents the North American Major and Minor Crop Field Trial Regions. The map illustrates the various zones throughout Canada, the United States (including the Hawaiian Islands), Mexico and Puerto Rico.
The map was produced by: Spatial and Geomatics Applications, Agriculture Division, Statistics Canada, February 2001.
The PMRA currently considers the following Zones equivalent: 5 = 5A = 5B and 1 = 1A. Provided that the total number of required trials within these zones is conducted, the applicant is free to choose the distribution of trials within these regions. The zone equivalency does not apply to Zones 7 and 7A.
Appendix II
| Crop | Area planted in 2006 (acres)Table 1.1 footnote 1 | Area planted in 2006 (hectares)Table 1.1 footnote 1 | Share of the diet (%)Table 1.1 footnote 2 | Minimum number of field trials | Minimum number of treated samples |
|---|---|---|---|---|---|
| Apples | 54,612 | 22,101 | 2.45117 | 12 | 24 |
| Apricots | 495 | 200 | 0.04148 | 3 | 6 |
| Asparagus | 5,199 | 2,104 | 0.01984 | 3 | 6 |
| Barley | 9,117,943 | 3,689,904 | 0.22185 | 12 | 24 |
| Beans, dry | 456,754 | 184,842 | 0.19479 | 8 | 16 |
| Beans, green or wax | 27,016 | 10,933 | 0.26333 | 5 | 10 |
| Beets, garden | 3,042 | 1,231 | 0.01443 | 3 | 6 |
| Beets, sugar | 48,156 | 19,488 | 0.52667 | 8 | 16 |
| Blackberries | 213 | 86 | 0.00721 | 2 | 8 |
| Blueberries | 126,775 | 51,304 | 0.02705 | 8 | 16 |
| Borage | 26,242 | 10,620 | 0.01999 | 3 | 6 |
| Broccoli | 11,093 | 4,489 | 0.1984 | 5 | 10 |
| Brussels sprouts | 1,386 | 561 | 0.00541 | 2 | 8 |
| Buckwheat | 32,567 | 13,179 | 0.0018 | 5 | 10 |
| Cabbage, Chinese | 2,864 | 1,159 | 0.01263 | 3 | 6 |
| Cabbage, green and red | 10,702 | 4,331 | 0.12445 | 5 | 10 |
| Canary seed | 338,595 | 137,025 | 0.01999 | 5 | 10 |
| Canola | 12,423,445 | 5,027,594 | 0.01263 | 12 | 24 |
| Caraway seed | 19,988 | 8,089 | 0.01999 | 3 | 6 |
| Carrots | 24,355 | 9,856 | 0.33368 | 5 | 10 |
| Cauliflower | 5,298 | 2,144 | 0.03427 | 5 | 10 |
| Celery | 2,243 | 908 | 0.10822 | 5 | 10 |
| Cherries, sweet | 4,250 | 1,720 | 0.0469 | 5 | 10 |
| Cherries, tart | 3,027 | 1,225 | 0.0469 | 5 | 10 |
| Chickpeas | 320,276 | 129,611 | 0.03066 | 5 | 10 |
| Corn, grain | 2,752,098 | 1,113,736 | 2.88224 | 16 | 32 |
| Corn, pop | x | x | 0.0487 | 3 | 6 |
| Corn, silage | 687,069 | 278,047 | 0.0999 | 5 | 10 |
| Corn, sweet | 74,698 | 30,229 | 0.33187 | 8 | 16 |
| Cranberries | 8,436 | 3,414 | 0.06493 | 5 | 10 |
| Cucumbers, field | 7,172 | 2,902 | 0.17135 | 5 | 10 |
| Filberts/hazelnuts | 921 | 373 | 0.01999 | 2 | 8 |
| Flaxseed | 1,996,549 | 807,975 | 0.01999 | 8 | 16 |
| Garlic | 759 | 307 | 0.01082 | 2 | 8 |
| Ginseng | 8,229 | 3,330 | 0.01999 | 3 | 6 |
| Grapes | 30,059 | 12,164 | 0.285 | 5 | 10 |
| Leeks | 611 | 247 | 0.01999 | 2 | 8 |
| Lentils | 1,289,773 | 521,953 | 0.00721 | 8 | 16 |
| Lettuce | 9,665 | 3,911 | 0.43107 | 5 | 10 |
| Linola | 17,164 | 6,946 | 0.01999 | 3 | 6 |
| Melons | 2,510 | 1,016 | 0.43288 | 5 | 10 |
| Millet, grain | 26,780 | 10,837 | 0.01999 | 3 | 6 |
| Mustard seed | 337,040 | 136,395 | 0.01999 | 5 | 10 |
| Nectarines | 676 | 273 | 0.03427 | 3 | 6 |
| Oats | 5,099,160 | 2,063,559 | 0.19479 | 12 | 24 |
| Onions, dry | 14,389 | 5,823 | 0.40041 | 5 | 10 |
| Parsnips | 547 | 221 | 0.01999 | 2 | 8 |
| Peaches | 9,395 | 3,802 | 0.20381 | 5 | 10 |
| Peanuts | x | x | 0.22185 | 3 | 6 |
| Pears | 3,671 | 1,486 | 0.17676 | 5 | 10 |
| Peas, dry | 3,123,953 | 1,264,220 | 0.01999 | 8 | 16 |
| Peas, green | 41,590 | 16,831 | 0.18398 | 8 | 16 |
| Peppers | 6,075 | 2,458 | 0.11904 | 5 | 10 |
| Plums and prunes | 1,855 | 751 | 0.07756 | 3 | 6 |
| Potatoes | 401,556 | 162,504 | 1.67379 | 16 | 32 |
| Radishes | 1,686 | 682 | 0.00541 | 2 | 8 |
| Raspberries | 8,982 | 3,635 | 0.00721 | 3 | 6 |
| Rhubarb | 518 | 210 | 0.0018 | 2 | 8 |
| Rutabagas and turnips | 4,712 | 1,907 | 0.01623 | 3 | 6 |
| Rye | 531,729 | 215,183 | 0.01082 | 5 | 10 |
| Safflower | x | x | 0.01999 | 3 | 6 |
| Saskatoons | 3,223 | 1,304 | 0.01999 | 3 | 6 |
| Shallots, green and seed onions | 2,491 | 1,008 | 0.01999 | 3 | 6 |
| Soybeans | 2,970,361 | 1,202,064 | 0.80263 | 16 | 32 |
| Spinach | 1,758 | 711 | 0.06313 | 3 | 6 |
| Squash, pumpkins and zucchini | 16,476 | 6,668 | 0.10642 | 5 | 10 |
| Strawberries | 12,860 | 5,204 | 0.12084 | 5 | 10 |
| Sunflowers | 211,034 | 85,403 | 0.00902 | 5 | 10 |
| Tame hay | 20,349,632 | 8,235,211 | 0.0999 | 12 | 24 |
| Tobacco | 31,920 | 12,918 | 0.01999 | 5 | 10 |
| Tomatoes, field | 22,264 | 9,010 | 3.83637 | 12 | 24 |
| Triticale | 152,923 | 61,886 | 0.01999 | 5 | 10 |
| Walnuts | 293 | 118 | 0.00721 | 2 | 8 |
| Wheat | 24,276,549 | 9,824,380 | 2.94897 | 20 | 40 |
| Wild rice | 30,965 | 12,531 | 0.01999 | 5 | 10 |
| Cucumbers, greenhouse | 672 | 272 | - | 4 | 2 |
| Lettuce, greenhouse | 39 | 16 | - | 4 | 2 |
| Mushrooms | 156 | 63 | - | 2 | 8 |
| Peppers, greenhouse | 659 | 267 | - | 4 | 2 |
| Tomatoes, greenhouse | 1,109 | 449 | - | 4 | 2 |
|
|||||
NOTE: Unsuppressed data was used by RSGA to calculate the number of crop field trials required by region. Due to confidentiality requirements of the Statistics Act, crop area data which do not satisfy confidentiality regulations of the Statistics Act are identified as "x".
| Crop | Region | ||||||||||
|---|---|---|---|---|---|---|---|---|---|---|---|
| 1 | 1A | 5 | 5A | 5B | 7 | 7A | 9 | 11 | 12 | 14 | |
| Apples | 1 | 2 | 4 | 3 | 2 | ||||||
| Apricots | 1 | 2 | |||||||||
| Asparagus | 2 | 1 | |||||||||
| Barley | 1 | 2 | 1 | 8 | |||||||
| Beans, dry | 3 | 3 | 1 | 1 | |||||||
| Beans, green or wax | 2 | 2 | 1 | ||||||||
| Beets, garden | 1 | 2 | |||||||||
| Beets, sugar | 2 | 6 | |||||||||
| Blackberries | 1 | 1 | |||||||||
| Blueberries | 1 | 3 | 3 | 1 | |||||||
| Borage | 3 | ||||||||||
| Broccoli | 2 | 2 | 1 | ||||||||
| Brussels sprouts | 1 | 1 | |||||||||
| Buckwheat | 2 | 1 | 2 | ||||||||
| Cabbage, Chinese | 2 | 1 | |||||||||
| Cabbage, green and red | 2 | 1 | 2 | ||||||||
| Canary seed | 4 | 1 | |||||||||
| Canola | 1 | 2 | 9 | ||||||||
| Caraway seed | 1 | 2 | |||||||||
| Carrots | 1 | 2 | 2 | ||||||||
| Cauliflower | 1 | 2 | 2 | ||||||||
| Celery | 2 | 3 | |||||||||
| Cherries, sweet | 1 | 1 | 3 | ||||||||
| Cherries, tart | 4 | 1 | |||||||||
| Chickpeas | 4 | 1 | |||||||||
| Corn, grain | 9 | 7 | |||||||||
| Corn, pop | 3 | ||||||||||
| Corn, silage | 1 | 2 | 1 | 1 | |||||||
| Corn, sweet | 4 | 3 | 1 | ||||||||
| Cranberries | 1 | 2 | 2 | ||||||||
| Cucumbers, field | 3 | 2 | |||||||||
| Filberts/hazelnuts | 2 | ||||||||||
| Flaxseed | 4 | 4 | |||||||||
| Garlic | 1 | 1 | |||||||||
| Ginseng | 3 | ||||||||||
| Grapes | 3 | 2 | |||||||||
| Leeks | 1 | 1 | |||||||||
| Lentils | 7 | 1 | |||||||||
| Lettuce | 1 | 4 | |||||||||
| Linola | 2 | 1 | |||||||||
| Melons | 3 | 2 | |||||||||
| Millet, grain | 1 | 1 | 1 | ||||||||
| Mustard seed | 4 | 1 | |||||||||
| Nectarines | 2 | 1 | |||||||||
| Oats | 1 | 1 | 2 | 8 | |||||||
| Onions, dry | 3 | 2 | |||||||||
| Parsnips | 1 | 1 | |||||||||
| Peaches | 4 | 1 | |||||||||
| Peanuts | 3 | ||||||||||
| Pears | 4 | 1 | |||||||||
| Peas, dry | 4 | 4 | |||||||||
| Peas, green | 4 | 3 | 1 | ||||||||
| Peppers | 3 | 2 | |||||||||
| Plums and prunes | 2 | 1 | |||||||||
| Potatoes | 3 | 4 | 3 | 1 | 1 | 2 | 2 | ||||
| Radishes | 1 | 1 | |||||||||
| Raspberries | 1 | 2 | |||||||||
| Rhubarb | 1 | 1 | |||||||||
| Rutabagas and turnips | 1 | 1 | 1 | ||||||||
| Rye | 1 | 2 | 2 | ||||||||
| Safflower | 1 | 1 | 1 | ||||||||
| Saskatoons | 1 | 2 | |||||||||
| Shallots, green and seed onions | 1 | 2 | |||||||||
| Soybeans | 13 | 3 | |||||||||
| Spinach | 2 | 1 | |||||||||
| Squash, pumpkins and zucchini | 3 | 1 | 1 | ||||||||
| Strawberries | 1 | 2 | 2 | ||||||||
| Sunflowers | 3 | 2 | |||||||||
| Tame hay | 1 | 1 | 1 | 1 | 2 | 6 | |||||
| Tobacco | 5 | ||||||||||
| Tomatoes, field | 11 | 1 | |||||||||
| Triticale | 2 | 1 | 2 | ||||||||
| Walnuts | 1 | 1 | |||||||||
| Wheat | 2 | 7 | 1 | 10 | |||||||
| Wild rice | 1 | 4 | |||||||||
| Cucumbers, greenhouseFootnote * | 2 | 2 | |||||||||
| Lettuce, greenhouseFootnote * | 2 | 2 | |||||||||
| MushroomsFootnote * | 1 | 1 | |||||||||
| Peppers, greenhouseFootnote * | 2 | 2 | |||||||||
| Tomatoes, greenhouseFootnote * | 2 | 2 | |||||||||
|
|||||||||||
| Crop | Region | ||||||||||
|---|---|---|---|---|---|---|---|---|---|---|---|
| 1 | 1A | 5 | 5A | 5B | 7 | 7A | 9 | 11 | 12 | 14 | |
| Apples | 1,038 | 2,522 | 7,845 | 151 | 6,002 | 17 | 0.3 | 71 | 4,165 | 233 | 56 |
| Apricots | x | x | 59 | x | 1 | - | - | 2 | 134 | 3 | x |
| Asparagus | 32 | 11 | 1,571 | 14 | 312 | X | x | x | 33 | 13 | 30 |
| Barley | 52,280 | 35,063 | 142,901 | 37,882 | 53,335 | 630,485 | 139,204 | 911 | 9,070 | 911 | 2,587,862 |
| Beans, dry | 269 | 106 | 133,519 | 173 | 8,268 | 114,138 | 32,371 | - | 4 | 1 | 25,604 |
| Beans, green or wax | 105 | 84 | 4,803 | 141 | 4,703 | 43 | 38 | 1 | 15 | 968 | 33 |
| Beets, garden | 51 | 40 | 440 | 57 | 513 | 9 | 2 | 1 | 15 | 75 | 27 |
| Beets, sugar | - | - | 3,751 | x | - | 602 | 14,560 | - | - | - | x |
| Blackberries | 4 | 4 | 10 | 1 | 9 | X | - | x | 9 | 44 | 3 |
| Blueberries | 9,413 | 19,684 | 243 | 16,614 | 565 | X | - | x | 38 | 4,736 | 10 |
| Borage | x | x | 206 | - | x | 81 | - | - | - | - | 10,318 |
| Broccoli | 39 | 381 | 1,623 | 59 | 1,904 | 3 | 2 | 0.3 | 10 | 451 | 19 |
| Brussels sprouts | 3 | 57 | 141 | 3 | 80 | 0.4 | x | x | 2 | 274 | 1 |
| Buckwheat | 751 | 199 | 3,827 | 607 | 1,994 | 580 | - | - | 8 | 74 | 5,140 |
| Cabbage, Chinese | 2 | 2 | 754 | 5 | 269 | X | x | - | 2 | 112 | 10 |
| Cabbage, green and red | 98 | 187 | 1,667 | 202 | 1,758 | 36 | 87 | 0.3 | 35 | 190 | 71 |
| Canary seed | x | - | 2,603 | x | 17 | 98,830 | - | - | - | - | 35,559 |
| Canola | 2,154 | 74 | 249,264 | 6,339 | 1,536 | 712,016 | 54,493 | 811 | 633 | 1,268 | 3,999,007 |
| Caraway seed | - | - | 772 | - | x | 2,048 | x | - | - | - | 5,221 |
| Carrots | 145 | 1,320 | 4,334 | 194 | 3,144 | 69 | 233 | 2 | 39 | 247 | 128 |
| Cauliflower | 20 | 236 | 952 | 46 | 728 | 4 | 26 | 0.2 | 8 | 76 | 47 |
| Celery | 2 | 1 | 309 | 2 | 566 | 1 | x | x | 2 | 9 | 1 |
| Cherries, sweet | 2 | 12 | 384 | 3 | 3 | X | x | 197 | 1,066 | 34 | 16 |
| Cherries, tart | 1 | 5 | 1,029 | 2 | 6 | 27 | 6 | 8 | 62 | 5 | 76 |
| Chickpeas | x | - | 159 | x | 171 | 109,294 | 13,215 | - | - | - | 6,742 |
| Corn, grain | 26,951 | 3,944 | 608,450 | 10,715 | 451,986 | 1,281 | 530 | x | x | 297 | 9,517 |
| Corn, pop | - | - | x | - | - | - | - | - | - | x | - |
| Corn, silage | 18,723 | 5,905 | 117,667 | 14,368 | 55,463 | 7,012 | 9,975 | 316 | 2,811 | 9,672 | 36,136 |
| Corn, sweet | 618 | 274 | 15,461 | 450 | 10,101 | 43 | 1,745 | 5 | 184 | 1,194 | 154 |
| Cranberries | 287 | 117 | 25 | 121 | 1,221 | - | - | - | 37 | 1,600 | 5 |
| Cucumbers, field | 40 | 44 | 1,691 | 38 | 885 | 21 | 5 | 2 | 28 | 93 | 57 |
| Filberts/hazelnuts | - | 2 | 19 | x | x | - | - | x | 15 | 322 | 2 |
| Flaxseed | 455 | 106 | 47,117 | 1,347 | 535 | 353,516 | 3,458 | - | x | x | 401,421 |
| Garlic | 10 | 5 | 156 | 16 | 41 | 2 | 0.1 | 4 | 40 | 26 | 9 |
| Ginseng | x | 2 | 2,889 | 5 | 6 | X | - | - | 393 | x | x |
| Grapes | 150 | 200 | 8,322 | 38 | 293 | X | - | 9 | 2,891 | 255 | x |
| Leeks | 2 | x | 71 | 4 | 165 | - | x | x | 1 | 2 | 0.1 |
| Lentils | - | - | 632 | x | x | 476,895 | 1,875 | - | x | x | 42,341 |
| Lettuce | 25 | 108 | 439 | 39 | 3,019 | 3 | 1 | 1 | 14 | 245 | 17 |
| Linola | - | x | x | x | - | 3,807 | - | - | - | - | 3,032 |
| Melons | 4 | x | 669 | 6 | 270 | 1 | x | x | x | 4 | 2 |
| Millet, grain | 135 | - | 3,921 | 108 | 569 | 2,036 | x | - | x | - | 4,003 |
| Mustard seed | 114 | - | 302 | x | x | 94,531 | 4,840 | - | - | - | 36,557 |
| Nectarines | - | - | 207 | - | - | - | - | x | 65 | x | - |
| Oats | 45,455 | 7,532 | 200,670 | 59,562 | 52,616 | 291,137 | 12,775 | 637 | 7,025 | 972 | 1,385,179 |
| Onions, dry | 15 | 248 | 3,086 | 24 | 1,934 | 6 | 382 | 2 | 52 | 53 | 23 |
| Parsnips | 3 | 21 | 115 | 4 | 47 | X | x | x | 2 | 15 | 1 |
| Peaches | - | 20 | 3,195 | x | x | - | - | 8 | 569 | 11 | x |
| Peanuts | - | - | x | - | - | - | - | - | x | - | - |
| Pears | 11 | 99 | 1,027 | 2 | 36 | - | - | 7 | 255 | 45 | 5 |
| Peas, dry | 367 | 38 | 4,307 | 738 | 913 | 648,119 | 45,569 | 8 | 156 | 151 | 563,854 |
| Peas, green | 85 | 29 | 8,704 | 35 | 5,540 | 16 | 1,298 | 1 | 56 | 682 | 386 |
| Peppers | 14 | 13 | 1,625 | 6 | 663 | 3 | 1 | 1 | 62 | 68 | 4 |
| Plums and prunes | 11 | 31 | 498 | 12 | 14 | 1 | - | 3 | 146 | 30 | 6 |
| Potatoes | 26,260 | 40,588 | 31,126 | 5,179 | 13,297 | 3,873 | 16,705 | 278 | 220 | 2,922 | 20,057 |
| Radishes | 4 | 3 | 166 | 7 | 386 | 7 | 34 | 0.2 | 5 | 58 | 13 |
| Raspberries | 216 | 78 | 394 | 190 | 580 | 16 | 3 | 3 | 48 | 1,978 | 130 |
| Rhubarb | 2 | 62 | 42 | 4 | 21 | 2 | x | x | 4 | 62 | 10 |
| Rutabagas and turnips | 155 | 303 | 748 | 186 | 383 | 2 | 21 | 0.2 | 5 | 59 | 45 |
| Rye | 1,423 | 2,554 | 33,684 | 606 | 2,457 | 68,128 | 2,662 | 52 | 804 | 534 | 102,280 |
| Safflower | - | - | x | - | - | X | x | - | - | - | x |
| Saskatoons | 3 | 3 | 123 | 5 | 4 | 172 | 36 | 4 | 10 | 10 | 935 |
| Shallots, green and seed onions | 7 | 8 | 401 | 19 | 494 | 3 | 21 | 0.4 | 7 | 39 | 11 |
| Soybeans | 12,027 | 5,548 | 919,282 | 8,154 | 240,996 | X | x | - | - | - | 14,731 |
| Spinach | 6 | 17 | 400 | 4 | 207 | 2 | 0.3 | 0.2 | 9 | 57 | 9 |
| Squash, pumpkins and zucchini | 282 | 255 | 3,563 | 148 | 1,619 | 60 | 125 | 5 | 86 | 487 | 38 |
| Strawberries | 511 | 443 | 1,484 | 380 | 1,711 | 33 | 4 | 10 | 54 | 371 | 204 |
| Sunflowers | 45 | 11 | 42,594 | 206 | 263 | 4,663 | 256 | - | 2 | 13 | 37,351 |
| Tame hay | 421,069 | 140,580 | 887,509 | 436,285 | 484,688 | 1,111,126 | 104,964 | 20,873 | 185,566 | 43,624 | 4,398,927 |
| Tobacco | - | x | 12,812 | - | x | - | - | - | - | - | - |
| Tomatoes, field | 54 | 22 | 8,134 | 53 | 589 | 8 | 2 | 3 | 85 | 36 | 24 |
| Triticale | 114 | 28 | 1,109 | 177 | 394 | 27,025 | 6,171 | - | 401 | 11 | 26,457 |
| Walnuts | x | 1 | 65 | x | 3 | - | - | 0.3 | 22 | 23 | - |
| Wheat | 10,732 | x | 864,330 | x | 60,945 | 3,358,954 | 440,298 | 622 | x | x | 5,048,821 |
| Wild rice | - | x | x | 2,724 | - | X | - | - | - | - | 9,254 |
| Cucumbers, greenhouse | - | - | - | - | - | - | - | - | - | - | - |
| Lettuce, greenhouse | - | - | - | - | - | - | - | - | - | - | - |
| Mushrooms | 0.4 | 1 | 30 | 1 | 4 | X | - | - | x | 22 | 5 |
| Peppers, greenhouse | - | - | - | - | - | - | - | - | - | - | - |
| Tomatoes, greenhouse | - | - | - | - | - | - | - | - | - | - | - |
| Greenhouse vegetables | 26 | 8 | 641 | 13 | 71 | 26 | 8 | 0.3 | 7 | 245 | 12 |
NOTE: Unsuppressed data was used by RSGA to calculate the number of crop field trials required by region. Due to confidentiality requirements of the Statistics Act, crop area data which do not satisfy confidentiality regulations of the Statistics Act are identified as "x".
| Crop | Region | ||||||||||
|---|---|---|---|---|---|---|---|---|---|---|---|
| 1 | 1A | 5 | 5A | 5B | 7 | 7A | 9 | 11 | 12 | 14 | |
| Apples | 2,564 | 6,231 | 19,385 | 373 | 14,832 | 42 | 1 | 176 | 10,292 | 576 | 139 |
| Apricots | x | x | 146 | x | 2 | - | - | 4 | 330 | 7 | x |
| Asparagus | 79 | 28 | 3,883 | 36 | 770 | X | x | x | 82 | 32 | 75 |
| Barley | 129,186 | 86,642 | 353,116 | 93,609 | 131,794 | 1,557,961 | 343,981 | 2,251 | 22,412 | 2,251 | 6,394,740 |
| Beans, dry | 665 | 261 | 329,933 | 428 | 20,430 | 282,040 | 79,991 | - | 10 | 3 | 63,269 |
| Beans, green or wax | 259 | 207 | 11,868 | 349 | 11,621 | 106 | 93 | 3 | 37 | 2,392 | 80 |
| Beets, garden | 127 | 99 | 1,087 | 141 | 1,268 | 22 | 6 | 3 | 37 | 186 | 66 |
| Beets, sugar | - | - | 9,268 | x | - | 1.487 | 35,979 | - | - | - | x |
| Blackberries | 11 | 10 | 26 | 1 | 23 | X | - | x | 23 | 109 | 8 |
| Blueberries | 23,260 | 48,640 | 601 | 41,055 | 1,396 | X | - | x | 93 | 11,703 | 25 |
| Borage | x | x | 509 | - | x | 200 | - | - | - | - | 25,497 |
| Broccoli | 95 | 940 | 4,010 | 145 | 4,705 | 8 | 4 | 1 | 24 | 1,116 | 47 |
| Brussels sprouts | 7 | 141 | 349 | 7 | 198 | 1 | x | x | 4 | 676 | 3 |
| Buckwheat | 1,855 | 492 | 9,456 | 1,501 | 4,928 | 1,432 | - | - | 20 | 183 | 12,700 |
| Cabbage, Chinese | 5 | 5 | 1,864 | 11 | 664 | X | x | - | 5 | 277 | 25 |
| Cabbage, green and red | 241 | 462 | 4,119 | 499 | 4,345 | 88 | 214 | 1 | 87 | 470 | 176 |
| Canary seed | x | - | 6,432 | x | 42 | 244,215 | - | - | - | - | 87,869 |
| Canola | 5,323 | 183 | 615,943 | 15,665 | 3,796 | 1,759,429 | 134,656 | 2,003 | 1,563 | 3,132 | 9,881,752 |
| Caraway seed | - | - | 1,907 | - | x | 5,060 | x | - | - | - | 12,901 |
| Carrots | 359 | 3,262 | 10,710 | 480 | 7,768 | 172 | 576 | 6 | 97 | 610 | 317 |
| Cauliflower | 50 | 584 | 2,353 | 113 | 1,800 | 9 | 63 | 1 | 20 | 189 | 116 |
| Celery | 5 | 2 | 764 | 4 | 1,398 | 2 | x | x | 4 | 21 | 3 |
| Cherries, sweet | 4 | 29 | 948 | 7 | 8 | X | x | 488 | 2,633 | 83 | 39 |
| Cherries, tart | 2 | 11 | 2,542 | 4 | 14 | 67 | 14 | 21 | 153 | 12 | 188 |
| Chickpeas | x | - | 394 | x | 423 | 270,070 | 32,654 | - | - | - | 16,660 |
| Corn, grain | 66,598 | 9,746 | 1,503,511 | 26,476 | 1,116,880 | 3,166 | 1,309 | x | x | 734 | 23,517 |
| Corn, pop | - | - | x | - | - | - | - | - | - | x | - |
| Corn, silage | 46,265 | 14,592 | 290,761 | 35,505 | 137,052 | 17,326 | 24,648 | 780 | 6,946 | 23,900 | 89,294 |
| Corn, sweet | 1,527 | 676 | 38,204 | 1,113 | 24,959 | 107 | 4,313 | 12 | 455 | 2,950 | 382 |
| Cranberries | 710 | 289 | 62 | 298 | 3,018 | - | - | - | 91 | 3,954 | 13 |
| Cucumbers, field | 98 | 110 | 4,178 | 93 | 2,188 | 51 | 12 | 4 | 68 | 230 | 140 |
| Filberts/hazelnuts | - | 4 | 47 | x | x | - | - | x | 38 | 797 | 5 |
| Flaxseed | 1,123 | 263 | 116,428 | 3,329 | 1,323 | 873,557 | 8,546 | - | x | x | 991,932 |
| Garlic | 24 | 11 | 384 | 39 | 102 | 4 | 0.3 | 9 | 98 | 64 | 23 |
| Ginseng | x | 4 | 7,139 | 12 | 14 | X | - | - | 971 | x | x |
| Grapes | 371 | 494 | 20,563 | 94 | 724 | X | - | 23 | 7,144 | 630 | x |
| Leeks | 5 | x | 176 | 10 | 408 | - | x | x | 2 | 6 | 0.3 |
| Lentils | - | - | 1,561 | x | x | 1,178,432 | 4,633 | - | x | x | 104,626 |
| Lettuce | 62 | 266 | 1,086 | 97 | 7,460 | 8 | 3 | 2 | 34 | 606 | 42 |
| Linola | - | x | x | x | - | 9,407 | - | - | - | - | 7,493 |
| Melons | 10 | x | 1,654 | 15 | 668 | 2 | x | x | x | 9 | 4 |
| Millet, grain | 333 | - | 9,688 | 266 | 1,406 | 5,031 | x | - | x | - | 9,891 |
| Mustard seed | 282 | - | 746 | x | x | 233,591 | 11,961 | - | - | - | 90,335 |
| Nectarines | - | - | 511 | - | - | - | - | x | 160 | x | - |
| Oats | 112,322 | 18,611 | 495,865 | 147,181 | 130,017 | 719,414 | 31,567 | 1,573 | 17,359 | 2,402 | 3,422,849 |
| Onions, dry | 36 | 612 | 7,626 | 58 | 4,779 | 14 | 943 | 4 | 129 | 131 | 56 |
| Parsnips | 7 | 52 | 285 | 9 | 117 | X | x | x | 4 | 36 | 2 |
| Peaches | - | 48 | 7,894 | x | x | - | - | 19 | 1,406 | 27 | x |
| Peanuts | - | - | x | - | - | - | - | - | x | - | - |
| Pears | 28 | 243 | 2,537 | 4 | 90 | - | - | 17 | 629 | 111 | 12 |
| Peas, dry | 907 | 95 | 10,642 | 1,824 | 2,257 | 1,601,535 | 112,604 | 19 | 385 | 373 | 1,393,312 |
| Peas, green | 209 | 71 | 21,508 | 87 | 13,689 | 39 | 3,207 | 3 | 138 | 1,685 | 955 |
| Peppers | 34 | 32 | 4,016 | 14 | 1,638 | 6 | 3 | 3 | 152 | 168 | 9 |
| Plums and prunes | 27 | 77 | 1,231 | 29 | 34 | 2 | - | 8 | 362 | 74 | 14 |
| Potatoes | 64,889 | 100,294 | 76,913 | 12,797 | 32,858 | 9,570 | 41,279 | 688 | 543 | 7,221 | 54,504 |
| Radishes | 10 | 7 | 410 | 17 | 954 | 17 | 84 | 0.4 | 12 | 143 | 32 |
| Raspberries | 533 | 193 | 973 | 470 | 1,433 | 39 | 9 | 8 | 117 | 4,887 | 321 |
| Rhubarb | 5 | 153 | 104 | 10 | 51 | 4 | x | x | 11 | 154 | 24 |
| Rutabagas and turnips | 383 | 748 | 1,849 | 460 | 947 | 5 | 51 | 1 | 12 | 146 | 112 |
| Rye | 3,515 | 6,310 | 83,236 | 1,497 | 6,072 | 168,347 | 6,578 | 129 | 1,987 | 1,319 | 252,739 |
| Safflower | - | - | x | - | - | X | x | - | - | - | x |
| Saskatoons | 8 | 8 | 303 | 12 | 11 | 424 | 88 | 10 | 26 | 24 | 2,310 |
| Shallots, green and seed onions | 17 | 19 | 991 | 46 | 1,220 | 7 | 52 | 1 | 16 | 97 | 26 |
| Soybeans | 29,719 | 13,710 | 2,271,592 | 20,148 | 595,514 | X | x | - | - | - | 36,401 |
| Spinach | 15 | 41 | 989 | 10 | 512 | 5 | 1 | 0.4 | 22 | 141 | 22 |
| Squash, pumpkins and zucchini | 696 | 629 | 8,804 | 366 | 4,001 | 148 | 308 | 12 | 214 | 1,203 | 94 |
| Strawberries | 1,264 | 1,094 | 3,667 | 939 | 4,228 | 80 | 10 | 24 | 133 | 917 | 504 |
| Sunflowers | 111 | 26 | 105,251 | 509 | 650 | 11,522 | 633 | - | 5 | 32 | 92,295 |
| Tame hay | 1,040,483 | 347,381 | 2,193,080 | 1,078,083 | 1,197,688 | 2,745,650 | 259,372 | 51,579 | 458,544 | 107,797 | 10,869,975 |
| Tobacco | - | x | 31,660 | - | x | - | - | - | - | - | - |
| Tomatoes, field | 133 | 54 | 20,099 | 130 | 1,455 | 20 | 5 | 8 | 210 | 90 | 60 |
| Triticale | 281 | 68 | 2,740 | 437 | 973 | 66,780 | 15,249 | - | 992 | 27 | 65,376 |
| Walnuts | x | 4 | 160 | x | 7 | - | - | 1 | 54 | 58 | - |
| Wheat | 26,520 | x | 2,135,805 | x | 150,599 | 8,300,148 | 1,088,000 | 1,536 | x | x | 12,475,898 |
| Wild rice | - | x | x | 6,731 | - | X | - | - | - | - | 22,868 |
| Cucumbers, greenhouse | - | - | - | - | - | - | - | - | - | - | - |
| Lettuce, greenhouse | - | - | - | - | - | - | - | - | - | - | - |
| Mushrooms | 1 | 2 | 74 | 1 | 11 | X | - | - | x | 55 | 11 |
| Peppers, greenhouse | - | - | - | - | - | - | - | - | - | - | - |
| Tomatoes, greenhouse | - | - | - | - | - | - | - | - | - | - | - |
| Greenhouse vegetables | 63 | 19 | 1,583 | 33 | 176 | 65 | 20 | 1 | 17 | 606 | 30 |
NOTE: Unsuppressed data was used by RSGA to calculate the number of crop field trials required by region. Due to confidentiality requirements of the Statistics Act, crop area data which do not satisfy confidentiality regulations of the Statistics Act are identified as "x".