
Sodium Reduction in Processed Foods in Canada: An Evaluation of Progress toward Voluntary Targets from 2012 to 2016
Download the alternative format
(PDF format, 999 KB, 51 pages)
Organization: Health Canada
Type: Report
Published: 2018-01-15
Table of Contents
- Executive Summary: Sodium Reduction in Processed Foods in Canada
- Background
- Methods
- Results
- Discussion and Next Steps
- Appendix A: Baseline levels, reduction targets, and 2017 evaluation results
- Appendix B: Summary of sodium levels compared to sodium reduction targets
- Appendix C: Food categories in which sodium increased since baseline
- Appendix D: Summary of sodium levels compared to Maximum Levels
- References
Executive Summary: Sodium Reduction in Processed Foods in Canada
What is the issue?
Excess sodium (salt) in the diet causes high blood pressure, an important risk factor for heart disease and stroke. Heart disease and stroke are the leading cause of death in Canada, after cancer.
Canadians of all ages consume too much sodium. A major source of sodium in the diet is processed food. A cost-effective way to lower sodium intake is to reduce the amount of sodium in processed foods.
What is Health Canada doing?
Quick Facts
- 25% of Canadians live with high blood pressure
- 80% of Canadians consume too much sodium
- 93% of kids aged 4 to 8 years consume too much sodium
- 77% of sodium in Canadians' diet comes from processed food
In 2012, Health Canada published voluntary targets for reducing sodium in processed food by the end of 2016. The targets were developed through consultation with the food industry, health sector and research experts. The targets were designed to encourage gradual reductions, while still maintaining food safety, quality, and consumer acceptance.
In 2017, Health Canada evaluated the food industry's efforts to meet the sodium reduction targets. Figure 1 summarizes the results of this evaluation. Only 14% of food categories met the targeted reduction. In total, 48% did not make any meaningful progress toward sodium reduction; in fact, among the 48%, the sodium levels in several categories increased. In terms of the saltiest products on the market, only 30% lowered sodium content to levels similar to other foods in the same category.
Figure 1. Results of 2017 Evaluation of Sodium Reduction in Processed Foods
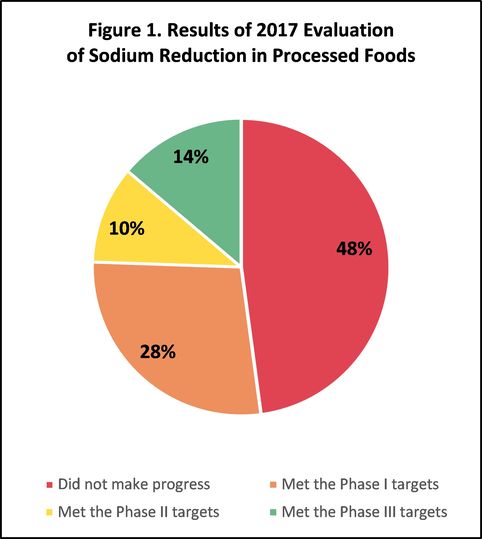
Figure 1. Results of 2017 Evaluation of Sodium Reduction in Processed Foods - Text Description
The figure shows the percentage of food categories that met the phase I, phase II and phase III sodium reduction targets:
- 48% of food categories did not make progress
- 28% of food categories met the Phase I targets
- 10% of food categories met the Phase II targets
- 14% of food categories met the Phase III target
What do these results mean?
The reduction of sodium in processed foods was much lower than anticipated. For most food categories, manufacturers did not do enough to reduce the sodium levels in the foods that they sell to Canadians.
What more can be done?
Stronger efforts are needed to achieve sodium reduction in Canada. Further actions could include an ongoing monitoring program and public commitments by manufacturers to reduce sodium. The Healthy Eating Strategy includes robust sodium reduction initiatives, such as front-of-package nutrition labelling and restrictions on marketing to children. Together, these actions will encourage the changes needed to address the high rates of chronic disease in Canada.
Background
Sodium and health
Approximately 25% of Canadians aged 20 years and older have been diagnosed with high blood pressure.Footnote 1 Many Canadians have high blood pressure without realizing it. It develops slowly over time and has no obvious symptoms. It cannot be cured, but it can be controlled with lifestyle changes like consuming a lower sodium diet, and if needed, medication. High blood pressure is an important risk factor for chronic diseases, such as heart disease and stroke. These diseases are the second and third leading causes of death in Canada, accounting for 25% of all deaths.Footnote 2
Excess sodium intake is strongly linked to high blood pressure.Footnote 3 Member states of the World Health Organization, including Canada, have agreed to work towards reducing global sodium intakes by 2025.Footnote 4 The World Health Organization has identified reducing sodium intake as one of the most cost-effective measures that countries can take to reduce chronic disease.
Canadians' sodium intake
Nutrient recommendations are established by Canadian and American scientists through a review process overseen by the U.S. National Academies of Science. The sodium recommendation for good health is 1500 milligrams per day.Footnote 3 In healthy populations, negative health effects increase at 2300 milligrams.
About 80% of Canadians consume more than 2300 milligrams of sodium each day.Footnote 5 The rates of high sodium intakes for children and youth are even higher. Among kids aged 4 to 8 years, the rate of excess intake is 93% and among teenaged boys, it is 97%. In fact, the average sodium intake of Canadians is 3400 mg of sodium per day.Footnote 6
Over the years, Canadian's food purchases have shifted from staple foods, used to prepare meals at home, to ready-to-eat processed foods.Footnote 7 In Canada, processed food is the main contributor to excess intake, accounting for 77% of dietary sodium.Footnote 6
Sodium reduction in Canada
"The Working Group recommends that Health Canada continue to work with the food industry to establish voluntary sodium reduction targets for food categories"
Sodium Working Group
Recommendation 1-1
In 2007, the Minister of Health established a Sodium Working Group to develop a strategy for reducing sodium intake in Canada. In 2010, the Working Group published their recommendations for sodium reduction.Footnote 6 The strategy included recommendations directed at various levels of government, non-governmental organizations, consumers, the food industry, and other relevant stakeholders. The recommendations focused on four areas:
- sodium levels in the food supply;
- education and awareness of consumers, industry, health professionals and others;
- research related to sodium reduction; and
- monitoring and evaluation.
Health Canada's actions to date
Education and awareness
Since 2010, Health Canada has taken several actions to help reduce Canadians' sodium intake. In the area of education and awareness, Health Canada partnered with the food industry to develop the Nutrition Facts Education Campaign. The purpose of this campaign was to help consumers make more informed food choices using the Nutrition Facts table.
As a part of the Eat Well Campaign, Health Canada included messages to help Canadians understand the health effects of sodium and to help parents choose lower sodium foods at the grocery store and when eating out.
Sodium in the food supply
An example: cottage cheese
- In 2009 and 2010, Health Canada sampled 33 cottage cheese labels
- The baseline sodium content for the cottage cheese category was collected from the labels:
Sodium level Sodium mg per 100 g Lowest 12 Average 375 75% highest 408 Highest 480 - The Phase III Target of 280 mg, to be met by December 31, 2016 was set by subtracting 25% from the average
- The Phase I Target of 350 mg was set at a level that would encourage a first step toward the Phase III target
- The Phase II Target of 330 mg was set to encourage further progress toward the Phase III Target
- The Maximum Level of 410 mg was set at the 75th percentile, rounded to the nearest tenth
In December 2016, Health Canada introduced updates to nutrition labelling regulations as part of the Healthy Eating Strategy. These updates included standardizing serving sizes to help consumers compare the Nutrition Facts table of similar products and other changes to help make the table easier to use.
To address concerns about slow approval times for sodium alternatives, Health Canada improved the efficiency of the approval process for lower sodium food additives. The use of new regulatory tools for food additives allow for more efficient approvals, once the scientific review is completed.
In 2012, Health Canada published its Guidance for the Food Industry on Reducing Sodium in Processed Foods.Footnote 8 This report asked the food industry to reduce sodium to targeted levels by the end of 2016. The goal of the targets was to lower sodium intakes from 3400 milligrams per day to under 2300 milligrams without requiring Canadians to make the effort to choose lower sodium foods. To achieve this, data modelling indicated that the targets would need to be ambitious.
Between 2009 and 2012, Health Canada consulted extensively with stakeholders, particularly the food industry, as well as the health sector and academic experts to develop the targets. Meetings with industry associations, individual companies, and food science experts focused on the feasibility of the targets. Before finalizing the targets, Health Canada took care to understand the role of sodium in the food, with a particular focus on avoiding potential technological and food safety issues. With these considerations in mind, Health Canada set the targets at levels that would move Canadians' intake as close as possible to 2300 milligrams per day. However, to bring intakes under the 2300-milligram level, Canadians would need to make an effort to choose lower sodium foods.
Based on consultation feedback, two types of reduction levels were set: "Phase III Targets" and "Maximum Levels". Interim targets, known as "Phase I Targets" and "Phase II Targets", were developed to encourage gradual reductions that would maintain consumer acceptance.
Details on the methods used to set these levels are provided in the 2012 guidance.Footnote 8 Briefly, Phase III Targets were set as sales weighted averages. This type of average is calculated by giving popular foods more weight in the calculation. The purpose of this approach is to encourage manufacturers to focus their sodium reduction efforts on the most popular brands in each category.
For most categories, the Phase III Targets were set at levels that would achieve a 25-30% reduction in the average. For example, the target reductions for cottage cheese, bacon bits, and ready-to-eat breakfast cereals were 25%, 28% and 36%.
In a few cases, the targeted reductions were different. For example, in the case of cheese, feedback from stakeholders and scientific review indicated that sodium plays an important role in certain cheeses, such as aged cheddar. Therefore, the reduction for this category was set at a lower target of 7%. In the case of canned vegetables, Health Canada learned that sodium is mostly added for taste. Therefore, the reduction target was much higher, at 60%.
Maximum Levels were developed to encourage manufacturers to reduce the sodium added to the saltiest foods in each category. The range of sodium content across each food category was examined and the Maximum Level was generally set at the level below which 75% of foods fell.
In 2017, Health Canada collected data on sodium levels to evaluate manufacturers' progress toward the Phase III Targets and Maximum Levels. This report describes the results of Health Canada's evaluation. This evaluation approach is consistent with the approach taken by other countries with voluntary reduction strategies.
Methods
Sales data were used to design a food label sampling plan to collect a representative number of foods from each of the 94 categories. About 10,500 products were sampled between February and June of 2017.
Sodium information from the Nutrition Facts tables was converted to milligrams of sodium per 100 grams. This information was combined with sales volume data to determine the levels of sodium in each food category. This data was compared to the two different types of reduction levels established by Health Canada – Phase III Targets and Maximum Levels.
Phase I, II, and III Targets
Average sodium levels in each food category were compared to the baseline averages, Phase I, Phase II, and Phase III Targets. Food categories that met the final target were considered successful. If the Phase I or II Targets were met, the category was considered to have partially met the sodium reduction goal. If the Phase I Target was not met, the food category was considered to have not made meaningful progress.
Maximum Levels
The proportion of foods in each category that exceeded the Maximum Level was assessed. Categories in which at least 90% of the products were below the Maximum Level were considered to have successfully met the Maximum Level.
Results
Phase I, II, and III Targets
Appendix A to this report provides a comparison of the sodium levels to the reduction targets for each of the 94 food categories. These data are summarized in Figure 2 and the tables in Appendix B.
The overall reduction of sodium in processed foods was lower than anticipated at the outset of this initiative. Only 13 food categories (14%) met the Phase III Targets for sodium reduction (Appendix B, Table 1). Ten categories met the interim Phase II Target (Appendix B, Table 2) and 26 met the Phase I Target (Appendix B, Table 3). For example, ready-to-eat breakfast cereals reduced sodium by 29%, which met the Phase II target but not the Phase III target of 36%. If manufacturers continue to make efforts to reduce sodium in ready-to-eat breakfast cereals and other foods like canned vegetables, crackers, breads, soups, bacon, and cheeses, the Phase III targets will be reached.
In total, 45 categories did not make any meaningful progress toward sodium reduction (Appendix B, Table 4); in fact, among the 45 there were 6 categories in which sodium levels increased compared to baseline values (Appendix C).
Figure 2. Percentage of food categories that met the targets for sodium reduction
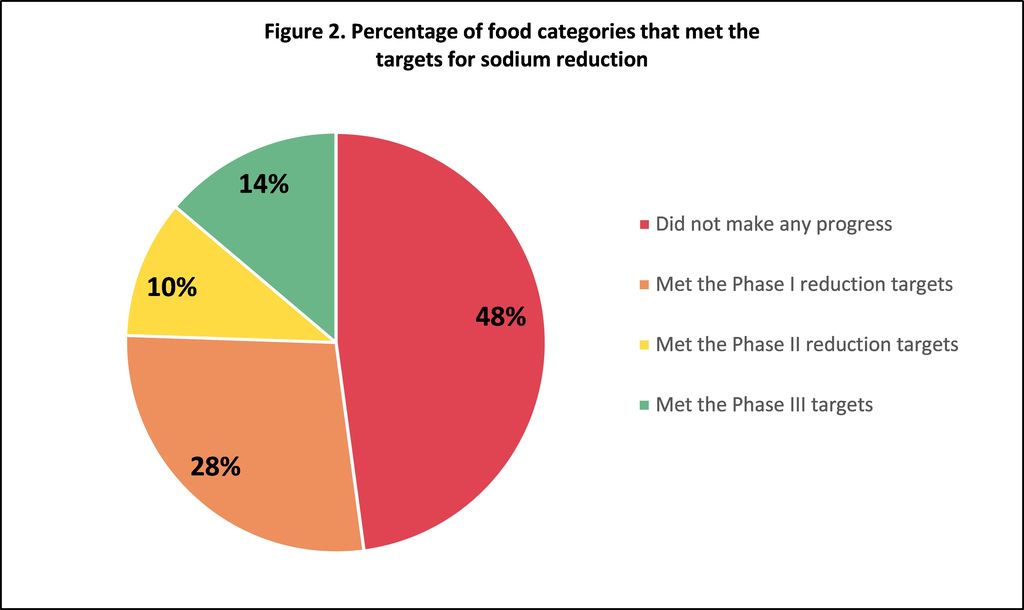
Figure 2. Percentage of food categories that met the targets for sodium reduction - Text Description
The figure shows the percentage of food categories that met the phase I, phase II and phase III sodium reduction targets:
- 48% of food categories did not make any progress
- 28% of food categories met the Phase I reduction targets
- 10% of food categories met the Phase II reduction targets
- 14% of food categories met the Phase III targets
Maximum levels
Only 28 food categories (30%) brought the sodium level in their saltiest foods to below the Maximum Level (Appendix D).
Discussion and Next Steps
"The Working Group recommends that Health Canada improve the current nutrition labelling system in Canada to facilitate consumer understanding and use, particularly as it relates to sodium."
Sodium Working Group
Recommendation 1-7
"The Working Group recommends that federal, provincial and territorial governments continue to explore options to reduce the exposure of children to marketing for foods that are high in sodium."
Sodium Working Group
Recommendation 2-5
The results of this evaluation show that sodium reductions in most categories of processed foods were only modest. However, even a modest reduction in the food supply will help contribute to lower sodium intakes among Canadians.
The limited success of the voluntary targets demonstrates that stronger efforts are needed to reduce sodium. A more structured voluntary approach would increase the likelihood of success. Further options include a regular sodium-monitoring program and public reduction commitments by manufacturers.
To help reduce intakes of Canadians towards 2300 milligrams, Health Canada set ambitious targets. In the months following the publication of this evaluation, Health Canada will conduct an in-depth analysis of each category and will meet with industry stakeholders and scientific experts to better understand the challenges encountered as part of their efforts to reduce sodium. Areas that will be considered include: food safety needs and shelf life concerns; technological or functional issues related to reducing sodium in commercial settings; consumer acceptance experiences; and issues related to the categorization of foods. Health Canada will also review the experience of other jurisdictions with similar approaches such as the United Kingdom, the United States, Brazil, Chile, and South Africa to learn from their experiences. Additionally, Health Canada will update the sodium intake estimates for Canadians using data from the 2015 Canadian Community Health Survey.
Health Canada is committed to working collaboratively with stakeholders to revisit the full scope of recommendations initially made by the Sodium Working Group and identify options that would further strengthen and support the food industry's efforts to reduce sodium. Furthermore, the robust sodium initiatives outlined in the Healthy Eating Strategy have the potential to create meaningful change and address the high rates of chronic disease in Canada.
Health Canada is planning to propose a regulatory approach that would require a symbol on the front of packaged foods that are high in sodium, sugars, and/or saturated fat. One objective of this approach is to help consumers quickly and easily identify foods that are high in sodium. In addition, it may encourage manufacturers of foods in some of the categories to reformulate their products to contain less sodium and thus avoid the requirement to display the symbol. In parallel, Health Canada has proposed to introduce regulations to restrict the marketing of unhealthy food and beverages to children less than 13 years of age. The definition of "unhealthy" will take the sodium content of foods into account.
The results of this evaluation come at a critical time. The Government of Canada made an unprecedented commitment to confronting the problem of chronic disease. This report confirms that Health Canada, the food industry, the health sector, and research experts must take a collaborative, ambitious role to improve the health of Canadians.
Appendix A: Baseline levels, reduction targets, and 2017 evaluation results
| Food Category | Food Category Description | BASELINE LEVEL
(Sales-Weighted Average) mg sodium per 100 g |
PHASE I INTERIM TARGET
(Sales-Weighted Average) mg sodium per 100 g |
PHASE II INTERIM TARGET
(Sales-Weighted Average) mg sodium per 100 g |
PHASE III TARGET
(Sales-Weighted Average) mg sodium per 100 g |
2017 RESULTS | |
|---|---|---|---|---|---|---|---|
| Measured level
(Sales-Weighted Average) mg sodium per 100 g |
Progress relative to targets | ||||||
| 1. Bakery products (Levels also apply to gluten free products) |
|||||||
| 1a. English muffins and raisin bread | White or whole grain English muffins, crumpets, and raisin bread. | 373 | 340 | 300 | 260 | 317 | Met the Phase I interim target |
| 1b. Pantry bread and rolls, bagels, croissants, and flatbreads | Prepackaged white or whole grain sliced breads, bagels, croissants (includes frozen doughs as consumed), flatbreads (pita, Greek flatbread), pizza crusts, diet or low calorie breads, and pantry rolls and buns. Also includes par-baked bread and rolls. | 469 | 430 | 380 | 330 | 424 | Met the Phase I interim target |
| 1c. Hearth bread | Bread baked directly on the hearth or in a pan without sides for crispier crusts e.g. baguettes, crusted bread, artisan breads, rye bread, pumpernickel bread, and garlic bread. Includes breads with and without additions e.g. olives, onion and cheese. Also includes bread mixes and frozen dough as consumed. | 531 | 520 | 490 | 470 | 511 | Met the Phase I interim target |
| 1d. Tortillas, wraps, and naan | Refrigerated and shelf stable plain or flavoured tortillas, wraps or naan. Excludes pita (see 1b). | 698 | 650 | 600 | 550 | 557 | Met the Phase II interim target |
| 1e. Pie dough and shells | Refrigerated or frozen pie or tart shells, and dry mixes as consumed. Excludes graham cracker crusts. | 369 | 350 | 300 | 250 | 376 | Did not make meaningful progress |
| 1f. Refrigerated dough | Refrigerated fruit filled pastry, garlic bread, croissant, and dinner roll dough. Excludes refrigerated cookie dough (see 1j). | 733 | 660 | 590 | 510 | 689 | Did not make meaningful progress |
| 1g. Dry bread | Melba toast, rusks, breadsticks, pita or baguette chips, and other crisp breads. Excludes breadcrumbs and croutons (see 1h). | 733 | 650 | 570 | 480 | 580 | Met the Phase I interim target |
| 1h. Breadcrumbs, croutons, and salad toppers | Plain seasoned breadcrumbs, croutons, and salad toppers e.g. fried chow mein noodles and wonton strips. | 916 | 840 | 760 | 670 | 762 | Met the Phase I interim target |
| 1i. Crackers | Plain or flavoured crackers, sandwich crackers, puffed cakes, and graham crackers e.g. cheese crackers, soda crackers, and rice cakes. Excludes dry breads (see 1g). | 859 | 770 | 690 | 600 | 748 | Met the Phase I interim target |
| 1j. Cookies | Filled and unfilled sweet cookies, biscuits, refrigerated dough, and dry mixes as consumed. Excludes infant and toddler cookies and biscuits (see 15b) and graham crackers (see 1i). | 363 | 320 | 280 | 240 | 276 | Met the Phase II interim target |
| 1k. Baked desserts | Cakes, cheesecakes, snack cakes, pies, fruit crisps, doughnuts (yeast and cake types), pastries, sweet buns, brownies and squares, muffins and quick breads, and dry mix products as consumed. Excludes non-yeast leavened cinnamon rolls (see 1p). | 349 | 310 | 270 | 230 | 315 | Did not make meaningful progress |
| 1l. Toaster pastries | Toaster pastries with fruit or other fillings. | 360 | 350 | 330 | 320 | 358 | Did not make meaningful progress |
| 1m. Granola and cereal type bars | Granola bars (plain and coated), fruit filled bars, and muffin-type bars. Excludes sweet and salty bars (see 1n), and infant and toddler snack bars (see 15b). | 276 | 240 | 210 | 180 | 244 | Did not make meaningful progress |
| 1n. Sweet and salty bars | Sweet and salty granola bars. | 398 | 370 | 340 | 300 | 407 | Did not make meaningful progress |
| 1o. Pancakes, waffles, and French toast | Shelf stable, frozen, refrigerated, and dry mix products as consumed. | 614 | 530 | 490 | 440 | 562 | Did not make meaningful progress |
| 1p. Tea biscuits and scones | Ready-made and dry mix tea biscuits, scones, and non-yeast leavened cinnamon rolls as consumed. | 789 | 730 | 630 | 530 | 691 | Met the Phase I interim target |
| 2. Breakfast cereals | |||||||
| 2a. Ready-to-eat cereals | Granola, muesli, shredded, flaked, puffed, extruded, and high-fibre compact cereals. | 558 | 490 | 430 | 360 | 395 | Met the Phase II interim target |
| 2b. Hot instant cereals | Plain and flavoured hot instant cereals (dry mix, as sold) e.g. oatmeal. | 539 | 460 | 400 | 340 | 425 | Met the Phase I interim target |
| 3. Dairy products and substitutes | |||||||
| 3a. Cottage cheese | Plain and flavoured cottage cheese. Excludes ricotta. | 375 | 350 | 330 | 280 | 278 | Met the Phase III target |
| 3b. Cream cheese, cream cheese products, and soft unripened goat cheese | Plain and flavoured (sweet or savoury) products. Includes cream cheese spread, cream cheese-style products, and soft unripened goat cheese. Excludes cream cheese based dips (see 11e). | 472 | 440 | 410 | 350 | 448 | Did not make meaningful progress |
| 3c. Brie, Camembert, Cheddar, Swiss, Monterey Jack, Brick, Colby, Gouda, and Mozzarella | Brie, Camembert, mild, medium and old Cheddar, Swiss, Monterey Jack, Brick, Colby, Gouda, Mozzarella (including pasta filata), string cheese, and shredded mixed cheese. Excludes fresh Mozzarella and cheese curds. | 720 | 710 | 700 | 670 | 698 | Met the Phase II interim target |
| 3d. Hard cheese, grated and ungrated | Shelf stable and refrigerated hard cheese e.g. Parmesan and Romano. | 2293 | 2150 | 2010 | 1720 | 1403 | Met the Phase III target |
| 3e. Feta and feta-style cheese | Cheese sold in brine and cheese salted through a brine e.g. feta cheese. | 1323 | 1270 | 1210 | 1100 | 1251 | Met the Phase I interim target |
| 3f. Processed cheese and other cheese products | Processed cheese products made from an emulsified blend of natural cheese. Includes spreads, blocks, and slices with or without added ingredients. Excludes string cheese (see 3c). | 1610 | 1520 | 1420 | 1240 | 1444 | Met the Phase I interim target |
| 3g. Dairy-free cheese and spreads | Soy, rice, and other dairy-free cheese slices, blocks, and spreads. | 616 | 560 | 510 | 460 | 957 | Did not make meaningful progress |
| 4. Fats and oils | |||||||
| 4a. Salted butter and butter blends | Plain and flavoured butter and butter blends. Excludes unsalted butter. | 678 | 620 | 550 | 480 | 696 | Did not make meaningful progress |
| 4b. Salted margarine | Plain and flavoured margarine. Excludes unsalted margarine. | 692 | 620 | 550 | 480 | 665 | Did not make meaningful progress |
| 4c. Mayonnaise and mayonnaise type spreads and dressing | Plain and flavoured mayonnaise and mayonnaise type spreads and dressings. Includes low fat and fat-free versions, and oil based sandwich spreads. Includes standardized salad dressing (see B.07.040 and B.07.042 of the Food and Drug Regulations). | 760 | 680 | 610 | 530 | 745 | Did not make meaningful progress |
| 4d. Salad dressing and vinaigrette | Refrigerated and shelf stable oil and vinegar based dressings, creamy dressings, and salad dressing mixes as consumed. Includes low fat and fat-free versions. Excludes standardized salad dressing (B.07.040 and B.07.042 of the Food and Drug Regulations) (see 4c). | 987 | 890 | 790 | 690 | 843 | Met the Phase I interim target |
| 5. Fish and seafood products | |||||||
| 5a. Canned tuna | Shelf stable water and oil packed tuna. Excludes sauce packed tuna (see 5b). | 339 | 310 | 280 | 250 | 350 | Did not make meaningful progress |
| 5b. Canned salmon and other canned fish and shellfish | Canned salmon, water and oil packed fish, sauce packed fish, fish salad and shellfish e.g. sardines, mackerel, sauce packed tuna, shrimp, crab, clams, and smoked oysters. Includes retort packed products. Excludes water and oil packed tuna (see 5a) and anchovies. | 384 | 360 | 340 | 320 | 361 | Did not make meaningful progress |
| 5c. Imitation and simulated seafood | Surimi, crab flavoured pollock, imitation or simulated crab and lobster meat. | 630 | 600 | 580 | 550 | 462 | Met the Phase III target |
| 5d. Kippered fish | Kippered fish e.g. kippered herring. | 707 | 650 | 600 | 540 | 401 | Met the Phase III target |
| 5e. Frozen plain fish and seafood with added sodium phosphate | Frozen plain fish and seafood with added sodium phosphate. | 285 | 260 | 240 | 220 | 365 | Did not make meaningful progress |
| 5f. Fish and seafood: cakes or burgers, seasoned, and breaded or battered | Fish and seafood: cakes and burgers, seasoned, with sauce or seasoning, breaded or battered, and stuffed fish. | 460 | 390 | 350 | 300 | 376 | Met the Phase I interim target |
| 5g. Smoked fish | Smoked fish e.g. smoked salmon and smoked rainbow trout. Excludes fresh smoked fish and salmon jerky (see 7k). | 811 | 740 | 680 | 610 | 741 | Did not make meaningful progress |
| 5h. Fish and seafood mousse, spread, and dips | Fish and seafood based mousse, spread, and dips. | 573 | 510 | 460 | 400 | 507 | Met the Phase I interim target |
| 6. Mixed dishes | |||||||
| 6a. Canned chili | Shelf stable vegetarian and meat chili. | 303 | 280 | 250 | 220 | 297 | Did not make meaningful progress |
| 6b. Canned stew and meatballs | Shelf stable stew, meatballs, and curries. | 503 | 470 | 440 | 410 | 470 | Did not make meaningful progress |
| 6c. Shelf stable pasta, noodles, and rice or grains with sauce or seasoned | Shelf stable pasta, noodles, and rice or grain mixes with sauce or seasonings, as consumed e.g. macaroni with cheese sauce, noodles in tomato sauce, and teriyaki noodles. | 368 | 330 | 300 | 270 | 557 | Did not make meaningful progress |
| 6d. Stuffing mixes | Shelf stable stuffing mixes as consumed. Excludes refrigerated stuffing (see 6j or 6k). | 530 | 520 | 510 | 500 | 457 | Met the Phase III target |
| 6e. Baked and refried beans | Shelf stable meat and vegetarian baked beans and refried beans. | 335 | 310 | 280 | 250 | 322 | Did not make meaningful progress |
| 6f. Pizza, pizza snacks, and frozen sandwiches | Frozen and refrigerated pizza, pizza snacks, calzones, and frozen sandwiches with or without meat. Excludes sandwich wraps and burritos (see 6j or 6k). | 589 | 520 | 460 | 400 | 532 | Did not make meaningful progress |
| 6g. Frozen potatoes | Plain and seasoned French fries, sweet potato fries, hash browns and potato patties. | 266 | 230 | 200 | 170 | 258 | Did not make meaningful progress |
| 6h. Dry mashed or scalloped potatoes | Dehydrated scalloped or mashed potatoes as consumed. | 376 | 350 | 320 | 290 | 412 | Did not make meaningful progress |
| 6i. Refrigerated prepared salads | Refrigerated prepared salads e.g. potato salad, coleslaw, pasta salad, vegetable salad, bean salad, couscous, and rice salad. | 318 | 290 | 260 | 220 | 308 | Did not make meaningful progress |
| 6j. Refrigerated or frozen appetizers/sides/entrees with a serving size less than 170 g | Dinner entrees, meal sides, meal centers, and appetizers with a serving size less than 170 grams. Excludes all other items listed in Group 6. | 480 | 440 | 390 | 350 | 412 | Met the Phase I interim target |
| 6k. Refrigerated or frozen appetizers/sides/entrees with a serving size of 170 g or more | Dinner entrees, meal sides, meal centers, and appetizers with a serving size of 170 grams or more. Excludes all other items listed in Group 6. | 288 | 260 | 240 | 220 | 272 | Did not make meaningful progress |
| 7. Meat products | |||||||
| 7a. Uncooked bacon - belly | Uncooked belly bacon. Excludes back bacon (see 7o), bacon substitutes (see 7b), and pre-cooked shelf stable bacon (see 7p). | 619 | 610 | 590 | 580 | 588 | Met the Phase II interim target |
| 7b. Fully cooked breakfast strips and bacon substitutes | Chicken, turkey, and other meat based breakfast strips. Excludes back bacon (see 7f) and pre-cooked shelf stable bacon (see 7p). | 961 | 940 | 930 | 910 | 886 | Met the Phase III target |
| 7c. Uncooked fresh sausage | Uncooked breakfast and dinner sausages e.g. pork, chicken and turkey. | 789 | 750 | 700 | 660 | 691 | Met the Phase II interim target |
| 7d. Fully cooked sausage - smoked and unsmoked, and wieners | Wieners (hot dogs) and smoked or unsmoked sausages with or without cheese. | 990 | 940 | 880 | 830 | 883 | Met the Phase I interim target |
| 7e. Pâtés and spreads | Pâtés and spreads e.g. creton and liverwurst. Excludes fish pâtés and spreads (see 5h). | 781 | 710 | 640 | 570 | 703 | Met the Phase I interim target |
| 7f. Packaged deli meats - fully cooked | Cooked deli meat e.g. smoked meat, pastrami, bologna, corned beef, ham, sliced chicken and turkey, luncheon meat loaf, roast beef, cooked pepperoni, and cooked back bacon. | 1028 | 970 | 910 | 850 | 903 | Met the Phase II interim target |
| 7g. Packaged deli meats - dry cured, fermented, no thermal process | Dry cured, fermented deli meats which have not been thermally processed, e.g. salami and dried pepperoni. Excludes Prosciutto. | 1592 | 1510 | 1420 | 1330 | 1549 | Did not make meaningful progress |
| 7h. Canned chicken or turkey | Shelf stable flakes and chunks of chicken or turkey. | 554 | 520 | 480 | 450 | 579 | Did not make meaningful progress |
| 7i. Canned meat | Shelf stable meats e.g. Vienna sausage, flaked ham, corned beef, and luncheon meat. | 865 | 840 | 820 | 790 | 847 | Did not make meaningful progress |
| 7j. Meat sticks | Shelf stable and refrigerated meat sticks e.g. pepperoni, turkey, beef, ham, and chicken. | 1204 | 1160 | 1120 | 1080 | 1191 | Did not make meaningful progress |
| 7k. Jerky | Shelf stable jerky e.g. beef, turkey, and salmon. | 2355 | 2200 | 2050 | 1900 | 1552 | Met the Phase III target |
| 7l. Meat/Poultry marinated or flavoured and moisture enhanced, uncured | Whole muscle cuts with sauce, marinade and/or dry rubs, and meat with added sodium phosphate. | 458 | 430 | 400 | 370 | 734 | Did not make meaningful progress |
| 7m. Burgers, meatballs, meat loaf, and breaded meat and poultry | Meat and poultry burgers, meatballs and meatloaf, and breaded meat products e.g. products with cheese, breaded and unbreaded burgers, strips, nuggets, chicken burgers, chicken balls, schnitzel, and cutlets. | 503 | 490 | 470 | 450 | 529 | Did not make meaningful progress |
| 7n. Chicken wings | Cooked and uncooked chicken wings in sauce, breaded or battered, and seasoned. | 689 | 650 | 610 | 570 | 978 | Did not make meaningful progress |
| 7o. Preserved meat - uncooked | Uncooked pickled, corned, cured or smoked meats (excludes dried and salted meats) e.g. cottage roll, corned beef, pork picnic, Wiltshire bacon, and uncooked back bacon. Excludes belly bacon (see 7a) and cooked back bacon (see 7f). | 1084 | 1020 | 960 | 900 | 746 | Met the Phase III target |
| 7p. Bacon bits and shelf stable pre-cooked bacon | Shelf stable real and simulated bacon bits and bacon strips. | 2514 | 2250 | 2020 | 1800 | 1631 | Met the Phase III target |
| 8. Meat substitutes | |||||||
| 8a. Seasoned tofu and tempeh | Savoury, marinated, and seasoned tofu and tempeh. Excludes plain tofu, tofu based desserts and plain tempeh. | 148 | 130 | 120 | 100 | 46 | Met the Phase III target |
| 8b. Meat analogues | Frozen and refrigerated meat analogs e.g. veggie patties, burgers, veggie dogs, meatballs, and deli style slices. Excludes dairy-free cheese (see 3g). | 577 | 540 | 460 | 380 | 545 | Did not make meaningful progress |
| 9. Soups | |||||||
| 9a. Canned, dried, and refrigerated soups | Canned condensed, ready-to-serve, and dried cream and broth-based soup, broth, stock, bouillon, and consommé as consumed. Includes fresh and instant oriental noodle soups. | 289 | 280 | 260 | 240 | 266 | Met the Phase I interim target |
| 10. Snacks | |||||||
| 10a. Chips, popcorn, and extruded corn snacks | Potato, corn, tortilla, rice, and vegetable chips; extruded and puffed corn snacks; microwave and stovetop ready popcorn, and seasoned or candied ready to eat popcorn. Excludes unseasoned dry popcorn kernels. | 676 | 580 | 490 | 400 | 645 | Did not make meaningful progress |
| 10b. Pretzels and snack mixes | Hard pretzels, candied pretzels, sesame sticks, and assorted snack mixes. Excludes trail mix. | 1307 | 1140 | 970 | 790 | 1103 | Met the Phase I interim target |
| 10c. Nuts, seeds, and kernels, seasoned and candied | Seasoned, salted, and candied nuts, seeds, and kernels e.g. salted sunflower seeds, BBQ peanuts, and beer nuts. Excludes unsalted products. | 519 | 460 | 390 | 320 | 406 | Met the Phase I interim target |
| 10d. Pudding | Refrigerated, shelf stable, and dry mix puddings as consumed. Includes soy pudding. | 130 | 110 | 100 | 80 | 129 | Did not make meaningful progress |
| 11. Sauces, dips, gravies and condiments | |||||||
| 11a. Pasta sauce | Shelf stable, refrigerated, frozen, and dry mix tomato-based pasta, pizza, and lasagna sauces, and cream or cheese sauces, as consumed. | 461 | 410 | 360 | 320 | 367 | Met the Phase I interim target |
| 11b. Pesto | Shelf stable and refrigerated pesto e.g. basil or sun-dried tomato pesto. | 1094 | 990 | 880 | 770 | 629 | Met the Phase III target |
| 11c. Tomato sauce | Shelf stable plain or flavoured tomato sauce. Excludes tomato-based pasta sauces (see 11a) and tomato paste (see 12a). | 386 | 380 | 300 | 250 | 334 | Met the Phase I interim target |
| 11d. Condiments | Shelf stable condiments e.g. ketchup, chili sauce, seafood sauce, BBQ sauce, steak sauce, chutney, and mustard. Excludes relish (see 12d). | 1002 | 890 | 770 | 660 | 1049 | Did not make meaningful progress |
| 11e. Gravy, cooking sauces, dips, and salsa. | Shelf stable, refrigerated and dry mix gravy, cooking sauces (e.g. hollandaise, curry, and stir-fry sauces), salsa, and vegetable, legume, and dairy-based dips as consumed. Excludes curry paste (see 11i). | 637 | 570 | 480 | 400 | 636 | Did not make meaningful progress |
| 11f. Sweet oriental sauces | Sweet oriental sauces e.g. plum sauce, cherry sauce, pineapple sauce, and sweet and sour sauce. Excludes sweet chili sauce (see 11g). | 158 | 140 | 120 | 100 | 514 | Did not make meaningful progress |
| 11g. Soya and other oriental sauces | Oriental sauces e.g. soya, teriyaki, black bean, fish, hoisin, peanut sauce, and sweet chili sauce. Excludes stir-fry sauce (see 11e), marinades (see 11h), and sweet oriental sauces (see 11f). | 3475 | 3100 | 2700 | 2300 | 3549 | Did not make meaningful progress |
| 11h. Marinades | Shelf stable and dry marinade mixes as consumed. | 2755 | 2440 | 2120 | 1800 | 2412 | Met the Phase I interim target |
| 11i. Curry pastes | Curry pastes e.g. Thai and Indian. | 2023 | 1740 | 1520 | 1300 | 1995 | Did not make meaningful progress |
| 12. Vegetables | |||||||
| 12a. Tomato paste with additions | Tomato paste with additions e.g. tomato paste with herbs or garlic. Excludes plain tomato paste with no added salt. | 727 | 640 | 560 | 470 | 252 | Met the Phase III target |
| 12b. Canned vegetables and legumes | Canned vegetables and legumes e.g. potatoes, tomatoes, corn, peas, green beans, mushrooms, mixed vegetables, beets (plain and pickled), kidney beans, chickpeas, lentils, and bean salads. | 246 | 200 | 150 | 100 | 186 | Met the Phase I interim target |
| 12c. Sour pickled vegetables | Shelf stable sour pickled vegetables e.g. cucumbers, onions, peppers, sauerkraut, and other vegetables. | 891 | 810 | 720 | 640 | 854 | Did not make meaningful progress |
| 12d. Sweet pickled vegetables | Shelf stable sweet pickled vegetables e.g. cucumbers, onions, relish, and other vegetables. | 558 | 500 | 450 | 400 | 506 | Did not make meaningful progress |
| 12e. Olives and sundried tomatoes | Shelf stable un-stuffed olives, tapenade, and sundried tomatoes. Excludes stuffed olives (see 12f). | 1227 | 1160 | 1020 | 880 | 1163 | Did not make meaningful progress |
| 12f. Stuffed olives | Shelf stable stuffed olives. | 1801 | 1750 | 1680 | 1600 | 1603 | Met the Phase II interim target |
| 12g. Vegetable juice and cocktail | Vegetable juice and vegetable juice cocktail e.g. tomato juice, carrot juice, and tomato and clam juice. Excludes vegetable and fruit juice blends. | 236 | 220 | 200 | 180 | 199 | Met the Phase II interim target |
| 13. Nut butters | |||||||
| 13a. Nut butters | Nut butters e.g. peanut, almond, cashew, and soy. Excludes unsalted nut butters and tahini. | 447 | 400 | 350 | 300 | 354 | Met the Phase I interim target |
| 14. Seasoning mixes | |||||||
| 14a. Breading, batter, and coatings | Meat, fish, and vegetable breading or batter coatings. | 3005 | 2650 | 2250 | 1840 | 2631 | Met the Phase I interim target |
| 14b. Dry seasoning mixes | Dry seasoning mixes for side and main dishes e.g. chili, stew, fajita, and salad seasoning. Includes popcorn seasoning. Excludes salts listed in Division 7 of the Food and Drug Regulations. | 7281 | 6500 | 5800 | 5100 | 10557 | Did not make meaningful progress |
| 14c. Meat and fish seasoning | Dry seasoning for meat and fish e.g. steak spice. | 17521 | 17200 | 15000 | 12700 | 17255 | Did not make meaningful progress |
| 15. Infant and toddler foods | |||||||
| 15a. Toddler mixed dishes | Shelf stable and frozen toddler entrees. | 215 | 210 | 200 | 190 | 96 | Met the Phase III target |
| 15b. Cookies, biscuits and snack bars | Infant and toddler cookies, biscuits and snack bars. | 247 | 220 | 190 | 160 | 166 | Met the Phase II interim target |
| 15c. Savoury snacks | Infant and toddler seasoned extruded snacks. | 714 | 610 | 500 | 400 | 514 | Met the Phase I interim target |
Appendix B: Summary of sodium levels compared to sodium reduction targets
| Food Category | Examples of Foods in Category |
|---|---|
| Dairy Products and Substitutes | |
| Cottage cheese | Plain and flavoured cottage cheese |
| Hard cheese, grated and ungrated | Parmesan and Romano |
| Fish and Seafood Products | |
| Imitation and simulated seafood | Crab flavoured pollock, simulated crab and lobster meat |
| Kippered fish | Kippered herring |
| Meat Products | |
| Fully cooked breakfast strips and bacon substitutes | Chicken, turkey, and other meat based breakfast strips |
| Jerky | Beef, turkey, and salmon jerky |
| Preserved meat – uncooked | Cottage roll, corned beef, smoked meat, and uncooked back bacon |
| Bacon bits and shelf stable pre-cooked bacon | Simulated bacon bits and bacon strips |
| Meat Substitutes | |
| Seasoned tofu and tempeh | Savoury, marinated, and seasoned tofu and tempeh |
| Mixed Dishes | |
| Stuffing mixes | Shelf stable stuffing mixes |
| Vegetables | |
| Tomato paste with additions | Tomato paste with herbs or garlic |
| Sauces, Dips, Gravies and Condiments | |
| Pesto | Basil or sun-dried tomato pesto |
| Infant and Toddler Foods | |
| Toddler mixed dishes | Shelf stable and frozen toddler entrees |
| Food Category | Examples of Foods in Category |
|---|---|
| Bakery Products | |
| Tortillas and wraps | Plain or flavoured tortillas, wraps or naan |
| Cookies | Filled and unfilled sweet cookies and biscuits |
| Breakfast Cereals | |
| Ready-to-eat cereals | Granola, muesli, shredded, flaked, puffed, extruded, and high-fibre cereals |
| Dairy Products and Substitutes | |
| Brie, Camembert, Cheddar, Swiss, Monterey Jack, Brick, Colby, Gouda, and Mozzarella | Brie, Camembert, Cheddar, Swiss, Monterey Jack, Brick, Colby, Gouda, Mozzarella |
| Meat Products | |
| Uncooked bacon – belly | Uncooked belly bacon |
| Uncooked fresh sausage | Uncooked breakfast and dinner sausages |
| Packaged deli meats - fully cooked | Pastrami, bologna, ham, sliced chicken and turkey, roast beef and pepperoni |
| Vegetables | |
| Stuffed olives | Stuffed olives |
| Vegetable juice and cocktail | Tomato juice, carrot juice, and tomato and clam juice |
| Infant and Toddler Foods | |
| Toddler cookies, biscuits and snack bars | Infant and toddler cookies, biscuits and snack bars |
| Food Category | Examples of Foods in Category |
|---|---|
| Bakery Products | |
| English muffins and raisin bread | White or whole grain English muffins, crumpets, and raisin bread |
| Pantry bread and rolls, bagels, croissants, and flatbreads | White or whole grain sliced breads, bagels, croissants, and flatbreads |
| Hearth bread | Baguettes, crusted bread, artisan breads, rye bread, and garlic bread |
| Dry bread | Melba toast, rusks, breadsticks, pita or baguette chips, and other crisp breads |
| Breadcrumbs, croutons, and salad toppers | Plain and seasoned breadcrumbs, croutons, and salad toppers |
| Crackers | Cheese crackers, soda crackers, and rice cakes |
| Tea biscuits and scones | Tea biscuits, scones, and non-yeast leavened cinnamon rolls |
| Breakfast Cereals | |
| Hot instant cereals | Flavoured oatmeal |
| Dairy Products and Substitutes | |
| Feta and feta-style cheese | Feta cheese |
| Processed cheese and other cheese products | Cheese spreads, blocks, and slices with or without added ingredients |
| Fish and Seafood Products | |
| Fish and seafood: cakes or burgers, seasoned, and breaded or battered | Seasoned, breaded, battered, and stuffed fish |
| Fish and seafood mousse, spread, and dips | Fish and seafood based mousse, spread, and dips |
| Meat Products | |
| Fully cooked sausage - smoked and unsmoked, and wieners | Wieners (hot dogs) and smoked or unsmoked sausages |
| Pâtés and spreads | Cretons and liverwurst |
| Mixed Dishes | |
| Refrigerated or frozen appetizers/sides/entrees with a serving size less than 170 g | Frozen appetizers |
| Soups | |
| Canned, dried, and refrigerated soups | Canned condensed, ready-to-serve cream and broth-based soup, dry soup mixes |
| Vegetables | |
| Canned vegetables and legumes | Canned tomatoes, corn, peas, green beans, kidney beans and lentils |
| Fats and Oils | |
| Salad dressing and vinaigrette | Oil and vinegar based and creamy dressings |
| Nut Butters | |
| Nut butters | Salted peanut, almond, cashew, and soy butters |
| Sauces, Dips, Gravies and Condiments | |
| Pasta sauce | Tomato-based pasta, pizza, and lasagna sauces, and cream or cheese sauces |
| Tomato sauce | Plain or flavoured tomato sauce |
| Marinades | Dry marinade mixes as consumed |
| Seasoning Mixes | |
| Breading, batter, and coatings | Breading or batter coatings for meat, fish and vegetables |
| Snacks | |
| Pretzels and snack mixes | Hard pretzels, candied pretzels, sesame sticks, and assorted snack mixes |
| Nuts, seeds, and kernels, seasoned and candied | Salted sunflower seeds, peanuts, and nuts |
| Infant and Toddler Foods | |
| Toddler savoury snacks | Infant and toddler seasoned extruded snacks |
| Food Category | Examples of Foods in Category |
|---|---|
| Bakery Products | |
| Pie dough and shells | Refrigerated or frozen pie or tart shells |
| Refrigerated dough | Refrigerated fruit filled pastry, garlic bread, croissant, and dinner roll dough |
| Baked desserts | Cakes, snack cakes, pies, doughnuts, pastries, brownies and muffins |
| Toaster pastries | Toaster pastries with fruit or other fillings |
| Granola and cereal type bars | Granola bars (plain and coated), fruit filled bars, and muffin-type bars |
| Sweet and salty bars | Sweet and salty granola bars |
| Pancakes, waffles, and French toast | Dry pancake mix as consumed |
| Dairy Products and Substitutes | |
| Cream cheese, cream cheese products, and soft unripened goat cheese | Cream cheese spread, cream cheese-style products, and soft unripened goat cheese |
| Dairy-free cheese and spreads | Soy, rice, and other dairy-free cheese slices, blocks, and spreads |
| Fish and Seafood Products | |
| Canned tuna | Water and oil packed tuna |
| Canned salmon and other canned fish and shellfish | Sardines, mackerel, sauce packed tuna, shrimp, crab, clams, and smoked oysters |
| Frozen plain fish and seafood with added sodium phosphate | Frozen plain fish and seafood with added sodium phosphate |
| Smoked fish | Smoked salmon and smoked rainbow trout |
| Meat Products | |
| Packaged deli meats - dry cured, fermented, no thermal process | Salami and dried pepperoni |
| Canned chicken or turkey | Canned flakes and chunks of chicken or turkey |
| Canned meat | Canned Vienna sausage, flaked ham, corned beef, and luncheon meat |
| Meat sticks | Pepperoni, turkey, beef, ham, and chicken sticks |
| Meat/Poultry marinated or flavoured and moisture enhanced, uncured | Meat and poultry with added sodium phosphate |
| Burgers, meatballs, meat loaf, and breaded meat and poultry | Beef burgers, breaded and unbreaded chicken burgers, chicken strips and nuggets, and schnitzel |
| Chicken wings | Cooked and uncooked chicken wings |
| Meat Substitutes | |
| Meat analogues | Veggie patties, burgers, veggie dogs, meatballs, and deli style slices |
| Mixed Dishes | |
| Canned chili | Shelf stable vegetarian and meat chili |
| Canned stew and meatballs | Canned stew, meatballs, and curries |
| Shelf stable pasta, noodles, and rice or grains with sauce or seasoned | Macaroni with cheese sauce, noodles in tomato sauce, and teriyaki noodles |
| Baked and refried beans | Meat and vegetarian baked beans and refried beans |
| Pizza, pizza snacks, and frozen sandwiches | Frozen and refrigerated pizza and calzones, and frozen sandwiches |
| Frozen potatoes | French fries, sweet potato fries, hash browns and potato patties |
| Dry mashed or scalloped potatoes | Dehydrated scalloped or mashed potatoes. |
| Refrigerated prepared salads | Potato salad, coleslaw, pasta salad, bean salad, couscous, and rice salad |
| Refrigerated or frozen appetizers/sides/entrees with a serving size of 170 g or more | Refrigerated or frozen dinner entrees with a serving size of 170 g or greater |
| Vegetables | |
| Sour pickled vegetables | Pickled cucumbers, onions and peppers and sauerkraut |
| Sweet pickled vegetables | Sweet pickles and relish |
| Olives and sundried tomatoes | Olives (not stuffed), tapenade, and sundried tomatoes |
| Fats and Oils | |
| Salted butter and butter blends | Plain and flavoured butter and butter blends |
| Salted margarine | Plain and flavoured margarine |
| Mayonnaise and mayonnaise type spreads and dressing | Plain and flavoured mayonnaise and mayonnaise type spreads and dressings |
| Sauces, Dips, Gravies and Condiments | |
| Condiments | Ketchup, chili sauce, seafood sauce, BBQ sauce, steak sauce and mustard |
| Gravy, cooking sauces, dips, and salsa. | Hollandaise, curry, and stir-fry sauces and salsa |
| Sweet oriental sauces | Plum sauce, cherry sauce, pineapple sauce, and sweet and sour sauce |
| Soya and other oriental sauces | Soya, teriyaki, black bean, fish, hoisin, peanut sauce, and sweet chili sauce |
| Curry pastes | Thai and Indian curry pastes |
| Seasoning Mixes | |
| Dry seasoning mixes | Chili, stew, fajita, and salad seasoning |
| Meat and fish seasoning | Steak spice |
| Snacks | |
| Chips, popcorn, and extruded corn snacks | Potato, corn, tortilla, rice, and vegetable chips. |
| Pudding | Refrigerated and dry mix puddings |
Appendix C: Food categories in which sodium increased since baseline
Dairy Products and Substitutes
- Dairy-free cheese and spreads
Fish and Seafood Products
- Frozen plain fish and seafood with added sodium phosphate
Mixed Dishes
- Dry mashed or scalloped potatoes
Sauces, Dips, Gravies and Condiments
- Condiments (ketchup, chili sauce, seafood sauce, BBQ sauce, steak sauce and mustard)
- Sweet oriental sauces
Seasoning Mixes
- Dry seasoning mixes
Appendix D: Summary of sodium levels compared to Maximum Levels
List of food categories where the sodium levels of at least 90% of food products moved below the Maximum Levels by 2017
Bakery Products
- Tortillas and wraps
- Pie dough and shells
Breakfast Cereals
- Ready-to-eat cereals
- Instant hot cereals
Dairy Products and Substitutes
- Cottage cheese
- Cream cheese, cream cheese products, and soft unripened goat cheese
Fish and Seafood Products
- Canned tuna
- Imitation and simulated seafood
- Kippered fish
- Smoked fish
Meat Products
- Bacon bits and shelf stable precooked bacon
Meat Substitutes
- Seasoned tofu and tempeh
Mixed Dishes
- Canned chili
- Canned stew and meatballs
- Stuffing mixes
- Pizza, pizza snacks and frozen sandwiches
Soups
- Soups
Vegetables
- Tomato paste with additions
- Vegetable juices and cocktails
Fats and Oils
- Salted butter and butter blends
- Salted margarine
- Salad dressing and vinaigrette
Nut Butters
- Nut Butters
Sauces, Dips, Gravies and Condiments
- Pasta sauce
- Tomato sauce
Seasoning Mixes
- Meat and fish seasoning
Infant and Toddler Foods
- Toddler mixed dishes
- Toddler cookies, biscuits and snack bars
References
- Footnote 1
-
Public Health Agency of Canada. How Healthy are Canadians? 2016. [cited 2017 Oct 19]. Available from: https://www.canada.ca/en/public-health/services/publications/healthy-living/how-healthy-canadians.html.
- Footnote 2
-
Statistics Canada. Leading causes of death. 2013. [cited 2017 Oct 19]. Available from: http://www.statcan.gc.ca/tables-tableaux/sum-som/l01/cst01/hlth36a-eng.htm.
- Footnote 3
-
Institute of Medicine of the U.S. National Academies. Dietary Reference Intakes for Water, Potassium, Sodium, Chloride, and Sulfate. 2005. Washington (DC): National Academies Press.
- Footnote 4
-
World Health Organization. Global Status Report on Noncommunicable diseases. 2014. [cited 2017 Oct 19]. Available from: http://www.who.int/nmh/publications/ncd-status-report-2014/en/.
- Footnote 5
-
Garriguet D. Sodium consumption at all ages. Health Reports. 2007;18:47-52.
- Footnote 6
-
Health Canada. Sodium Reduction Strategy for Canada, Recommendations of the Sodium Working Group. 2010. [cited 2017 Oct 19]. Available from: https://www.canada.ca/en/health-canada/services/food-nutrition/healthy-eating/sodium/related-information/reduction-strategy/recommendations-sodium-working-group.html.
- Footnote 7
-
Moubarac J-C. Ultra-processed foods in Canada: consumption, impact on diet quality and policy implications. 2017. [cited 2017 Dec 16]. Available from: http://www.heartandstroke.ca/-/media/pdf-files/canada/media-centre/hs-report-upp-moubarac-dec-5-2017.ashx
- Footnote 8
-
Health Canada. Guidance for the Food Industry on Reducing Sodium in Processed Foods. 2012. [cited 2017 Oct 19]. Available from: https://www.canada.ca/en/health-canada/services/food-nutrition/legislation-guidelines/guidance-documents/guidance-food-industry-reducing-sodium-processed-foods-2012.html.