
Sodium detector: Ingredients added during cooking and at the table
Select one of the products below:
Table salt
Follow these 3 steps to find out how much sodium is in this food:
Step 1:
Look at the serving size on the nutrition facts table. The serving size for table salt is about 1/4 tsp (1 g). Compare this amount to the quantity that you actually eat.
Step 2:
Read the % DV (Daily Value) on the food label. 5% DV or less is a little and 15 % DV or more is a lot.
Step 3:
Choose wisely. Look closely at the label to see if 1/4 tsp of table salt has a little or a lot of sodium.
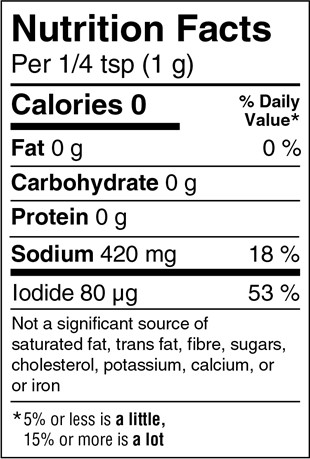
Table salt - Text description
Shown here is a Nutrition Facts table. Left justified at the top of the table is the heading Nutrition Facts in bold. The next line is Per ¼ tsp open parenthesis 1 g close parenthesis. There is a thin rule below per 1 tsp information that spans the width of the table. The next line is Calories in bold followed by 0, also in bold. Right justified on the same line is the subheading percent symbol Daily Value in bold. Percent symbol Daily is on top of Value. Percent Daily Value is followed by an asterisk that refers to a footnote at the bottom of the Nutrition Facts table. There is a thick rule under Calories that ends after the 0; it does not span the width of the table.
Left justified on the next line is Fat in bold followed by 0 and a lowercase g. Right justified on the same line is 0 followed by a percent symbol. There is a thin rule below the trans information that spans the width of the table.
The next line is Carbohydrate in bold followed by 0 and a lowercase g. There is a thin rule under Carbohydrate that spans the width of the table.
The next line is Protein in bold followed by 0 and a lowercase g. There is a thin rule under the protein information that spans the width of the table.
The next line is Sodium in bold followed by 420 and mg in lowercase. Right justified on the same line is 18 followed by a percent symbol. There is a thick rule under the sodium information that spans the width of the table.
The next line is Iodide followed by 80 and µg in lowercase. Right justified on the same line is 53 followed by a percent symbol. There is a thin rule under the iodide information that spans the width of the table.
The next four lines are the footnote: Not a significant source of saturated fat, trans fat, fibre, sugars, cholesterol, potassium, calcium or iron. There is a thin rule below this footnote.
The next two lines is the percent Daily Value footnote that was referred to at the beginning of the table description. The footnote starts with an asterisk followed by the statement: 5 percent symbol or less is a little, with ‘a little’ in bold. The next line is 15 percent symbol or more is a lot with ‘a lot’ in bold. This is the end of the Nutrition Facts table.
Tip: Add flavour without adding salt, or replace salt using fresh or dried herbs and spices, garlic, ginger, onion, vinegar and lemon and lime juice for flavour.
Sea salt
Follow these 3 steps to find out how much sodium is in this food:
Step 1:
Look at the serving size on the nutrition facts table. The serving size for sea salt is about 1/4 tsp (1 g). Compare this amount to the quantity that you actually eat.
Step 2:
Read the % DV (Daily Value) on the food label. 5% DV or less is a little and 15 % DV or more is a lot.
Step 3:
Choose wisely. Look closely at the label to see if 1/4 tsp of sea salt has a little or a lot of sodium.
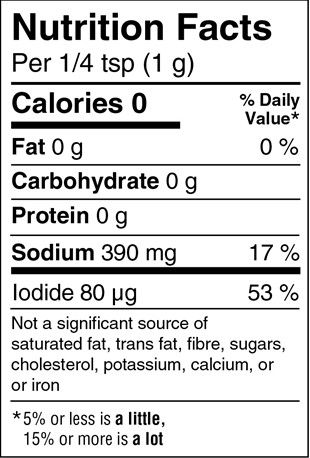
Sea salt - Text description
Shown here is a Nutrition Facts table. Left justified at the top of the table is the heading Nutrition Facts in bold. The next line is Per ¼ tsp open parenthesis 1 g close parenthesis. There is a thin rule below per 1 tsp information that spans the width of the table. The next line is Calories in bold followed by 0, also in bold. Right justified on the same line is the subheading percent symbol Daily Value in bold. Percent symbol Daily is on top of Value. Percent Daily Value is followed by an asterisk that refers to a footnote at the bottom of the Nutrition Facts table. There is a thick rule under Calories that ends after the 0; it does not span the width of the table.
Left justified on the next line is Fat in bold followed by 0 and a lowercase g. Right justified on the same line is 0 followed by a percent symbol. There is a thin rule below the trans information that spans the width of the table.
The next line is Carbohydrate in bold followed by 0 and a lowercase g. There is a thin rule under Carbohydrate that spans the width of the table.
The next line is Protein in bold followed by 0 and a lowercase g. There is a thin rule under the protein information that spans the width of the table.
The next line is Sodium in bold followed by 390 and mg in lowercase. Right justified on the same line is 17 followed by a percent symbol. There is a thick rule under the sodium information that spans the width of the table.
The next line is Iodide followed by 80 and µg in lowercase. Right justified on the same line is 53 followed by a percent symbol. There is a thin rule under the iodide information that spans the width of the table.
The next four lines are the footnote: Not a significant source of saturated fat, trans fat, fibre, sugars, cholesterol, potassium, calcium or iron. There is a thin rule below this footnote.
The next two lines is the percent Daily Value footnote that was referred to at the beginning of the table description. The footnote starts with an asterisk followed by the statement: 5 percent symbol or less is a little, with ‘a little’ in bold. The next line is 15 percent symbol or more is a lot with ‘a lot’ in bold. This is the end of the Nutrition Facts table.
Tip: Kosher salt, sea salt, fleur de sel, gourmet salt and smoked salt all have close to the same amount of sodium as table salt. Add flavour without adding salt, or replace salt using fresh or dried herbs and spices, garlic, ginger, onion, vinegar and lemon and lime juice for flavour.
Ketchup
Follow these 3 steps to find out how much sodium is in this food:
Step 1:
Look at the serving size on the nutrition facts table. The serving size for ketchup is 1 tbsp (15 mL). Compare this amount to the quantity that you actually eat.
Step 2:
Read the % DV (Daily Value) on the food label. 5% DV or less is a little and 15 % DV or more is a lot.
Step 3:
Choose wisely. Look closely at the label to see if ketchup has a little or a lot of sodium.

Ketchup - Text description
Shown here is a Nutrition Facts table. Left justified at the top of the table is the heading Nutrition Facts in bold. The next line is Per 1 tbsp open parenthesis 15 mL close parenthesis. There is a thin rule below per 1 tbsp information that spans the width of the table. The next line is Calories in bold followed by 15, also in bold. Right justified on the same line is the subheading percent symbol Daily Value in bold. Percent Daily Value is followed by an asterisk that refers to a footnote at the bottom of the Nutrition Facts table. There is a thick rule under Calories that ends after the 15; it does not span the width of the table.
Left justified on the next line is Fat in bold followed by 0 and a lowercase g. Right justified on the same line is 0 followed by a percent symbol. Indented on the next line is Saturated followed by 0 and a lowercase g. Indented on the next line is a plus symbol followed by Trans, followed by 0 and a lowercase g. Right justified and vertically centered against the saturated and trans information on the left is 0 followed by a percent symbol. There is a thin rule below the trans information that spans the width of the table.
The next line is Carbohydrate in bold followed by 4 and a lowercase g. Indented on the next line is Fibre followed by 0 and a lowercase g. Right justified on the same line is 0 followed by a percent symbol. Indented on the next line is Sugars followed by 3 and a lowercase g. Right justified on the same line is 3 followed by a percent symbol. There is a thin rule under the sugars information that spans the width of the table.
The next line is Protein in bold followed by 0 and a lowercase g. There is a thin rule under the protein information that spans the width of the table. The next line is Cholesterol, in bold followed by 0 and mg in lowercase. There is a thin rule under the cholesterol information that spans the width of the table. The next line is Sodium in bold followed by 160 and mg in lowercase. Right justified on the same line is 7 followed by a percent symbol. There is a thick rule under the sodium information that spans the width of the table.
The next line is Potassium followed by 40 and mg in lowercase. Right justified on the same line is 1 followed by a percent symbol. There is a thin rule under the potassium information that spans the width of the table.
The next line is Calcium followed by 0 and mg in lowercase. Right justified on the same line is 0 followed by a percent symbol. There is a thin rule below the calcium information that spans the width of the table.
The next line is Iron followed by 0 and mg in lowercase. Right justified on the same line is 0 followed by a percent symbol. There is a thick rule under the iron information that spans the width of the Nutrition Facts table.
The next line is the percent Daily Value footnote that was referred to at the beginning of the table description. The footnote starts with an asterisk followed by the statement: 5 percent symbol or less is a little, 15 percent symbol or more is a lot. The terms 'a little' and 'a lot' are in bold. This is the end of the Nutrition Facts table.
Tip: Put lettuce, onions or tomatoes on burgers and sandwiches. Skip the ketchup, mustard, relish, sauerkraut and pickles for less sodium.
Dill pickles
Follow these 3 steps to find out how much sodium is in this food:
Step 1:
Look at the serving size on the nutrition facts table. The serving size for pickles is 1 small (30 g). Compare this amount to the quantity that you actually eat.
Step 2:
Read the % DV (Daily Value) on the food label. 5% DV or less is a little and 15 % DV or more is a lot.
Step 3:
Choose wisely. Look closely at the label to see if pickles have a little or a lot of sodium.
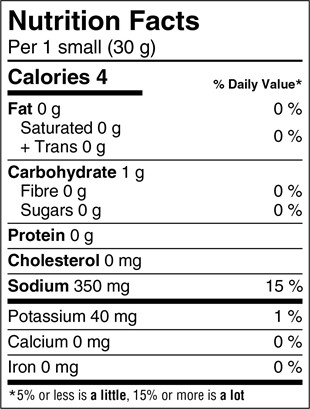
Dill pickles - Text description
Shown here is a Nutrition Facts table. Left justified at the top of the table is the heading Nutrition Facts in bold. The next line is Per 1 small open parenthesis 30 g close parenthesis. There is a thin rule below per 1 small information that spans the width of the table. The next line is Calories in bold followed by 4, also in bold. Right justified on the same line is the subheading percent symbol Daily Value in bold. Percent Daily Value is followed by an asterisk that refers to a footnote at the bottom of the Nutrition Facts table. There is a thick rule under Calories that ends after the 4; it does not span the width of the table.
Left justified on the next line is Fat in bold followed by 0 and a lowercase g. Right justified on the same line is 0 followed by a percent symbol. Indented on the next line is Saturated followed by 0 and a lowercase g. Indented on the next line is a plus symbol followed by Trans, followed by 0 and a lowercase g. Right justified and vertically centered against the saturated and trans information on the left is 0 followed by a percent symbol. There is a thin rule below the trans information that spans the width of the table.
The next line is Carbohydrate in bold followed by 1 and a lowercase g. Indented on the next line is Fibre followed by 0 and a lowercase g. Right justified on the same line is 0 followed by a percent symbol. Indented on the next line is Sugars followed by 0 and a lowercase g. Right justified on the same line is 0 followed by a percent symbol. There is a thin rule under the sugars information that spans the width of the table.
The next line is Protein in bold followed by 0 and a lowercase g. There is a thin rule under the protein information that spans the width of the table.
The next line is Cholesterol, in bold followed by 0 and mg in lowercase. There is a thin rule under the cholesterol information that spans the width of the table.
The next line is Sodium in bold followed by 350 and mg in lowercase. Right justified on the same line is 15 followed by a percent symbol. There is a thick rule under the sodium information that spans the width of the table.
The next line is Potassium followed by 40 and mg in lowercase. Right justified on the same line is 1 followed by a percent symbol. There is a thin rule under the potassium information that spans the width of the table.
The next line is Calcium followed by 0 and mg in lowercase. Right justified on the same line is 0 followed by a percent symbol. There is a thin rule below the calcium information that spans the width of the table.
The next line is Iron followed by 0 and mg in lowercase. Right justified on the same line is 0 followed by a percent symbol. There is a thick rule under the iron information that spans the width of the Nutrition Facts table.
The next line is the percent Daily Value footnote that was referred to at the beginning of the table description. The footnote starts with an asterisk followed by the statement: 5 percent symbol or less is a little, 15 percent symbol or more is a lot. The terms 'a little' and 'a lot' are in bold. This is the end of the Nutrition Facts table.
Tip: Put lettuce, onions or tomatoes on burgers and sandwiches. Skip the ketchup, mustard, relish, sauerkraut and pickles for less sodium.
Soy sauce
Follow these 3 steps to find out how much sodium is in this food:
Step 1:
Look at the serving size on the nutrition facts table. The serving size for soy sauce is 1 tbsp (15 mL). Compare this amount to the quantity that you actually eat.
Step 2:
Read the % DV (Daily Value) on the food label. 5% DV or less is a little and 15 % DV or more is a lot.
Step 3:
Choose wisely. Look closely at the label to see if soy sauce has a little or a lot of sodium.

Soy sauce - Text description
Shown here is a Nutrition Facts table. Left justified at the top of the table is the heading Nutrition Facts in bold. The next line is Per 1 tbsp open parenthesis 15 mL close parenthesis. There is a thin rule below per 1 tbsp information that spans the width of the table. The next line is Calories in bold followed by 5, also in bold. Right justified on the same line is the subheading percent symbol Daily Value in bold. Percent Daily Value is followed by an asterisk that refers to a footnote at the bottom of the Nutrition Facts table. There is a thick rule under Calories that ends after the 5; it does not span the width of the table.
Left justified on the next line is Fat in bold followed by 0 and a lowercase g. Right justified on the same line is 0 followed by a percent symbol. Indented on the next line is Saturated followed by 0 and a lowercase g. Indented on the next line is a plus symbol followed by Trans, followed by 0 and a lowercase g. Right justified and vertically centered against the saturated and trans information on the left is 0 followed by a percent symbol. There is a thin rule below the trans information that spans the width of the table.
The next line is Carbohydrate in bold followed by 1 and a lowercase g. Indented on the next line is Fibre followed by 0 and a lowercase g. Right justified on the same line is 0 followed by a percent symbol. Indented on the next line is Sugars followed by 0 and a lowercase g. Right justified on the same line is 0 followed by a percent symbol. There is a thin rule under the sugars information that spans the width of the table.
The next line is Protein in bold followed by 0 and a lowercase g. There is a thin rule under the protein information that spans the width of the table.
The next line is Cholesterol, in bold followed by 0 and mg in lowercase. There is a thin rule under the cholesterol information that spans the width of the table.
The next line is Sodium in bold followed by 1030 and mg in lowercase. Right justified on the same line is 45 followed by a percent symbol. There is a thick rule under the sodium information that spans the width of the table.
The next line is Potassium followed by 0 and mg in lowercase. Right justified on the same line is 0 followed by a percent symbol. There is a thin rule under the potassium information that spans the width of the table.
The next line is Calcium followed by 0 and mg in lowercase. Right justified on the same line is 0 followed by a percent symbol. There is a thin rule below the calcium information that spans the width of the table.
The next line is Iron followed by 0 and mg in lowercase. Right justified on the same line is 0 followed by a percent symbol. There is a thick rule under the iron information that spans the width of the Nutrition Facts table.
The next line is the percent Daily Value footnote that was referred to at the beginning of the table description. The footnote starts with an asterisk followed by the statement: 5 percent symbol or less is a little, 15 percent symbol or more is a lot. The terms 'a little' and 'a lot' are in bold. This is the end of the Nutrition Facts table.
Tip: Use only small amounts of soy sauce or try the lower sodium version.
Teriyaki sauce
Follow these 3 steps to find out how much sodium is in this food:
Step 1:
Look at the serving size on the nutrition facts table. The serving size for teriyaki sauce is 1 tbsp (15 mL). Compare this amount to the quantity that you actually eat.
Step 2:
Read the % DV (Daily Value) on the food label. 5% DV or less is a little and 15 % DV or more is a lot.
Step 3:
Choose wisely. Look closely at the label to see if teriyaki sauce has a little or a lot of sodium.
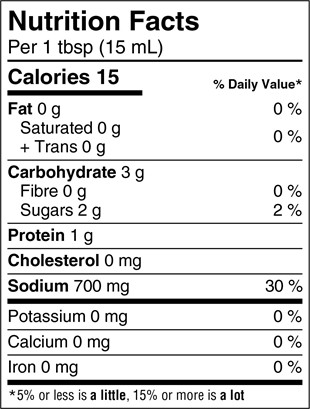
Teriyaki sauce - Text description
Shown here is a Nutrition Facts table. Left justified at the top of the table is the heading Nutrition Facts in bold. The next line is Per 1 tbsp open parenthesis 15 mL close parenthesis. There is a thin rule below per 1 tbsp information that spans the width of the table. The next line is Calories in bold followed by 15, also in bold. Right justified on the same line is the subheading percent symbol Daily Value in bold. Percent Daily Value is followed by an asterisk that refers to a footnote at the bottom of the Nutrition Facts table. There is a thick rule under Calories that ends after the 15; it does not span the width of the table.
Left justified on the next line is Fat in bold followed by 0 and a lowercase g. Right justified on the same line is 0 followed by a percent symbol. Indented on the next line is Saturated followed by 0 and a lowercase g. Indented on the next line is a plus symbol followed by Trans, followed by 0 and a lowercase g. Right justified and vertically centered against the saturated and trans information on the left is 0 followed by a percent symbol. There is a thin rule below the trans information that spans the width of the table.
The next line is Carbohydrate in bold followed by 3 and a lowercase g. Indented on the next line is Fibre followed by 0 and a lowercase g. Right justified on the same line is 0 followed by a percent symbol. Indented on the next line is Sugars followed by 2 and a lowercase g. Right justified on the same line is 2 followed by a percent symbol.
There is a thin rule under the sugars information that spans the width of the table.
The next line is Protein in bold followed by 1 and a lowercase g. There is a thin rule under the protein information that spans the width of the table.
The next line is Cholesterol, in bold followed by 0 and mg in lowercase. There is a thin rule under the cholesterol information that spans the width of the table.
The next line is Sodium in bold followed by 700 and mg in lowercase. Right justified on the same line is 30 followed by a percent symbol. There is a thick rule under the sodium information that spans the width of the table.
The next line is Potassium followed by 0 and mg in lowercase. Right justified on the same line is 0 followed by a percent symbol. There is a thin rule under the potassium information that spans the width of the table.
The next line is Calcium followed by 0 and mg in lowercase. Right justified on the same line is 0 followed by a percent symbol. There is a thin rule below the calcium information that spans the width of the table.
The next line is Iron followed by 0 and mg in lowercase. Right justified on the same line is 0 followed by a percent symbol. There is a thick rule under the iron information that spans the width of the Nutrition Facts table.
The next line is the percent Daily Value footnote that was referred to at the beginning of the table description. The footnote starts with an asterisk followed by the statement: 5 percent symbol or less is a little, 15 percent symbol or more is a lot. The terms 'a little' and 'a lot' are in bold. This is the end of the Nutrition Facts table.
Tip: Use less or try the lower sodium version of teriyaki sauce.