
Sodium detector: Processed foods
Select one of the products below:
- Canned vegetable soup
- Canned tomato sauce
- Cheddar cheese
- Ham deli meat
- Veggie burger
- Pepperoni and cheese pizza
- White bread
- Regular instant oatmeal
- Wheat crackers
Canned vegetable soup
Follow these 3 steps to find out how much sodium is in this food:
Step 1:
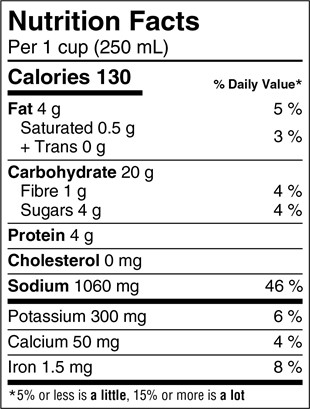
Look at the serving size on the nutrition facts table. The serving size for the canned vegetable soup is 1 cup (250 mL). Compare this amount to the quantity that you actually eat.
Step 2:
Read the % DV (Daily Value) on the food label. 5% DV or less is a little and 15 % DV or more is a lot.
Step 3:
Choose wisely. Look closely at the label to see if this canned vegetable soup has a little or a lot of sodium.
Canned vegetable soup image - Text description
Shown here is a Nutrition Facts table. Left justified at the top of the table is the heading Nutrition Facts in bold. The next line is Per 1 cup open parenthesis 250 mL close parenthesis. There is a thin rule below per 1 cup information that spans the width of the table. The next line is Calories in bold followed by 130, also in bold. Right justified on the same line is the subheading percent symbol Daily Value in bold. Percent Daily Value is followed by an asterisk that refers to a footnote at the bottom of the Nutrition Facts table. There is a thick rule under Calories that ends after the 130; it does not span the width of the table.
Left justified on the next line is Fat in bold followed by 4 and a lowercase g. Right justified on the same line is 5 followed by a percent symbol. Indented on the next line is Saturated followed by 0.5 and a lowercase g. Indented on the next line is a plus symbol followed by Trans, followed by 0 and a lowercase g. Right justified and vertically centered against the saturated and trans information on the left is 3 followed by a percent symbol. There is a thin rule below the trans information that spans the width of the table.
The next line is Carbohydrate in bold followed by 20 and a lowercase g. Indented on the next line is Fibre followed by 1 and a lowercase g. Right justified on the same line is 4 followed by a percent symbol. Indented on the next line is Sugars followed by 4 and a lowercase g. Right justified on the same line is 4 followed by a percent symbol. There is a thin rule under the sugars information that spans the width of the table.
The next line is Protein in bold followed by 4 and a lowercase g. There is a thin rule under the protein information that spans the width of the table.
The next line is Cholesterol, in bold followed by 0 and mg in lowercase. There is a thin rule under the cholesterol information that spans the width of the table.
The next line is Sodium in bold followed by 1060 and mg in lowercase. Right justified on the same line is 46 followed by a percent symbol. There is a thick rule under the sodium information that spans the width of the table.
The next line is Potassium followed by 300 and mg in lowercase. Right justified on the same line is 6 followed by a percent symbol. There is a thin rule under the potassium information that spans the width of the table.
The next line is Calcium followed by 50 and mg in lowercase. Right justified on the same line is 4 followed by a percent symbol. There is a thin rule below the calcium information that spans the width of the table.
The next line is Iron followed by 1.5 and mg in lowercase. Right justified on the same line is 8 followed by a percent symbol. There is a thick rule under the iron information that spans the width of the Nutrition Facts table.
The next line is the percent Daily Value footnote that was referred to at the beginning of the table description. The footnote starts with an asterisk followed by the statement: 5 percent symbol or less is a little, 15 percent symbol or more is a lot. The terms 'a little' and 'a lot' are in bold. This is the end of the Nutrition Facts table.
Tip: Make your own soup or buy lower sodium canned soups whenever possible. Look for the words "low sodium", "reduced sodium" or "no added salt" on the package.
Canned tomato sauce
Follow these 3 steps to find out how much sodium is in this food:
Step 1:
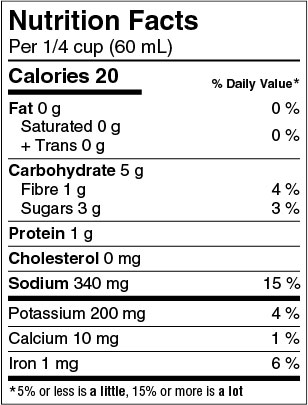
Look at the serving size on the nutrition facts table. The serving size for the canned tomato sauce is ¼ cup (60 mL). Compare this amount to the quantity that you actually eat.
Step 2:
Read the % DV (Daily Value) on the food label. 5% DV or less is a little and 15 % DV or more is a lot.
Step 3:
Choose wisely. Look closely at the label to see if this canned tomato sauce has a little or a lot of sodium.
Canned tomato soup image - Text description
Shown here is a Nutrition Facts table. Left justified at the top of the table is the heading Nutrition Facts in bold. The next line is Per ¼ cup open parenthesis 60 mL close parenthesis. There is a thin rule below per ¼ cup information that spans the width of the table. The next line is Calories in bold followed by 20, also in bold. Right justified on the same line is the subheading percent symbol Daily Value in bold. Percent Daily Value is followed by an asterisk that refers to a footnote at the bottom of the Nutrition Facts table. There is a thick rule under Calories that ends after the 20; it does not span the width of the table.
Left justified on the next line is Fat in bold followed by 0 and a lowercase g. Right justified on the same line is 0 followed by a percent symbol. Indented on the next line is Saturated followed by 0 and a lowercase g. Indented on the next line is a plus symbol followed by Trans, followed by 0 and a lowercase g. Right justified and vertically centered against the saturated and trans information on the left is 0 followed by a percent symbol. There is a thin rule below the trans information that spans the width of the table.
The next line is Carbohydrate in bold followed by 5 and a lowercase g. Indented on the next line is Fibre followed by 1 and a lowercase g. Right justified on the same line is 4 followed by a percent symbol. Indented on the next line is Sugars followed by 3 and a lowercase g. Right justified on the same line is 3 followed by a percent symbol. There is a thin rule under the sugars information that spans the width of the table.
The next line is Protein in bold followed by 1 and a lowercase g. There is a thin rule under the protein information that spans the width of the table.
The next line is Cholesterol, in bold followed by 0 and mg in lowercase. There is a thin rule under the cholesterol information that spans the width of the table.
The next line is Sodium in bold followed by 340 and mg in lowercase. Right justified on the same line is 15 followed by a percent symbol. There is a thick rule under the sodium information that spans the width of the table.
The next line is Potassium followed by 200 and mg in lowercase. Right justified on the same line is 4 followed by a percent symbol. There is a thin rule under the potassium information that spans the width of the table.
The next line is Calcium followed by 10 and mg in lowercase. Right justified on the same line is 1 followed by a percent symbol. There is a thin rule below the calcium information that spans the width of the table.
The next line is Iron followed by 1 and mg in lowercase. Right justified on the same line is 6 followed by a percent symbol. There is a thick rule under the iron information that spans the width of the Nutrition Facts table.
The next line is the percent Daily Value footnote that was referred to at the beginning of the table description. The footnote starts with an asterisk followed by the statement: 5 percent symbol or less is a little, 15 percent symbol or more is a lot. The terms 'a little' and 'a lot' are in bold. This is the end of the Nutrition Facts table.
Tip: Make your own tomato sauce from fresh or canned tomatoes that are labelled with "low sodium", "reduced sodium" or "no added salt".
Cheddar cheese
Follow these 3 steps to find out how much sodium is in this food:
Step 1:
Look at the serving size on the nutrition facts table. The serving size for the cheese is 3 cm cube (30 g). Compare this amount to the quantity that you actually eat.
Step 2:
Read the % DV (Daily Value) on the food label. 5% DV or less is a little and 15 % DV or more is a lot.
Step 3:
Choose wisely. Look closely at the label to see if this cheddar cheese has a little or a lot of sodium.

Cheddar cheese image - Text description
Shown here is a Nutrition Facts table. Left justified at the top of the table is the heading Nutrition Facts in bold. The next line is Per 3 cm cube open parenthesis 30 g close parenthesis. There is a thin rule below per 3 cm cube information that spans the width of the table. The next line is Calories in bold followed by 120, also in bold. Right justified on the same line is the subheading percent symbol Daily Value in bold. Percent Daily Value is followed by an asterisk that refers to a footnote at the bottom of the Nutrition Facts table. There is a thick rule under Calories that ends after the 120; it does not span the width of the table.
Left justified on the next line is Fat in bold followed by 10 and a lowercase g. Right justified on the same line is 13 followed by a percent symbol. Indented on the next line is Saturated followed by 6 and a lowercase g. Indented on the next line is a plus symbol followed by Trans, followed by 0 and a lowercase g. Right justified and vertically centered against the saturated and trans information on the left is 30 followed by a percent symbol. There is a thin rule below the trans information that spans the width of the table.
The next line is Carbohydrate in bold followed by 1 and a lowercase g. Indented on the next line is Fibre followed by 0 and a lowercase g. Right justified on the same line is 0 followed by a percent symbol. Indented on the next line is Sugars followed by 0 and a lowercase g. Right justified on the same line is 0 followed by a percent symbol. There is a thin rule under the sugars information that spans the width of the table.
The next line is Protein in bold followed by 7 and a lowercase g. There is a thin rule under the protein information that spans the width of the table.
The next line is Cholesterol, in bold followed by 30 and mg in lowercase. There is a thin rule under the cholesterol information that spans the width of the table.
The next line is Sodium in bold followed by 190 and mg in lowercase. Right justified on the same line is 8 followed by a percent symbol. There is a thick rule under the sodium information that spans the width of the table.
The next line is Potassium followed by 20 and mg in lowercase. Right justified on the same line is 1 followed by a percent symbol. There is a thin rule under the potassium information that spans the width of the table.
The next line is Calcium followed by 200 and mg in lowercase. Right justified on the same line is 29 followed by a percent symbol. There is a thin rule below the calcium information that spans the width of the table.
The next line is Iron followed by 0.1 and mg in lowercase. Right justified on the same line is 1 followed by a percent symbol. There is a thick rule under the iron information that spans the width of the Nutrition Facts table.
The next line is the percent Daily Value footnote that was referred to at the beginning of the table description. The footnote starts with an asterisk followed by the statement: 5 percent symbol or less is a little, 15 percent symbol or more is a lot. The terms 'a little' and 'a lot' are in bold. This is the end of the Nutrition Facts table.
Tip: Limit your intake of processed cheese and cheese spreads. They are usually high in sodium.
Deli meat ham
Follow these 3 steps to find out how much sodium is in this food:
Step 1:
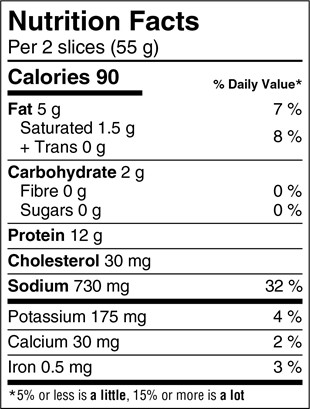
Look at the serving size on the nutrition facts table. The serving size for the deli ham is 2 slices (55 g). Compare this amount to the quantity that you actually eat.
Step 2:
Read the % DV (Daily Value) on the food label. 5% DV or less is a little and 15 % DV or more is a lot.
Step 3:
Choose wisely. Look closely at the label to see if this deli meat ham has a little or a lot of sodium.
Ham deli meat image - Text description
Shown here is a Nutrition Facts table. Left justified at the top of the table is the heading Nutrition Facts in bold. The next line is Per 2 slices open parenthesis 55 g close parenthesis. There is a thin rule below per 2 slices information that spans the width of the table. The next line is Calories in bold followed by 90, also in bold. Right justified on the same line is the subheading percent symbol Daily Value in bold. Percent Daily Value is followed by an asterisk that refers to a footnote at the bottom of the Nutrition Facts table. There is a thick rule under Calories that ends after the 90; it does not span the width of the table.
Left justified on the next line is Fat in bold followed by 5 and a lowercase g. Right justified on the same line is 7 followed by a percent symbol. Indented on the next line is Saturated followed by 1.5 and a lowercase g. Indented on the next line is a plus symbol followed by Trans, followed by 0 and a lowercase g. Right justified and vertically centered against the saturated and trans information on the left is 8 followed by a percent symbol. There is a thin rule below the trans information that spans the width of the table.
The next line is Carbohydrate in bold followed by 2 and a lowercase g. Indented on the next line is Fibre followed by 0 and a lowercase g. Right justified on the same line is 0 followed by a percent symbol. Indented on the next line is Sugars followed by 0 and a lowercase g. Right justified on the same line is 0 followed by a percent symbol. There is a thin rule under the sugars information that spans the width of the table.
The next line is Protein in bold followed by 12 and a lowercase g. There is a thin rule under the protein information that spans the width of the table.
The next line is Cholesterol, in bold followed by 30 and mg in lowercase. There is a thin rule under the cholesterol information that spans the width of the table.
The next line is Sodium in bold followed by 730 and mg in lowercase. Right justified on the same line is 32 followed by a percent symbol. There is a thick rule under the sodium information that spans the width of the table.
The next line is Potassium followed by 175 and mg in lowercase. Right justified on the same line is 4 followed by a percent symbol. There is a thin rule under the potassium information that spans the width of the table.
The next line is Calcium followed by 30 and mg in lowercase. Right justified on the same line is 2 followed by a percent symbol. There is a thin rule below the calcium information that spans the width of the table.
The next line is Iron followed by 0.5 and mg in lowercase. Right justified on the same line is 3 followed by a percent symbol. There is a thick rule under the iron information that spans the width of the Nutrition Facts table.
The next line is the percent Daily Value footnote that was referred to at the beginning of the table description. The footnote starts with an asterisk followed by the statement: 5 percent symbol or less is a little, 15 percent symbol or more is a lot. The terms 'a little' and 'a lot' are in bold. This is the end of the Nutrition Facts table.
Tip: Make sandwiches with homemade hummus, natural peanut butter, eggs or roasted meat more often.
Veggie burger
Follow these 3 steps to find out how much sodium is in this food:
Step 1:
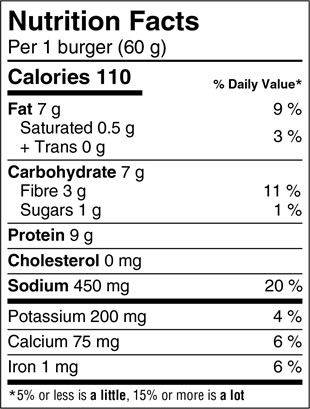
Look at the serving size on the nutrition facts table. The serving size for this veggie burger is 1 burger (60 g). Compare this amount to the quantity that you actually eat.
Step 2:
Read the % DV (Daily Value) on the food label. 5% DV or less is a little and 15 % DV or more is a lot.
Step 3:
Choose wisely. Look closely at the label to see if this veggie burger has a little or a lot of sodium.
Veggie burger image - Text description
Shown here is a Nutrition Facts table. Left justified at the top of the table is the heading Nutrition Facts in bold. The next line is Per 1 burger open parenthesis 60 g close parenthesis. There is a thin rule below per 1 burger information that spans the width of the table. The next line is Calories in bold followed by 110, also in bold. Right justified on the same line is the subheading percent symbol Daily Value in bold. Percent Daily Value is followed by an asterisk that refers to a footnote at the bottom of the Nutrition Facts table. There is a thick rule under Calories that ends after the 110; it does not span the width of the table.
Left justified on the next line is Fat in bold followed by 7 and a lowercase g. Right justified on the same line is 9 followed by a percent symbol. Indented on the next line is Saturated followed by 0.5 and a lowercase g. Indented on the next line is a plus symbol followed by Trans, followed by 0 and a lowercase g. Right justified and vertically centered against the saturated and trans information on the left is 3 followed by a percent symbol. There is a thin rule below the trans information that spans the width of the table.
The next line is Carbohydrate in bold followed by 7 and a lowercase g. Indented on the next line is Fibre followed by 3 and a lowercase g. Right justified on the same line is 11 followed by a percent symbol. Indented on the next line is Sugars followed by 1 and a lowercase g. Right justified on the same line is 1 followed by a percent symbol. There is a thin rule under the sugars information that spans the width of the table.
The next line is Protein in bold followed by 9 and a lowercase g. There is a thin rule under the protein information that spans the width of the table.
The next line is Cholesterol, in bold followed by 0 and mg in lowercase. There is a thin rule under the cholesterol information that spans the width of the table.
The next line is Sodium in bold followed by 450 and mg in lowercase. Right justified on the same line is 20 followed by a percent symbol. There is a thick rule under the sodium information that spans the width of the table.
The next line is Potassium followed by 200 and mg in lowercase. Right justified on the same line is 4 followed by a percent symbol. There is a thin rule under the potassium information that spans the width of the table.
The next line is Calcium followed by 75 and mg in lowercase. Right justified on the same line is 6 followed by a percent symbol. There is a thin rule below the calcium information that spans the width of the table.
The next line is Iron followed by 1 and mg in lowercase. Right justified on the same line is 6 followed by a percent symbol. There is a thick rule under the iron information that spans the width of the Nutrition Facts table.
The next line is the percent Daily Value footnote that was referred to at the beginning of the table description. The footnote starts with an asterisk followed by the statement: 5 percent symbol or less is a little, 15 percent symbol or more is a lot. The terms 'a little' and 'a lot' are in bold. This is the end of the Nutrition Facts table.
Tip: If you choose to eat this veggie burger, top it off with tomato, lettuce and/or onion instead of condiments such as ketchup, mustard and relish that are high in sodium.
Pepperoni and cheese pizza
Follow these 3 steps to find out how much sodium is in this food:
Step 1:
Look at the serving size on the nutrition facts table. The serving size for the pizza is 1/6 pizza (200 g). Compare this amount to the quantity that you actually eat.
Step 2:
Read the % DV (Daily Value) on the food label. 5% DV or less is a little and 15 % DV or more is a lot.
Step 3:
Choose wisely. Look closely at the label to see if this pizza has a little or a lot of sodium.
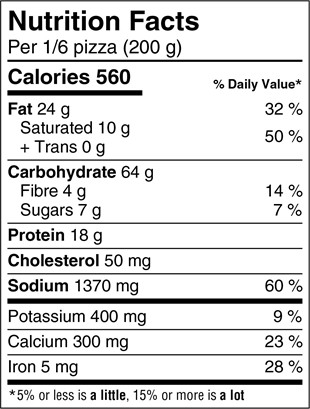
Pepperoni pizza image - Text description
Shown here is a Nutrition Facts table. Left justified at the top of the table is the heading Nutrition Facts in bold. The next line is Per 1/6 pizza open parenthesis 200 g close parenthesis. There is a thin rule below per 1/6 pizza information that spans the width of the table. The next line is Calories in bold followed by 560, also in bold. Right justified on the same line is the subheading percent symbol Daily Value in bold. Percent Daily Value is followed by an asterisk that refers to a footnote at the bottom of the Nutrition Facts table. There is a thick rule under Calories that ends after the 560; it does not span the width of the table.
Left justified on the next line is Fat in bold followed by 24 and a lowercase g. Right justified on the same line is 32 followed by a percent symbol. Indented on the next line is Saturated followed by 10 and a lowercase g. Indented on the next line is a plus symbol followed by Trans, followed by 0 and a lowercase g. Right justified and vertically centered against the saturated and trans information on the left is 50 followed by a percent symbol. There is a thin rule below the trans information that spans the width of the table.
The next line is Carbohydrate in bold followed by 64 and a lowercase g. Indented on the next line is Fibre followed by 4 and a lowercase g. Right justified on the same line is 14 followed by a percent symbol. Indented on the next line is Sugars followed by 7 and a lowercase g. Right justified on the same line is 7 followed by a percent symbol. There is a thin rule under the sugars information that spans the width of the table.
The next line is Protein in bold followed by 18 and a lowercase g. There is a thin rule under the protein information that spans the width of the table.
The next line is Cholesterol, in bold followed by 50 and mg in lowercase. There is a thin rule under the cholesterol information that spans the width of the table.
The next line is Sodium in bold followed by 1370 and mg in lowercase. Right justified on the same line is 60 followed by a percent symbol. There is a thick rule under the sodium information that spans the width of the table.
The next line is Potassium followed by 400 and mg in lowercase. Right justified on the same line is 9 followed by a percent symbol. There is a thin rule under the potassium information that spans the width of the table.
The next line is Calcium followed by 300 and mg in lowercase. Right justified on the same line is 23 followed by a percent symbol. There is a thin rule below the calcium information that spans the width of the table.
The next line is Iron followed by 5 and mg in lowercase. Right justified on the same line is 28 followed by a percent symbol. There is a thick rule under the iron information that spans the width of the Nutrition Facts table.
The next line is the percent Daily Value footnote that was referred to at the beginning of the table description. The footnote starts with an asterisk followed by the statement: 5 percent symbol or less is a little, 15 percent symbol or more is a lot. The terms 'a little' and 'a lot' are in bold. This is the end of the Nutrition Facts table.
Tip: Use less or no pepperoni, half the cheese and skip the olives and anchovies. Instead, add fresh vegetables like peppers, onions and mushrooms and garlic for extra flavour.
White bread
Follow these 3 steps to find out how much sodium is in this food:
Step 1:
Look at the serving size on the nutrition facts table. The serving size for white bread is 2 slices (75 g). Compare this amount to the quantity that you actually eat.
Step 2:
Read the % DV (Daily Value) on the food label. 5% DV or less is a little and 15 % DV or more is a lot.
Step 3:
Choose wisely. Look closely at the label to see if white bread has a little or a lot of sodium.
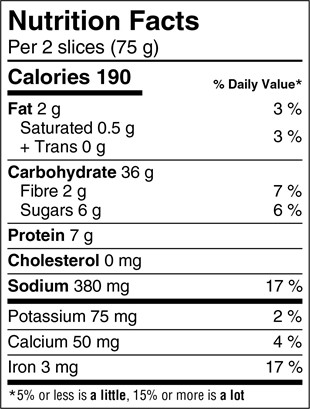
Wheat bread image - Text description
Shown here is a Nutrition Facts table. Left justified at the top of the table is the heading Nutrition Facts in bold. The next line is Per 2 slices open parenthesis 75 g close parenthesis. There is a thin rule below per 2 slices information that spans the width of the table. The next line is Calories in bold followed by 190, also in bold. Right justified on the same line is the subheading percent symbol Daily Value in bold. Percent Daily Value is followed by an asterisk that refers to a footnote at the bottom of the Nutrition Facts table. There is a thick rule under Calories that ends after the 190; it does not span the width of the table.
Left justified on the next line is Fat in bold followed by 2 and a lowercase g. Right justified on the same line is 3 followed by a percent symbol. Indented on the next line is Saturated followed by 0.5 and a lowercase g. Indented on the next line is a plus symbol followed by Trans, followed by 0 and a lowercase g. Right justified and vertically centered against the saturated and trans information on the left is 3 followed by a percent symbol. There is a thin rule below the trans information that spans the width of the table.
The next line is Carbohydrate in bold followed by 36 and a lowercase g. Indented on the next line is Fibre followed by 2 and a lowercase g. Right justified on the same line is 7 followed by a percent symbol. Indented on the next line is Sugars followed by 6 and a lowercase g. Right justified on the same line is 6 followed by a percent symbol. There is a thin rule under the sugars information that spans the width of the table.
The next line is Protein in bold followed by 7 and a lowercase g. There is a thin rule under the protein information that spans the width of the table.
The next line is Cholesterol, in bold followed by 0 and mg in lowercase. There is a thin rule under the cholesterol information that spans the width of the table.
The next line is Sodium in bold followed by 380 and mg in lowercase. Right justified on the same line is 17 followed by a percent symbol. There is a thick rule under the sodium information that spans the width of the table.
The next line is Potassium followed by 75 and mg in lowercase. Right justified on the same line is 2 followed by a percent symbol. There is a thin rule under the potassium information that spans the width of the table.
The next line is Calcium followed by 50 and mg in lowercase. Right justified on the same line is 4 followed by a percent symbol. There is a thin rule below the calcium information that spans the width of the table.
The next line is Iron followed by 3 and mg in lowercase. Right justified on the same line is 17 followed by a percent symbol. There is a thick rule under the iron information that spans the width of the Nutrition Facts table.
The next line is the percent Daily Value footnote that was referred to at the beginning of the table description. The footnote starts with an asterisk followed by the statement: 5 percent symbol or less is a little, 15 percent symbol or more is a lot. The terms 'a little' and 'a lot' are in bold. This is the end of the Nutrition Facts table.
Tip: Choose bread, breakfast cereals and bakery products that are lowest in sodium.
Regular instant oatmeal
Follow these 3 steps to find out how much sodium is in this food:
Step 1:
Look at the serving size on the nutrition facts table. The serving size for the regular instant oatmeal is 1 packet (40 g). Compare this amount to the quantity that you actually eat.
Step 2:
Read the % DV (Daily Value) on the food label. 5% DV or less is a little and 15 % DV or more is a lot.
Step 3:
Choose wisely. Look closely at the label to see if regular instant oatmeal has a little or a lot of sodium.

Instant oatmeal image - Text description
Shown here is a Nutrition Facts table. Left justified at the top of the table is the heading Nutrition Facts in bold. The next line is Per 1 packet open parenthesis 40 g close parenthesis. There is a thin rule below per 1 packet information that spans the width of the table. The next line is Calories in bold followed by 180, also in bold. Right justified on the same line is the subheading percent symbol Daily Value in bold. Percent Daily Value is followed by an asterisk that refers to a footnote at the bottom of the Nutrition Facts table. There is a thick rule under Calories that ends after the 180; it does not span the width of the table.
Left justified on the next line is Fat in bold followed by 7 and a lowercase g. Right justified on the same line is 9 followed by a percent symbol. Indented on the next line is Saturated followed by 0.5 and a lowercase g. Indented on the next line is a plus symbol followed by Trans, followed by 0 and a lowercase g. Right justified and vertically centered against the saturated and trans information on the left is 3 followed by a percent symbol. There is a thin rule below the trans information that spans the width of the table.
The next line is Carbohydrate in bold followed by 25 and a lowercase g. Indented on the next line is Fibre followed by 4 and a lowercase g. Right justified on the same line is 14 followed by a percent symbol. Indented on the next line is Sugars followed by 3 and a lowercase g. Right justified on the same line is 3 followed by a percent symbol. There is a thin rule under the sugars information that spans the width of the table.
The next line is Protein in bold followed by 4 and a lowercase g. There is a thin rule under the protein information that spans the width of the table.
The next line is Cholesterol, in bold followed by 0 and mg in lowercase. There is a thin rule under the cholesterol information that spans the width of the table.
The next line is Sodium in bold followed by 180 and mg in lowercase. Right justified on the same line is 8 followed by a percent symbol. There is a thick rule under the sodium information that spans the width of the table.
The next line is Potassium followed by 75 and mg in lowercase. Right justified on the same line is 2 followed by a percent symbol. There is a thin rule under the potassium information that spans the width of the table.
The next line is Calcium followed by 10 and mg in lowercase. Right justified on the same line is 1 followed by a percent symbol. There is a thin rule below the calcium information that spans the width of the table.
The next line is Iron followed by 1 and mg in lowercase. Right justified on the same line is 6 followed by a percent symbol. There is a thick rule under the iron information that spans the width of the Nutrition Facts table.
The next line is the percent Daily Value footnote that was referred to at the beginning of the table description. The footnote starts with an asterisk followed by the statement: 5 percent symbol or less is a little, 15 percent symbol or more is a lot. The terms 'a little' and 'a lot' are in bold. This is the end of the Nutrition Facts table.
Tip: Try cooking your own quick oatmeal with large oat flakes and milk or water for a lower sodium version. Flavour it with cinnamon and raisins.
Wheat crackers
Follow these 3 steps to find out how much sodium is in this food:
Step 1:
Look at the serving size on the nutrition facts table. The serving size for the wheat crackers is 4 crackers (20 g). Compare this amount to the quantity that you actually eat.
Step 2:
Read the % DV (Daily Value) on the food label. 5% DV or less is a little and 15 % DV or more is a lot.
Step 3:
Choose wisely. Look closely at the label to see if wheat crackers have a little or a lot of sodium.
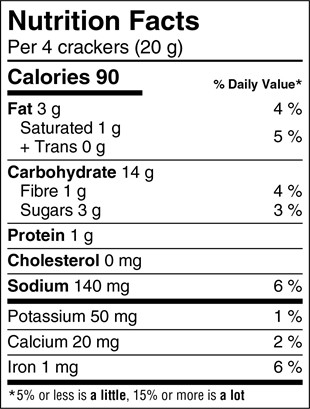
Wheat crackers image - Text description
Shown here is a Nutrition Facts table. Left justified at the top of the table is the heading Nutrition Facts in bold. The next line is Per 4 crackers open parenthesis 20 g close parenthesis. There is a thin rule below per 4 crackers information that spans the width of the table. The next line is Calories in bold followed by 90, also in bold. Right justified on the same line is the subheading percent symbol Daily Value in bold. Percent Daily Value is followed by an asterisk that refers to a footnote at the bottom of the Nutrition Facts table. There is a thick rule under Calories that ends after the 90; it does not span the width of the table.
Left justified on the next line is Fat in bold followed by 3 and a lowercase g. Right justified on the same line is 4 followed by a percent symbol. Indented on the next line is Saturated followed by 1 and a lowercase g. Indented on the next line is a plus symbol followed by Trans, followed by 0 and a lowercase g. Right justified and vertically centered against the saturated and trans information on the left is 5 followed by a percent symbol. There is a thin rule below the trans information that spans the width of the table.
The next line is Carbohydrate in bold followed by 14 and a lowercase g. Indented on the next line is Fibre followed by 1 and a lowercase g. Right justified on the same line is 4 followed by a percent symbol. Indented on the next line is Sugars followed by 3 and a lowercase g. Right justified on the same line is 3 followed by a percent symbol. There is a thin rule under the sugars information that spans the width of the table.
The next line is Protein in bold followed by 1 and a lowercase g. There is a thin rule under the protein information that spans the width of the table.
The next line is Cholesterol, in bold followed by 0 and mg in lowercase. There is a thin rule under the cholesterol information that spans the width of the table.
The next line is Sodium in bold followed by 140 and mg in lowercase. Right justified on the same line is 6 followed by a percent symbol. There is a thick rule under the sodium information that spans the width of the table.
The next line is Potassium followed by 50 and mg in lowercase. Right justified on the same line is 1 followed by a percent symbol. There is a thin rule under the potassium information that spans the width of the table.
The next line is Calcium followed by 20 and mg in lowercase. Right justified on the same line is 2 followed by a percent symbol. There is a thin rule below the calcium information that spans the width of the table.
The next line is Iron followed by 1 and mg in lowercase. Right justified on the same line is 6 followed by a percent symbol. There is a thick rule under the iron information that spans the width of the Nutrition Facts table.
The next line is the percent Daily Value footnote that was referred to at the beginning of the table description. The footnote starts with an asterisk followed by the statement: 5 percent symbol or less is a little, 15 percent symbol or more is a lot. The terms 'a little' and 'a lot' are in bold. This is the end of the Nutrition Facts table.
Tip: Buy crackers that are lower in sodium whenever possible. Look for the words "low sodium", "reduced sodium" or "unsalted" on the package.