
Consumer Product Safety Program Annual Surveillance Report: 2020
On this page:
- Introduction
- Consumer products
- Cosmetics
- Conclusion
- How to report an incident involving a consumer product or cosmetic
- Contact us
Introduction
This report describes the surveillance findings gathered by the Consumer Product Safety Program (CPSP) within Health Canada. The CPSP is responsible for the administration and enforcement of the Canada Consumer Product Safety Act (CCPSA) and its regulations, as well as cosmetic-related provisions of the Food and Drugs Act (FDA) and the Cosmetic Regulations. The purpose of the CCPSA is to protect the public by addressing or preventing dangers to human health or safety that are posed by consumer products in Canada, including those that circulate within Canada as well as those that are imported. Similarly, the purpose of the Cosmetic Regulations and the associated portions of the FDA are to protect Canadians from risks that may be posed by cosmetics.
Within Health Canada, the CPSP promotes, monitors, verifies and enforces compliance with the CCPSA and the FDA. It reviews incidentFootnote 1 reports submitted by industryFootnote 2 and consumers and regularly monitors the marketplace to identify potentially dangerous products. The CPSP also gathers information domestically and internationally about injuries, emerging issues and new science related to consumer product and cosmetic safety. This information is then used to help conduct routine sampling and testing of products in the marketplace and support partnerships with the Canada Border Services Agency (CBSA) and other domestic and international regulators to verify the compliance of products being imported into Canada.
The CPSP also uses this information to evaluate risks to Canadians posed by consumer products and cosmetics. For example, it conducts assessments to understand and highlight the relative level of risk posed by a consumer product or cosmetic. This allows for the strategic assignment of program resources towards products that pose the greatest risk to Canadians. When reviewing incoming incident reports, the CPSP uses a triage-based approach to identify product-related health and safety concern for follow-up risk assessment and possible compliance and enforcement activity. It carefully monitors issues that do not require immediate attention so that it is prepared to take action if the risk changes over time. Finally, the CPSP provides credible information to consumers and provides tools to help guide informed decision-making by the public.
This is the fourth publicly available Annual Surveillance Report. This report presents a summary of all product incident data reported to the CPSP between January 1, 2020, and December 31, 2020, that meet either of the below definitions:
- A consumer product is a product, including its components, parts or accessories, that may reasonably be expected to be obtained by an individual to be used for non-commercial purposes, including for domestic, recreational and sports purposes, and includes its packaging (Canada Consumer Product Safety Act, Section 2); and
- A cosmetic includes any substance or mixture of substances manufactured, sold or represented for use in cleansing, improving, or altering the complexion, skin, hair, or teeth, and includes deodorants and perfumes (Food and Drugs Act, Section 2).
All of the reported incidents include products that are sold within the Canadian marketplace, whether the incidents occurred domestically (77%) or internationally (23%)Footnote 3.
The data has been divided by incidents pertaining to consumer products and cosmetics. Under the CCPSA, industry must report health or safety incidents involving consumer products to Health Canada. This mandatory reporting provides Health Canada with a broad understanding of health- or safety-related incidents that occur with consumer products. There are no mandatory incident reporting requirements for cosmetics under the FDA. Finally, each subdivided section provides a table to illustrate the top 10 products reported overall as well as those associated with incident reports of injuries and deaths, with information concerning the hazards and injuries mentioned in the incident report for those products. All of the injuries reported are grouped into different levels of severity (unknown, minor, or life threatening for example). These levels correspond to the overall risk that was reported and relies on factors such as: whether medical treatment was sought, whether the injury was described as being sustained by a vulnerable population and whether that injury was reversible.
The categorization of consumer products was carried out using the U.S. Consumer Product Safety Commission's National Electronic Injury Surveillance System (NEISS) coding manual. The categorization of cosmetic products was based on the function of the product using CPSP's Notification of Cosmetics guidelines.
The information in this Annual Surveillance Report reflects the information provided in the incident reports submitted to the CPSP by industry and consumers (including media articles, governmental organizations, fire services, police, coroners, etc.); it does not capture all incidents in Canada. Reports submitted to the CPSP express opinions or observations of the individuals who wrote them and may not always identify a health or safety concern with a particular product or include a thorough description of the incident. CPSP acknowledges that a given event may be due to an underlying condition, product misuse or coincidental factors. The CPSP takes a risk-based approach and does not validate the claims of every report received.
The CPSP reviews reports on an ongoing basis thus the statistics in this Annual Surveillance Report should be considered dynamic and subject to change.
Consumer products
Total reports received in 2020 from consumers and industry
1,986 consumer product reports were received between January 1, 2020, and December 31, 2020, of which 28 mentioned a death and 704 mentioned a non-fatal injury
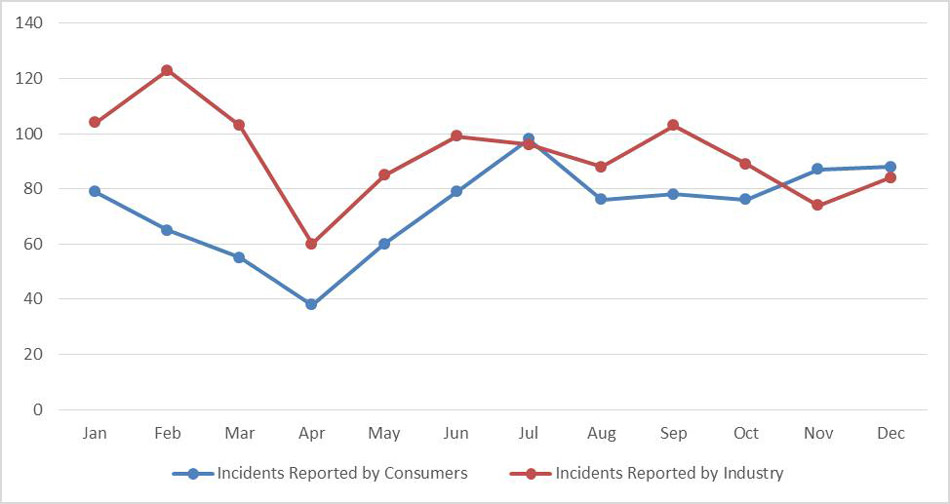
Figure 1 - Text Description
| Month and Year Report Received | Number of Incident Reports Received | ||
|---|---|---|---|
| Incident Reported by Consumer | Incident Reported by Industry | Grand Total | |
| Jan | 79 | 104 | 183 |
| Feb | 65 | 123 | 188 |
| Mar | 55 | 103 | 158 |
| Apr | 38 | 60 | 98 |
| May | 60 | 85 | 145 |
| Jun | 79 | 99 | 178 |
| Jul | 98 | 96 | 194 |
| Aug | 76 | 88 | 164 |
| Sep | 78 | 103 | 181 |
| Oct | 76 | 89 | 165 |
| Nov | 87 | 74 | 161 |
| Dec | 88 | 84 | 172 |
| Grand Total | 879 | 1108 | 1987 |
In 2020, the CPSP had an average of 166 reports received per month. March and April show the largest decrease in reports received, especially for industry reports. The decrease seen between February and May could be due to the COVID-19 pandemic, which resulted in many businesses within Canada and internationally closing temporarily. Overall, the remainder of 2020 saw a decrease in reports compared to the previous year, however, there was a higher number of consumer reports in July compared to the rest of 2020 or compared to 2019. Although this increase cannot be attributed to any single product, there were more consumer reports of 'electric ranges or ovens', 'baby walkers or jumpers', and 'surge suppressors or power strips' during July compared to other months.
Top 10 consumer products reported
The CPSP received a total of 1,986 consumer product incident reports in 2020, covering 300 different product types. The vast majority (84%) of these product types had only 10 or less incident reports submitted per product type, accounting for 37% of the total number of cases received. By comparison, the 10 most reported product types accounted for 31% of all reports received.
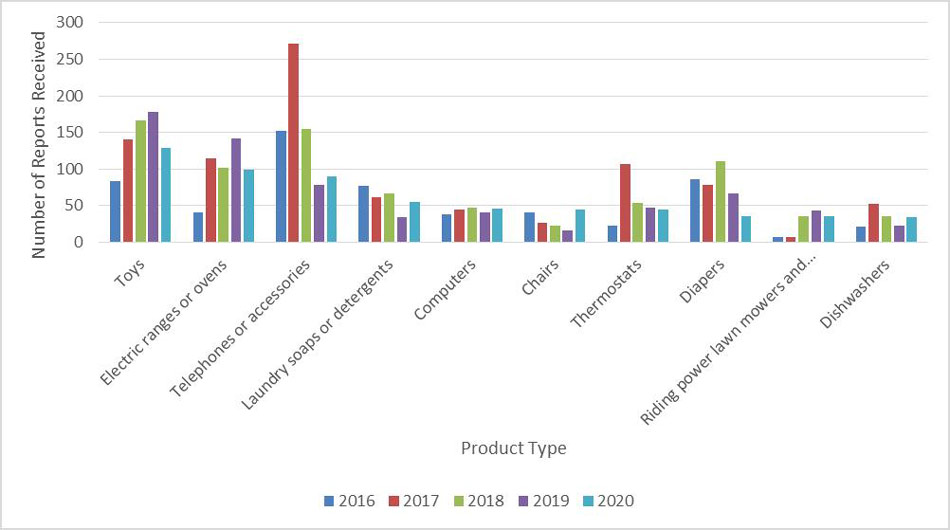
Figure 2 - Text Description
| Product Type | Year | ||||
|---|---|---|---|---|---|
| 2016 | 2017 | 2018 | 2019 | 2020 | |
| Toys | 84 | 140 | 167 | 178 | 129 |
| Electric ranges or ovens | 41 | 114 | 101 | 142 | 99 |
| Telephones or accessories | 152 | 271 | 155 | 78 | 90 |
| Laundry soaps or detergents | 77 | 61 | 67 | 34 | 55 |
| Computers | 38 | 44 | 47 | 40 | 46 |
| Chairs | 40 | 26 | 22 | 16 | 45 |
| Thermostats | 23 | 107 | 54 | 47 | 44 |
| Diapers | 86 | 78 | 111 | 67 | 36 |
| Riding power lawn mowers and garden tractors | 7 | 7 | 35 | 43 | 36 |
| Dishwashers | 21 | 52 | 35 | 23 | 34 |
The figure above shows the number of reports that the Consumer Product Safety Program has received over the last 5 years for the top 10 consumer product types reported in 2020. The majority of these product types have been within the top 10 most reported product types year after year. Details on this year's top 10 consumer products are below.
Note: Totals do not always add up to 100% due to rounding.
Toys
Number of reports received in 2020
From consumers: 48
From industry: 81
Total: 129
The following information is presented in a slightly different format than other products. In order to accurately and easily communicate the large variety of toys available in the Canadian market (including more than 30 different NEISS product types), all toys were grouped together here, including:
- blocks, stacking toys or pull toys,
- building sets,
- dolls, plush toys, and action figures,
- infant and toddler play centres,
- toy guns with projectiles,
- toy vehicles (excluding riding toys.
The top hazards reported included:
- 24% (31 of 129) toxicologicalFootnote 4 (asterisk) *,
- 23% (30 of 129) small part, and
- 19% (24 of 129) sharp edge or point.
52% (67 of 129) of the reports did not mention an injury.
The remaining 48% (62 of 129) of the reports mentioned injuries, of which:
- 58% (36 of 62) were moderate,
- 24% (15 of 62) were minor,
- 13% (8 of 62) did not have sufficient detail and were classified as unknown, and
- 5% (3 of 62) were severe.
The most common injuries reported were cuts, irritation or allergic reactions, bruises, and asphyxia.
Electric ranges or ovens
Number of reports received in 2020
From consumers: 58
From industry: 41
Total: 99
The top hazards reported included:
- 33% (33 of 99) excessive heat/overheating,
- 17% (17 of 99) fire, and
- 16% (16 of 99) sharp edge or point.
85% (84 of 99) of the reports did not mention an injury.
The remaining 15% (15 of 99) of the reports mentioned injuries, of which:
- 47% (7 of 15) did not have sufficient detail and were classified as unknown,
- 27% (4 of 15) were minor, and
- 27% (4 of 15) were moderate.
The most common injuries reported were cuts and burns.
Telephones or accessories
Number of reports received in 2020
From consumers: 9
From industry: 81
Total: 90
The top hazards reported included:
- 31% (28 of 90) excessive heat/overheating,
- 29% (26 of 90) fire, and
- 10% (9 of 90) smoke.
59% (53 of 90) of the reports did not mention an injury.
The remaining 41% (37 of 90) of the reports mentioned injuries, of which:
- 73% (27 of 37) were minor,
- 16% (6 of 37) did not have sufficient detail and were classified as unknown, and
- 11% (4 of 37) were moderate.
The most common injuries reported were burns, cuts, and electric shock.
Laundry soaps or detergents
Number of reports received in 2020
From consumers: 8
From industry: 47
Total: 55
The top hazards reported included:
- 98% (54 of 55) toxicologicalFootnote 4 (asterisk) *, and
- 2% (1 of 5) slippery surface.
2% (1 of 55) of the reports did not mention an injury.
The remaining 98% (54 of 55) of the reports mentioned injuries, of which:
- 61% (33 of 54) were severe,
- 13% (7 of 54) were moderate,
- 11% (6 of 54) were fatal,
- 9% (5 of 54) were life threatening or disabling,
- 4% (2 of 54) were minor, and
- 2% (1 of 54) did not have sufficient detail and were classified as unknown.
The most common injuries reported were irritation or allergic reaction and poisoning.
Computers
Number of reports received in 2020
From consumers: 11
From industry: 35
Total: 46
The top hazards reported included:
- 30% (14 of 46) fire,
- 20% (9 of 46) smoke, and
- 17% (8 of 46) excessive heat.
85% (39 of 46) of the reports did not mention an injury.
The remaining 15% (7 of 46) of the reports mentioned injuries, of which:
- 57% (4 of 7) were minor, and
- 43% (3 of 7) were moderate.
The most common injuries reported were burns.
Chairs
Number of reports received in 2020
From consumers: 7
From industry: 38
Total: 45
The top hazards reported included:
- 42% (19 of 45) broken part,
- 24% (11 of 45) collapse, and
- 11% (5 of 45) instability.
13% (6 of 45) of the reports did not mention an injury.
The remaining 87% (39 of 45) of the reports mentioned injuries, of which:
- 36% (14 of 39) were minor,
- 31% (12 of 39) were moderate,
- 26% (10 of 39) did not have sufficient detail and were classified as unknown, and
- 8% (3 of 39) were severe.
The most common injuries reported were bruises, cuts, and fractures.
Thermostats
Number of reports received in 2020
From consumers: 34
From industry: 10
Total: 44
The top hazards reported included:
- 36% (16 of 44) fire,
- 25% (11 of 44) combustion, and
- 21% (9 of 44) excessive heat/overheating.
100% (44 of 44) of the reports did not mention an injury.
Diapers
Number of reports received in 2020
From consumers: 1
From industry: 35
Total: 36
The top hazards reported included:
- 89% (32 of 36) toxicologicalFootnote 4 (asterisk) *, and
- 6% (2 of 36) small part.
3% (1 of 36) of the reports did not mention an injury.
The remaining 97% (35 of 36) of the reports mentioned injuries, of which:
- 69% (24 of 35) were severe,
- 26% (9 of 35) were moderate, and
- 6% (2 of 35) were minor.
The most common injuries reported were irritations or allergic reactions.
Riding power lawn mowers and garden tractors
Number of reports received in 2020
From consumers: 3
From industry: 33
Total: 36
The top hazards reported included:
- 25% (9 of 36) instability or tip over,
- 19% (7 of 36) struck by or against, and
- 11% (4 of 36) fire.
11% (4 of 36) of the reports did not mention an injury.
The remaining 89% (32 of 36) of the reports mentioned injuries, of which:
- 38% (12 of 32) were fatal,
- 19% (6 of 32) did not have sufficient detail and were classified as unknown severity,
- 16% (5 of 32) were moderate,
- 13% (4 of 32) were severe,
- 13% (4 of 32) were life threatening or disabling, and
- 3% (1 of 32) were minor.
The most common injuries reported were amputations, cuts, burns, and fractures.
Dishwashers
Number of reports received in 2020
From consumers: 24
From industry: 10
Total: 34
The top hazards reported included:
- 47% (16 of 34) fire,
- 24% (8 of 34) combustion, and
- 18% (6 of 34) smoke.
97% (33 of 34) of the reports did not mention an injury.
The remaining 3% (1 of 34) of the reports mentioned a minor poisoning injury.
All consumer products reported that mentioned a death
In 2020, there were 28 incident reports related to 12 different product types, which mentioned at least one death.
Riding power lawn mowers and garden tractors
Number of reports received in 2020 that mentioned a death
From consumers: 2
From industry: 10
Total: 12
Of the reported deaths:
- 9 were described as overturning/roll overs of the products that ejected, pinned or crushed the consumers;
- 2 involved collisions with motor vehicles; and
- 1 involved the tractor rolling down a hill and striking a bystander.
Laundry soaps or detergents
Number of reports received in 2020 that mentioned a death
From consumers: 0
From industry: 6
Total: 6
The 6 reported deaths were described as being due to poisonings from ingestion of the product.
Generators or power plants
Number of reports received in 2020 that mentioned a death
From consumers: 2
From industry: 0
Total: 2
The 2 reported deaths were described as being due to poisoning from carbon monoxide.
Lighters
Number of reports received in 2020 that mentioned a death
From consumers: 1
From industry: 0
Total: 1
The reported death was described as being due to an explosion triggered by a propane log lighter.
Baby strollers
Number of reports received in 2020 that mentioned a death
From consumers: 0
From industry: 1
Total: 1
The reported death was described as being due to entanglement of clothing on the product.
Car seats (for infants or children)
Number of reports received in 2020 that mentioned a death
From consumers: 0
From industry: 1
Total: 1
The reported death was described as being due to a child thrown out of the car seat during a car accident.
Candles or candle holders
Number of reports received in 2020 that mentioned a death
From consumers: 0
From industry: 1
Total: 1
The reported death was described as being due to a fire caused by a candle.
Baby slings and wraps
Number of reports received in 2020 that mentioned a death
From consumers: 0
From industry: 1
Total: 1
The reported death was described as being due to asphyxia caused by improper positioning of the infant.
Personal protection devices (i.e., wearable medical alert devices)
Number of reports received in 2020 that mentioned a death
From consumers: 0
From industry: 1
Total: 1
There was insufficient information to determine the exact cause of death, and it is unknown if the product was the cause of the death. It was reported that the device had stopped working.
Bassinets or cradles
Number of reports received in 2020 that mentioned a death
From consumers: 1
From industry: 0
Total: 1
There was insufficient information to determine the exact cause of death, and it is unknown if the product was the cause of the death. It was reported that the infant was found unresponsive while in the product.
Propane, LP or butane gas tanks or fittings
Number of reports received in 2020 that mentioned a death
From consumers: 0
From industry: 1
Total: 1
The reported death was described as being due to burns from a fire.
Top 10 consumer products reported that mentioned a non-fatal injury
Of the 1,986 reports received by CPSP over the course of 2020, 704 mention a non-fatal injury. This table displays the top 10 consumer product types that contributed to the majority of those injuries.
Totals do not always add up to 100% due to rounding.
Toys
Number of reports received in 2020 that mentioned an injury
From consumers: 10
From industry: 52
Total: 62
The following information is presented in a slightly different format than other products. In order to accurately and easily communicate the large variety of toys available in the Canadian market (including more than 30 different NEISS product types), all toys were grouped together here, including:
- balloons,
- balls,
- blocks, stacking toys or pull toys,
- building sets,
- dolls, plush toys, and action figures, and
- toy guns with projectiles.
40% (25 of 62) of the injuries reported were described as cuts:
- 60% (15 of 25) were moderate,
- 16% (4 of 25) were minor,
- 16% (4 of 25) did not have sufficient detail and were classified as unknown, and
- 8% (2 of 25) were severe.
15% (9 of 62) of the injuries reported were described as irritations or allergic reactions:
- 67% (6 of 9) were moderate,
- 22% (2 of 9) were minor, and
- 11% (1 of 9) did not have sufficient detail and were classified as unknown.
13% (8 of 62) of the injuries reported were described as bruises:
- 63% (5 of 8) were moderate, and
- 38% (3 of 8) were minor.
10% (6 of 62) of the injuries reported were described as asphyxia:
- 83% (5 of 6) were minor, and
- 17% (1 of 6) were moderate.
9% (6 of 62) of the injuries did not have sufficient detail and were classified as unknown; however, 3 were described generally as moderate.
5% (3 of 62) of the injuries reported were described as moderate fractures.
3% (2 of 62) of the injuries reported were described as moderate or unknown burns.
3% (2 of 62) of the injuries reported were described as presence of foreign object with moderate or severe injuries.
2% (1 of 62) of the injuries reported were described as a moderate poisoning.
The most common hazards reported were sharp edge or point, toxicologicalFootnote 4 (asterisk) *, small part, entrapment, and struck by or against.
Laundry soaps or detergents
Number of reports received in 2020 that mentioned an injury
From consumers: 7
From industry: 41
Total: 48
63% (30 of 48) of the injuries reported were described as irritations or allergic reactions:
- 53% (16 of 30) were severe,
- 20% (6 of 30) were moderate,
- 17% (5 of 30) were life threatening or disabling,
- 7% (2 of 30) were minor, and
- 3% (1 of 30) did not have sufficient detail and were classified as unknown.
35% (17 of 48) of the injuries reported were described as poisoning by ingestion of the product:
- 94% (16 of 17) were severe, and
- 6% (1 of 17) were moderate.
2% (1 of 48) of the injuries reported were described as fracture from slipping on spilled laundry detergent.
The most common hazard reported was toxicologicalFootnote 4 (asterisk) *.
Chairs
Number of reports received in 2020 that mentioned an injury
From consumers: 4
From industry: 34
Total: 38
37% (14 of 38) of the injuries reported did not have sufficient detail and were classified as unknown.
24% (9 of 38) of the injuries reported were described as bruises:
- 44% (4 of 9) were moderate,
- 44% (4 of 9) did not have sufficient detail and were classified as unknown, and
21% (8 of 38) of the injuries reported were described as cuts:
- 63% (5 of 8) were minor, and
- 38% (3 of 8) were moderate.
11% (4 of 38) of the injuries reported were described as fractures:
- 75% (3 of 4) were severe, and
- 25% (1 of 4) were moderate.
8% (3 of 38) of the injuries reported were described as sprains/strains:
- 67% (2 of 3) were minor, and
- 33% (1 of 3) were moderate.
The most common hazards reported were broken part, collapse, instability, and sharp edge or point.
Telephones or accessories
Number of reports received in 2020 that mentioned an injury
From consumers: 2
From industry: 35
Total: 37
70% (26 of 37) of the injuries reported were described as burns:
- 81% (21 of 26) were minor,
- 15% (4 of 26) did not have sufficient detail and were classified as unknown, and
- 4% (1 of 26) were moderate.
11% (4 of 37) of the injuries reported were described as cuts:
- 50% (2 of 4) were minor, and
- 50% (2 of 4) were moderate.
11% (4 of 37) of the injuries reported were described as electric shocks:
- 75% (3 of 4) were minor, and
- 25% (1 of 4) were moderate.
3% (1 of 37) of the injuries reported were described as minor asphyxia.
3% (1 of 37) of the injuries reported were described as irritation or allergic reaction.
3% (1 of 37) of the injuries reported did not have sufficient detail and were classified as unknown.
The most commons hazards reported were excessive heat, fire, and explosion.
Diapers
Number of reports received in 2020 that mentioned an injury
From consumers: 0
From industry: 35
Total: 35
86% (30 of 35) of the injuries reported were described as irritations or allergic reactions:
- 77% (23 of 30) were severe, and
- 23% (7 of 30) were moderate.
9% (3 of 35) of the injuries reported were described as asphyxia:
- 67% (2 of 3) were minor, and
- 33% (1 of 3) were moderate.
3% (1 of 35) of the injuries reported were described as moderate cuts.
3% (1 of 35) of the injuries reported were described as severe in nature but did not have sufficient detail to determine the exact injury type.
The most common hazard reported was toxicologicalFootnote 4 (asterisk) *.
Riding power lawn mowers and garden tractors
Number of reports received in 2020 that mentioned an injury
From consumers: 0
From industry: 20
Total: 20
45% (9 of 20) of the injuries reported did not have sufficient detail and were classified as unknown.
15% (3 of 20) of the injuries reported were described as amputations:
- 67% (2 of 3) were life threatening or disabling, and
- 33% (1 of 3) were severe.
15% (3 of 20) of the injuries reported were described as cuts:
- 33% (1 of 3) were life threatening or disabling, and
- 33% (1 of 3) were severe, and
- 33% (1 of 3) were moderate.
10% (2 of 20) of the injuries reported were described as burns:
- 50% (1 of 2) were moderate, and
- 50% (1 of 2) were minor.
10% (2 of 20) of the injuries reported were described as fractures:
- 50% (1 of 2) were life threatening or disabling, and
- 50% (1 of 2) were moderate.
5% (1 of 20) of the injuries reported were described as being moderate sprains or strains.
The most common hazard reported were struck by or against, sharp edge or point and instability.
Electric ranges or ovens
Number of reports received in 2020 that mentioned an injury
From consumers: 7
From industry: 8
Total: 15
33% (5 of 15) of the injuries reported were described as cuts:
- 40% (2 of 5) were moderate,
- 40% (2 of 5) did not have sufficient detail and were classified as unknown, and
- 20% (1 of 5) were minor.
20% (3 of 15) of the injuries reported were described as minor burns.
20% (3 of 15) of the injuries did not have sufficient detail and were classified as unknown.
13% (2 of 15) of the injuries reported were described as moderate asphyxia.
13% (2 of 15) of the injuries reported were described as electric shock with an unknown injury severity.
The most common hazards reported were excessive heat/overheating, sharp edge or point, and toxicologicalFootnote 4 (asterisk) *.
Nonelectric razors
Number of reports received in 2020 that mentioned an injury
From consumers: 1
From industry: 13
Total: 14
79% (11 of 14) of the injuries reported were described as cuts:
- 82% (9 of 11) were moderate,
- 9% (1 of 11) were severe, and
- 9% (1 of 11) were minor.
14% (2 of 14) of the injuries reported were described as severe irritations or allergic reactions.
7% (1 of 14) of the injuries reported were described as moderate in nature but did not have sufficient detail to determine the exact injury type.
The most common hazard reported was sharp edge or point.
Beach chairs
Number of reports received in 2020 that mentioned an injury
From consumers: 0
From industry: 13
Total: 13
31% (4 of 13) of the injuries reported were described as cuts:
- 50% (2 of 4) were moderate,
- 25% (1 of 4) were severe, and
- 25% (1 of 4) did not have sufficient detail and were classified as unknown.
31% (4 of 13) of the injuries reported did not have sufficient detail and were classified as unknown.
15% (2 of 13) of the injuries reported were described as bruises of unknown injury severity.
8% (1 of 13) of the injuries reported were described as moderate burns.
8% (1 of 13) of the injuries reported were described as moderate fractures.
8% (1 of 13) of the injuries reported were described as moderate sprains or strains.
The most common hazards reported were broken part, collapse, and instability.
Desks, dressers, chests, bureaus, or buffets
Number of reports received in 2020 that mentioned an injury
From consumers: 3
From industry: 10
Total: 13
69% (9 of 13) of the injuries reported were described as bruises:
- 67% (6 of 9) were minor,
- 22% (2 of 9) did not have sufficient detail and were classified as unknown, and
- 11% (1 of 9) were severe.
16% (2 of 13) of the injuries reported did not have sufficient detail to determine the type of injury, but were considered minor in severity.
15% (2 of 13) of the injuries reported were described as cuts:
- 50% (1 of 2) were severe, and
- 50% (1 of 2) were minor.
The most common hazards reported were tip over and struck by or against.
Drinking glasses
Number of reports received in 2020 that mentioned an injury
From consumers: 2
From industry: 11
Total: 13
62% (8 of 13) of the injuries reported were described as burns:
- 63% (5 of 8) were moderate,
- 25% (2 of 8) were minor, and
- 13% (1 of 8) did not have sufficient detail and were classified as unknown.
23% (3 of 13) of the injuries reported were described as moderate cuts.
8% (1 of 13) of the injuries reported were described as moderate bruises.
8% (1 of 13) of the injuries reported were described as moderate fractures.
The most common hazards reported were leaks and struck by or against.
Find out more about consumer products.
Cosmetics
Total reports received in 2020 from consumers and industry
123 cosmetic reports were received between January 1, 2020, and December 31, 2020, of which 63 mentioned a non-fatal injury
Cosmetics do not have any mandatory incident reporting requirements for industry under either the Food and Drugs Act or the Cosmetics Regulations. All reports received by industry are voluntary.
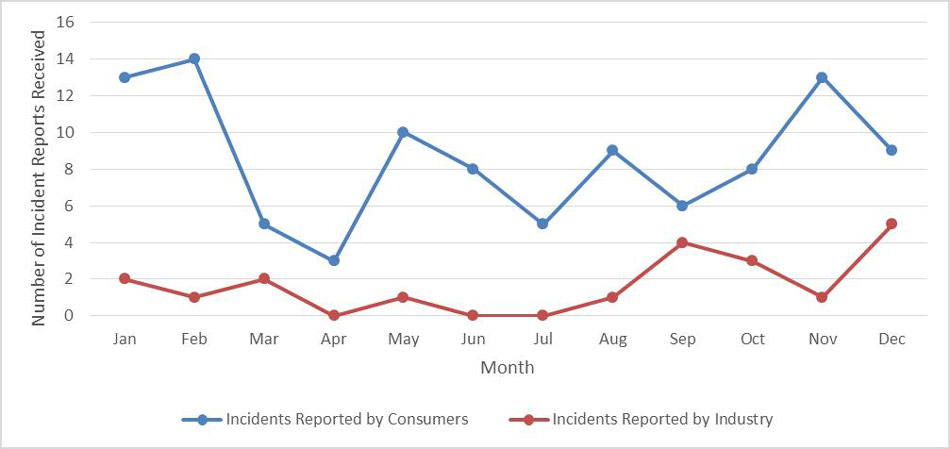
Figure 3 - Text Description
| Month and Year Report Received | Number of Incident Reports Received | ||
|---|---|---|---|
| Incident Reported by Consumer | Incident Reported by Industry | Grand Total | |
| Jan | 13 | 2 | 15 |
| Feb | 14 | 1 | 15 |
| Mar | 5 | 2 | 7 |
| Apr | 3 | 0 | 3 |
| May | 10 | 1 | 11 |
| Jun | 8 | 0 | 8 |
| Jul | 5 | 0 | 5 |
| Aug | 9 | 1 | 10 |
| Sep | 6 | 4 | 10 |
| Oct | 8 | 3 | 11 |
| Nov | 13 | 1 | 14 |
| Dec | 9 | 5 | 14 |
| Grand Total | 103 | 20 | 123 |
Top 10 cosmetic products reported
51% (63 of 123) of the cosmetic reports received between January 2020 and December 2020 mentioned injuries, and 87% (107 of 123) of the reports received were concerning toxicologicalFootnote 4 (asterisk) * hazards. The top 10 product types reported here are also the top 10 product types associated with the description of an injury.
Totals do not always add up to 100% due to rounding.
Cleansers
Number of reports received in 2020
From consumers: 18
From industry: 10
Total: 28
Of the 28 reports, 68% (19 of 28) mentioned an injury.
68% (13 of 19) of the injuries were described as irritations or allergic reactions; the remaining 32% (6 of 19) were described as other injuries.
Injury severity:
- 47% (9 of 19) were moderate,
- 26% (5 of 19) were severe,
- 16% (3 of 19) were minor,
- 5% (1 of 19) were life threatening or disabling, and
- 5% (1 of 19) did not have sufficient detail and were classified as unknown.
The cleanser products included:
- 46% (13 of 28) body cleansers,
- 32% (9 of 28) face cleansers (including eye cleansers), and
- 18% (5 of 28) genital cleansers.
Moisturizers
Number of reports received in 2020
From consumers: 12
From industry: 2
Total: 14
Of the 14 reports, 71% (10 of 14) mentioned an injury.
90% (9 of 10) of the injuries were described as irritations or allergic reactions; the remaining 10% (1 of 10) were described as an other injury.
Injury severity:
- 60% (6 of 10) were moderate,
- 20% (2 of 10) were minor,
- 10% (1 of 10) were severe, and
- 10% (1 of 10) did not have sufficient detail and were classified as unknown.
The moisturizer products included:
- 78% (11 of 14) facial moisturizers (including eye moisturizers), and
- 21% (3 of 14) body moisturizers.
Makeup (non-permanent, incl. henna tattoo)
Number of reports received in 2020
From consumers: 11
From industry: 1
Total: 12
Of the 12 reports, 25% (3 of 12) mentioned an injury.
67% (2 of 3) of the injuries were described as irritations or allergic reactions; the remaining 33% (1 of 3) were described as burns.
Injury severity:
- 67% (2 of 3) were moderate, and
- 33% (1 of 3) were minor.
The non-permanent makeup products were for:
- 42% (5 of 12) the face,
- 33% (4 of 12) the eyes,
- 17% (2 of 12) the lips, and
- 8% (1 of 12) the body.
Conditioners
Number of reports received in 2020
From consumers: 9
From industry: 0
Total: 9
Of the 9 reports, 78% (7 of 9) mentioned an injury.
100% (7 of 7) of the injuries were described as irritations or allergic reactions.
Injury severity:
- 86% (6 of 7) were moderate, and
- 14% (1 of 7) were minor.
Shampoo
Number of reports received in 2020
From consumers: 7
From industry: 0
Total: 7
Of the 7 reports, 43% (3 of 7) mentioned an injury.
100% (3 of 3) of the injuries were described as moderate irritations or allergic reactions.
Styling products
Number of reports received in 2020
From consumers: 4
From industry: 1
Total: 5
Of the 5 reports, 80% (4 of 5) mentioned an injury.
100% (4 of 4) of the injuries were described as moderate irritations or allergic reactions.
Bath Products (incl. bath bombs, salts and oils)
Number of reports received in 2020
From consumers: 4
From industry: 0
Total: 4
Of the 4 reports, 0% (0 of 4) mentioned an injury; however, 75% (3 of 4) reported a toxicologicalFootnote 4 (asterisk) * hazard.
Nail polish remover
Number of reports received in 2020
From consumers: 4
From industry: 0
Total: 4
Of the 4 reports, 50% (2 of 4) mentioned an injury.
50% (1 of 2) of the injuries were described as irritations or allergic reactions; the other 50% (1 of 2) were described as burns.
Injury severity:
- 100% (2 of 2) were moderate.
Straightening, waving and curling products (permanent/semi-permanent)
Number of reports received in 2020
From consumers: 4
From industry: 0
Total: 4
Of the 4 reports, 0% (0 of 4) mentioned an injury; however, 100% (4 of 4) reported a toxicologicalFootnote 4 (asterisk) * hazard.
Antiperspirant/Deodorant
Number of reports received in 2020
From consumers: 3
From industry: 0
Total: 3
Of the 3 reports, 67% (2 of 3) mentioned an injury.
100% (2 of 2) of the injuries were described as irritations or allergic reactions.
Injury severity:
- 50% (1 of 2) were minor, and
- 50% (1 of 2) were moderate.
Find out more about cosmetics.
Conclusion
Within the 2020 calendar year, the CPSP received a total of 2,109 consumer product and cosmetic reports (1,986 and 123, respectively) from industry and consumers. This is a drop of 16% for all reports compared to 2019, which may be due to the various business closures and lockdowns during the COVID-19 pandemic.
Although the total number of consumer products reports dropped, with an 11% decrease in the number of non-fatal injuries, there were five more deaths reported compared to the previous year.
The 10 most reported consumer product types account for 31% of the total number of incident reports received by the CPSP in 2020. The top reported consumer product type in 2020 was 'Toys', with 129 reports received, almost half of which mentioned an injury. There was a large increase in the number of reports for 'chairs', 'dishwashers', and 'laundry soaps or detergents' in 2020. The number of reports for 'chairs' was almost triple the previous year, and 'dishwashers' and 'laundry soaps or detergents' saw an increase of 48% and 62%, respectively. However, there was no clear explanation as to the cause of these increases.
Finally, the CPSP saw a 24% decrease in the number of reports received for cosmetic products. Similar to the decrease in consumer product reports, this overall decrease may be due to the COVID-19 pandemic. However, due to the relatively low number of reports received for cosmetic products, it is difficult to make any determinations about the changes in the number of reports received. Towards the end of 2020, the number of reports received show a slight return to normal.
How to report an incident involving a consumer product or cosmetic
Industry must report all incidents, as defined by the CCPSA, involving a consumer product and are encouraged to voluntarily report health or safety issues involving a cosmetic.
Consumers are encouraged to report any incident or event where someone is, or could have been, injured by a consumer product or cosmetic directly to the CPSP. Consumers may also send a report to the manufacturer, importer or retailer of the consumer product or cosmetic.
Contact us
Any questions or comments on this report, including any requests for the data used to support this report, should be directed to the General Enquiries Form.