
Low-income and Immigration: An Overview and Future Directions for Research
By Eden Crossman
March 2013
The views and opinions expressed in this document are those of the author(s) and do not necessarily reflect those of Citizenship and Immigration Canada or the Government of Canada.
Ci4-126/2014E-PDF
978-1-100-24810-3
Reference number: R21-2012
Table of contents
- Executive summary
- Introduction
- Issue
- Measures of low-income
- Factors influencing low-income among immigrants
- Summary and future directions for research
- References
Executive summary
Recent trends indicate that the gap between the low-income rates for immigrants and those born in Canada has increased substantially since 1980. Rising low-income rates among more recent immigrants relative to both the Canadian-born and immigrants who have been in Canada longer are cause for concern because low-income potentially impacts the ability of immigrant individuals and families to participate economically, socially, culturally, and with dignity in their communities. While the latest research results point to improvements in immigrant economic outcomes relative to the Canadian-born, there remain immigrants who have not seen an increase in relative economic performance, and who live in chronic low-income. This is potentially one of the most serious social and labour market challenges that Canada is facing. The objective of this report is to provide an overview of the low-income situation of immigrants in Canada with the goal of highlighting aspects of this issue in need of additional research. This report is organized into four parts. Part one considers the policy importance of the issue of low-income and immigration. Part two provides a description of low-income measures and touches upon differences to reflect on when using these indicators to evaluate immigrant economic outcomes. This is followed in part three by an examination, based on a review of the research literature, of the factors that contribute to the low-income situations of immigrants in Canada. Finally, part four provides a brief summary, along with research and data considerations for the investigation of low-income and immigration going forward.
There are a number of low-income lines used to inform policy development in the area of immigrant economic integration. Low-income measures such as Statistics Canada’s Low-Income Cut Off (LICO) and Low-Income Measure (LIM), and Human Resources and Skills Development Canada’s Market Basket Measure (MBM) can be used to identify the low-income population, while measures of chronic low-income and low-income intensity are often used in studying trends in the depth and duration of low-income spells among immigrants. It is meaningful to understand if a situation of low-income is transitory or persistent, as policy solutions may be very different. The existing low-income measures are designed to identify low-income individuals from different angles. Given the many dimensions of low-income, it may not be possible to find one measure that provides a complete picture; rather, it is argued in several studies reviewed that it is most useful to develop or adopt multiple measures of low-income. Although the use of LICO has been prevalent to date in studies looking at immigrants and low-income, the growing obsoleteness of this measure (with increasing number of years from a 1992 base year), along with recent data developments imply a likelihood of a move towards more prevalent use of LIM-based measures (which are derived from the distribution of incomes in the underlying population in each year) going forward.
Low-income is widely accepted as an indicator of access to economic resources among members of society and is therefore often used as a key indicator of immigrant integration and well-being. This study reviews the factors contributing to the earnings outcomes among recent immigrants (low-income among immigrants has closely tracked earnings trends, since earnings are the most significant component of family income, which is used to calculate low-income rates), focusing on the relationship between the characteristics of immigrants, or the socio-economic attributes that immigrants bring with them (including immigration category, year of landing and years in Canada, age, education, gender, source country, family type, province of residence, occupation, etc.), and the opportunities and barriers presented by the host society, be they economic, social, or institutional. Only through comparisons can factors be brought to light that explain why some groups end up more or less affected by low-income. Overall, the causes of low-income amongst immigrants are multifarious. For working age immigrants, for example, a shift in their characteristics and the cyclical nature of the economy may lead to additional barriers to the labour market, while for senior immigrants, their family size, family type, and motivations for immigration may generate different income levels.
In reviewing the recent literature on the low-income situation of immigrants in Canada and in examining different measures of low-income, this report concludes with the identification of potential new research possibilities. Specifically, a gap in research is revealed on the low-income situation of immigrants post-2006, the time of the last Canadian Census of population. There are two key reasons why the post-2006 time period is of particular policy importance with respect to understanding the low-income situation of immigrants in Canada today. First, many immigration policy changes have taken place since 2002, starting with the implementation of the Immigration and Refugee Protection Act (IRPA), and it is important to understand how these changes have influenced the income situation of recent immigrants. Second, labour market conditions throughout Canada (and many areas of the world) since 2006 have changed considerably (for example, the Canadian economy underwent a recent recession, from October 2008 to October 2009). In light of the recent changes in immigration policies and both domestic and global economic downturn and recovery, research is needed that looks at the low-income situation of recent immigrants in this new landscape.
To this end, data are needed that will contribute to the current understanding of the low-income situation of immigrants in all admission categories, including economic immigrants, and particularly among family class immigrants and refugees. The past has seen a fairly steady use of several Statistics Canada’s surveys to examine the low-income situation of immigrants and other Canadians, mainly the Census, the Survey of Labour and Income Dynamics (SLID), and to a lesser extent, the Longitudinal Administrative Database (LAD)-Longitudinal Immigration Database (IMDB) (LAD-IMDB Database). Recent developments with regards to these traditionally used surveys have important implications (reviewed in this report) for the continued study of immigrants in low-income going forward. A recently Redesigned IMDB that now includes family formation (among other additions) is likely to become the key information source to examine the labour market transitions of immigrants, including into and out of low-income situations. In light of policy focused on improving the economic outcomes of immigrants, research and data development in the areas of low-income – incidence and causes – is a priority.
Introduction
Research findings suggest a worrisome problem of low-income among recent immigrants to Canada (see, for example, Picot, Lu, and Hou, 2009; Fleury, 2007; Picot, Hou, and Coulombe, 2007; Picot and Sweetman, 2005; Palameta, 2004; and Picot and Hou, 2003). Recent immigrants consistently show up as one of the non-elderly groups most likely to experience low-income.Footnote 1 Incidence of low-income is much higher among recent immigrants than among the Canadian-born and recent trends show increasing low-income rates among recent immigrants (though low-income rates for immigrants who have been in Canada for longer periods of time are lower).Footnote 2 Moreover, while low-income rates among recent immigrants have trended upwards, there has been declining low-income rates among the Canadian-born.Footnote 3 As a result, rather than converging, the gap between low-income rates for immigrants and those born in Canada has increased considerably.
According to Canadian Census data, the gap between the low-income rates for immigrants and those born in Canada has increased substantially over the past three decades. In 1980, recent immigrants had a low-income rate of 25% -- 1.4 times that of Canadian-born population; by 2000 they were 2.5 times higher, at 35.8%.Footnote 4 Results from the 2006 Census show that immigrants who arrived in Canada in 2004 were more than three times as likely as most Canadians to have low-incomes. Fully 34.1% of these newcomers fell into the low-income category of the Census, as compared to a rate of 9.7% for all Canadians.Footnote 5 Picot and Hou (2003) argue that the rise cannot be attributed to poorer economic conditions in 2000, compared to earlier business cycle peaks; the unemployment rate in 2000 was 6.8% and was lower than that observed in 1990 (8.1%) or 1980 (7.5%). It thus appears there has been a structural rise in the low-income rate of recent immigrants.
While the latest research results point to improvements in immigrant economic outcomes relative to the Canadian-born (see, for example, Citizenship and Immigration Canada, Evaluation Division, 2010; Kustec and Xue, 2009), there remain immigrants who have not seen an increase in relative economic performance, and who live in chronic low-income.Footnote 6 This is potentially one of the most serious social and labour market challenges that Canada is facing. The objective of this report is to provide an overview of the low-income situation of immigrants in Canada with the goal of highlighting aspects of this issue in need of additional research. This report is organized into four parts. Part one considers the policy importance of the issue of low-income and immigration. Part two provides a description of low-income measures and touches upon differences to reflect on when using these indicators to evaluate immigrant economic outcomes. This is followed in part three by an examination, based on a review of the research literature, of the factors that contribute to the low-income situations of immigrants in Canada. Finally, part four provides a brief summary, along with research and data considerations for the investigation of low-income and immigration going forward.
Issue
Low-income potentially impacts on immigrant individuals and families’ ability to participate economically, socially, culturally, and with dignity in their communities. Low-income is widely accepted as a measure of access to economic resources among members of society, and thus is often used as a key indicator of immigrant integration and well-being. For instance, if groups of immigrants are over represented among those with low-income, it can imply serious consequences for their process of integration. Low-income is commonly used in the research as a proxy indicator for level of poverty (see information box Low-income, poverty, and well-being for details), and many social scientists acknowledge that living in poverty restricts not only the physical security of people’s lives, it also has a detrimental impact on their psychological and social well-being and on their ability to participate in life’s activities.Footnote 7 Camarota (1999) argues that widespread low-income makes it much more difficult to engage in the kind of give-and-take that is an integral part of the democratic process.Footnote 8 He argues that social science research indicates that the distribution of income has an impact on how people view one another, and with more low-income comes less trust and greater suspicion of others. As a result, he continues, great disparities in income cannot help but create greater social distance between members of a community and this in turn is likely to have a negative impact on political and social harmony.
From a fiscal point of view, there are also reasons to care about the low-income situation of immigrants. According to Camarota (1999), the main reason for concern about immigration's impact on the incidence of low-income is the effect on the poor already in the country, both native-born and immigrant. By this argument, if immigration increases the number of people who are in need of assistance, then this can only raise the cost of assistance efforts. Alternatively, the argument continues, if overall government expenditures on programs for those with low-income are kept constant, each recipient's benefit must be reduced so that all can be covered. Therefore, it is reasoned that if one is concerned about the poor already present, increasing the number of people in or near low-income through immigration is counter-productive in light of goals aimed at reducing low-income in society. The same study by Camarota next points out that because of their very low-incomes and the progressive nature of most taxes, individuals in low-income pay very little in taxes. Moreover, this argument continues, they also tend to use a great deal of services provided by the government, and as a result are generally a net drain on public coffers. If immigration increases the size of the low-income population, then this is very likely to have a negative effect on the tax base, particularly where most immigrants settle.
The arguments made by Camarota are concluded with the point that in any discussion of low-income resulting from immigration, it is important to remember that immigration is a discretionary policy of the federal government. The federal government determines the size, growth, and characteristics of the foreign-born population by setting the level of immigration. In other words, while the government can do things to ameliorate low-income caused by such factors as changes in family structures or the economy, these are complex social phenomena and are not the direct result of a specific federal policy. In contrast, the low-income that results from immigration is avoidable in a way that is not the case for low-income caused by domestic conditions.
Low-income, poverty, and well-being
Low-income measures are not measures of poverty or well-being. Rather, they reflect a methodology by which is identified those who are substantially worse off than the average in terms of income. Being significantly worse off than the average does not necessarily mean that one is poor.Footnote 9 Low-income measures (which are based on family income, including government transfer payments and investment and pension income, as well as employment earnings, and provide a picture of the economic resources available to families) exclude non-economic aspects of human welfare. When an income cut-off is developed, below which a household is considered to be in low-income, society is divided in two groups—those with incomes below the line (the poor) and those whose incomes takes them above the line (the non-poor).Footnote 10 The major factor behind the income approach is the readily available information about income and income distributions. Sarlo (1996) argues that while income is acknowledged as an imperfect indicator of well-being for individual cases, in the aggregate it is a reasonably good proxy for the consumption choices available to households. This being the case, while low-income measures are commonly used as poverty lines, they have no officially recognized status as poverty lines in Canada.Footnote 11
In contrast to low-income measures, poverty takes into account many non-economic aspects of human welfare. According to the United Nations (1995), poverty takes various forms, including "lack of income and productive resources to ensure sustainable livelihoods; hunger and malnutrition; ill health; limited or lack of access to education and other basic services; increased morbidity and mortality from illness; homelessness and inadequate housing; unsafe environments and social discrimination and exclusion. It is also characterised by lack of participation in decision making and in civil, social and cultural life. It occurs in all countries: as mass poverty in many developing countries, pockets of poverty amid wealth in developed countries, loss of livelihoods as a result of economic recession, sudden poverty as a result of disaster or conflict, the poverty of low-wage workers, and the utter destitution of people who fall outside family support systems, social institutions and safety nets.” This being the case, Statistics Canada (2012) argues that defining poverty is not straightforward, as the underlying difficulty is that poverty is a question of social consensus, defined for a given point in time and in the context of a given country. As a result, decisions of what defines poverty are subjective and ultimately arbitrary.
As low-income is an indicator of the extent to which some Canadians are less well-off than others based solely on income, it is also not an overall measure of well-being. Well-being involves a multi-dimensional array of social, economic and environmental factors. The way they connect and interact has a large effect on our well-being.Footnote 12 Well-being is generally evaluated by taking into account a broad spectrum of factors, such as housing quality, income, employment, social support networks, educational attainment, governance, health, life satisfaction, safety, and work-life balance (see, for examples, the Organisation for Economic Co-operation and Development (OECD) Better Life Index, the Canadian Index of Well-being, and Human Resources and Skills Development Canada’s Well-Being Indicators). This being the case, low-income, as a measure of equality, is a key component used in the analysis of economic well-being.Footnote 13
Measures of low-income
In order to establish the low-income situation of a population, several indicators have been developed for Canada. The most common of these measures include Statistics Canada’s Low-income Cut-off (LICO), the Low-income Measure (LIM), and Human Resources and Skills Development Canada’s Market Basket Measure (MBM). Each of these measures uniquely establishes thresholds and as a result report different incidences of low-income. According to Murphy, Zhang, and Dionne (2012), the primary purpose of Statistics Canada’s low-income lines are to provide some indication of the extent, nature, and evolution of persons with low-income who may be said to be at-risk of poverty.
Low-income status is determined using family or household income. As a family concept, low-income provides a better welfare perspective on a family or household economic resource position than individual income.Footnote 14 Since family members normally support each other financially it makes sense to look at families as economic units rather than considering each member of a family in isolation from the other members (See information box Family definitions used in low-income measures for details). As a result, low-income rates are based on family or household incomes (e.g., income from all group members is added together). If this total falls under the low-income line, all members are considered to be living in low-income, regardless of how much each person earns. Low-income measures account for family or household size in order to reflect the fact that a family or household’s needs increase as the number of its members increases.
As with all outcome measures, it is important to be aware of the inherent advantages as well as the disadvantages of the indicator. As mentioned, a key advantage of low-income measures is that they provide a better welfare perspective on an immigrant family’s economic resource position than individual earnings. Another advantage of low-income status over employment earnings as an outcome measure is that the low-income rate includes those who are unemployed and out of the labour market.Footnote 15 Further, low-income also takes into account sources of income other than earnings, such as social transfer benefits.Footnote 16 However, there are two problems common to all low-income measures worth mentioning. First, in using a low-income measure, all those identified as in low-income may not be poor.Footnote 17 Wealth (e.g., assets, home ownership, housing subsidies, etc.) is not taken into account when it comes to measuring low-income; this may matter more for some segments of the population (e.g., immigrants versus Canadian-born). If standard income-based calculations of low-income were refined to include consumption and assets, the rates of low-income could be much lower than those estimated using the standard measures. Examples include the self-employed with negative income, and recipients of capital gains or household transfers but who have little earned income. Second, low-income measures may not identify all those who are really in a low-income situation.Footnote 18 As an example, those who have to spend a lot on health care may end up with very little income for food, shelter, and clothing.
Statistics Canada’s family definitions
Census Family refers to married couples (with or without children of either or both spouses), couples living common-law (with or without children of either or both partners) or lone-parents of any marital status, with at least one child living in the same dwelling. A couple may be of opposite or same sex. 'Children' in a Census family include grandchildren living with their grandparent(s) but with no parents present.
Economic Family refers to a group of two or more persons who live in the same dwelling and are related to each other by blood, marriage, common-law or adoption. A couple may be of opposite or same sex. All census family persons are economic family persons. But the reverse is not true. Therefore, the concept of economic family may refer to a larger group of persons than does the census family concept.
Household refers to a person or a group of persons (other than foreign residents) who occupy the same dwelling and do not have a usual place of residence elsewhere in Canada. It may consist of a family group (Census family) with or without other persons, of two or more families sharing a dwelling, of a group of unrelated persons, or of one person living alone.
The economic family concept requires only that family members be related by blood, marriage, common-law or adoption. By contrast, the census family concept requires that family members be a male or female (male) spouse, a male or female (male) common-law partner, a male or female lone parent, or a child with a parent present. The concept of economic family may therefore refer to a larger group of persons than does the census family concept. For example, a widowed mother living with her married son and daughter-in-law would be treated as a non-family person under the definition of a census family. That same person would, however, be counted as a member of an economic family along with her son and daughter-in-law. Two or more related census families living together also constitute one economic family as, for example, a man and his wife living with their married son and daughter-in-law. Two or more brothers or sisters living together, apart from their parents, will form an economic family, but not a census family, since they do not meet the requirements for the latter. All census family persons are economic family persons. In contrast, Census families are strictly ‘two generations only’ families. As a result, the census family definition does not capture immigrants living in multi-generational, extended family, or multi-family homes.
Family structure refers to the combination of relatives that comprise a family. Classification of family structure considers the presence or absence of: legally married spouses or common law partners; children; and, in the case of economic families, other relatives. Statistics Canada uses the concept of major income earner to classify families (e.g., in a family, the major income earner is the person with the highest income before tax).
Source: Statistics Canada, 2007.
Low-Income Cut-Offs (LICOs)
Statistics Canada’s Low-income Cut-Offs (LICOs) are the most widely available measures of low-income in Canada, with the lengthiest historical series (data is available going back to the 1960s). The LICOs are income thresholds below which a family will likely devote a larger share of its income on the necessities of food, shelter and clothing than the average family.Footnote 19 The approach is essentially to estimate an income threshold at which families are expected to spend 20 percentage points more than the average family on food, shelter, and clothing.Footnote 20 An individual is considered to be in low-income if his/her total family income is below the LICO, and a family is in low-income if its total income is below the LICO.
The LICO is based on the economic family. The LICO varies by family size and the population of the area of residence. There are seven categories of family size from one person to seven or more persons, and five community sizes ranging from rural areas to cities with 500,000 or more residents.Footnote 21 The result is a set of 35 cut-offs; this variability is intended to capture differences in the cost of living between rural and urban areas. These LICOs were derived from an expenditure survey (1992 Family Expenditure Survey) and then compared to an income survey (Survey of Labour and Income Dynamics, SLID). The cut-offs are updated annually by Statistics Canada using the Consumer Price Index.
LICO is categorized as a relative measureFootnote 22, because LICOs are estimated based on average expenditures for basic needs. However, in practice, the LICO has become an absolute measure, that is, a pre-determined threshold income value below which a family can be said to be living in low-income. LICOs have been developed to identify low-income using both before and after tax income situations. Before-tax LICOs are based on total income including government transfer payments, but before deductions from federal and provincial / territorial income tax. After-tax LICOs are based on income after the payment of federal and provincial / territorial income taxes, but not other types of taxes that affect disposable income (e.g., sales tax, property tax, etc.). The use of before-tax LICOs (rather than after-tax LICOs) over states incidence of low-income, the reasons beingFootnote 23: 1) before-tax rates only partly reflect the entire redistributive impact of Canada's tax/transfer system because they include the effect of transfers but not the effect of income taxes; and 2) since the purchase of necessities is made with after-tax dollars, it is logical to use people's after-tax income to draw conclusions about their overall economic well-being. According to Murphy, Zhang, and Dionne (2012), the number of people falling below these cut-offs has been consistently lower on an after-tax basis than on a before-tax basis – a “progressive” tax rate system compresses the distribution of income and therefore, some families in low-income before taking taxes into account are relatively better off and not in low-income on an after-tax basis.Footnote 24
There are a few limitations worth noting with regards to using and understanding the results of low-income analyses based on LICOs. First, LICO does not account for provincial differences in costs of living. The national LICO (within family size and size of urban region) is applied to the provinces and regions. For example, for a family of four, the same LICO is applied to families living in large urban areas in Ontario and Quebec (e.g., Montreal and Toronto). Thus, LICOs do not take into consideration differences in living costs between the same-sized communities in different provinces, and there may be cost of living differences between these cities that are not accounted for in the LICOs (e.g., the cost of living in Montreal may be much lower than that in Toronto or Vancouver). This could introduce a bias for any comparison of levels of low-income among provinces.Footnote 25 This is a very important factor in low-income analysis of immigrants, given that most immigrants tend to settle in large urban cities.Footnote 26
Second, the LICOs may be becoming less relevant with time. The current LICOs are based on the relationship between the incomes and the consumption patterns of Canadian households as observed in 1992. While the annual Consumer Price Index is used to update the cut-offs, that is to take inflation into account, this does not reflect any changes that might occur over time in the average spending on necessities.Footnote 27 Thus the actual consumption base becomes less relevant with each passing year (and will continue to become less relevant in the absence of a rebasing of the measure).Footnote 28 It is generally thought useful to re-define consumption patterns on necessities over time (e.g., consider the impact on consumption patterns of Canadians from the recent oil boom and changes to cost of transportation, the recent housing boom, as well as health and personal care items).Footnote 29
Third, it has also been argued that LICO is not transparent to the public (it has been criticized for not being ‘simple’),Footnote 30 as there are numerous arbitrary choices (e.g., what is included and excluded with respect to food, shelter, and clothing, the regression model specification and assumptions, and income inclusions exclusions).Footnote 31 Fourth, LICOs are insensitive to the gaps (intensity) and trends of low-income, and as a result, Myles and Picot (2000) argue that researchers using the LICOs should be aware of the sensitivity of their results to the choice of cut-off levels. Fifth, the LICOs are not internationally comparable, as the LICO is Canadian-specific. Despite some concerns, the LICOs are commonly used to establish low-income rates and to help identify the low-income population. This being the case, there has been recent suggestion that the LICO be dispensed with, given that it is obsolete on a number of grounds.Footnote 32
Low-Income Measure (LIM)
Largely intended for the purpose of making international comparisons, Statistics Canada’s Low-Income Measure (LIM) is the most commonly used low-income line.Footnote 33 Statistics Canada has been producing the LIM since 1991 (although the time series has been extended back in time).Footnote 34 With LIM, a person is considered in low-income if their income is less than half of the population median income adjusted for household size (“adjusted” indicates that household needs are taken into account).Footnote 35 The median is calculated over the population of individuals, with each person in the population represented by its adjusted household income.Footnote 36 The LIM is then defined as 50% of the median of the adjusted household income observed at the person level.Footnote 37 A person with an adjusted household income below this level is considered to live in low-income.
The LIM is based on the household unit of sharing. While previously the economic family was the accounting unit in which individuals pooled income to enjoy economies of scale, the household has now replaced the economic family in the LIM. According to The Canberra Group (2001), the rationale for this change is twofold. Firstly, housing costs such as mortgage interest or rent and utilities are likely shared among individuals living in a dwelling, regardless if they are part of a different economic family (e.g., “household” allows a wider pooling of resources than the economic family).Footnote 38 Secondly, the household is the international standard when analysing income distribution.
LIM is a relative measure, with outcomes benchmarked, or compared to the population at a given point in time (e.g., 50% of median adjusted family income – that is, derived from the distribution of incomes in the underlying population in each year) (low-income depends on your income and that of others). The LIM is calculated three ways -- with market income, before-tax income, and after-tax income -- using the Survey of Labour and Income Dynamics (SLID). LIMs vary with family size and are the same in all parts of the country. This means they do not reflect the different costs of living across the country. They also do not require updating using an inflation index because they are calculated using an annual survey of household income, the SLID. However, while the LIM is a Canada-wide line, geographic variations can be easily introduced with local LIMs.Footnote 39
There are two limitations worth noting with regards to using and understanding the results of low-income analyses based on the LIM. First, the LIM makes no direct connection with what would be deemed necessary for covering basic needs, since it refers strictly to the distance between a person’s income and the median.Footnote 40 Second, LIM thresholds change every year, meaning that setting goals is challenging. Many researchers fix the LIM for a period of time in order to provide a constant threshold over the period of analysis.Footnote 41 As well, given it is difficult to show annual progress towards a target because it changes every year (e.g., LIM is a relative measure), one could look at a moving average of the median income (e.g., three or five years).
Market Basket Measure (MBM)
The Market Basket Measure (MBM) was developed by Human Resources and Skills Development Canada (HRSDC) to represent a standard of living that is a compromise between subsistence and social inclusion that reflects differences in living costs across the country.Footnote 42 The beginning of the MBM time series is 2000. The MBM is based on the cost of a specific basket of goods and services representing a modest, basic standard of living.Footnote 43 The measure is sensitive to differences in the cost of the basket in different parts of Canada.Footnote 44 The basket includes food, clothing and footwear, shelter, transportation, and other goods and services such as expenditures on personal care, basic telephone service, school supplies, and modest levels of reading material, recreation and entertainment.Footnote 45 The MBM calculations involve a number of adjustments to family income, including deductions for child care costs, child support payments, payroll taxes and contributions, certain out of pocket expenses for health care and the cost of prescribed aids for persons with disabilities. The end result is income that approximates disposable income, rather than the less complex definitions of total income or income after income taxes that are used in other low-income measures.Footnote 46 The great advantage of the MBM is that it links the established low-income thresholds to actual living conditions and thus, in a way, to what is necessary to live decently in a given society.Footnote 47
The MBM is based on the economic family. A person in low-income is someone whose disposable family income falls below the cost of the goods and services in the Market Basket in their community or community size.Footnote 48 The thresholds are produced for a reference family of two adults aged 25 to 49 years and two children (aged 9 and 13). It provides thresholds for a finer geographic level than the LICO, allowing, for example, different costs for rural areas in the different provinces. An equivalence scale determines income thresholds for other family sizes. The equivalence scale is the square root of the economic family size.
MBM is an absolute measure, that is, a pre-determined threshold income value below which a family can be said to be living in low-income. Statistics Canada collects prices from a variety of sources to calculate the MBM. The Survey of Labour and Income Dynamics (SLID) provides the income amounts that are used to estimate MBM rates.Footnote 49 Because the income concept used for MBM is the income available to purchase the goods and services that are contained in the MBM basket, there are no before and after-tax MBM low-income lines, as there are with both LICO and LIM. Rather, the general approach is to begin with total income and to subtract income taxes and other non-discretionary expenses from that amount (including Canada Pension Plan/Quebec Pension Plan contributions, Employment Insurance contributions, registered pension plans contributions, annual union and professional dues, support payments paid, work-related child care expenses, direct medical expenses, and public health insurance premiums).Footnote 50 This extends the traditional after-tax income concept, which takes income taxes into account but does not consider any other expenses.Footnote 51
There are a few limitations worth noting with regards to using and understanding the results of low-income analyses based on the MBM. First, data limitations imply that one has to make certain assumptions in calculating the costs of the MBM basket. For example, the cost of the basket in rural areas is the same as in the smallest urban centre(s) surveyed within a province.Footnote 52 Second, the food basket (based on the 2008 National Nutritious Food Basket) has been argued to contain more raw foods and foods less generally consumed among the low-income population.Footnote 53 There has also been some sentiment the food basket does not adequately reflect food choices of some visible minority, immigrant, and Aboriginal Canadians.Footnote 54 Third, arbitrary choice may have important implications. For example, Michaud, Cotton, and Bishop (2004) argue that the age of the used car and the frequency of replacement of that car in the MBM calculations have an effect on the amount of the private transportation component. For example, if a six year-old car were purchased every six years, instead of a five-year-old car every five years, the cost of private transportation would be reduced by $900.Footnote 55 Despite some limitations, the MBM provides an absolute measure of low-income that is an attempt to measure a standard of living that is a compromise between subsistence and social inclusion that reflects differences in living costs across the country.Footnote 56
How the measures compare
A natural question is how the measures compare. As described by Zhang, Murphy, and Michaud (2011), the three lines measure low-income differently. Under LICO, low-income incidence means the proportion of the population who are likely to spend a high proportion of income on necessities. In comparison, under LIM, low-income incidence means the proportion of the population whose income is below half of the median of the distribution, while under MBM it means the proportion of the population whose disposable income is below their local cost of the MBM basket. The three lines each have strengths and weaknesses, well summarized by Zhang, Murphy, and Michaud (2011). In terms of strengths, these authors argue that LICO has the longest history, LIM is simple and internationally comparable, and the MBM is intuitive and considers regional variations. In terms of weaknesses, the authors suggest that LICO is becoming less relevant, LIM can be counterintuitive sometimes, and the MBM contains many judgements and arbitrary choices. Although the three measures differ from one another, Statistics Canada (2012b) argues that they give a generally consistent picture of low-income status over time. The same Statistics Canada report goes on to argue that none of the measures is better than the others, as each contributes its own perspective and its own strengths to the study of low-income, so that cumulatively, the three provide a better understanding of the phenomenon of low-income as a whole.Footnote 57
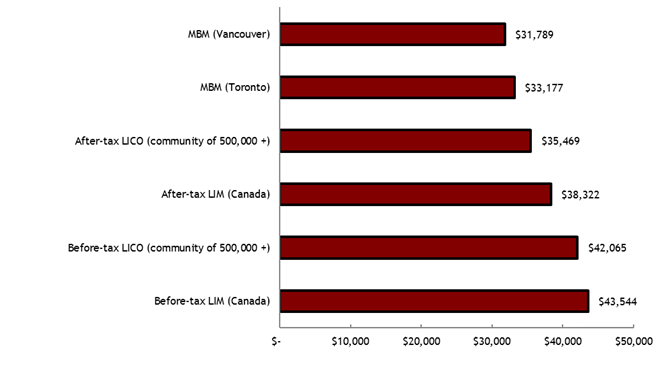
Illustrated in the chart below (Figure 1) are five different measures of low-income for a family of four in Canada in 2010. Where available, the low-income lines included are for a large city. According to the chart, although the various low-income measures are based on different foundations, the different low-income lines give somewhat similar results. The lowest low-income line is the MBM, set at $31,789 for Vancouver and $33,177 for Toronto, in 2010. The highest low-income line is in the amount of $43,544, using the before-tax LIM for Canada in 2010. The remaining low-income lines are within a few thousand dollars of one another.
Figure 1: The different measures of low-income - Selected low-income lines for a family of four, 2010
Text version: Figure 1: The different measures of low-income - Selected low-income lines for a family of four, 2010
| Measures | Low-income line |
|---|---|
| Before-tax LIM (Canada) | $43,544 |
| Before-tax LICO (community of 500,000 +) | $42,065 |
| After-tax LIM (Canada) | $38,322 |
| After-tax LICO (community of 500,000 +) | $35,469 |
| MBM (Toronto) | $33,177 |
| MBM (Vancouver) | $31,789 |
Source: Statistics Canada (2012), "Low Income Lines, 2010-2011", Income Research Paper Series.
A comprehensive study by Zhang (2010) examines and compares the sensitivity of different low-income lines (LICO, LIM, a fixed LIM, and MBM).Footnote 58 The study finds the low-income lines acted similarly in the long-run (and were sensitive to business cycle indicators such as the unemployment rate), but, in the short-run, often provided different results. The author argues that these finding suggests that a single line or index can be misleading in some circumstances. To demonstrate, the study examines different low-income lines across several disadvantaged groups of individuals and finds, as one example, that a fixed LIM is not as inclusive as MBM, or as capable as MBM in capturing individuals from families headed by recent immigrants, although the groups as a whole contributed more to low-income incidence under a fixed LIM than under MBM. Examining the capability of different lines in capturing low-income individuals, the author finds that for individuals being captured in MBM, there was good chance that other low-income lines failed to identify them as being in low-income, while for those who were above MBM, there was little chance they would be counted as low-income persons by other lines. However, among individuals who were above the fixed LIM line, there was still a non-trivial chance for them to be captured by other lines. Thus, it appeared that the MBM line would capture more individuals than the fixed LIM line, suggesting to the author that a fixed LIM line needs to be re-based periodically to maintain its relevance. The author also argues the results suggest that future development of the LIM lines needs to take regional variations in costs of living into consideration.
Applying the measures (low-income rate, low-income gap, and duration of low-income)
The LICO, LIM, and MBM are used to identify the low-income population in Canada and allow for the analysis of important trends and composition of Canadians at the low end of the income spectrum. Statistics Canada (2012b) explains the application of the different low-income measures, including the calculation of low-income rates and low-income gaps. First, to determine whether a person is in low-income, the appropriate low-income line (LICO or LIM, before or after tax, or MBM,) is compared to the income of the person‘s family (or household) and if their income is below the cut-off, the individual is considered to be in low-income. It is advised that persons in low-income be interpreted as persons who are part of low-income families (or households), including persons living alone whose income is below the cut-off. Low-income rates (often referred to as incidence of low-income), compare the number of persons or families considered to have low-income in a particular category, to all the persons or families in the same category. For example, the low-income rate for immigrants (or subgroup of immigrants, for example, based on age, sex, etc.) can be calculated as the number of immigrants (or subgroup of immigrants) in low-income divided by the total immigrant (or subgroup) population. Second, the same Statistics Canada report suggests that after having determined that an individual is in low-income, the depth of low-income can be analysed by using the amount that the person‘s family (or household) income falls short of the relevant low-income cut-off. As an example, an individual living in a family (or household) with an income of $15,000 and a low-income cut-off of $20,000 is said to have a low-income gap of $5,000; in percentage terms this gap is 25%. The average gap for a given population, whether expressed in dollar or percentage terms, is then the average of these values as calculated for each person.Footnote 59
It is also meaningful to consider the differences between those that have low-income for short spells (perhaps as very recent or recent immigrants) versus those who have long term, or chronic low-income, as the policy considerations may be different.Footnote 60 Policy analysts are more concerned with persistent or chronic low-income spells than all low-income spells, many of which are quite short.Footnote 61 Sawhill (1988) points out that estimates of low-income are extremely sensitive to accounting periods. Far more people experience short periods of temporary low-income, Sawhill argues, than are consistently in low-income over longer periods of time. As such, low-income rates using short accounting periods, such as one month, or in the case of immigrants even one year, will be much higher and more volatile than rates for longer periods. Duration of low-income might be particularly relevant when looking at the immigrant integration experience. For example, it may be of particular policy relevance to know which immigrants are in low-income, at what point in time after coming to Canada, and for how long they remain in low-income.
Researchers have developed statistical techniques by which to examine the duration and depth of low-income. For example, Picot, Hou, and Coulombe (2007) develop a Chronic Low-income Measure, which is used to assess the duration of low-income spells and is effective in examining trends of low-income rates (rather than measures of low-income at a point in time). These authors estimate an immigrant cohorts’ probability of entering and exiting a low-income spell, the association between cohort characteristics and the entry and exit rates, and the duration of low-income spells among selected immigrant and comparison cohorts between 1992 and 2004. Given an absence of a standard low-income measure in the data set being used (the LAD-IMDB Database)Footnote 62, the study defines low-income status based on 50% of median adult-equivalent adjusted family income.Footnote 63 The median adjusted family income is calculated on a constant dollar basis (the consumer price index adjusted to the 2003 value) in each of the years covered by the study (1992 to 2004), and the average of these values is used in determining the low-income cut-off in all years (e.g., a fixed LIM based measure). The study finds that the probability of entering low-income was quite high during the first year in Canada, ranging from 35% to 45% among cohorts entering through the 1990s and early 2000s. But by the second year in Canada, this probability had fallen to around 10% and remained low thereafter. Many of these low-income spells were found to be quite short. Approximately one-third exited the first low-income spell after one year, and a slightly higher percentage remained in low-income after three years. To get at repeated spells of low-income, the authors then take a longer-term perspective using their measure of ‘chronic low-income,’ that is, identifying immigrants who were in a low-income state for at least four of their first five years in Canada. Under this definition, 19% of immigrants entering through the 1990s found themselves in chronic low-income (about 2.5 times higher than the rate observed for non-immigrants); and, when chronic low-income was defined over a 10- rather than 5-year time span (in low-income at least 7 of the first 10 years in Canada), about 17% of entering immigrants found themselves to be in chronic low-income over this longer period. Among the conclusions made by the researchers is the finding that if immigrant families are not exposed to low-income immediately after their landing, they may escape it altogether.
Also in an effort to understand the transitory or persistent nature of low-income situations, a study by Ren and Xu (2011) examines low-income outcomes and duration using the Survey of Low-income Dynamics (SLID),Footnote 64 taking into account all three low-income measures (LICO, LIM, and MBM). The study (using logit regression models) is able to disentangle the determinants for transitory low-income from those for persistent low-income: student status and recent immigration are found more likely to be the key determinants for transitory low-income (an individual being in low-income for 1 to 3 years of the 6 years of panel data), while family composition (unattached individuals and lone parents), activity limitation, and less than high school education are more likely the key determinants for both transitory and persistent low-income (an individual being in low-income for 4 to 6 years). These observations are found quite robust under all three of the low-income thresholds across the two panels.
Low-income intensity is a measure of low-income that incorporates information from both the low-income rate (the proportion of the population below the low-income cut-off) and the low-income gap (the “depth” of low-income). Picot, Morissette, and Myles (2003) describe the low-income gap as the difference between the low-income cut-off and the average family income (among low-income families), divided by the low-income cut-off; the gap represents the “depth” of low-income expressed as a proportion the low-income cut-off. The authors explain that a gap of 0.32 means that the average family income of low-income families was 32% below the low-income cut-off. An increase in the gap, for example, from 0.32 to 0.34, implies an increase in the “depth” of low-income.Footnote 65 Myles and Picot (2000) observe that the low-income intensity measure can detect changes in income levels of low-income families. Moreover, in the study the measure captures impacts of social transfers to families by comparing the gap changes during the pre-transfer and post-transfer periods. According to Picot, Morissette, and Myles (2003), low-income intensity, which incorporates changes in both the low-income rate and the low-income gap, is very cyclical in nature.
Evident from this discussion is that a key consideration with respect to the immigrant population is deciding at what point in time low-income measurements are examined. A considerable amount of research shows there are consistent and observable patterns of immigrant labour market outcomes. There is an entry effect – with immigrants facing a penalty in initial employment earnings upon arrival in Canada – likely a result of being unfamiliar with the Canadian labour market. There is an integration effect -- an immigrant’s outcomes tend to improve the longer that person has been in Canada – as they gain ‘local’ experience. And there is a cohort effect -- different outcomes can result from differences in individual and labour market characteristics – for instance, unemployment may be high at the time of landing, affecting an immigrant’s labour market integration. As a result, consideration must be given as to when to evaluate the low-income situation of immigrants. After how many years in Canada should certain outcomes be achieved? One year? Five years? The answer likely depends on the specific policy-research question at hand.
Another key consideration with respect to the immigrant population is deciding an appropriate reference group by which to evaluate low-income trends over time. Picot, Lu, and Hou (2009) recommend that trend analysis be focused on low-income trends among immigrants relative to that of the Canadian-born. The reasoning being that any fluctuation in the rates associated with the business cycle is likely to affect the trends for the Canadian-born as well as for immigrants. Therefore, these authors argue, the comparison with the Canadian-born provides a rough control for business cycle effects. Again, however, the answer likely depends on the specific policy-research question at hand.
Factors influencing low-income among immigrants
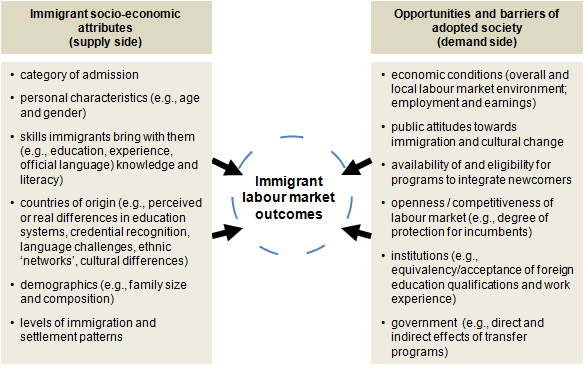
Low-income is widely accepted as an indicator of access to economic resources among members of society, and is therefore often used as a key indicator of immigrant integration and well-being. Central to the concept of low-income is the importance of socio-economic characteristics and conditions on differences seen among various populations. In other words, an analysis of immigrants in low-income necessarily requires offering “reasons why” things are different among various immigrant groups and the Canadian-born. Figure 2 below depicts the factors contributing to immigrant labour market outcomes (earnings). It is acknowledged in the research literature that low-income among immigrants has closely tracked earnings trends, since earnings are the most significant component of family income, which is used to calculate low-income rates.Footnote 66 In fact, Picot and Hou (2003) argue that explanations of declining entry level earnings among immigrants will no doubt explain to a considerable extent the rise in low-income. Noël (2012) argues that finding a job remains by far the best way of getting out of low-income, although the quality of one’s job is of importance to a person’s earnings trajectory: part time or precarious jobs may keep people in a situation of low-income.
As illustrated in Figure 2, understanding labour market outcomes among recent immigrants requires considering the relationship between the characteristics of immigrants, or the socio-economic attributes that immigrants bring with them (including immigration category, year of landing and years in Canada, age, education, gender, source country, family type, province of residence, occupation, etc.), and the opportunities and barriers presented by the adopted society, be they economic, social, or institutional. Overall, the causes of low-income amongst immigrants are multifarious. For working age immigrants, for example, the shift of their characteristics and the cyclical nature of the economy may lead to additional barriers to the labour market, while for senior immigrants, their family size, family type, and motivations for immigration may generate different income levels. This section presents a number of these important socio-economic factors, including research findings on how they impact the low-income situation of immigrants.
Figure 2: Factors influencing labour market outcomes among immigrants
Text version: Figure 2: Factors influencing labour market outcomes among immigrants
Immigrant socio-economic attributes (supply side)
- category of admission
- personal characteristics (e.g., age and gender)
- skills immigrants bring with them (e.g., education, experience, official language) knowledge and literacy)
- countries of origin (e.g., perceived or real differences in education systems, credential recognition, language challenges, ethnic ‘networks’, cultural differences)
- demographics (e.g., family size and composition)
- levels of immigration and settlement patterns
Opportunities and barriers of adopted society (demand side)
- economic conditions (overall and local labour market environment; employment and earnings)
- public attitudes towards immigration and cultural change
- availability of and eligibility for programs to integrate newcomers
- openness / competitiveness of labour market (e.g., degree of protection for incumbents)
- institutions (e.g., equivalency/acceptance of foreign education qualifications and work experience)
- government (e.g., direct and indirect effects of transfer programs)
Source: Thompson, 2004.
To gain a complete picture of immigrants’ low-income situation, immigrants’ wealth, foreign income and remittances back to their source countries would also need to be considered. This being the case, such information is generally not available, nor included in the calculation of income used to measure low-income status. Immigrants’ unreported foreign assets (e.g. unsold houses in source countries, savings in off-shore accounts, remittances received from relatives in source countries, etc.) and remittances to family members still living in source countries, may skew analysis in this regard. It is important to consider the absence of wealth from the above diagram. Wealth can be defined as the difference between an individual’s or a household’s total assets and total debts or liabilities (also referred to as net worth).Footnote 67 Dalgliesh (2008) argues that for immigrants, wealth plays a key role in the settlement and integration process since, for example, wealth may provide a financial cushion during an initial job search, and may be used later on as collateral to start a new business. Wealth also plays a key role in accessing credit, while savings may be used to pursue higher education, to start up a small business, and for retirement.Footnote 68 Hence, wealth offers an important cushion in the face of economic constraints and during periods of weak labour market outcomes. The literature on immigrant economic outcomes in Canada would be greatly enriched by strengthened understandings of immigrant savings, consumption, asset accumulation and investment.Footnote 69 Dalgliesh (2008) suggests that the level of asset holdings among immigrants may also provide a more comprehensive picture of household wealth, particularly because assets such as homes and businesses can be converted into liquid assets for consumption during retirement. Even so, Dalgliesh (2008) argues that the two most important factors contributing to the wealth accumulation of immigrants are labour market performance and relative earnings. For this reason, and because wealth is not accounted for in the measurement of low-income, the section that follows is focused on the factors that contribute to immigrant labour market outcomes and how these relate to their low-income situation.
Immigrant socio-economic attributes
Essential to the analysis of low-income is the importance of socio-economic characteristics and conditions on the differences seen among the different populations being investigated, in this case, Canadian-born individuals and various groups of immigrants. Theoretically, there are numerous factors associated with the immigrant population that would work against relatively higher low-income rates among immigrants in comparison to the Canadian-born. Spigelman (1998) describes a few of these factors: first, many recent immigrants gain entry through the points system, which admits persons with skills and resources deemed in demand by Canadian businesses; second, immigrants are more likely than Canadian-born people to have a university degree; third, the labour force participation of working-age immigrants is close to that of Canadian-born persons and a larger share of working-age persons in the population, combined with participation rates similar to those of the Canadian-born population, suggest a larger-than-average share of workers in the labour force; and fourth, immigrant families are less likely to be headed by a lone parent, and lone-parent families have significantly higher low-income rates. That being the case, it was shown at the outset of this report that immigrants in fact have higher low-income rates than those born in Canada, and this gap has become larger with time. What are the factors contributing to the fact that research to date suggests this group is increasingly susceptible to low-income? Of the socio-economic attributes of immigrants, the most important contributing to their economic outcomes are the following:
Immigrant category of admission
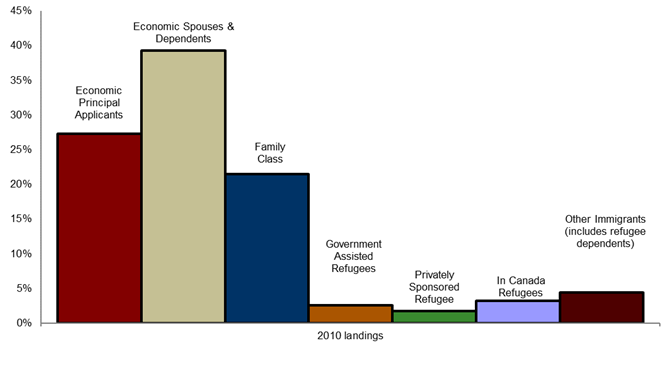
Canada’s immigration program covers three broad objectives, which correspond to three broad classes (see Figure 3). First, the economic class serves to foster the development of a strong, viable economy in all regions of the country. Second, the family class serves to facilitate the reunion in Canada of Canadian residents with close family members from abroad. Third, the refugee class serves to fulfill Canada's legal obligations with respect to refugees and to uphold its humanitarian tradition. Even so, within each of these broad categories, there are different categories and programs. For example, among the economic immigrants, there are skilled workers, provincial nominees, various business immigration categories and live-in caregivers. Further, within each of these categories there are principal applicants – those who are selected -- and their spouses and dependents. Family class includes close family members sponsored by a Canadian citizen or resident, including spouses, fiancés, dependent children, and parents and grandparents. Refugees also come to Canada in different ways. Persons resettled from abroad come either with government assistance (GAR) or private sponsorship (PSR), and there are also persons who successfully claim refugee status in Canada (landed in Canada). It can be expected that immigrants in different categories will “behave” differently and their behaviour must be assessed in the light of the policies under which they were admitted.
The different motivations for immigration, as represented by the different immigration categories, have significant effects on income outcomes. The expectation is for economic immigrants and their dependents to outperform other categories in the labour market.Footnote 70 It is also expected that family class immigrants, who are supported by established family sponsors, will not depend on social assistance.Footnote 71 It is not surprising, however, when refugees remain dependent on public support for extended periods following their arrival. In fact, refugees have a relatively high reliance on income support upon arrival (e.g., Government Assisted Refugees are provided income support under the Resettlement Assistance Program), but over time report a growing proportion of their income from employment earnings. In other words, deterioration in the national low-income rate of immigrants reveals little about the appropriate policy response to be taken or whether there is even a need to respond.Footnote 72 The outcome may reflect a change in mix across the immigrant categories, changing domestic labour market conditions or changing attributes of immigrants, or some combination of all these factors.Footnote 73
Figure 3: Immigrants come to Canada within distinct landing categories
Text version: Figure 3: Immigrants come to Canada within distinct landing categories
| Landing categories | Percentage |
|---|---|
| Economic Principal Applicants | 27% |
| Economic Spouses & Dependents | 39% |
| Family Class | 21% |
| Government Assisted Refugees | 3% |
| Privately Sponsored Refugee | 2% |
| In Canada Refugees | 3% |
| Other Immigrants (includes refugee dependents) | 4% |
Source: Citizenship and Immigration, Facts and Figures, RDM, 2010.
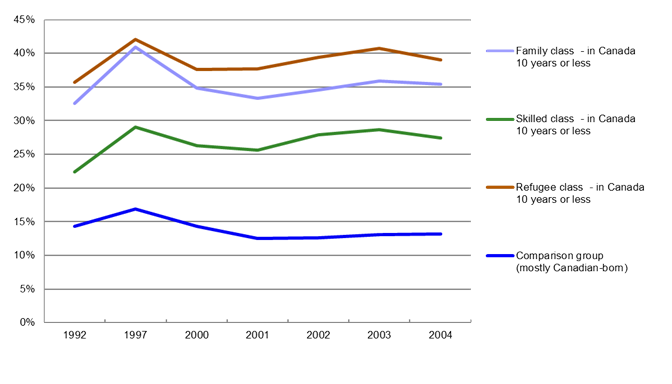
To date, the primary source of information regarding the low-income situation of immigrants has been Canadian Census data. As a result, there has been very limited information available with regards to the low-income situation of immigrants with respect to category of admission.Footnote 74 One study stands out as unique in this area: Picot, Hou, and Coulombe (2007) used the Longitudinal Administrative Database (LAD) and the Longitudinal Immigration Database (IMDB) for the years 1992 to 2004 to look at low-income rates of immigrants by category of admission (this study was described earlier in greater detail). Results from this study are reproduced in Figure 4 below, which depicts low-income rates of recent immigrants (who have been in Canada for ten years or less) by category of admission (family, refugee, and economic (excluding business class)) for the 1992 to 2004 tax years. The comparison group is made up of mostly the Canadian-born.Footnote 75 As shown, low-income rates were consistently lowest among those immigrants in the economic category (27.4% in the 2004 tax year), followed by those landing as family class immigrants (35.4% in the 2004 tax year), while highest among refugees (39.0% in the 2004 tax year).
Figure 4: Low-income ratesFootnote 76 of immigrants (aged 20 years and older) by category of admission, 1992-2004 tax years
Text version: Figure 4: Low-income rates of immigrants (aged 20 years and older) by category of admission, 1992-2004 tax years
| Year | Family class - in Canada 10 years or less |
Skilled class - in Canada 10 years or less |
Refugee class - in Canada 10 years or less |
Comparison group (mostly Canadian-born) |
|---|---|---|---|---|
| 1992 | 33% | 22% | 36% | 14% |
| 1997 | 41% | 29% | 42% | 17% |
| 2000 | 35% | 26% | 38% | 14% |
| 2001 | 33% | 26% | 38% | 13% |
| 2002 | 35% | 28% | 39% | 13% |
| 2003 | 36% | 29% | 41% | 13% |
| 2004 | 35% | 27% | 39% | 13% |
Source: Picot, Hou, and Coulombe (2007), Longitudinal Administrative Database (LAD) and Longitudinal Immigration Database (IMDB).
The study by Picot, Hou, and Coulombe (2007) examines changes to the probability of entering and exiting low-income, as well as the prevalence of chronic low-income among entering immigrant cohorts. The results of the study show that refugees are more likely to enter and less likely to exit low-income than other immigrants, while recently-landed skilled immigrants have become more likely to enter low-income than family class immigrants, although equally as likely to exit. The authors argue this is most probably because the family class immigrants often enter an already economically established family. Moreover, the findings indicate that over the 1990s the share of skilled economic immigrants in chronic low-income rose from 16% to 50% and the share of university educated immigrants in chronic low-income rose from 12% to 36%.
Category of admission can inform the policy perspective with regards to rising low-income trends among immigrants. For example, a rising number of skilled worker immigrants, a high proportion who intended to work as information technology professionals (53% of all skilled worker principal applicants to Canada in 2003)Footnote 77 combined with the downturn in the information technology sector has been argued to help explain worsening low-income rates among skilled workers despite the strength of the overall economy over the period 2000 to 2003.Footnote 78 As evident, this information provides a crucial perspective when considering the situation from a policy angle.
Years since migration
Research consistently shows that low-income rates for immigrants who have been in Canada for longer periods of time are significantly lower than for those in Canada more recently (see, for example, Statistics Canada, 2008; Picot and Hou, 2003).Footnote 79 Immigrants and refugees often need some time to settle in their new country, and as a result, years since migration generally corresponds to improved economic and social outcomes. Based on 2006 Census data, Table 1 presents the after-tax low-income status (both LICO and LIM) of immigrants by number of years since immigration, for Canada, in 2005. As shown, low-income rates for immigrants who have been in Canada for longer periods of time are lower and declines are evident for additional years an immigrant has lived in Canada. For example, looking at persons with family income below LICO, immigrants who arrived in Canada between 2001 and 2004 had an after-tax low-income rate of 27.4% in 2005. This was almost three times higher than the corresponding rate of 9.5% for people born in Canada. However, this gap closes with additional time an immigrant has lived in Canada. Immigrants who had been in Canada for between 5 and 10 years (those who immigrated between 1996 and 2000) had a low-income rate of 20.6% in 2005, while for those with 10 to 15 years of residence (those who immigrated between 1991 and 1995), it dropped to 17.5%. Trends are similar for low-income status of immigrants based on the after-tax LIM. As will be seen, it is worth mentioning that immigrants who have been established in Canada for longer periods tend to be older.
Table 1: After tax low income status of immigrants by number of years since immigration, Canada, 2005
| Immigration status | Total number of persons | Persons with family income below LICO (after tax) | Persons with family income below LICO (after tax) % | Persons with family income below LIM (after tax) | Persons with family income below LIM (after tax) % |
|---|---|---|---|---|---|
| Canadian-born persons | 24,651,925 | 2,343,940 | 9.5% | 2,697,195 | 10.9% |
| Immigrantstable note * | 6,166,770 | 1,025,185 | 16.6% | 988,115 | 16.0% |
| Immigration period | Total number of persons | Persons with family income below LICO (after tax) | Persons with family income below LICO (after tax) % | Persons with family income below LIM (after tax) | Persons with family income below LIM (after tax) % |
|---|---|---|---|---|---|
| Immigrated before 1981 | 2,393,355 | 187,350 | 7.8% | 175,200 | 7.3% |
| Immigrated between 1981 and 1985 | 360,450 | 44,450 | 12.3% | 42,650 | 11.8% |
| Immigrated between 1986 and 1990 | 640,440 | 92,220 | 14.4% | 88,495 | 13.8% |
| Immigrated between 1991 and 1995 | 822,220 | 143,740 | 17.5% | 138,705 | 16.9% |
| Immigration period between 1996 and 2000 | 843,035 | 173,855 | 20.6% | 168,765 | 20.0% |
| Immigrated between 2001 and 2004 | 824,670 | 226,200 | 27.4% | 217,440 | 26.4% |
Source: Statistics Canada, 2006 Census of Population, CIC Custom Table and author's calculations.
Research findings consistently provide evidence supportive of this trend. Using data from the Survey of Labour and Income Dynamics (SLID) for the period 1993 to 2001, Palameta (2004) finds that recent immigrants (landed in Canada within the past 1 to 6 years) are two to three times more likely to experience low-income status (based on after-tax LICO) relative to the Canadian-born. Moreover, the study finds that recent immigrants, regardless of gender, level of education, family type, or province of residence are also more likely to experience low-income repeatedly relative to the Canadian-born.Footnote 80 In this study, immigrants who had been in Canada 7 to 16 years (mid-term immigrants) and those who had been in Canada for at least 17 years (early immigrants) were found no more likely than non-immigrants to experience low-income, and the author suggests the results imply that after a period of adjustment, immigrants generally integrate well into Canada’s economy.
Using data from the 1993 to 1998 panel of the SLID, Morissette and Zhang (2001) study the persistence of low-income status (based on after-tax LICO) for different groups at risk of low-income. They find that at least 20% of immigrants who arrived in Canada since 1976 experienced low-income for four years or more compared with 7% of the Canadian-born population. In contrast, for immigrants who arrived prior to 1976, only 6% experienced low-income for four years or more. While this study does not carry out an econometric analysis to control for years of residence in Canada (and as a result the findings are not necessarily representative of true cohort differences), these observations do imply considerable variation across immigrant groups in terms of low-income status over time.
Overall, examining the low-income situation of immigrants necessarily must account for years since migration. Differences in low-income trends between recent and established immigrants suggest different policy response. For example, recent immigrants may have low-income for short spells upon arrival as they settle into their new country, a year or maybe two, while others may have long term or chronic low-income, and the policy considerations may need to be very different. As pointed to earlier, a study based on the 1999 to 2004 and 2002 to 2007 panels of the SLID, by Ren and Xu (2011), finds that recent immigration (and student status) is more likely to be the key determinant for transitory low-income (versus family composition (unattached individuals and lone-parents), activity limitation, and less than high school education which are more likely the key determinants for both transitory and persistent low-income). This being the case, also using the SLID (for 2002 to 2004), Fleury (2007) finds that recent immigrants (those who immigrated to Canada between 1990 and 2004) are more vulnerable to low-income in both the short and the long term (based on after-tax LICO). However, as for other Canadians, low-income among recent immigrants is found in this study to be a very dynamic phenomenon; the time spent in low-income for working-aged adults is very similar whether they are recent immigrants or not. Again, information on years spent in Canada is crucial when considering policy response to the situation of immigrants in low-income.
Personal characteristics (e.g., age and gender)
Low-income status is very much a life-cycle phenomenon.Footnote 81 As a result, age is a crucial factor in studying both the immigrant and the Canadian-born low-income situation. In addition to this, age at the time of an immigrant’s arrival matters greatly for economic outcomes: research consistently shows that the younger an immigrant is when landing in Canada, the better are his or her long-term labour market outcomes relative to those immigrating at a later age, and the closer to the Canadian-born experience.Footnote 82 The younger an immigrant is when landing in Canada, the more time the immigrant has to gain human capital skills specific to the Canadian labour market. Simply put, the earlier in life immigrants arrive, the more their education and work experience will resemble that of their Canadian-born counterparts and the easier it will be to learn an official language. Conversely, the older an immigrant is at landing, the more likely they are to have accumulated human capital through foreign work experience and likely the more difficulty he or she will have in terms of integrating into the labour market.
Among all immigrants, it is children and young adults who are more likely, relative to those aged 45 years and over, to live in a low-income situation. Based on 2006 Census data, Table 2 presents the after-tax low-income status (both LICO and LIM) of immigrants by number of years since immigration and age, for Canada, in 2005. As shown, looking at persons with family income below LICO, 33% of immigrants under age 15 years lived in a low-income situation in 2005, as did 26.7% of those aged 15 through 24 years. For immigrants aged 25 to 44 years, those of prime working ages, 19.5% were in a low-income situation in 2005. Immigrant children under the age of 15 years were more than three times as likely as their Canadian-born counterparts (11.7%) to be classified as being in a low-income situation in 2005. In contrast, low-income rates were much lower among the older immigrant population during the same year, at 13.2% for those immigrants aged 45 through 64 years and 8.7% for those aged 65 years and over (corresponding rates for similar aged Canadian-born persons were 8.9% and 5.7%, respectively).Footnote 83 By years spent in Canada, after-tax low-income rates were highest in 2005 among the most recent immigrant cohort (those who immigrated between 2001 and 2004) and who were youngest, with an incidence of low-income of 30.8% for those under age 15 years, and 31.8% for those aged 15 to 24 years; this compares with 25.7% among those aged 25 to 44 years, 25.8% among those aged 45 to 64 years, and 20.1% among those aged 65 years and older. In contrast, after-tax low-income rates were lowest in 2005 among the more established immigrant cohorts. For example, among those who immigrated between 1991 and 1995, those who were under age 15 years had an incidence of low income of 19.2% in 2005, and those aged 15 to 24 years had an incidence of low-income of 20.5%; this compares with 16.8% among those aged 25 to 44 years, 17.3% among those aged 45 to 64 years and 15.3% among those aged 65 years and older. Trends are similar for low-income status of immigrants based on the after-tax LIM.
Table 2: After tax low income status of immigrants by number of years since immigration and age, Canada, 2005
Table 2A: Canadian-born persons
| Age | Number of persons | Persons with family income below LICO (after tax) | Persons with family income below LICO (after tax) % | Persons with family income below LIM (after tax) | Persons with family income below LIM (after tax) % |
|---|---|---|---|---|---|
| Total - Canadian-born persons | 24,651,925 | 2,343,940 | 9.5% | 2,697,195 | 10.9% |
| Under 15 | 5,182,635 | 605,780 | 11.7% | 705,155 | 13.6% |
| 15 to 24 | 3,577,980 | 428,160 | 12.0% | 483,145 | 13.5% |
| 25 to 44 | 6,654,865 | 574,045 | 8.6% | 656,895 | 9.9% |
| 45 to 64 | 6,438,070 | 575,445 | 8.9% | 677,490 | 10.5% |
| 65 and over | 2,798,375 | 160,510 | 5.7% | 174,510 | 6.2% |
Table 2B: Immigrantstable note *
| Age | Number of persons | Persons with family income below LICO (after tax) | Persons with family income below LICO (after tax) % | Persons with family income below LIM (after tax) | Persons with family income below LIM (after tax) % |
|---|---|---|---|---|---|
| Total - Immigrants | 6,166,770 | 1,025,185 | 16.6% | 988,115 | 16.0% |
| Under 15 | 345,405 | 113,965 | 33.0% | 110,925 | 32.1% |
| 15 to 24 | 547,525 | 145,990 | 26.7% | 148,000 | 27.0% |
| 25 to 44 | 1,972,225 | 384,465 | 19.5% | 365,830 | 18.5% |
| 45 to 64 | 2,095,825 | 275,765 | 13.2% | 277,455 | 13.2% |
| 65 and over | 1,205,800 | 105,000 | 8.7% | 85,900 | 7.1% |
Table 2C: Immigrated before 1981
| Age | Number of persons | Persons with family income below LICO (after tax) | Persons with family income below LICO (after tax) % | Persons with family income below LIM (after tax) | Persons with family income below LIM (after tax) % |
|---|---|---|---|---|---|
| Total - Immigrated before 1981 | 2,393,355 | 187,350 | 7.8% | 175,200 | 7.3% |
| Under 15 | n/a | n/a | n/a | n/a | n/a |
| 15 to 24 | n/a | n/a | n/a | n/a | n/a |
| 25 to 44 | 323,905 | 28,335 | 8.7% | 28,760 | 8.9% |
| 45 to 64 | 1,123,460 | 99,110 | 8.8% | 102,405 | 9.1% |
| 65 and over | 945,995 | 59,905 | 6.3% | 44,040 | 4.7% |
Table 2D: Immigrated between 1981 and 1985
| Age | Number of persons | Persons with family income below LICO (after tax) | Persons with family income below LICO (after tax) % | Persons with family income below LIM (after tax) | Persons with family income below LIM (after tax) % |
|---|---|---|---|---|---|
| Total - Immigrated between 1981 and 1985 | 360,450 | 44,450 | 12.3% | 42,650 | 11.8% |
| Under 15 | n/a | n/a | n/a | n/a | n/a |
| 15 to 24 | 11,635 | 1,925 | 16.5% | 1,935 | 16.6% |
| 25 to 44 | 135,630 | 16,430 | 12.1% | 15,790 | 11.6% |
| 45 to 64 | 164,300 | 18,280 | 11.1% | 18,305 | 11.1% |
| 65 and over | 48,880 | 7,810 | 16.0% | 6,615 | 13.5% |
Table 2E: Immigrated between 1986 and 1990
| Age | Number of persons | Persons with family income below LICO (after tax) | Persons with family income below LICO (after tax) % | Persons with family income below LIM (after tax) | Persons with family income below LIM (after tax) % |
|---|---|---|---|---|---|
| Total - Immigrated between 1986 and 1990 | 640,440 | 92,220 | 14.4% | 88,495 | 13.8% |
| Under 15 | n/a | n/a | n/a | n/a | n/a |
| 15 to 24 | 84,230 | 13,845 | 16.4% | 13,925 | 16.5% |
| 25 to 44 | 260,325 | 37,135 | 14.3% | 35,020 | 13.5% |
| 45 to 64 | 238,575 | 32,395 | 13.6% | 31,665 | 13.3% |
| 65 and over | 57,305 | 8,840 | 15.4% | 7,890 | 13.8% |
Table 2F: Immigrated between 1991 and 1995
| Age | Number of persons | Persons with family income below LICO (after tax) | Persons with family income below LICO (after tax) % | Persons with family income below LIM (after tax) | Persons with family income below LIM (after tax) % |
|---|---|---|---|---|---|
| Total - Immigrated between 1991 and 1995 | 822,220 | 143,740 | 17.5% | 138,705 | 16.9% |
| Under 15 | 22,530 | 4,325 | 19.2% | 4,390 | 19.5% |
| 15 to 24 | 137,920 | 28,275 | 20.5% | 28,945 | 21.0% |
| 25 to 44 | 349,815 | 58,830 | 16.8% | 55,030 | 15.7% |
| 45 to 64 | 236,305 | 40,770 | 17.3% | 39,630 | 16.8% |
| 65 and over | 75,655 | 11,540 | 15.3% | 10,710 | 14.2% |
Table 2G: Immigrated between 1996 and 2000
| Age | Number of persons | Persons with family income below LICO (after tax) | Persons with family income below LICO (after tax) % | Persons with family income below LIM (after tax) | Persons with family income below LIM (after tax) % |
|---|---|---|---|---|---|
| Total - Immigrated between 1996 and 2000 | 843,035 | 173,855 | 20.6% | 168,765 | 20.0% |
| Under 15 | 99,840 | 22,620 | 22.7% | 22,035 | 22.1% |
| 15 to 24 | 146,750 | 37,610 | 25.6% | 37,940 | 25.9% |
| 25 to 44 | 374,640 | 67,390 | 18.0% | 62,755 | 16.8% |
| 45 to 64 | 181,040 | 37,465 | 20.7% | 37,560 | 20.7% |
| 65 and over | 40,760 | 8,775 | 21.5% | 8,475 | 20.8% |
Table 2H: Immigrated between 2001 and 2004
| Age | Number of persons | Persons with family income below LICO (after tax) | Persons with family income below LICO (after tax) % | Persons with family income below LIM (after tax) | Persons with family income below LIM (after tax) % |
|---|---|---|---|---|---|
| Total - Immigrated between 2001 and 2004 | 824,670 | 226,200 | 27.4% | 217,440 | 26.4% |
| Under 15 | 160,520 | 49,380 | 30.8% | 47,200 | 29.4% |
| 15 to 24 | 121,805 | 38,780 | 31.8% | 39,310 | 32.3% |
| 25 to 44 | 394,965 | 101,695 | 25.7% | 94,840 | 24.0% |
| 45 to 64 | 117,550 | 30,330 | 25.8% | 30,075 | 25.6% |
| 65 and over | 29,830 | 6,010 | 20.1% | 6,010 | 20.1% |
Source: Statistics Canada, 2006 Census of Population, CIC Custom Table and author's calculations.
Defining and measuring the low-income incidence of children, those under 15 years of age, and young adults, those aged 15 to 24 years, is challenging because for the most part children do not earn any income. Even so, most agree that it is unfortunate when families with children do not have a sufficiently high income for suitable housing, food, clothing or some family activities.Footnote 84 A study by Fleury (2007) based on SLID data covering 1994 to 2004 finds that children who lived in a family whose main income recipient was not in the labour market for most of the year were the most vulnerable to low-income (after tax LICO) in 2004, followed by those whose main income recipient was unemployed or still in school. Children whose main income recipient was self-employed were also found to have a higher risk of being in low-income than those whose main income recipient was an employee. Furthermore, regardless of the main income recipient’s labour market status, children from single-parent families were much more vulnerable to low income than children from two-parent families. Children who lived in families with several siblings were also more vulnerable to low income. Fleury finds that children dependent mainly on a recent immigrant were one of several groups at higher risk of having low family incomes in 2004 (along with: one parent with at the very most a high school diploma, who was under the age of 30, an Aboriginal person living off-reserve, or who had limitations at work). Moreover, while the rate of low- income for children based on their family characteristics evolved little the period, it grew for children of recent immigrants and children in families with one income earner and three or more children, while it fell for children in families with no income earners and children in single-parent families. The study by Fleury argues that the relatively high low-income rate of immigrant children appears to a large extent reflective of their status as the offspring of recent immigrants.
Research has found that an older age at landing may increase an immigrant’s chance of experiencing low-income relative to that of their Canadian-born counterparts. The study by Palameta (2004) finds that immigrant seniors who had come to Canada in their late 40s or their 50s were at greater risk of experiencing low-income than other Canadians. Palameta argues that mid-term (in Canada 7 to 16 years) immigrant seniors, who came to Canada in their late 40s of their 50s and found work may not have been able to build up sufficient pension wealth to stave off low-income. This group was found roughly five times more likely than their Canadian-born counterparts to experience low-income. The study by Picot, Hou, and Coulombe (2007) also finds that low-income and chronic low-income rates increase with immigrant age at landing. While these authors attribute this to evidence of declining returns to foreign labour market experience, this result may actually reflect shifts in the age and admission category composition of the immigrant population. The majority of those aged 50 or over at landing, for example, are family class immigrants; these immigrants generally enter a family already established in Canada, reducing their low-income entry rates.Footnote 85 Immigrants in these age groups may also have different labour market intentions than other immigrants (e.g., education, retirement, etc.).
This being the case, senior-aged immigrants (either those who entered the country as seniors or who aged in Canada) may face unique challenges gaining an adequate income. Lee (2000) suggests that they may not have access to income security programs available to other elderly Canadians such as Old Age Security (OAS) and the Guaranteed Income Supplement (GIS) benefits. In fact, using the Longitudinal Immigration Database (IMDB) and data from the Canadian Revenue Agency, Dempsey (2006) observes that immigrant seniors rely more on non-contributory retirement income than non-immigrant seniors, and family class immigrants (66% of the senior immigrant population) and refugees (8%) receive more than half of their income from provincial supplements, Old Age Security (OAS), and Guaranteed Income Supplement (GIS)/Allowance. In contrast, senior economic immigrants (18%) are found to have stronger labour market attachment and receive 60% of their income from labour market sources, especially employment earnings. Moreover, senior economic principal applicants were also found in the category most likely to report C/QPP and least likely to report OAS/GIS. As a result of these findings, Dempsey argues that immigrant seniors are less self-sufficient than non-immigrant seniors.
It has been asserted that immigrant women experience a ‘double jeopardy’ in the Canadian labour force, as both ‘immigrants’ and ‘women’. Female immigrants may face gender discrimination in the labour market that is similar to that experienced by Canadian-born females, or it may be exacerbated by their foreign-born status. Female immigrants may be more likely to live in a low-income situation compared to their male counterparts – similar to the situation among the Canadian-born.Footnote 86 Based on 2006 Census data, Table 3 presents the after-tax low-income status (both LICO and LIM) of immigrants by number of years since immigration and gender, for Canada, in 2005. As shown, looking at persons with family income below LICO, 17.2% of immigrant women were living with low-incomes compared with 16.0% of immigrant men in 2005; the comparable rates for Canadian-born women and men were 10.1% and 8.9%, respectively. Gender differences in low-income were less pronounced in 2005 among the more recent immigrant cohorts, with those who immigrated between 2001 and 2004 having similar low-income rates for men and women, at 27.6% and 27.3%, respectively. However, among those in Canada 10 to 15 years (those who immigrated between 1991 and 1995), low-income rates were higher among female immigrants in 2005, at 18.1%, compared to their male counterparts, at 16.8%. Although differences in the size of the male-female low-income gap are evident, the overall trends are similar for low-income status of immigrants based on the after-tax LIM.
Table 3: After tax low income status of immigrants by number of years since immigration and gender, Canada, 2005
Table 3A: Canadian-born persons
| Gender | Number of persons | Persons with family income below LICO (after tax) | Persons with family income below LICO (after tax) % | Persons with family income below LIM (after tax) | Persons with family income below LIM (after tax) % |
|---|---|---|---|---|---|
| Female | 12,489,665 | 1,262,585 | 10.1% | 1,448,400 | 11.6% |
| Male | 12,162,265 | 1,081,360 | 8.9% | 1,248,800 | 10.3% |
Table 3B: Immigrantstable note *
| Gender | Number of persons | Persons with family income below LICO (after tax) | Persons with family income below LICO (after tax) % | Persons with family income below LIM (after tax) | Persons with family income below LIM (after tax) % |
|---|---|---|---|---|---|
| Female | 3,212,365 | 551,065 | 17.2% | 526,680 | 16.4% |
| Male | 2,954,405 | 474,120 | 16.0% | 461,430 | 15.6% |
Table 3C: Immigrated before 1981
| Gender | Number of persons | Persons with family income below LICO (after tax) | Persons with family income below LICO (after tax) % | Persons with family income below LIM (after tax) | Persons with family income below LIM (after tax) % |
|---|---|---|---|---|---|
| Female | 1,240,120 | 108,330 | 8.7% | 97,655 | 7.9% |
| Male | 1,153,240 | 79,020 | 6.9% | 77,545 | 6.7% |
Table 3D: Immigrated between 1981 and 1985
| Gender | Number of persons | Persons with family income below LICO (after tax) | Persons with family income below LICO (after tax) % | Persons with family income below LIM (after tax) | Persons with family income below LIM (after tax) % |
|---|---|---|---|---|---|
| Female | 189,715 | 25,280 | 13.3% | 24,090 | 12.7% |
| Male | 170,735 | 19,170 | 11.2% | 18,565 | 10.9% |
Table 3E: Immigrated between 1986 and 1990
| Gender | Number of persons | Persons with family income below LICO (after tax) | Persons with family income below LICO (after tax) % | Persons with family income below LIM (after tax) | Persons with family income below LIM (after tax) % |
|---|---|---|---|---|---|
| Female | 328,735 | 49,070 | 14.9% | 47,305 | 14.4% |
| Male | 311,705 | 43,150 | 13.8% | 41,195 | 13.2% |
Table 3F: Immigrated between 1991 and 1995
| Gender | Number of persons | Persons with family income below LICO (after tax) | Persons with family income below LICO (after tax) % | Persons with family income below LIM (after tax) | Persons with family income below LIM (after tax) % |
|---|---|---|---|---|---|
| Female | 438,425 | 79,170 | 18.1% | 76,120 | 17.4% |
| Male | 383,795 | 64,570 | 16.8% | 62,590 | 16.3% |
Table 3G: Immigrated between 1996 and 2000
| Gender | Number of persons | Persons with family income below LICO (after tax) | Persons with family income below LICO (after tax) % | Persons with family income below LIM (after tax) | Persons with family income below LIM (after tax) % |
|---|---|---|---|---|---|
| Female | 436,735 | 92,575 | 21.2% | 89,840 | 20.6% |
| Male | 406,300 | 81,280 | 20.0% | 78,930 | 19.4% |
Table 3H: Immigrated between 2001 and 2004
| Gender | Number of persons | Persons with family income below LICO (after tax) | Persons with family income below LICO (after tax) % | Persons with family income below LIM (after tax) | Persons with family income below LIM (after tax) % |
|---|---|---|---|---|---|
| Female | 429,665 | 117,105 | 27.3% | 112,650 | 26.2% |
| Male | 395,010 | 109,095 | 27.6% | 104,790 | 26.5% |
Source: Statistics Canada, 2006 Census of Population, CIC Custom Table and author's calculations.
Using mainly 2001 Census data, Statistics Canada (2006) finds a higher share of foreign-born women lived in a low-income (LICO) situation in 2001 (23% as compared to 16% for Canadian-born women) (and 20% for immigrant men). For the same year, the study also finds that foreign-born women were less likely to be employed compared to Canadian-born women and men (both foreign and Canadian-born). Immigrant women also received a slightly larger proportion of their total income from government transfer payments (e.g., family allowances, Employment Insurance benefits and other types of social assistance) relative to Canadian-born women. As a result, the study argues that foreign-born women face a complex set of hurdles as they integrate into Canadian society, including adjusting to a new lifestyle and gender-based inequalities in Canada (e.g., differences in employment and unemployment rates).
As highlighted in this section, examining the low-income situation of immigrants necessarily must account for age (at time of survey and at arrival) and gender. Differences in low-income trends by age and by gender may suggest different sets of circumstances to which policy may respond. For example, the situation of immigrant children living in a low-income may be caused by factors much different than those of low-income lone-parent immigrant mothers, or working age immigrant men, or senior immigrant females who are living with their extended family. Personal characteristics, such as age and gender, provide crucial information when considering the situation of immigrants in low-income from a remedial point of view.
Countries of origin (e.g., perceived or real differences in educational systems, language challenges, ethnic networks, and cultural differences)
Immigrants from non-OECD countries may be more likely to live in a low-income situation compared to those from OECD countries. Based on 2006 Census data, Table 4 presents the after-tax low-income status (both LICO and LIM) of immigrants by place of birth, for Canada, in 2005. As shown, looking at persons with family income below LICO, 10.2% of immigrants from OECD countries were living with low-incomes compared with 20.5% of immigrants from non-OECD countries in 2005. Looking at only those immigrants who migrated to Canada most recently (those who landed between 2001 and 2004), the percentage point difference is more pronounced, with 29.8% of those from OECD countries living in a low-income situation compared to 50.5% of those from non-OECD countries. For this cohort of immigrants, among those from OECD countries, those from South Korea had the highest incidence of low-income, at 51.9%. Among those from non-OECD countries, recent immigrants from several countries had relatively high low-income rates: Somalia (60.0%), Taiwan (56.2%), and Kuwait (52.8%). That recent immigrants from Somalia have such a relatively high low-income rate is possibly explainable by category of admission, many of these persons having arrived as refugees. In contrast, it is possible that the high low-income rates among immigrants from South Korea, Taiwan, and Kuwait reflect the inability of low-income measures to account for wealth, including foreign assets, as South Korea, Taiwan and Kuwait are among the top Gross Domestic Product per capita countries, and are also not major source countries for refugees to Canada.Footnote 87 In fact, South Korea and Taiwan are among the top source countries for Business Immigrants (a category that includes Entrepreneurs, Self-employed immigrants, and Investors) to Canada.Footnote 88 Business immigrants are a group admitted to Canada under the expectation they will create jobs and stimulate the economy through consumption and investments. Trends are similar for low-income status of immigrants based on the after-tax LIM.
Table 4: After tax low income status of immigrants by place of birth, Canada, 2005
Table 4A: All immigrantstable note *
| Places of birth | Total - Number of persons | Persons with family income below LICO (after tax) | Persons with family income below LICO (after tax) % | Persons with family income below LIM (after tax) | Persons with family income below LIM (after tax) % |
|---|---|---|---|---|---|
| Total—Places of birth | 6,166,775 | 1,025,185 | 16.6% | 988,120 | 16.0% |
| Total—OECD Countries | 2,316,145 | 235,780 | 10.2% | 236,270 | 10.2% |
| Total—Non-OECD countries | 3,850,625 | 789,405 | 20.5% | 751,845 | 19.5% |
| OECD countries | Total - Number of persons | Persons with family income below LICO (after tax) | Persons with family income below LICO (after tax) % | Persons with family income below LIM (after tax) | Persons with family income below LIM (after tax) % |
|---|---|---|---|---|---|
| France | 79,060 | 10,655 | 13.5% | 10,265 | 13.0% |
| Germany | 170,180 | 13,835 | 8.1% | 15,255 | 9.0% |
| Greece | 73,030 | 8,955 | 12.3% | 7,640 | 10.5% |
| Italy | 296,265 | 20,215 | 6.8% | 17,360 | 5.9% |
| Korea, South | 98,075 | 36,420 | 37.1% | 35,690 | 36.4% |
| Mexico | 49,745 | 8,875 | 17.8% | 10,965 | 22.0% |
| Netherlands | 111,170 | 6,520 | 5.9% | 8,365 | 7.5% |
| Poland | 169,790 | 17,225 | 10.1% | 15,630 | 9.2% |
| Portugal | 150,245 | 12,125 | 8.1% | 11,155 | 7.4% |
| United Kingdom | 575,405 | 38,030 | 6.6% | 39,175 | 6.8% |
| United States | 248,240 | 27,105 | 10.9% | 30,035 | 12.1% |
| Other OECD Countries | 294,945 | 35,820 | 12.1% | 34,730 | 11.8% |
| Non-OECD countries | Total - Number of persons | Persons with family income below LICO (after tax) | Persons with family income below LICO (after tax) % | Persons with family income below LIM (after tax) | Persons with family income below LIM (after tax) % |
|---|---|---|---|---|---|
| Afghanistan | 36,145 | 14,440 | 40.0% | 14,390 | 39.8% |
| Algeria | 32,145 | 12,180 | 37.9% | 11,370 | 35.4% |
| Bosnia and Herzegovina | 28,700 | 3,565 | 12.4% | 3,525 | 12.3% |
| China, People's Republic of | 465,925 | 119,785 | 25.7% | 113,520 | 24.4% |
| Columbia | 39,075 | 13,540 | 34.7% | 13,790 | 35.3% |
| El Salvador | 42,730 | 6,910 | 16.2% | 6,390 | 15.0% |
| Ethiopia | 19,630 | 6,825 | 34.8% | 6,300 | 32.1% |
| Guyana | 87,075 | 10,445 | 12.0% | 9,315 | 10.7% |
| Haiti | 63,270 | 15,885 | 25.1% | 14,175 | 22.4% |
| Hong Kong, SAR | 215,065 | 38,995 | 18.1% | 37,695 | 17.5% |
| India | 443,105 | 56,135 | 12.7% | 53,945 | 12.2% |
| Iraq | 33,505 | 11,270 | 33.6% | 11,380 | 34.0% |
| Iran | 91,945 | 28,240 | 30.7% | 27,160 | 29.5% |
| Jamaica | 123,160 | 20,035 | 16.3% | 18,050 | 14.7% |
| Kuwait | 10,515 | 3,750 | 35.7% | 3,865 | 36.8% |
| Lebanon | 75,180 | 20,370 | 27.1% | 19,275 | 25.6% |
| Morocco | 38,895 | 12,390 | 31.9% | 11,460 | 29.5% |
| Pakistan | 133,185 | 47,190 | 35.4% | 45,490 | 34.2% |
| Philippines | 302,850 | 32,600 | 10.8% | 30,235 | 10.0% |
| Romania | 82,465 | 13,920 | 16.9% | 13,005 | 15.8% |
| Russian Federation | 63,780 | 13,555 | 21.3% | 12,980 | 20.4% |
| Somalia | 19,470 | 10,040 | 51.6% | 10,130 | 52.0% |
| South Africa, Republic of | 38,145 | 2,970 | 7.8% | 2,840 | 7.4% |
| Sri Lanka | 105,600 | 20,950 | 19.8% | 18,915 | 17.9% |
| Taiwan | 65,075 | 26,495 | 40.7% | 26,240 | 40.3% |
| Ukraine | 59,235 | 10,215 | 17.2% | 9,300 | 15.7% |
| Viet Nam | 159,935 | 27,235 | 17.0% | 25,840 | 16.2% |
| Other non-OECD countries | 974,820 | 189,475 | 19.4% | 181,265 | 18.6% |
Source: Statistics Canada, 2006 Census of Population, CIC Custom Table and author's calculations.
Table 4B: Immigrated between 2001 and 2004
| Places of birth | Total - Number of persons | Persons with family income below LICO (after tax) | Persons with family income below LICO (after tax) % | Persons with family income below LIM (after tax) | Persons with family income below LIM (after tax) % |
|---|---|---|---|---|---|
| Total—Places of birth | 1,107,270 | 226,200 | 20.4% | 217,435 | 19.6% |
| Total—OECD Countries | 187,835 | 31,225 | 16.6% | 32,235 | 17.2% |
| Total—Non-OECD countries | 919,435 | 194,970 | 21.2% | 185,205 | 20.1% |
| OECD countries | Total - Number of persons | Persons with family income below LICO (after tax) | Persons with family income below LICO (after tax) % | Persons with family income below LIM (after tax) | Persons with family income below LIM (after tax) % |
|---|---|---|---|---|---|
| France | 17,045 | 1,765 | 10.4% | 1,675 | 9.8% |
| Germany | 7,560 | 870 | 11.5% | 1,255 | 16.6% |
| Greece | 1,050 | 170 | 16.2% | 150 | 14.3% |
| Italy | 2,265 | 245 | 10.8% | 255 | 11.3% |
| Korea, South | 35,355 | 13,265 | 37.5% | 12,990 | 36.7% |
| Mexico | 16,455 | 2,360 | 14.3% | 2,790 | 17.0% |
| Netherlands | 3,640 | 450 | 12.4% | 755 | 20.7% |
| Poland | 6,480 | 750 | 11.6% | 740 | 11.4% |
| Portugal | 2,950 | 340 | 11.5% | 295 | 10.0% |
| United Kingdom | 25,565 | 1,550 | 6.1% | 1,715 | 6.7% |
| United States | 38,580 | 4,520 | 11.7% | 4,730 | 12.3% |
| Other OECD Countries | 30,895 | 4,945 | 16.0% | 4,875 | 15.8% |
| Non-OECD countries | Total - Number of persons | Persons with family income below LICO (after tax) | Persons with family income below LICO (after tax) % | Persons with family income below LIM (after tax) | Persons with family income below LIM (after tax) % |
|---|---|---|---|---|---|
| Afghanistan | 16,225 | 5,710 | 35.2% | 5,790 | 35.7% |
| Algeria | 16,155 | 5,600 | 34.7% | 5,095 | 31.5% |
| Bosnia and Herzegovina | 2,605 | 560 | 21.5% | 490 | 18.8% |
| China, People's Republic of | 154,785 | 40,115 | 25.9% | 38,235 | 24.7% |
| Columbia | 25,260 | 5,125 | 20.3% | 5,450 | 21.6% |
| El Salvador | 2,870 | 530 | 18.5% | 495 | 17.2% |
| Ethiopia | 6,605 | 1,600 | 24.2% | 1,415 | 21.4% |
| Guyana | 7,270 | 700 | 9.6% | 600 | 8.3% |
| Haiti | 10,680 | 2,635 | 24.7% | 2,285 | 21.4% |
| Hong Kong, SAR | 7,365 | 2,440 | 33.1% | 2,340 | 31.8% |
| India | 128,985 | 12,330 | 9.6% | 11,560 | 9.0% |
| Iraq | 9,975 | 3,420 | 34.3% | 3,490 | 35.0% |
| Iran | 27,535 | 9,185 | 33.4% | 8,740 | 31.7% |
| Jamaica | 9,410 | 1,465 | 15.6% | 1,320 | 14.0% |
| Kuwait | 2,720 | 1,080 | 39.7% | 1,170 | 43.0% |
| Lebanon | 11,320 | 3,390 | 29.9% | 3,110 | 27.5% |
| Morocco | 14,710 | 5,280 | 35.9% | 4,940 | 33.6% |
| Pakistan | 57,615 | 19,190 | 33.3% | 17,970 | 31.2% |
| Philippines | 77,815 | 5,140 | 6.6% | 4,240 | 5.4% |
| Romania | 28,065 | 4,110 | 14.6% | 3,670 | 13.1% |
| Russian Federation | 21,100 | 3,905 | 18.5% | 3,880 | 18.4% |
| Somalia | 3,865 | 1,595 | 41.3% | 1,695 | 43.9% |
| South Africa, Republic of | 6,520 | 380 | 5.8% | 375 | 5.8% |
| Sri Lanka | 22,295 | 4,080 | 18.3% | 3,740 | 16.8% |
| Taiwan | 10,680 | 4,345 | 40.7% | 4,385 | 41.1% |
| Ukraine | 15,375 | 3,020 | 19.6% | 2,775 | 18.0% |
| Viet Nam | 10,535 | 1,605 | 15.2% | 1,545 | 14.7% |
| Other non-OECD countries | 211,095 | 46,450 | 22.0% | 44,420 | 21.0% |
Source: Statistics Canada, 2006 Census of Population, CIC Custom Table and author's calculations.
Immigrant source countries may also be closely related to returns to foreign work experience and education. As a result, source country characteristics of recent immigrants are often regarded as key indicators in immigrant low-income studies. In their 2003 study, Picot and Hou conclude that the source regions that had the largest increase in their share of the recent immigrant population also tend to have the highest increase in the low-income rates, such as the regions of Africa, Asia, and Southern Europe. As Picot and Sweetman (2005) point out, between 1981 and 2001, a decreasing share of immigrants came from the United States, Northern Europe, Southern Europe, the Caribbean, South and Central America, and Southeast Asia; the share of recent immigrants from these areas fell from 65% to 28%. Conversely, regions such as Eastern Europe, South Asia, East Asia, Western Asia, and Africa increased their shares from 35% in 1981 to 72% in 2001. Moreover, Picot and Sweetman (2012) find that with regards to rising low-income rates observed among immigrants, the low-income rate increased little among immigrants from the traditional source regions (such as Western Europe and the United States); the majority of the increase was concentrated among immigrants from the newer source regions (such as China, India, other Asian nations, and Africa). The recent immigrants from these regions may have lower income levels in their first years in Canada, since their human capital may be initially less transferable due to potential issues regarding language, cultural differences, education quality, and possibly discrimination. As a result, country of origin can lend insight into appropriate policy responses to address low-income incidence among specific immigrant groups.
Demographics (e.g., family size and composition)
Immigrants living with non-family members or immigrants living alone may be more likely to live in a low-income situation compared to those who live in a family situation. Based on 2006 Census data, Table 5 presents the after-tax low-income status (both LICO and LIM) of immigrants by number of years since immigration and economic family status, for Canada, in 2005. As shown, looking at persons with family income below LICO, 46.9% of immigrants living with non-relatives were living in a low-income situation in 2005, compared with 29.2% of those immigrants living alone, and 14.4% of those immigrants living in an economic family (comparable rates for the Canadian-born were 38.3%, 22.5%, and 6.8%, respectively). Although the pattern remains the same regardless of period of immigration, differences in low-income status between those living with non-relatives and those living alone were to some extent less pronounced in 2005 among the more established immigrant cohorts. For example, for those in Canada 10 to 15 years (those who immigrated between 1991 and 1995), 46.3% of those living with non-relatives in 2005 were in low-income, compared to 41.9% of those living alone, while the rate was 15.3% for those living in an economic family. In comparison, for recent immigrants (those who immigrated between 2001 and 2004), 55.6% of those living with non-relatives in 2005 were in low-income, compared to 44.1% of those living alone, while the rate was 25.6% for those living in an economic family. Although differing in magnitude to some extent, these patterns are similar for low-income status of immigrants by family type based on the after-tax LIM.
Table 5: After tax low income status of immigrants by number of years since immigration and economic family status, Canada, 2005
Table 5A: Canadian-born persons
| Economic status of families | Total - Number of persons | Persons with family income below LICO (after tax) | Persons with family income below LICO (after tax) % | Persons with family income below LIM (after tax) | Persons with family income below LIM (after tax) % |
|---|---|---|---|---|---|
| Total - Canadian-born persons | 24,651,925 | 2,343,940 | 9.5% | 2,697,195 | 10.9% |
| In economic family | 21,161,145 | 1,435,200 | 6.8% | 1,809,035 | 8.5% |
| Persons living alone | 2,705,005 | 607,575 | 22.5% | 597,685 | 22.1% |
| Persons living with non-relatives only | 785,775 | 301,165 | 38.3% | 290,480 | 37.0% |
Table 5B: Immigrantstable note *
| Economic status of families | Total - Number of persons | Persons with family income below LICO (after tax) | Persons with family income below LICO (after tax) % | Persons with family income below LIM (after tax) | Persons with family income below LIM (after tax) % |
|---|---|---|---|---|---|
| Total - Immigrants | 6,166,770 | 1,025,185 | 16.6% | 988,115 | 16.0% |
| Persons in economic family | 5,421,250 | 781,000 | 14.4% | 781,640 | 14.4% |
| Persons living alone | 594,670 | 173,375 | 29.2% | 143,150 | 24.1% |
| Persons living with non-relatives only | 150,850 | 70,810 | 46.9% | 63,320 | 42.0% |
Table 5C: Immigrated before 1981
| Economic status of families | Total - Number of persons | Persons with family income below LICO (after tax) | Persons with family income below LICO (after tax) % | Persons with family income below LIM (after tax) | Persons with family income below LIM (after tax) % |
|---|---|---|---|---|---|
| Total - Immigrated before 1981 | 2,393,355 | 187,350 | 7.8% | 175,200 | 7.3% |
| Persons in economic family | 1,966,790 | 89,100 | 4.5% | 98,275 | 5.0% |
| Persons living alone | 385,390 | 84,800 | 22.0% | 65,160 | 16.9% |
| Persons living with non-relatives only | 41,175 | 13,450 | 32.7% | 11,770 | 28.6% |
Table 5D: Immigrated between 1981 and 1985
| Economic status of families | Total - Number of persons | Persons with family income below LICO (after tax) | Persons with family income below LICO (after tax) % | Persons with family income below LIM (after tax) | Persons with family income below LIM (after tax) % |
|---|---|---|---|---|---|
| Total - Immigrated between 1981 and 1985 | 360,450 | 44,450 | 12.3% | 42,650 | 11.8% |
| Persons in economic family | 317,400 | 28,320 | 8.9% | 29,010 | 9.1% |
| Persons living alone | 33,395 | 12,455 | 37.3% | 10,285 | 30.8% |
| Persons living with non-relatives only | 9,650 | 3,675 | 38.1% | 3,355 | 34.8% |
Table 5E: Immigrated between 1986 and 1990
| Economic status of families | Total - Number of persons | Persons with family income below LICO (after tax) | Persons with family income below LICO (after tax) % | Persons with family income below LIM (after tax) | Persons with family income below LIM (after tax) % |
|---|---|---|---|---|---|
| Total - Immigrated between 1986 and 1990 | 640,440 | 92,220 | 14.4% | 88,495 | 13.8% |
| Persons in economic family | 578,925 | 67,680 | 11.7% | 66,890 | 11.6% |
| Persons living alone | 44,665 | 17,530 | 39.2% | 15,385 | 34.4% |
| Persons living with non-relatives only | 16,845 | 7,010 | 41.6% | 6,220 | 36.9% |
Table 5F: Immigrated between 1991 and 1995
| Economic status of families | Total - Number of persons | Persons with family income below LICO (after tax) | Persons with family income below LICO (after tax) % | Persons with family income below LIM (after tax) | Persons with family income below LIM (after tax) % |
|---|---|---|---|---|---|
| Total - Immigrated between 1991 and 1995 | 822,220 | 143,740 | 17.5% | 138,705 | 16.9% |
| Persons in economic family | 757,775 | 115,875 | 15.3% | 114,340 | 15.1% |
| Persons living alone | 45,030 | 18,890 | 41.9% | 16,590 | 36.8% |
| Persons living with non-relatives only | 19,410 | 8,980 | 46.3% | 7,775 | 40.1% |
Table 5G: Immigrated between 1996 and 2000
| Economic status of families | Total - Number of persons | Persons with family income below LICO (after tax) | Persons with family income below LICO (after tax) % | Persons with family income below LIM (after tax) | Persons with family income below LIM (after tax) % |
|---|---|---|---|---|---|
| Total - Immigrated between 1996 and 2000 | 843,035 | 173,855 | 20.6% | 168,765 | 20.0% |
| Persons in economic family | 784,740 | 149,085 | 19.0% | 146,690 | 18.7% |
| Persons living alone | 38,370 | 15,085 | 39.3% | 13,335 | 34.8% |
| Persons living with non-relatives only | 19,935 | 9,690 | 48.6% | 8,740 | 43.8% |
Table 5H: Immigrated between 2001 and 2004
| Economic status of families | Total - Number of persons | Persons with family income below LICO (after tax) | Persons with family income below LICO (after tax) % | Persons with family income below LIM (after tax) | Persons with family income below LIM (after tax) % |
|---|---|---|---|---|---|
| Total - Immigrated between 2001 and 2004 | 824,670 | 226,200 | 27.4% | 217,440 | 26.4% |
| Persons in economic family | 759,845 | 194,340 | 25.6% | 189,485 | 24.9% |
| Persons living alone | 36,350 | 16,035 | 44.1% | 14,150 | 38.9% |
| Persons living with non-relatives only | 28,475 | 15,820 | 55.6% | 13,800 | 48.5% |
Source: Statistics Canada, 2006 Census of Population, CIC Custom Table and author's calculations.
By family type, the research consistently shows that lone-parents and unattached individuals are more likely to be in low-income. As a result, low-income rates are influenced by demographic change such as an increase in the number of single-parent families, which can cause the aggregate rate to rise.Footnote 89 There is some research to suggest that an increased incidence of lone-parenthood has increased low-income among recent immigrants (landed within the past decade) (analysis based on the Survey of Consumer Finances, 1977 to 1997, Liu and Kerr, 2003). Dempsey (2006) observes that immigrant lone-parents and unattached immigrants report the lowest income of all groups. Moreover, the study by Dempsey finds that lone-parents and unattached individuals over 60 years of age also have the worst income situations for their age group as there are fewer contributors to the family income. In addition, the study reports that immigrant lone-parents and unattached immigrants aged 60 years or older are less likely to report employment earnings and more likely to report government income transfer benefits, and they are more likely to report non-contributory retirement income sources such as provincial supplement, OAS, and GIS. Regarding the age group under 60, immigrant lone-parents and unattached individuals are also found to have the lowest family employment earnings, and economic principal applicants are likely to be sole-contributors and have lower family employment earnings. Accounting for family type, the study by Dempsey observes that immigrants as lone-parents and unattached individuals have the lowest family employment earnings, and immigrant seniors are less self-sufficient that non-immigrant seniors.
In fact, family composition can have a large impact on observed low-income rates. As an example, Plante and van den Berg (2011) use SLID data for the years 1996 to 2008 and undertake a decomposition technique to determine what the situation would be in four Canadian provinces – Alberta, British Columbia, Ontario, and Quebec – if they had the same demographic profiles (for example, the same number of two parent and single parent families). The low-income measure used in this analysis is 50% of median income, with low-income thresholds and low-income rates estimated independently for each province and year of analysis using 2008 real dollars, scaled by the provincial level Consumer Price Index. The analysis shows that prior to considering the impact of the provincial demographic profiles, Quebec had low-income rates that were lower than those for the other three provinces (based on the mean low-income rate in each province, taken over the 13 years of analysis).Footnote 90 However, once adjustments were made to account for the fact that Quebec had fewer two parent families than other provinces, the authors found that if Ontario, Alberta, and British Columbia had the same demographic make up as Quebec, their low-income rates would be much higher than Quebec’s. Moreover, if Quebec had Ontario’s demographic characteristics, its low-income rate would be even lower.
Research suggests that recent immigrants may be more likely to be part of a working poor family as compared with other low-income Canadians. The study by Fleury (2007) using data from the SLID examines the phenomenon of low-income and working low-income among the group of immigrants who arrived in Canada since the early nineties (called in this study “recent immigrants”). The study finds that the profile of low-income among recent immigrants differs in many aspects from that of other low-income Canadians. Notably, recent working-age immigrants living in low-income are less likely to depend on government transfers and are more likely to rely on family support to fulfill their needs.Footnote 91 For recent immigrants not living in low-income, the findings by Fleury suggest it is also much more likely that they avoid low-income because of family support rather than because of their labour market income.
Differences through time in the ethnic composition of immigrants and a tendency to live in multi-generational, extended family, or multi-family households could impact low-income trends. For example, Picot, Lu, and Hou (2009) describe how low-income rates are based on the total income of the family in which seniors live. As a result, for example, if immigrant seniors were more likely to live in multi-generational economic families with more and younger earners, this would be reflected in a rising market income available to seniors. The authors argue that the family situation of immigrant seniors is important since the less time they have been in Canada, the lesser the effect of the transfer system on their low-income rates. To be effective, policy development in the area of low-income and immigrants must account for the role that family composition may be playing in the observed outcomes and trends.
Levels of immigration and settlement patterns
Consistent with the situation of the Canadian-born population, the relative economic outcomes of immigrants vary by province. Variations in employment earnings may arise across provinces due to a number of factors, including local labour market conditions, minimum wage laws, and differences in industrial and occupational concentrations across regions. Where an immigrant settles can influence economic outcomes due to differences in regional industrial composition and varying impacts of the business cycle on industrial make up. For example, earnings in Ontario were hardest hit by the decline in employment in the Information Technology sector in the early 2000s, which had a negative impact on earnings of recent immigrants going to that province. Based on 2006 Census data, Table 6 presents the after-tax low-income status (both LICO and LIM) of immigrants by years since immigration and province, for Canada, in 2005. As shown, looking at persons with family income below LICO, the highest proportions of immigrants living with low-incomes in 2005 were also the three largest immigrant receiving provinces, that is, Quebec, with an after-tax low-income rate among immigrants of 24.1%, followed by British Columbia and Ontario, at 17.8% and 15.4%, respectively. Among the Canadian-born, the outlook differs, with the highest low-income rates in 2005 occurring in Manitoba (10.9%), Quebec (10.7%), British Columbia (10.3%) and Newfoundland and Labrador (10.0%). In contrast, in 2005, the lowest rates of low-income occurred for immigrants living in Saskatchewan (10.1%), Newfoundland and Labrador (11.0%), and New Brunswick (11.3%). Comparing the most recent cohort of immigrants (those landed between 2001 and 2004) to those more established (those landed between 1991 and 1995), similar patterns evolve, but low-income rates are higher for those landed most recently. For example the low-income rates for immigrants landed between 2001 and 2004 were 37.6% for those in Quebec, 28.9% for those in British Columbia, and 25.9% for those in Ontario; these proportions were 24.1%, 20.4%, and 16.0%, among those landed between 1991 and 1995, respectively. Note that the proportion of immigrants in a low-income situation was relatively high in Prince Edward Island in 2005, with a rate of 28.3% among the most recent cohort, and 22.2% among those landed between 1991 and 1995. There are some interesting differences in low-income status by province based on the after-tax LIM. For instance, looking at persons with family income below LIM, the highest proportions of immigrants living with low-incomes in 2005 were living in Quebec, with an after-tax low-income rate among immigrants of 22.3%, followed by those living in Prince Edward Island and British Columbia, at 19.6% and 17.6%, respectively. Among the Canadian-born, the outlook differs, with the highest LIM low-income rates in 2005 occurring in Newfoundland and Labrador (15.9%), Nova Scotia (14.0%), and New Brunswick (13.8%).
Table 6: After tax low income status of immigrants by number of years since immigration and provinceFootnote 92, Canada, 2005
Table 6A: Canadian-born persons
| Province | Total - Number of persons | Persons with family income below LICO (after tax) | Persons with family income below LICO (after tax) % | Persons with family income below LIM (after tax) | Persons with family income below LIM (after tax) % |
|---|---|---|---|---|---|
| Total - Canadian-born persons | 24,651,925 | 2,343,940 | 9.5% | 2,697,195 | 10.9% |
| Newfoundland and Labrador | 489,440 | 48,880 | 10.0% | 77,805 | 15.9% |
| Nova Scotia | 851,600 | 78,335 | 9.2% | 119,135 | 14.0% |
| Prince Edward Island | 128,310 | 8,550 | 6.7% | 14,590 | 11.4% |
| New Brunswick | 688,165 | 61,955 | 9.0% | 94,735 | 13.8% |
| Quebec | 6,499,785 | 692,700 | 10.7% | 746,030 | 11.5% |
| Ontario | 8,479,355 | 753,745 | 8.9% | 842,245 | 9.9% |
| Manitoba | 961,500 | 104,505 | 10.9% | 117,550 | 12.2% |
| Saskatchewan | 893,615 | 82,195 | 9.2% | 120,535 | 13.5% |
| Alberta | 2,676,790 | 216,130 | 8.1% | 231,830 | 8.7% |
| British Columbia | 2,890,260 | 296,960 | 10.3% | 332,740 | 11.5% |
Table 6B: Immigrantstable note *
| Province | Total - Number of persons | Persons with family income below LICO (after tax) | Persons with family income below LICO (after tax) % | Persons with family income below LIM (after tax) | Persons with family income below LIM (after tax) % |
|---|---|---|---|---|---|
| Total - Immigrants | 6,166,770 | 1,025,185 | 16.6% | 988,115 | 16.0% |
| Newfoundland and Labrador | 8,315 | 915 | 11.0% | 1,095 | 13.2% |
| Nova Scotia | 44,880 | 5,425 | 12.1% | 7,040 | 15.7% |
| Prince Edward Island | 4,755 | 695 | 14.6% | 930 | 19.6% |
| New Brunswick | 26,220 | 2,970 | 11.3% | 4,305 | 16.4% |
| Quebec | 848,920 | 204,420 | 24.1% | 189,145 | 22.3% |
| Ontario | 3,389,130 | 523,270 | 15.4% | 502,635 | 14.8% |
| Manitoba | 150,665 | 21,550 | 14.3% | 21,850 | 14.5% |
| Saskatchewan | 47,860 | 4,815 | 10.1% | 6,450 | 13.5% |
| Alberta | 524,845 | 62,980 | 12.0% | 58,565 | 11.2% |
| British Columbia | 1,115,005 | 198,135 | 17.8% | 196,100 | 17.6% |
Table 6C: Immigrated before 1981
| Province | Total - Number of persons | Persons with family income below LICO (after tax) | Persons with family income below LICO (after tax) % | Persons with family income below LIM (after tax) | Persons with family income below LIM (after tax) % |
|---|---|---|---|---|---|
| Total - Immigrated before 1981 | 2,393,355 | 187,350 | 7.8% | 175,200 | 7.3% |
| Newfoundland and Labrador | 4,340 | 235 | 5.4% | 320 | 7.4% |
| Nova Scotia | 24,100 | 1,340 | 5.6% | 2,015 | 8.4% |
| Prince Edward Island | 2,770 | 130 | 4.7% | 235 | 8.5% |
| New Brunswick | 14,320 | 690 | 4.8% | 1,290 | 9.0% |
| Quebec | 296,445 | 35,175 | 11.9% | 29,815 | 10.1% |
| Ontario | 1,320,280 | 94,920 | 7.2% | 88,275 | 6.7% |
| Manitoba | 68,110 | 5,280 | 7.8% | 4,720 | 6.9% |
| Saskatchewan | 24,005 | 1,260 | 5.2% | 2,010 | 8.4% |
| Alberta | 202,505 | 13,100 | 6.5% | 10,855 | 5.4% |
| British Columbia | 433,695 | 35,220 | 8.1% | 35,670 | 8.2% |
Table 6D: Immigrated between 1981 and 1985
| Province | Total - Number of persons | Persons with family income below LICO (after tax) | Persons with family income below LICO (after tax) % | Persons with family income below LIM (after tax) | Persons with family income below LIM (after tax) % |
|---|---|---|---|---|---|
| Total - Immigrated between 1981 and 1985 | 360,450 | 44,450 | 12.3% | 42,650 | 11.8% |
| Newfoundland and Labrador | 345 | 25 | 7.2% | 40 | 11.6% |
| Nova Scotia | 2,470 | 150 | 6.1% | 220 | 8.9% |
| Prince Edward Island | 245 | 10 | 4.1% | 15 | 6.1% |
| New Brunswick | 1,750 | 100 | 5.7% | 155 | 8.9% |
| Quebec | 54,680 | 9,835 | 18.0% | 9,440 | 17.3% |
| Ontario | 184,080 | 21,315 | 11.6% | 20,210 | 11.0% |
| Manitoba | 10,250 | 1,075 | 10.5% | 1,110 | 10.8% |
| Saskatchewan | 2,950 | 225 | 7.6% | 265 | 9.0% |
| Alberta | 39,845 | 3,645 | 9.1% | 3,105 | 7.8% |
| British Columbia | 63,415 | 8,070 | 12.7% | 8,080 | 12.7% |
Table 6E: Immigrated between 1986 and 1990
| Province | Total - Number of persons | Persons with family income below LICO (after tax) | Persons with family income below LICO (after tax) % | Persons with family income below LIM (after tax) | Persons with family income below LIM (after tax) % |
|---|---|---|---|---|---|
| Total - Immigrated between 1986 and 1990 | 640,440 | 92,220 | 14.4% | 88,495 | 13.8% |
| Newfoundland and Labrador | 670 | 60 | 9.0% | 75 | 11.2% |
| Nova Scotia | 3,535 | 490 | 13.9% | 620 | 17.5% |
| Prince Edward Island | 300 | 70 | 23.3% | 75 | 25.0% |
| New Brunswick | 1,880 | 185 | 9.8% | 295 | 15.7% |
| Quebec | 86,370 | 18,115 | 21.0% | 16,840 | 19.5% |
| Ontario | 373,100 | 50,210 | 13.5% | 48,050 | 12.9% |
| Manitoba | 13,810 | 1,575 | 11.4% | 1,510 | 10.9% |
| Saskatchewan | 3,435 | 250 | 7.3% | 335 | 9.8% |
| Alberta | 51,380 | 5,170 | 10.1% | 4,635 | 9.0% |
| British Columbia | 105,550 | 16,100 | 15.3% | 16,060 | 15.2% |
Table 6F: Immigrated between 1991 and 1995
| Province | Total - Number of persons | Persons with family income below LICO (after tax) | Persons with family income below LICO (after tax) % | Persons with family income below LIM (after tax) | Persons with family income below LIM (after tax) % |
|---|---|---|---|---|---|
| Total - Immigrated between 1991 and 1995 | 822,220 | 143,740 | 17.5% | 138,705 | 16.9% |
| Newfoundland and Labrador | 695 | 115 | 16.5% | 130 | 18.7% |
| Nova Scotia | 3,520 | 590 | 16.8% | 755 | 21.4% |
| Prince Edward Island | 270 | 60 | 22.2% | 65 | 24.1% |
| New Brunswick | 1,875 | 140 | 7.5% | 340 | 18.1% |
| Quebec | 109,425 | 26,425 | 24.1% | 24,555 | 22.4% |
| Ontario | 461,250 | 74,000 | 16.0% | 71,485 | 15.5% |
| Manitoba | 13,145 | 1,525 | 11.6% | 1,490 | 11.3% |
| Saskatchewan | 4,310 | 410 | 9.5% | 505 | 11.7% |
| Alberta | 62,100 | 6,880 | 11.1% | 6,485 | 10.4% |
| British Columbia | 164,870 | 33,595 | 20.4% | 32,900 | 20.0% |
Table 6G: Immigrated between 1996 and 2000
| Province | Total - Number of persons | Persons with family income below LICO (after tax) | Persons with family income below LICO (after tax) % | Persons with family income below LIM (after tax) | Persons with family income below LIM (after tax) % |
|---|---|---|---|---|---|
| Total - Immigrated between 1996 and 2000 | 843,035 | 173,855 | 20.6% | 168,765 | 20.0% |
| Newfoundland and Labrador | 850 | 105 | 12.4% | 115 | 13.5% |
| Nova Scotia | 4,405 | 715 | 16.2% | 930 | 21.1% |
| Prince Edward Island | 320 | 25 | 7.8% | 70 | 21.9% |
| New Brunswick | 2,120 | 285 | 13.4% | 440 | 20.8% |
| Quebec | 108,835 | 28,130 | 25.8% | 26,380 | 24.2% |
| Ontario | 470,790 | 92,135 | 19.6% | 88,925 | 18.9% |
| Manitoba | 14,255 | 2,065 | 14.5% | 2,385 | 16.7% |
| Saskatchewan | 5,090 | 515 | 10.1% | 670 | 13.2% |
| Alberta | 65,600 | 7,755 | 11.8% | 7,615 | 11.6% |
| British Columbia | 170,035 | 42,140 | 24.8% | 41,230 | 24.2% |
Table 6H: Immigrated between 2001 and 2004
| Province | Total - Number of persons | Persons with family income below LICO (after tax) | Persons with family income below LICO (after tax) % | Persons with family income below LIM (after tax) | Persons with family income below LIM (after tax) % |
|---|---|---|---|---|---|
| Total - Immigrated between 2001 and 2004 | 824,670 | 226,200 | 27.4% | 217,440 | 26.4% |
| Newfoundland and Labrador | 1,055 | 190 | 18.0% | 215 | 20.4% |
| Nova Scotia | 4,795 | 1,150 | 24.0% | 1,410 | 29.4% |
| Prince Edward Island | 530 | 150 | 28.3% | 210 | 39.6% |
| New Brunswick | 2,810 | 605 | 21.5% | 770 | 27.4% |
| Quebec | 141,485 | 53,135 | 37.6% | 49,240 | 34.8% |
| Ontario | 439,330 | 113,820 | 25.9% | 109,495 | 24.9% |
| Manitoba | 21,685 | 4,955 | 22.8% | 5,340 | 24.6% |
| Saskatchewan | 5,485 | 920 | 16.8% | 1,330 | 24.2% |
| Alberta | 75,575 | 13,350 | 17.7% | 12,665 | 16.8% |
| British Columbia | 131,140 | 37,925 | 28.9% | 36,750 | 28.0% |
Source: Statistics Canada, 2006 Census of Population, CIC Custom Table and author's calculations.
According to Picot and Hou (2003), province of residence of recent immigrants plays a considerable role in their low-income situation. These authors argue this is particularly the case for the Census Metropolitan Areas (CMAs) in the provinces of Ontario and British Columbia, where immigrants constitute a large share of the population and deteriorating outcomes regarding low-income tend to have been concentrated among the immigrant population. Moreover, these authors suggest that rising low-income rates within the recent immigrant population particularly in Toronto and Vancouver since 1990 is increasingly worrisome given that the Canadian-born populations within these cities have experienced declines in their low-income rates over this same period. In a study using earlier Census data, Ley and Smith (1997) study the relationship between immigration and low-income in Canadian Cities over the period 1971 through 1991. Similar to Picot and Hou, they conclude that concentrated low-income in Canadian cities does involve the recently arrived immigrant population (although the importance of their role in the measures of low-income is not as large as is found in European studies). These authors find that the greatest incidence of deep low-income is found in Montreal. In addition, these authors conclude that the movement of affordable housing in Toronto out of the inner city led to an increase in low-income in the suburbs (see also Ley and Smith, 2000).
Indeed, geographically speaking, most immigrants to Canada settle in the three large CMAs of Toronto, Vancouver, and Montreal. Relatively smaller proportions of immigrants settle in medium sized CMAs such as Calgary and Winnipeg, although these proportions have been increasing in recent years. These settlement patterns of immigrants combined with the local labour market’s ability to absorb immigrant inflows may have contributed to observed low-income trends. Before the early 1990s, the government cut the level of immigration during recessions when the absorptive capacity of the economy was believed to be low.Footnote 93 Large numbers of immigrants settled in the late 1980s and early 1990s as the economy was entering a severe recession in the 1990 to 1991 period. Inflows continued at this level through the early 1990s, a period of high unemployment and sluggish employment growth. Thompson (2004) argues that there may have been a structural decrease in the employment rate of recent immigrants relative to the Canadian-born in large CMAs that experienced relatively higher immigration rates during the recession of the early 1990s, whereas this may be less likely in cities with lower immigration rates during this period. This could be the case, this author argues if, for instance, there is a large accumulation of immigrants that have not been able to enter the labour market, so that by the time the economy recovers, the capacity of the labour market to absorb new cohorts is influenced by previous cohorts still trying to enter the labour market. Picot and Sweetman (2012) note that there is a belief in some quarters that immigrant economic outcomes would improve if there was a greater regional distribution of immigrants.
In brief, key to understanding the factors contributing to the low-income situations of immigrants is accounting for immigrant settlement patterns, as well as the levels (density) of that settlement. Matching these characteristics with local economic and social conditions allows for more targeted policy development that is specific to people, place and time. Research exists that supports the possibility that the immigrant composition, economic level, and education composition of the places in which immigrants live play role in their income outcomes. Moreover, the majority of measures currently in place to support those living in low-income situations (such as social assistance, affordable housing initiatives, etc.) are the responsibility of provincial and municipal governments.
Skills immigrants bring with them (e.g., education, official language knowledge and literacy, experience, etc.)
The connection between official language ability and economic outcomes of immigrants has been well-discussed in the research literature (see, for example, Bonikowska, Green and Riddell, 2008; Grondin, 2005; Picot and Sweetman, 2005). While data limitations have meant that it has been difficult to accurately measure the impact of knowledge of official languages on labour market outcomes, all evidence points to this as being a significant barrier to immigrant economic success.Footnote 94 Research indicates that overall, immigrants with knowledge of one or both of Canada’s official languages have a superior integration into the labour market relative to those who land with no knowledge of English or French. Moreover, the transferability of human capital, such as education and experience, can be severely limited by a lack of knowledge of either official language. A degree obtained abroad, regardless of its intrinsic value to the Canadian labour market, holds little value if the holder speaks neither official language. For example, using the Longitudinal Survey of Immigrants to Canada (LSIC), Goldmann, Sweetman, and Warman (2011) find the return to education to new immigrants is modest and only observed to be statistically significant for those who match their pre- and post-immigration occupation and/or have high levels of English language ability. In general, their study finds language skills appear to be crucial in mediating the use of formal pre-immigration education (but not labour market experience) in the Canadian labour market.
Based on 2006 Census data, Table 7 presents the after-tax low-income status (both LICO and LIM) of immigrants by self-reported official language ability,Footnote 95 for Canada, in 2005. As shown, looking at persons with family income below LICO, the highest proportions of immigrants living with low-incomes in 2005 were those that reported knowledge of French only (28.3%) or neither English nor French (25.5%). This is followed by those who report knowledge of both English and French (17.4%) while those that report speaking English only had the lowest low-income rate in 2005, at 15.2%. For Canadian-born persons, a similar pattern is observed in 2005, with a low-income rate of 21.7% for those who report speaking neither English nor French, 10.8% for those reporting speaking French only, followed by those that report speaking English only or English and French, each at 9.2%. The same trend by self-reported knowledge of an official language for immigrants holds, regardless of years spent in Canada (although the magnitude of the rates of low-income declined with years spent in Canada for each reported official language knowledge in 2005), and while these outcomes may appear surprising, many factors could explain these outcomes. Specifically, the relationship between self-reported ability to speak French and the chances of having employment earnings and not falling into low-income is not clear. This is the case nationally and in Quebec where French language ability is not statistically related to an immigrants’ probability of having employment. For example, Citizenship and Immigration Canada (1998b) finds that while the capacity to speak English significantly improves immigrants’ labour market outcomes, such an advantage is not equally shared with those who speak French, particularly outside of Quebec. Before any conclusions can be drawn on the basis of the observations in Table 7, it is important to consider how the age, education, sector of employment, occupational mobility, source country and category of admission vary across groups of immigrants based on their reported language abilities in English and French. It may be that these surprising results related to the performance of French-speaking immigrants reflect other factors that are correlated with language fluency.
Fewer entering immigrants have a home language or mother tongue that is either English or French, while language and communication skills are related to productivity and the wages of workers. As a result, any decline in language skills among entering immigrants can affect the earnings situation of immigrants.Footnote 96 In an extensive review of the immigrant economic literature, Picot and Sweetman (2005) cite studies such as those by Baker and Benjamin (1994), Frenette and Morissette (2003), and Aydemir and Skuterud (2005), arguing that perhaps one-third of a decline seen in entry level earnings is associated with changing characteristics of entering immigrants, particularly a shift in source regions and home language. Ferrer, Green, and Riddell (2004), using the 1998 Ontario Adult Literacy Survey, find that average literacy and numeracy of immigrants are significantly below the averages of Canadian-born individuals with equivalent educational credentials and other observable characteristics. Canadian labour markets appear to reward the literacy and numeracy of immigrants to Canada in the same way that they do the Canadian-born: the study found that a 100-point increase in literacy score yielded the same return to both groups. In a more recent study, using test score data from the International Adult Literacy and Life Skills Survey (IALLS) assessing literacy, numeracy and problem-solving skills of Canada’s adult population, Skuterud (2011) finds evidence of large gaps in immigrant language skills, which appear not only strongly related to labour market earnings, but are substantially larger for immigrants with a foreign mother tongue and who use a foreign language at home.Footnote 97 In light of this evidence, the author uses information on mother tongue and home language of recent immigrants from four Censuses (1971 to 2006) to proxy language abilities and explore the possibility of increasing returns to language skills in Canadian labour markets. In doing so, the author finds deterioration in new immigrants’ earnings, relative to similarly aged and educated Canadian-born workers that has clearly been most pronounced among immigrants with a foreign mother tongue and home language. This appears particularly evident in the results for women and is evident even after the 1990s when the percentage of recent immigrants with a foreign mother tongue and home language began to decline. It also continues to be true after controlling for the region of an immigrant’s birth, suggesting further that it reflects a change in the return to language skills, rather than a change in language skills themselves. The author argues that the results of the analysis suggest a larger role for language in explaining the well-documented labour market challenges of Canada’s recent immigrants.
Table 7: After tax low income status of immigrants by number of years since immigration and knowledge of official language, Canada, 2005
Table 7A: Canadian-born persons
| Knowledge of official languages | Total - Number of persons | Persons with family income below LICO (after tax) | Persons with family income below LICO (after tax) % | Persons with family income below LIM (after tax) | Persons with family income below LIM (after tax) % |
|---|---|---|---|---|---|
| Total - Canadian-born persons | 24,651,930 | 2,343,945 | 9.5% | 2,697,195 | 10.9% |
| English only | 16,056,635 | 1,479,275 | 9.2% | 1,746,725 | 10.9% |
| French only | 3,863,900 | 415,875 | 10.8% | 480,190 | 12.4% |
| English and French | 4,630,145 | 426,810 | 9.2% | 447,625 | 9.7% |
| Neither English nor French | 101,245 | 21,985 | 21.7% | 22,655 | 22.4% |
Table 7B: Immigrantstable note *
| Knowledge of official languages | Total - Number of persons | Persons with family income below LICO (after tax) | Persons with family income below LICO (after tax) % | Persons with family income below LIM (after tax) | Persons with family income below LIM (after tax) % |
|---|---|---|---|---|---|
| Total - Immigrants | 6,166,770 | 1,025,185 | 16.6% | 988,115 | 16.0% |
| English only | 4,769,740 | 723,830 | 15.2% | 703,345 | 14.7% |
| French only | 240,730 | 68,105 | 28.3% | 63,690 | 26.5% |
| English and French | 758,915 | 132,090 | 17.4% | 124,890 | 16.5% |
| Neither English nor French | 397,390 | 101,165 | 25.5% | 96,180 | 24.2% |
Table 7C: Immigrated before 1981
| Knowledge of official languages | Total - Number of persons | Persons with family income below LICO (after tax) | Persons with family income below LICO (after tax) % | Persons with family income below LIM (after tax) | Persons with family income below LIM (after tax) % |
|---|---|---|---|---|---|
| Total - Immigrated before 1981 | 2,393,355 | 187,350 | 7.8% | 175,205 | 7.3% |
| English only | 1,930,750 | 139,670 | n/a | 133,610 | n/a |
| French only | 68,625 | 8,790 | n/a | 7,625 | n/a |
| English and French | 300,700 | 26,835 | 8.9% | 24,725 | 8.2% |
| Neither English nor French | 93,280 | 12,055 | 12.9% | 9,240 | 9.9% |
Table 7D: Immigrated between 1981 and 1985
| Knowledge of official languages | Total - Number of persons | Persons with family income below LICO (after tax) | Persons with family income below LICO (after tax) % | Persons with family income below LIM (after tax) | Persons with family income below LIM (after tax) % |
|---|---|---|---|---|---|
| Total - Immigrated between 1981 and 1985 | 360,450 | 44,450 | 12.3% | 42,650 | 11.8% |
| English only | 268,585 | 29,705 | n/a | 28,765 | n/a |
| French only | 15,255 | 3,205 | 21.0% | 3,110 | 20.4% |
| English and French | 49,590 | 6,335 | 12.8% | 6,050 | 12.2% |
| Neither English nor French | 27,020 | 5,205 | 19.3% | 4,725 | 17.5% |
Table 7E: Immigrated between 1986 and 1990
| Knowledge of official languages | Total - Number of persons | Persons with family income below LICO (after tax) | Persons with family income below LICO (after tax) % | Persons with family income below LIM (after tax) | Persons with family income below LIM (after tax) % |
|---|---|---|---|---|---|
| Total - Immigrated between 1986 and 1990 | 640,440 | 92,225 | 14.4% | 88,495 | 13.8% |
| English only | 492,725 | 65,585 | n/a | 63,355 | n/a |
| French only | 20,955 | 5,020 | 24.0% | 4,690 | 22.4% |
| English and French | 82,745 | 12,870 | 15.6% | 12,315 | 14.9% |
| Neither English nor French | 44,010 | 8,745 | 19.9% | 8,140 | 18.5% |
Table 7F: Immigrated between 1991 and 1995
| Knowledge of official languages | Total - Number of persons | Persons with family income below LICO (after tax) | Persons with family income below LICO (after tax) % | Persons with family income below LIM (after tax) | Persons with family income below LIM (after tax) % |
|---|---|---|---|---|---|
| Total - Immigrated between 1991 and 1995 | 822,220 | 143,740 | 17.5% | 138,705 | 16.9% |
| English only | 622,035 | 101,995 | 16.4% | 99,210 | 15.9% |
| French only | 29,015 | 7,430 | 25.6% | 6,770 | 23.3% |
| English and French | 98,390 | 18,625 | 18.9% | 17,780 | 18.1% |
| Neither English nor French | 72,790 | 15,695 | 21.6% | 14,945 | 20.5% |
Table 7G: Immigrated between 1996 and 2000
| Knowledge of official languages | Total - Number of persons | Persons with family income below LICO (after tax) | Persons with family income below LICO (after tax) % | Persons with family income below LIM (after tax) | Persons with family income below LIM (after tax) % |
|---|---|---|---|---|---|
| Total - Immigrated between 1996 and 2000 | 843,040 | 173,860 | 20.6% | 168,765 | 20.0% |
| English only | 652,880 | 128,320 | 19.7% | 125,090 | 19.2% |
| French only | 33,620 | 8,835 | 26.3% | 8,360 | 24.9% |
| English and French | 99,115 | 20,245 | 20.4% | 19,340 | 19.5% |
| Neither English nor French | 57,430 | 16,455 | 28.7% | 15,980 | 27.8% |
Table 7H: Immigrated between 2001 and 2004
| Knowledge of official languages | Total - Number of persons | Persons with family income below LICO (after tax) | Persons with family income below LICO (after tax) % | Persons with family income below LIM (after tax) | Persons with family income below LIM (after tax) % |
|---|---|---|---|---|---|
| Total - Immigrated between 2001 and 2004 | 824,675 | 226,195 | 27.4% | 217,440 | 26.4% |
| English only | 607,020 | 154,240 | 25.4% | 148,905 | 24.5% |
| French only | 53,470 | 21,810 | 40.8% | 20,450 | 38.2% |
| English and French | 98,465 | 29,090 | 29.5% | 27,100 | 27.5% |
| Neither English nor French | 65,730 | 21,060 | 32.0% | 20,975 | 31.9% |
Source: Statistics Canada, 2006 Census of Population, CIC Custom Table and author's calculations.
The connection between education and economic outcomes of immigrants has been well-documented (see, for example, Plante, 2010; Xue and Xu, 2010). Based on 2006 Census data, Table 8 presents the after-tax low-income status (both LICO and LIM) of immigrants by highest education level by location of study, for Canada, in 2005. As shown, looking at persons aged 15 years and over with family income below LICO, the highest proportions of immigrants living with low-incomes in 2005 were those who had a university certificate, diploma, or degree at a bachelor’s level or above from outside of Canada (19.4%), followed by those with less than secondary education (17.4%), those with a secondary school or trade certificate or diploma (16.1%) and those with college, CEGEP, other non-university certificate or diploma, or university certificate below the bachelor’s level from outside of Canada (16.1%). In contrast, those immigrants with a university certificate, diploma, or degree at a bachelor’s level or above from inside Canada had the lowest low-income rate, at 9.1%, followed by those with a college, CEGEP, other non-university certificate or diploma, or university certificate below the bachelor’s level also from inside of Canada (11.1%). For Canadian-born persons, a similar pattern is observed in 2005, although overall rates are much lower. For instance, the low-income rate for Canadian-born persons with a university certificate, diploma, or degree at a bachelor’s level or above from inside Canada had the lowest low-income rate, at 5.0%, while for those with a college, CEGEP, other non-university certificate or diploma, or university certificate below the bachelor’s level also from inside of Canada, the low-income rate was 6.8%; the rates for their counterparts with education obtained outside of Canada were 5.9% and 10.9%, respectively. For both immigrants and the Canadian born, both level of highest education and location of study are important factors in the determination of low-income situations.
Table 8: After tax low income status of immigrants by number of years since immigration and highest level of education, Canada, 2005
Table 8A: Canadian-born persons
| Canadian-born persons | Total - Number of persons | Persons with family income below LICO (after tax) | Persons with family income below LICO (after tax) % | Persons with family income below LIM (after tax) | Persons with family income below LIM (after tax) % |
|---|---|---|---|---|---|
| Total | 24,651,930 | 2,343,945 | 9.5% | 2,697,195 | 10.9% |
| Under 15 years | 5,182,635 | 605,780 | 11.7% | 705,155 | 13.6% |
| 15 years and over | 19,469,290 | 1,738,160 | 8.9% | 1,992,045 | 10.2% |
| Highest certificate, diploma or degree by location of study (Canadian-born persons - 15 years and over) | Total - Number of persons | Persons with family income below LICO (after tax) | Persons with family income below LICO (after tax) % | Persons with family income below LIM (after tax) | Persons with family income below LIM (after tax) % |
|---|---|---|---|---|---|
| None or less than secondary | 4,767,500 | 621,505 | 13.0% | 755,940 | 15.9% |
| Secondary school, apprenticeship or trade certificate or diploma | 7,377,770 | 671,530 | 9.1% | 761,350 | 10.3% |
| College, CEGEP, other non-university certificate or diploma, university certificate or diploma below bachelor level (Inside Canada) | 4,211,775 | 284,565 | 6.8% | 313,715 | 7.4% |
| College, CEGEP, other non-university certificate or diploma, university certificate or diploma below bachelor level (Outside Canada) | 42,255 | 4,620 | 10.9% | 4,830 | 11.4% |
| University certificate, diploma or degree at bachelor's level or above (Inside Canada) | 2,927,160 | 147,510 | 5.0% | 147,700 | 5.0% |
| University certificate, diploma or degree at bachelor's level or above (Outside Canada) | 142,830 | 8,425 | 5.9% | 8,505 | 6.0% |
Table 8B: Immigrantstable note *
| Immigrants | Total - Number of persons | Persons with family income below LICO (after tax) | Persons with family income below LICO (after tax) % | Persons with family income below LIM (after tax) | Persons with family income below LIM (after tax) % |
|---|---|---|---|---|---|
| Total | 6,166,770 | 1,025,185 | 16.6% | 988,115 | 16.0% |
| Population under 15 years | 345,405 | 113,965 | 33.0% | 110,920 | 32.1% |
| Population 15 years and over | 5,821,365 | 911,220 | 15.7% | 877,190 | 15.1% |
| Highest certificate, diploma or degree by location of study (Immigrants - 15 years and over) | Total - Number of persons | Persons with family income below LICO (after tax) | Persons with family income below LICO (after tax) % | Persons with family income below LIM (after tax) | Persons with family income below LIM (after tax) % |
|---|---|---|---|---|---|
| None or less than secondary | 1,239,940 | 216,085 | 17.4% | 206,710 | 16.7% |
| Secondary school, apprenticeship or trade certificate or diploma | 1,849,625 | 298,445 | 16.1% | 288,970 | 15.6% |
| College, CEGEP, other non-university certificate or diploma, university certificate or diploma below bachelor level (Inside Canada) | 651,845 | 72,485 | 11.1% | 70,410 | 10.8% |
| College, CEGEP, other non-university certificate or diploma, university certificate or diploma below bachelor level (Outside Canada) | 600,370 | 96,915 | 16.1% | 93,225 | 15.5% |
| University certificate, diploma or degree at bachelor's level or above (Inside Canada) | 575,360 | 52,230 | 9.1% | 50,225 | 8.7% |
| University certificate, diploma or degree at bachelor's level or above (Outside Canada) | 904,230 | 175,050 | 19.4% | 167,665 | 18.5% |
Table 8C: Immigrated before 1981
| Immigrated before 1981 | Total - Number of persons | Persons with family income below LICO (after tax) | Persons with family income below LICO (after tax) % | Persons with family income below LIM (after tax) | Persons with family income below LIM (after tax) % |
|---|---|---|---|---|---|
| Total | 2,393,355 | 187,350 | 7.8% | 175,205 | 7.3% |
| Population under 15 years | n/a | n/a | n/a | n/a | n/a |
| Population 15 years and over | 2,393,355 | 187,350 | 7.8% | 175,205 | 7.3% |
| Highest certificate, diploma or degree by location of study (Immigrated before 1981 - 15 years and over) | Total - Number of persons | Persons with family income below LICO (after tax) | Persons with family income below LICO (after tax) % | Persons with family income below LIM (after tax) | Persons with family income below LIM (after tax) % |
|---|---|---|---|---|---|
| None or less than secondary | 610,520 | 60,320 | 9.9% | 52,845 | 8.7% |
| Secondary school, apprenticeship or trade certificate or diploma | 814,685 | 67,320 | 8.3% | 64,625 | 7.9% |
| College, CEGEP, other non-university certificate or diploma, university certificate or diploma below bachelor level (Inside Canada) | 328,145 | 23,480 | 7.2% | 23,280 | 7.1% |
| College, CEGEP, other non-university certificate or diploma, university certificate or diploma below bachelor level (Outside Canada) | 200,645 | 13,045 | 6.5% | 11,995 | 6.0% |
| University certificate, diploma or degree at bachelor's level or above (Inside Canada) | 284,245 | 13,430 | 4.7% | 13,045 | 4.6% |
| University certificate, diploma or degree at bachelor's level or above (Outside Canada) | 155,120 | 9,755 | 6.3% | 9,420 | 6.1% |
Table 8D: Immigrated between 1981 and 1985
| Immigrated between 1981 and 1985 | Total - Number of persons | Persons with family income below LICO (after tax) | Persons with family income below LICO (after tax) % | Persons with family income below LIM (after tax) | Persons with family income below LIM (after tax) % |
|---|---|---|---|---|---|
| Total | 360,450 | 44,450 | 12.3% | 42,650 | 11.8% |
| Population under 15 years | n/a | n/a | n/a | n/a | n/a |
| Population 15 years and over | 360,450 | 44,450 | 12.3% | 42,650 | 11.8% |
| Highest certificate, diploma or degree by location of study (Immigrated between 1981 and 1985 - 15 years and over) | Total - Number of persons | Persons with family income below LICO (after tax) | Persons with family income below LICO (after tax) % | Persons with family income below LIM (after tax) | Persons with family income below LIM (after tax) % |
|---|---|---|---|---|---|
| None or less than secondary | 71,895 | 12,465 | 17.3% | 11,840 | 16.5% |
| Secondary school, apprenticeship or trade certificate or diploma | 115,820 | 16,550 | 14.3% | 15,880 | 13.7% |
| College, CEGEP, other non-university certificate or diploma, university certificate or diploma below bachelor level (Inside Canada) | 54,380 | 5,280 | 9.7% | 5,075 | 9.3% |
| College, CEGEP, other non-university certificate or diploma, university certificate or diploma below bachelor level (Outside Canada) | 34,355 | 3,590 | 10.4% | 3,640 | 10.6% |
| University certificate, diploma or degree at bachelor's level or above (Inside Canada) | 48,855 | 3,300 | 6.8% | 3,110 | 6.4% |
| University certificate, diploma or degree at bachelor's level or above (Outside Canada) | 35,150 | 3,275 | 9.3% | 3,100 | 8.8% |
Table 8E: Immigrated between 1986 and 1990
| Immigrated between 1986 and 1990 | Total - Number of persons | Persons with family income below LICO (after tax) | Persons with family income below LICO (after tax) % | Persons with family income below LIM (after tax) | Persons with family income below LIM (after tax) % |
|---|---|---|---|---|---|
| Total | 640,440 | 92,225 | 14.4% | 88,495 | 13.8% |
| Population under 15 years | n/a | n/a | n/a | n/a | n/a |
| Population 15 years and over | 640,440 | 92,220 | 14.4% | 88,495 | 13.8% |
| Highest certificate, diploma or degree by location of study (Immigrated between 1986 and 1990 - 15 years and over) | Total - Number of persons | Persons with family income below LICO (after tax) | Persons with family income below LICO (after tax) % | Persons with family income below LIM (after tax) | Persons with family income below LIM (after tax) % |
|---|---|---|---|---|---|
| None or less than secondary | 120,135 | 23,415 | 19.5% | 22,710 | 18.9% |
| Secondary school, apprenticeship or trade certificate or diploma | 222,105 | 36,875 | 16.6% | 35,265 | 15.9% |
| College, CEGEP, other non-university certificate or diploma, university certificate or diploma below bachelor level (Inside Canada) | 86,520 | 9,680 | 11.2% | 9,285 | 10.7% |
| College, CEGEP, other non-university certificate or diploma, university certificate or diploma below bachelor level (Outside Canada) | 65,570 | 8,175 | 12.5% | 7,685 | 11.7% |
| University certificate, diploma or degree at bachelor's level or above (Inside Canada) | 73,235 | 6,305 | 8.6% | 6,045 | 8.3% |
| University certificate, diploma or degree at bachelor's level or above (Outside Canada) | 72,880 | 7,785 | 10.7% | 7,510 | 10.3% |
Table 8F: Immigrated between 1991 and 1995
| Immigrated between 1991 and 1995 | Total - Number of persons | Persons with family income below LICO (after tax) | Persons with family income below LICO (after tax) % | Persons with family income below LIM (after tax) | Persons with family income below LIM (after tax) % |
|---|---|---|---|---|---|
| Total | 822,220 | 143,740 | 17.5% | 138,705 | 16.9% |
| Population under 15 years | 22,530 | 4,325 | 19.2% | 4,390 | 19.5% |
| Population 15 years and over | 799,695 | 139,415 | 17.4% | 134,320 | 16.8% |
| Highest certificate, diploma or degree by location of study (Immigrated between 1991 and 1995 - 15 years and over) | Total - Number of persons | Persons with family income below LICO (after tax) | Persons with family income below LICO (after tax) % | Persons with family income below LIM (after tax) | Persons with family income below LIM (after tax) % |
|---|---|---|---|---|---|
| None or less than secondary | 162,900 | 35,155 | 21.6% | 34,265 | 21.0% |
| Secondary school, apprenticeship or trade certificate or diploma | 272,675 | 53,500 | 19.6% | 51,475 | 18.9% |
| College, CEGEP, other non-university certificate or diploma, university certificate or diploma below bachelor level (Inside Canada) | 91,105 | 13,575 | 14.9% | 12,985 | 14.3% |
| College, CEGEP, other non-university certificate or diploma, university certificate or diploma below bachelor level (Outside Canada) | 86,875 | 13,220 | 15.2% | 12,605 | 14.5% |
| University certificate, diploma or degree at bachelor's level or above (Inside Canada) | 72,280 | 8,975 | 12.4% | 8,555 | 11.8% |
| University certificate, diploma or degree at bachelor's level or above (Outside Canada) | 113,870 | 14,985 | 13.2% | 14,430 | 12.7% |
Table 8G: Immigrated between 1996 and 2000
| Immigrated between 1996 and 2000 | Total - Number of persons | Persons with family income below LICO (after tax) | Persons with family income below LICO (after tax) % | Persons with family income below LIM (after tax) | Persons with family income below LIM (after tax) % |
|---|---|---|---|---|---|
| Total | 843,040 | 173,860 | 20.6% | 168,765 | 20.0% |
| Population under 15 years | 99,840 | 22,620 | 22.7% | 22,040 | 22.1% |
| Population 15 years and over | 743,200 | 151,245 | 20.4% | 146,730 | 19.7% |
| Highest certificate, diploma or degree by location of study (Immigrated between 1996 and 2000- 15 years and over) | Total - Number of persons | Persons with family income below LICO (after tax) | Persons with family income below LICO (after tax) % | Persons with family income below LIM (after tax) | Persons with family income below LIM (after tax) % |
|---|---|---|---|---|---|
| None or less than secondary | 129,710 | 32,580 | 25.1% | 32,160 | 24.8% |
| Secondary school, apprenticeship or trade certificate or diploma | 213,535 | 51,460 | 24.1% | 50,215 | 23.5% |
| College, CEGEP, other non-university certificate or diploma, university certificate or diploma below bachelor level (Inside Canada) | 59,275 | 10,905 | 18.4% | 10,500 | 17.7% |
| College, CEGEP, other non-university certificate or diploma, university certificate or diploma below bachelor level (Outside Canada) | 86,895 | 16,850 | 19.4% | 16,330 | 18.8% |
| University certificate, diploma or degree at bachelor's level or above (Inside Canada) | 56,545 | 8,555 | 15.1% | 8,320 | 14.7% |
| University certificate, diploma or degree at bachelor's level or above (Outside Canada) | 197,230 | 30,885 | 15.7% | 29,205 | 14.8% |
Table 8H: Immigrated between 2001 and 2004
| Immigrated between 2001 and 2004 | Total - Number of persons | Persons with family income below LICO (after tax) | Persons with family income below LICO (after tax) % | Persons with family income below LIM (after tax) | Persons with family income below LIM (after tax) % |
|---|---|---|---|---|---|
| Total | 824,675 | 226,195 | 27.4% | 217,440 | 26.4% |
| Population under 15 years | 160,520 | 49,385 | 30.8% | 47,200 | 29.4% |
| Population 15 years and over | 664,155 | 176,815 | 26.6% | 170,240 | 25.6% |
| Highest certificate, diploma or degree by location of study (Immigrated between 2001 and 2004 - 15 years and over) | Total - Number of persons | Persons with family income below LICO (after tax) | Persons with family income below LICO (after tax) % | Persons with family income below LIM (after tax) | Persons with family income below LIM (after tax) % |
|---|---|---|---|---|---|
| None or less than secondary | 109,245 | 33,025 | 30.2% | 33,365 | 30.5% |
| Secondary school, apprenticeship or trade certificate or diploma | 157,680 | 45,860 | 29.1% | 44,560 | 28.3% |
| College, CEGEP, other non-university certificate or diploma, university certificate or diploma below bachelor level (Inside Canada) | 27,005 | 6,975 | 25.8% | 6,745 | 25.0% |
| College, CEGEP, other non-university certificate or diploma, university certificate or diploma below bachelor level (Outside Canada) | 90,710 | 22,970 | 25.3% | 21,915 | 24.2% |
| University certificate, diploma or degree at bachelor's level or above (Inside Canada) | 32,800 | 7,670 | 23.4% | 7,230 | 22.0% |
| University certificate, diploma or degree at bachelor's level or above (Outside Canada) | 246,720 | 60,315 | 24.4% | 56,420 | 22.9% |
Source: Statistics Canada, 2006 Census of Population, CIC Custom Table and author's calculations.
Many studies have found that the skills and experience acquired in another country are significantly less valued than human capital obtained domestically and that it is more advantageous for immigrants to obtain their education in their new country rather than abroad (for example, Green and Worswick, 2010; Aydemir and Skuterud, 2005). Overwhelmingly, lower returns to foreign education and experience appear to account for much of the labour market outcomes gap between immigrants and seemingly similar native-born persons. Using the 1986, 1991 and 1996 Canadian Censuses, Sweetman (2004) finds that immigrants from source countries with lower quality educational outcomes, as measured by international test scores (in math and science) receive a lower average return to their schooling in the Canadian labour market than those from countries with higher quality results. Interestingly, Picot and Hou (2003) conclude that the gap in low-income rates between the Canadian-born and recent immigrants was highest among degree holders, particularly those with engineering and applied science degrees. This trend is also confirmed in Picot and Sweetman (2005), where it is observed that recent immigrant university graduates were increasingly unable to convert their education and experience into earnings in the way that earlier cohorts had. The increase in low-income among recent immigrants may be the result of lower returns to foreign education due to changes in source countries. While the returns to education from different countries have not declined over time, the share of immigrants coming from countries with lower returns has increased.
Foreign work experience is also not as valued as domestic work experience. In their extensive literature review, Picot and Sweetman (2005) find a number of recent studies that indicate the foreign work experience of entering immigrants is increasingly discounted in the Canadian labour market (for example, Schaafsman and Sweetman, 2001; Green and Worswick, 2002; Frenette and Morissette, 2003; Aydemir and Skuterud, 2005). The authors point to declining returns to experience as one of the major factors, if not the most important, associated with declining earnings among recent immigrants. Subsequent work by Aydemir and Skuterud (2005), and Frenette and Morissette (2003) provide support for this notion. Both sets of authors observe that between 1980 and 2000, earnings did not in fact decline among very young “recent” immigrant workers (age 25 to 29 years), and that the decline was concentrated among male immigrant workers over age 30 years. The study by Goldmann, Sweetman, and Warman (2011) finds that even immigrants who successfully match their pre-immigration occupation with the one they obtain post-migration (and receive a substantial earnings boost) receive an approximately zero rate of return to their pre-migration potential labour market experience. In fact, in the study by these authors, neither occupational matching nor language skills have any impact on the return to pre-immigration work experience, which is observed to be statistically significantly negative. The lower returns to foreign education and experience relative to that acquired in Canada may help explain the low-income situation of some groups of recent immigrants.
Opportunities and barriers of adopted society
As relevant as the socio-economic determinants discussed above may be, they do not entirely explain low-income incidence and trends among various populations in Canada. In particular, these determinants do not account for the opportunities and barriers present in society, or the role played by labour market conditions, policies and institutions. In addition to examining the socio-economic characteristics of immigrant groups in analysis of low-income trends, an effective examination also needs to consider the opportunities and barriers present in society. It is the combination of the socio-economic characteristics of immigrants with the opportunities and barriers in the host society that ultimately dictates the economic outcomes of immigrants. Of the opportunities and barriers presented by the adopted society, the most important contributing to the economic outcomes of immigrants are the following:
Economic conditions (e.g., overall and local labour market environment, occupations in demand, employment and earnings opportunities, etc.)
The labour market influences low-income rates through employment and earnings.Footnote 98 The cyclical nature of the Canadian economy (fluctuations in macro-economic conditions) plays an important role in immigrant economic integration, with low-income rates rising in economic recessions and falling in expansions.Footnote 99 For example, using the Survey of Consumer Finances (SCF) and Survey of Labour and Income Dynamics (SLID), Brink and Dhawan-Biswal (2002) find a moderate improvement in low-income rates for recent immigrants over the strong labour market conditions of the late 1990s. These findings are generally consistent with many of the studies in the earnings literature with regards to earnings outcomes (see for example, Green and Worswick, 2002). Using SLID data, Smith and Jackson (2002) examine levels of employment, earnings, family incomes and low-income rates of recent immigrants compared to those of the rest of the Canadian population over the economic recovery period from 1995 to 1998. The gap in employment and income opportunities between recent immigrants and other Canadians is found to have narrowed between 1995 and 1998 – and regardless of the measure used, low-income fell sharply among recent immigrant families over the period. However, the authors maintain that gaps remained very large: in 1998, low-income among recent immigrants stood at 27%, double the 13% rate among the rest of the Canadian population; their annual wages and salaries were one-third less than those of other Canadians. Despite the large gaps, the rising tide of economic recovery over the second half of the 1990s is argued to have had a positive impact on the employment opportunities and incomes of recent Canadian immigrants. The authors argue this indicates that a healthy labour market can provide a major impetus towards equality and the inclusion of recent immigrants into the economic and social mainstream, although other policy measures are still required. It has similarly been argued (for example, McDonald and Worswick, 1998; Aydemir and Skuterud, 2005) that immigrants, especially very recent ones, tend to have labour market outcomes that are more negatively affected by downward trends in the business cycle than the Canadian-born, and may also bear the effects of a challenging introduction to the Canadian labour market for a long time.
Occupations in demand relative to the supply – of both immigrant and Canadian-born workers – can also influence employment and earnings opportunities of immigrants. For example, a number of studies (for example, Dempsey and Kustec, 2006; Picot, Hou, and Coulombe, 2007; Statistics Canada, 2008; Picot and Hou, 2009) demonstrate that the decline in employment in the Information Technology (IT) sector in the first half of the 2000s had a large impact on the earnings of recent immigrants. The reason is that a disproportionately high share of recent immigrants was trained and employed in computer sciences and engineering. After the meltdown of the information technology sector, many immigrants may have been working in lower-skilled and generally lower-paying occupations to secure entry in the labour market. In fact, Picot, Hou, and Coulombe (2007) argue that the phenomenon of a rising number of skilled immigrants, a high proportion of whom intended to work as information technology professionals, combined with the downturn in the information technology sector may help explain worsening low-income rates among skilled workers despite the strength of the overall economy over the period 2000 to 2003.
As suggested earlier, comparing low-income rates of immigrants to those of the Canadian-born provides a rough control for business cycle effects.Footnote 100 It was this approach, undertaken by Picot and Hou (2003), which analyzed low-income rates for immigrants using primarily data from the 1981 through 2001 Canadian Census Master files which led to the conclusion there has been a structural rise in the low-income rate of recent immigrants. The analysis covers the period 1980 to 2000, and focuses on change between 1980 to 1990, and 1990 to 2000, years coinciding with business cycle peaks. The authors find that in the aggregate, low-income rates among the Canadian-born declined between 1980 and 2000, while they increased among most immigrant groups. For instance, among all immigrants as a group, the low-income rate was found to rise from 17.0% in 1980 to 20.2% in 2000; among recent immigrants, it rose from 24.6% to 35.8%, respectively. However, the study finds among most Canadian-born groups, the low-income rate fell. For the Canadian-born population as a whole, the low-income rate declined from 17.2% in 1980 to 14.3% in 2000. As a result, the authors argue the rise can not be attributed to poorer economic conditions in 2000, compared to earlier business cycle peaks; the unemployment rate in 2000 was 6.8% and was lower than that observed in 1990 (8.1%) or 1980 (7.5%).Footnote 101
It is ultimately the match between an immigrant and the Canadian labour market that affects their labour market integration patterns. This is the reason why despite highly skilled occupations (usually requiring university education) leading Canadian labour force growth, a high education level is not a guarantee of a job requiring that level of education, Canadian-born or immigrant. This is because economic conditions (generally local), or occupational demand and supply, together impact labour market outcomes. If there is little demand for a particular occupation, an individual educated and experienced in this field may have a hard time finding relevant employment, regardless of their high level of education. As a result, the low-income situation of immigrants to Canada can be influenced by labour market conditions through the impact on employment earnings opportunities, an important factor to consider when looking for possible solutions.
Public attitudes towards immigration and cultural change
Public attitudes towards immigration can influence low-income rates of immigrants through the resulting impact on a willingness of employers and employees to hire, retain, and remunerate immigrants. The impact on low-income among immigrants of public opinion can also be transmitted through the availability of a society’s services and programs to integrate newcomers (see next section), as well as supports available to those in low-income. Discrimination, be it racial, cultural, ethnic, based on foreign experience, education, and credentials, and/or accented English or French, are other ways in which public attitudes towards immigration and cultural change can influence the employment and resulting income situation of immigrants.
Research has shown that public attitudes towards immigration are largely driven by economic factors. For example, Reitz (2011) assesses recent trends in public attitudes and examines the social and economic roots of support for high immigration based on an analysis of an Environics Focus Canada opinion survey conducted in November 2010. The study finds those who feel confident about the national economy and those who believe their personal standard of living has improved over the past decade number more frequently among immigration’s supporters. The author argues that this effect is due mainly, or even almost entirely, to the fact these optimistic views foster the impression that immigration is having a positive impact. Reitz’s analysis found that when the perceived economic impact of immigration is controlled, the effect of these more general views on the economy is reduced to insignificance. By the same token, those who are not doing well and think the economy is off-track were found less inclined to think that immigration has a favourable impact. From these results, it can be derived that public attitudes towards immigrants may somewhat follow the economic cycle, being positive during times of economic growth and less positive at times of economic downturn.
Public attitudes towards immigration can also be driven by official policies. As one example, Canada’s policy of multiculturalism, introduced in 1971, could create a more positive view of immigration among Canadians. Canadian multiculturalism is fundamental to the belief that all citizens are equal and ensures that all citizens can keep their identities, can take pride in their ancestry and have a sense of belonging.Footnote 102 This can in turn foster willingness among employers to hire and appropriately remunerate immigrants as well as encourage societal support for services and programs that support immigrant labour market integration. Reitz (2011) discusses four ways in which multiculturalism has a positive impact: First, it can promote recognition of minority cultures; multiculturalism encourages the view that immigration has a cultural as well as an economic benefit. Second, multiculturalism policy promotes the idea that if immigrant minority groups retain their cultures it does not necessarily mean that they will not share in Canadian cultural values and become good Canadians. A third way that multiculturalism policy could encourage a positive view of immigration is by facilitating greater social inclusion for immigrants and their children, smoothing their integration and yielding both socio-cultural and economic benefits. A fourth way could be by asserting multiculturalism as a national policy, creating a perception of immigration as an essential feature of the Canadian tradition and thus a point of national pride. In this way, Reitz argues, multiculturalism policy can serve as a kind of public relations campaign for immigration.
Public policies can also affect the low-income situation of different groups, dependent on what policies and programs are targeted at which groups. For example, Proulx, Faustmann, Raïq, and van den Berg (2011) argue that interprovincial differences in low-income rates can be attributable to differences in public policies. In particular, these authors argue that Quebec has improved its low-income situation through public policies focused on households with children and also spends (as a proportion of GDP) more in this area than other provinces, to the benefit of less well-off families. It is also highlighted in this study that Quebec spends more on active labour market policies and work-family balance policies, such as parental leave and daycare services. A result of these policies, it is further argued, is an increase in the labour market participation of women with children under the age of six. These authors suggest that Quebec’s favourable situation is in large part a consequence of its policy choices. Similarly, in response to various socio-economic characteristics, different policies may have a range of impacts on the low-income situation of immigrant and other groups in Canada.
Some studies provide results suggestive of discriminatory barriers that hinder immigrant economic and social integration. Perhaps the most compelling of this evidence is that which examines immigrants of visible minority status.Footnote 103 Given the shift towards immigration from non-traditional source countries and the corresponding increase in ‘visible minority’ concentration, the potential likelihood of racial discrimination against immigrants has risen; if so, this could in part explain the increasing low-income rates of more recent immigrants relative to those landing earlier. Evidence indicates that some visible minority immigrants are over represented among those with low-income. A study by Morissette and Zhang (2001) using SLID data for 1993 to 1998 finds that members of a visible minority (both immigrants and Canadian-born) were more likely to have low-income for four years or more, at 21%, compared to 7% for other Canadians. Also using SLID data, Fleury (2007) finds the vast majority of low-income recent immigrants were members of a visible minority (86%). Earlier studies showed similar results: using 1991 census data, Kazemipur and Halli (2001) found a significantly higher low-income rate for newcomers from South-East Asian (30.8%), Arab (40.9%), Latin American (38.8%) and Black/Caribbean (29.4%) countries than for the Canadian average. These authors argue that younger generations of immigrants from developing countries are more likely to live in low-income than Canadian-born individuals. Palameta (2004) finds that Canadian-born visible minorities were no more likely than others born in Canada to experience low-income; in contrast, visible minority immigrants were significantly more likely than other immigrants to be in low-income, regardless of time in Canada. Moreover, Palameta finds visible minorities who were in low-income at least once, including those born in Canada, were more likely than other Canadians with similar characteristics to experience low-income repeatedly.
Complicating these findings is that racial discrimination may be compounded by other forms of discrimination, like that based on age, gender, and accent. For example, it is possible that discriminatory hiring practices by employers occur based on perceived cultural differences. Oreopoulos (2009) conducted a field experiment with six thousand résumés sent in response to job postings across multiple occupations in the Greater Toronto Area. The résumés were constructed to represent immigrants coming under the Canadian immigration point system from the three major source countries (China, India, and Pakistan) as well as Britain and non-immigrants.Footnote 104 The author found applicants with English-sounding names received callbacks from employers 40% more often than applicants with Chinese, Indian, or Pakistani names. Conditional on listing 4 to 6 years Canadian experience, being foreign educated (whether at a highly ranked school or not) was not found to affect the callback rates substantially. However, changing only the location of the applicant’s job experience, from Canadian to foreign, lowered the callback rate further from about 10% to 5%. Adding more language credentials, additional Canadian education, or extracurricular activities had little impact on these overall results. The effects were basically the same whether jobs applied to required more or less social or language skills. In contrast, the study finds that callback differences mostly went away when comparing Canadian-born applications to British immigrants, and when restricting the sample to recruiters who had ethnic sounding voices or names themselves. Overall, the results suggest considerable employer discrimination against applicants with ethnic names and experience with foreign firms.
Many studies (for example, K. Pendakur and R. Pendakur, 1998), argue that discrimination against immigrants – perhaps more specifically against visible minority immigrants -- is a contributing factor to their relatively poor economic outcomes. Other studies, however, argue that outcome differences between immigrants and the Canadian-born that might appear to be discrimination may instead be the result of disparities in educational background and other non-quantifiable factors (for example, Wanner, 1998). Until a more effective means by which to model and measure discrimination becomes available, the extent to which this phenomenon may affect immigrants in the Canadian labour market and their low-income situations remains, not surprisingly, a subject of considerable debate.
Availability of and eligibility for programs to integrate newcomers
Programs to integrate newcomers can influence low-income rates of immigrants through their impact on labour market skills (e.g., job search, official language, professional networking opportunities, labour market information, etc.) and resulting employment and earnings outcomes. The general rationale behind labour market settlement programs is to invest in immigrants in order to improve labour market integration into respective fields of training, to increase fiscal contributions and reduce the use of social assistance by immigrants in the long-run, and increase the “effective” labour pool of skilled individuals in Canada. By extension, one objective of these programs is to minimize low-income among immigrants. There is limited information regarding the experience of immigrants with programs designed to integrate newcomers and how these relate to their longer-term economic outcomes, particularly their low-income situation. One cause is lack of data, or lack of uniform data, regarding use of immigrant settlement services and labour market transitions (e.g., into and out of paid employment, transfer payment receipt, low-income, etc.). The evidence that exists is that of program evaluations, which while informative, sometimes lack a control group (e.g., those who are not accessing the service), or measurements of how an immigrant fares economically once they have exited the program. In other words, to understand the impact of immigrant settlement programs on their low-income situation, performance measurement data would need to be consistently collected on outcomes post program participation.
There is reason to believe that many programs available to immigrants contribute to better economic outcomes of immigrants and by extension, lower incidence of low-income. As one example, Citizenship and Immigration Canada (2011b) evaluated a program called the Immigrant Settlement and Adaptation Program (ISAP), which provided services to facilitate the adaptation, settlement and integration of newcomers to Canada in order for them to participate to the best of their ability in the Canadian economy and society as quickly as possible.Footnote 105 In operation from 1974 to 2008, the most prevalent positive impact of ISAP found in the evaluation was that it improved newcomers’ ability to identify and address their settlement needs and to learn about other services in their community that can help them. Of particular interest within the present context, the evaluation found that ISAP services also had a major impact on helping newcomers seek and find employment. ISAP clients confirmed that the program was effective in improving their job finding skills; almost half of the ISAP clients surveyed felt that participation in the Program had helped them to find a job. By extension, it is highly plausible that this program helped some immigrants and their families avoid situations of low-income through helping them secure employment. This being the case, in the absence of longer term outcomes data for these immigrants post participation in the program, it is difficult to confirm the actual impact on their income situation.
The availability of and eligibility for programs to integrate newcomers is one way in which policy can indirectly impact the economic situation of immigrants. By fostering the acquisition of tools appropriate to the Canadian labour market among those immigrants who will benefit from such tools, such programs can lead to improved labour market outcomes among immigrants and as a result may help them avoid situations of low-income. The extent to which such programs are successful at doing this could be better assessed by setting up long run evaluations of the economic outcomes of program participants (and of a comparison group of non-participants). In doing so, programs and policies aimed at alleviating low-income among immigrants could be enhanced and tailored over time to better contribute to the economic success of immigrants.
Openness / competitiveness of the labour market (e.g., how much protection for incumbents)
The openness and competitiveness of the Canadian labour market can influence low-income rates of immigrants through the resulting impact on access to employment, promotions, and earnings outcomes. The openness of the labour market can be regarded in terms of access to jobs. In Canada, among the factors that can influence the level of access to jobs are job tenure and union membership, and to some extent to whom training opportunities in the workplace are made available. Recent immigrants may have little access to compete for jobs that are limited to those with job tenure and / or union membership. To this extent, workplace practices hold much of the key to success of newcomers in the labour market. The current understanding of how workplace practices may affect the employment outcomes of immigrants in the labour market is limited. Existing literature primarily focuses on barriers to employment from the perspective of employees—the supply side. But the other equally important factor in the equation is workplaces, or employers: it is important to consider workplace hiring practices, efforts to retain workers and promote employees, as well as practices regarding assessment and recognition of foreign education and work experience. Competitiveness of the labour market is often regarded in terms of the pool of qualified candidates for a job, measured by considering those who have the appropriate level of education, field of study, occupational training, or experience. It is possible that more competition from an increasingly highly educated Canadian labour force has contributed to a worsening of economic outcomes among more recent immigrants.Footnote 106
Research examining the role between openness of the labour market and immigrant low-income outcomes is limited, but related research in the area can shed light on the issue. Pendakur and Woodcock (2008) investigate whether immigrant and minority workers’ poor access to high-wage jobs (“glass ceilings”) is attributable to poor access to jobs in high-wage firms, a phenomenon the authors call “glass doors”. A glass door is defined as a barrier that limits disadvantaged workers access to employment at high-wage firms. Just as a glass ceiling truncates the distribution of wages that disadvantaged workers face, the authors argue a glass door truncates the distribution of firms at which they might find employment. The authors investigate the extent to which exclusion from high-wage jobs that is, a glass ceiling, is driven by a glass door using the Workplace and Employee Survey (WES), a survey of workers and their employers. The study finds that Canadian-born ethnic minority workers do not face significant glass ceilings or glass doors. In contrast, immigrants are found to face substantial wage gaps which are largely accounted for by glass doors -- poor access to jobs in high-wage firms.
Job tenure is considered an important aspect of job security and can also be looked at favourably by hiring employers as a sign of loyalty. The longer one is working in a specific job for a specific organization, the greater the likelihood that other measures such as job permanency, wages and non-wage benefits may improve.Footnote 107 By and large, job tenure gaps between immigrants and the Canadian born are to be expected, as many immigrants have not been in Canada long enough to establish very long tenures with their current employer.Footnote 108 Based on the Labour Force Survey (LFS), Workplace Employee Survey (WES) and the Canadian Community Health Survey (CCHS), Gilmore (2009) compares many factors comprising employment quality by immigrant and Canadian-born status, an exercise that sheds light on aspects of openness of the labour market to newcomers. Not surprisingly, the study by Gilmore finds that core-working age Canadian-born workers were more likely to have very long current job tenure, even when compared with immigrants who landed more than 10 years earlier.Footnote 109
Union coverage is also considered an important contributor to both job security and access to jobs in many workplaces and industries. Moreover, the strength of unions has been shown to help explain some income differences.Footnote 110 A recent study by Brady (2011) highlights the importance of trade union strength in reducing the size of income disparities, even in the American context, where unions are considered weak and virtually absent from low-pay sectors. The study by Gilmore (2009) argues that collective bargaining coverage is an employment quality characteristic that is associated with other indicators, including wages and non-wage benefits. It is also associated with current job tenure and occupation. The study finds that collective bargaining coverage was more prevalent for Canadian-born employees, and union coverage among immigrant employees aged 25 to 54 years in 2008 was lower than the Canadian-born, regardless of period of landing. For example, the share of Canadian-born employees to have union coverage was found nearly 1.5 times higher than immigrants as a whole, and was 1.3 times higher than immigrants who landed more than 10 years earlier. An earlier study by Reitz and Verma (2004) found similar results. These authors employ data from the 1997 wave of both panels of SLID and find that racial minorities have lower rates of unionization (both membership and/or coverage) than do members of the majority workforce of European origins. They attribute this to the fact that immigrants from visible minority groups have lower average years since migration than do other immigrants. These authors also find unionization rates of new immigrants to grow with time in Canada. However, they only find a small benefit to unionization in terms of immigrant/non-immigrant wage differences. Another possible factor in explaining differences in unionization rates between Canadian-born workers and immigrants (by period of immigration) could be different industrial and occupational compositions between the groups – some industries and occupations are more likely to be unionized than others, including differences by provinces.
Training provides employees an opportunity to learn and develop, and can be argued to potentially facilitate their access to higher paying jobs that require additional skills. Gilmore (2009) argues that having access to training, whether informal or formal in nature, is an important job characteristic. The author finds that similar shares of immigrant and Canadian-born workers received on-the job training - in 2005, there was very little difference between the proportions of immigrants and Canadian-born employees receiving on-the-job training in the previous 12 months. However, core-aged employees who were born in Canada were more likely to have received classroom training than immigrants (40.6% versus 32.3%); the gap was widest between the Canadian-born and immigrants who landed more than 10 years before, as this group was least likely to have received classroom training in the previous 12 months.
Competition in the labour market can potentially influence immigrant low-income outcomes through its impact on availability of employment. One reason cited for declining economic outcomes of recent immigrants to Canada is changes in the education levels of the Canadian-born, which may have reduced the returns to credentials enjoyed by previous immigrant cohorts. Reitz (2000) examines how institutional changes associated with the emergence of a “knowledge economy” – specifically the expansion of education, and changing labour market structure – have shaped the employment experiences of newly-arriving immigrants to Canada. Similar to other research, this author finds a progressive trend toward lower rates of labour force participation and lower levels of earnings for immigrants relative to the Canadian-born population, both overall and for most specific region of origin groups. Although these trends are partly attributed to business-cycle fluctuations in labour demand, Reitz argues that there has been a decline in immigrant earnings over time that is related to education, and he suggests three reasons for this: First, increased Canadian-born educational levels have infringed upon a traditional immigrant education advantage, outpacing effects of increased immigrant skill-selectivity. Second, increased returns to education among Canadian-born workers have not applied to immigrants, and other institutional obstacles to immigrant success also exist. Third, a declining relative value of immigrant education may be due to a location specific nature of credential validation processes.
In fact, the educational attainment of the Canadian population has increased considerably. Picot and Sweetman (2005) posit that economic class immigrants are facing strong competition from increasingly highly educated Canadian-born workers. The domestic supply of highly educated labour force has been rising at a rapid pace over the past two decades, particularly among women. In 1980, 8% of the population had a university degree; by 2010, the proportion of Canadian-born individuals with a university degree had more than doubled, at 18%.Footnote 111 Similar gains were made in post-secondary education (e.g., trade certificates and non-university diplomas). At the other end of the educational spectrum, the proportion of the population with a high school education or less has steadily declined over the past 3 decades. This increasingly educated Canadian population may have changed the nature of competition in the labour market. Picot and Hou (2009) argue that one of the reasons increasing numbers of entering immigrants experienced very low relative returns to their university education during the 1990s and found themselves at the bottom of the earnings distribution may have been the inability of the labour market to absorb such a large increase in the supply of the highly educated, resulting in downward pressure on relative wages. Burbidge, Magee, and Robb (2002) compare the education premium – the earnings ratio of university graduates to high school graduates – in Canada to that of the United States. These authors find that over the 1980s and 1990s, the education premium has been constant or has fallen for Canada. As a point of contrast, this study shows that in the United States, the premium has risen sharply over the same time period. One possible explanation for this finding is that increases in the relative supply of more educated workers are negatively associated with the education premium. Demand growth for university graduates will influence the education premium and may have been quite different in the two countries. And the presence of weak demand in specific occupations – either absolutely or relative to supply – creates a potential for mismatch and underutilization of skills.Footnote 112 The characteristics of the domestic labour supply are key factors to consider in the economic outcomes of immigrants. An expectation that the current trend of a rising domestic supply of post-secondary graduates will continue, taken together with increasing numbers of highly educated immigrants, could mean a continuing negative impact on the economic performance of educated immigrants. In looking at the ways to improve the low-income situation of immigrants, it is important to keep the characteristics of the domestic labour force within scope, as there may be external situational factors contributing to the economic outcomes of immigrants.
Institutions (e.g., equivalency/acceptance of foreign educational qualifications and work experience)
Institutions can influence low-income rates of immigrants through their impact on access to and eligibility for social supports, benefits, education and training programs, employment, and earnings opportunities. As an example, a key area in which institutions have been recognized to play a direct role with respect to the immigrant experience in the labour market is those associated with recognition of foreign credentials. In Canada, the existing systems of occupational regulation were designed to accommodate those individuals with Canadian education, and as such, immigrants may have difficulty obtaining reliable information on regulatory requirements and work place expectations prior to landing in Canada. As a result, some immigrants may face difficulties finding employment in their field, a phenomenon that can contribute to lower than expected employment earnings and potentially low-income situations. A mismatch between the skills and education of foreign-trained professionals and trades-people and their actual occupations once in Canada can also create substantial costs, both to individual immigrants and their families, and to Canadian governments, businesses, and the economy. Although data available for evaluating how immigrant education qualifications are valued in Canada are limited, research reveals that an immigrant’s education and experience, particularly when judged to have been obtained abroad, is valued less in comparison with that of a similar Canadian-born individual.
For example, Picot and Hou (2003) point to the role of “credentialism” in influencing the economic outcomes of immigrants, saying that degrees and certification from non-traditional source countries may be recognized to a lesser extent than among the Canadian-born and educated. As evidence, Gilmore and Le Petit (2008) analyzed the 2007 employment rates of immigrants aged 25 to 54 years with postsecondary diplomas or degrees, using Labour Force Survey (LFS) data, and found that those who landed within the previous five years had lower employment rates if they obtained their postsecondary education outside North America or Europe. In contrast, immigrants with university degrees from Canada, the United States, or Europe and who landed in Canada more than five years earlier were found in the same study to have comparable employment rates to Canadian-born university graduates. Research also consistently finds lower average earnings for immigrants with foreign education as compared to Canadian-born workers who have been educated in Canada.Footnote 113 Most studies also suggest that the economic return to foreign work experience is around zero; where foreign experience is found to be a positive determinant of economic returns for immigrants, its magnitude is considerably lower than that for Canadian work experience and has declined in the 1990s.Footnote 114 Official Language fluency further complicates the issue of foreign credential recognition.Footnote 115
Difficulties related to the recognition of foreign credentials are largely based on two confounding institutional challenges. First, employers may have limited access to information on many immigrant source countries especially when it comes to the quality of educational institutions, the curriculum of their academic programs, and the relevance to the Canadian labour market of the skills imparted to the students by these institutions. As a reaction, employers may adopt a risk-averse attitude by giving preference to domestically educated workers in their hiring decisions. This being the case, foreign education credentials may be known to differ from Canadian credentials in terms of quality. For instance, foreign credentials may be known to be of lower quality due to inferior instruction relative to Canadian institutions. In this case, the title of an educational degree is the same, but the worth in Canada is lower for foreign earned credentials. Second, complicating the issue is that employers’ associations, sector councils, or provincially-organized occupational groups are key players in the credential recognition process.Footnote 116 Regulation is a provincial jurisdiction: governments regulate professions and trades to mitigate risks to public health and consumer protection. Many workers cannot practice their profession or trade without licensure from the provincial regulatory authority, even if they have already been deemed qualified to practice and licensed in another country (or Canadian province).
In brief, credential recognition problems may result from a lack of knowledge (or access to information) on newcomers’ part on how to have skills recognized, a lack of knowledge (or access to information) on employers’ part of foreign credentials, a lower quality of foreign credentials relative to domestic qualifications, or institutional barriers caused by the system of provincial regulations and professional associations. These challenges highlight the role that institutions can have in terms of influence on the low-income situation of immigrants through the direct influence on economic outcomes. By identifying and understanding the challenges that existing institutions may pose for the unique situation of recent immigrants, policy development is better informed with regards to improving their economic outcomes. For example, the Canadian Government saw the need to create the Foreign Credential Referral Office in response to the identification of these challenges to help internationally trained individuals receive the information, path finding, and referral services to have their credentials assessed so that they can find work in the fields for which they have been trained. At the same time, the Foreign Credential Referral Office works with federal, provincial, and territorial partners, and foreign credentials assessment and recognition bodies to strengthen foreign credentials recognition processes across the country through improved coordination of foreign credential recognition issues, policies, programs and services, information sharing and exchange of best practices.Footnote 117 Researchers have attempted to understand the foreign credential recognition process in light of making policy recommendations to improve the economic outcomes of immigrants to Canada (for a recent example, see Schwartz, 2012). The issue of foreign credentials recognition provides one example of how the appropriate institutional framework must be considered when looking at specific economic outcomes of immigrants.
Government (e.g., direct and indirect effects of transfer programs)
One of the ways in which governments influence low-income rates is through the direct and indirect effects of transfer programs.Footnote 118 Government transfers serve to increase family income and therefore reduce the number of people on low-income. Participation in Canada’s transfer programs by immigrants varies considerably, depending on such factors as category of admission, education level, and knowledge of official languages. For example, refugees have a relatively high reliance on income support upon arrival, but over time receive a growing proportion of their income from employment earnings. This relatively high initial reliance, however, is partly explained by the fact that Government Assisted Refugees are provided income support – and a range of other services -- under the Resettlement Assistance Program (RAP) for up to 12 months (and up to 24 months for those with special needs).Footnote 119 Similarly, refugee claimants benefit from the ability to work while their claim is processed; their reliance on social assistance is expected to fall over time and employment earnings increase.
There is some literature to suggest that as an immigrant’s years since migration increase, their participation in government assistance programs converges – or ‘assimilates’ towards that of the Canadian average.Footnote 120 This depends, however, on which transfer programs are being considered, as all have different objectives and eligibility requirements. For example, Social Assistance, in most incidences, is a program of last resort for individuals in financial need, as it provides assistance to families and individuals who lack other means of income support and who do not have enough resources to provide for themselves. Social Assistance is based on family rather than individual needs, and therefore different family structures of immigrants relative to other immigrants and to those of the Canadian-born may result in differences in the participation in this program. As another example, the Employment Insurance program is intended to provide income support to labour market participants temporarily unemployed. There is a qualifying period for benefits dependant on accumulating a minimum number of weeks of work in Canada. When looking at receipt of Employment Insurance benefits among immigrants, it is worth considering those who are excluded from receiving benefits, which includes those who are either not in the labour force or do not have a strong attachment to it, self-employed persons, and those who have already exhausted their benefit entitlements. Upon entry, therefore, most immigrants are not eligible to receive Employment Insurance benefits since they have no recent Canadian employment.
There is evidence of a rise in the rate of receipt of transfer payments for more recent immigrants relative to those that landed earlier.Footnote 121 Picot, Lu, and Hou (2009) examine trends in low-income rates among immigrant groups and the Canadian-born population and whether change in low-income rates was associated primarily with changes in market income (mostly income from employment) or the social transfer system (Employment Insurance, Old Age Security, Guaranteed Income Supplement, Canada or Quebec Pension Plan, social assistance, and child benefits). The study is based on 1981 through 2006 Census data and low-income is estimated using Statistics Canada’s LICO to determine low-income status. The authors look at the difference between the low-income rates before and after transfers to have a measure of the direct effect of the transfer system on low-income rates. The results of this study are that the market income based low-income rate for all immigrants rose significantly over the period, from 24% in 1980 to 33% in 2005, a 36% increase. Hence, declining family market income resulted in a significant rise in the low-income rate. This being the case, the after-transfer low-income rate is lower, as transfers increase family income and reduce the number of people on low-income. The after-transfer rate is found to have risen from 17% to 22% over the period, a 27% increase. Since the increase in the rate was lower after transfers than before transfers, the authors argue this implies that the transfer system increasingly offset market based low-income over the 1980 to 2005 period. The authors find that whether calculated on an absolute percentage point basis or a percent reduction basis, the transfer system reduced the low-income rate for immigrants more in 2005 than in 1980, and argue that the rise in the low-income rate among all immigrants is therefore due to falling family earnings.
Increases in government transfers have reduced low-income rates among immigrant seniors, just as they did among the Canadian-born.Footnote 122 Transfer payments received by many immigrant seniors during their first ten years in Canada are influenced to some extent by the eligibility rules associated with the three major sources of transfers for seniors – Old Age Security (OAS), Guaranteed Income Supplement (GIS), and social assistance. Old Age Security and Guaranteed Income Support (GIS)/Allowance are ways in which the government protects Canadian citizens from low-income. Picot, Lu, and Hou (2009) find that the longer immigrant seniors stay in Canada, the more the transfer system reduces their low-income rate; the transfer system reduces the low-income rate comparably to Canadian-born seniors only among those in Canada for more than 20 years. (See information box titled “Old Age Security: Eligibility of Recent Immigrants” for more details).
In brief, one of the ways in which the government has a direct influence on the low-income situation of all Canadians is through the direct and indirect effects of transfer programs. Differences in the eligibility of immigrants in such programs could impact low-income trends. For example, immigrants may or may not be eligible for some transfer programs that have eligibility requirements associated with years of residence or attachment to the Canadian labour market. Put another way, the less time they have been in Canada or the Canadian labour market, potentially the lesser the effect of the current transfer system on their low-income rates.
Old Age Security: Eligibility of Recent Immigrants
Old Age Security (OAS)
Old Age Security (OAS) is Canada’s largest public pension program. It currently provides a monthly pension to most people, starting at age 65. The OAS pension is like a large pie divided into 40 equal portions. If you qualify for a ‘full pension’ then you are entitled to receive all 40 portions each month. If you qualify for a ‘partial pension’ then you will receive some, but not all, of the 40 portions each month. Whether you qualify for a full of partial pension depends on how long you have lived in Canada.
Anyone who lives in Canada for 10 years after age 18 gets OAS at age 65 (or following their 10 year period if it is finished after age 65). People who have not lived in Canada for the necessary 10 years can still get OAS if they lived and worked in a country with which Canada has an International Social Security Agreement. Each country is responsible for paying their "portion" only. The minimum time in Canada is 1 year, meaning a person can get 1/40th of a full OAS pension after only 1 year. Both sponsored and non-sponsored immigrants are eligible for a partial OAS benefit.
Guaranteed Income Supplement (GIS), Spouse’s Allowance (SPA), and Widowed Spouse’s Allowance (WSA)
Once you get OAS, the Guaranteed Income Supplement (GIS) amount is paid if the person is "poor" (an additional monthly benefit for low-income OAS pensioners). To receive the GIS benefit, a person must be receiving an OAS pension. Canada also pays the GIS Allowance (i.e. Spouse’s Allowance (SPA) and Widowed Spouse’s Allowance (WSA) to people aged 60-64 who have been in the country for the required 10 years and are “poor” (as long as they are married / common-law to a pensioner or are widowed). All persons have to reside in Canada for 10 years regardless of which country they come from (i.e. even if they come from countries with which Canada has an International Social Security Agreement) in order to qualify for full GIS / SPA / WSA benefits.
Except under exceptional circumstances, sponsored immigrants admitted to Canada as permanent residents under a Sponsorship Agreement, are not eligible to receive GIS / SPA / WSA benefits during the sponsorship period for which the sponsor committed to support the immigrant, up to a maximum of ten years. (For example, if an immigrant landed in 1995 under a Sponsorship Agreement and is eligible to apply for OAS in 2004 when he turns 65, he would not be eligible for GIS / SPA / WSA benefits until his sponsorship period is over in 2005.)
Non-sponsored immigrants with less than 10 years of residence in Canada who qualify for OAS under an International Social Security Agreement will have their GIS / SPA / WSA entitlement grow gradually over 10 years – 1/10th of the benefit for each year of residence. This includes persons who have not resided in Canada for 10 years after the age of 18. (For example, a non-sponsored immigrant can apply for GIS / SPA / WSA as soon as he turns 65. However, the maximum benefit would be determined using for example, 9/10ths GIS / SPA / WSA entitlement if he landed in 1995 and turned 65 in 2004. In 2005 his entitlement would be 10/10ths of the benefit.)
Source: Thompson and Worswick, 2005.
For details see Service Canada website.
Summary and future directions for research
Scanning the immigration literature reveals evidence that some immigrants (particularly those landed more recently) may be experiencing barriers to successful economic integration, resulting in increasing low-income rates. Specifically, recent trends indicate that the gap between the low-income rates for immigrants and those born in Canada has increased substantially since 1980. The goal of this report has been to provide an overview of the low-income situation of immigrants in Canada with the goal of highlighting aspects of this issue in need of additional research. This report first considered the policy importance of the issue of low-income and immigration. Rising low-income rates among more recent immigrants relative to both the Canadian-born and immigrants who have been in Canada longer are cause for concern because low-income potentially impacts the ability of immigrant individuals and families to participate economically, socially, culturally, and with dignity in their communities. These findings raise additional worries, not the least of which is the potential trans-generational impact of marginalization among these groups. While the latest research results point to improvements in immigrant economic outcomes relative to the Canadian-born, there remain immigrants who have not seen an increase in relative economic performance, and who live in chronic low-income. This is potentially one of the most serious social and labour market challenges that Canada is facing.
Second, this report provided a description of low-income measures and touched upon differences to reflect on when using these indicators to evaluate immigrant economic outcomes. There are a number of low-income lines used to inform policy development in the area of immigrant economic integration. Low-income measures such as the LICO, LIM, and MBM can be used to identify the low-income population, while measures of chronic low-income and low-income intensity are often used in studying trends in the depth and duration of low-income spells among immigrants. It is meaningful to understand if a situation of low-income is transitory or persistent, as policy solutions may be very different. The existing low-income measures are designed to identify low-income individuals from different angles. Given the many dimensions of low-income, it may not be possible to find one measure that provides a complete picture. Rather, it is argued by several studies reviewed that it is most useful to develop or adopt multiple measures of low-income. Although LICO has been prevalent to date in studies looking at immigrants and low-income, the growing obsolescence of this measure (with increasing number of years from its 1992 base year), along with recent data developments (discussed below) imply a likelihood of a move towards more prevalent use of LIM-based measures (which are derived from the distribution of incomes in the underlying population in each year) going forward.
Third was an examination, based on a review of the research literature, of the factors that contribute to the low-income situations of immigrants in Canada. Low-income is widely accepted as an indicator of access to economic resources among members of society and is therefore often used as a key indicator of immigrant integration and well-being. This study reviewed the factors contributing to the earnings outcomes among recent immigrants (low-income among immigrants has closely tracked earnings trends, since earnings are the most significant component of family income, which is used to calculate low-income rates), focusing on the relationship between the characteristics of immigrants, or the socio-economic attributes that immigrants bring with them (including immigration category, year of landing and years in Canada, age, education, gender, source country, family type, province of residence, occupation, etc.), and the opportunities and barriers presented by the host society, be they economic, social, or institutional. Only through comparisons can factors be brought to light that explain why some groups end up more or less affected by low-income. Overall, the causes of low-income amongst immigrants are multifarious. For working age immigrants, for example, a shift in their characteristics and the cyclical nature of the economy may lead to additional barriers to the labour market, while for senior immigrants, their family size, family type, and motivations for immigration may generate different income levels.
Finally, in reviewing the recent literature on the low-income situation of immigrants in Canada and in examining different measures of low-income, a main objective of this report has been to identify potential new research possibilities. As the final section below illustrates, research and data are needed that will contribute to the current understanding the low-income situation of immigrants in all admission categories, including economic immigrants, and particularly among family class immigrants and refugees. In light of policy focused on improving the economic outcomes of immigrants, research and data development in the areas of low-income – incidence and causes – is a priority.
Research considerations
Research is needed to understand factors preventing Canadians from achieving an acceptable standard of living. Most studies on the economic integration of immigrants are based on individual earnings only, rather than total family income. As a family concept, low-income provides a better welfare perspective on immigrant families’ economic resource position than individual earnings. Central to the concept of low-income is the importance of socio-economic characteristics and conditions on the differences seen among different populations. Analyses are needed to offer “reasons why” things are different between the various populations identified before appropriate policy responses can be developed. Research into low-income among immigrants serves to inform the development of policy initiatives that will enable families and individuals at risk of low-income to improve their opportunities and outcomes so as to reduce the incidence, depth and duration of low-income.
Specifically, research is needed to look at the impacts of low-income trends at the micro level – what types of individuals, families, and communities are experiencing low-income and why. Research in this area needs to take into account the use of the various low-income measures, comparisons across family and household size, and comparisons across cities (to account for cost of living differences). Analysis of low-income among immigrants also needs to account for immigrant category of admission, visible minority status, ethnicity, religion, family and household type (married couples, lone-parents, unattached individuals, etc.), gender, sources of income (market and transfers), and age (children, working age, and seniors). It is also meaningful to consider low-income outcomes among immigrants by years in Canada, as immigrants and refugees often need some time to settle in their new country, and as a result, years since migration generally corresponds to improved economic and social outcomes. To accurately inform policy, it is also important for research to consider differences between those that have low-income for short spells (perhaps as very recent or recent immigrants), versus those who have long-term, or chronic low-income. Among immigrants, additional factors contributing to economic success, and which need to be accounted for are regional/local labour market conditions, official language capacity and literacy, the acceptance of foreign educational qualifications, and Canadian work experience.
In the case of immigrants and low-income, there are many things we need to better understand. The following are some of the key areas identified for further research:
Research questions
This literature review revealed a gap of research on the low-income situation of immigrants post 2006, the time of the last Census. There are many reasons why the post-2006 time period is of particular policy importance with respect to understanding the low-income situation of immigrants in Canada today. First, many immigration policy changes have taken place since 2002, starting with the implementation of the Immigration and Refugee Protection Act (IRPA), and it is important to understand how these changes have influenced the income situation of recent immigrants. For instance, some immigrants have experienced improvements in their economic outcomes post-IRPA, affecting their individual and family income situation, thereby potentially reducing the incidence of immigrants with family incomes below various low-income measures. Notably, a recent evaluation of the Federal Skilled Worker Program found that Federal Skilled Workers landing after IRPA was implemented are earning 65% higher incomes in their first year than people who applied under the old system (pre-IRPA), and are also more likely to be working.Footnote 123 Moreover, there has been an increase in the prevalence of immigrants landing under the Provincial Nominee Programs, programs largely intended to attract immigrants with skills that best match local labour market needs. Again, a recent evaluation of the Provincial Nominee Program found the vast majority of Provincial Nominees are becoming established economically, reporting employment or self-employment earnings each year, by years since landing (2000-2008 cohorts), and very few access Employment Insurance and/or Social Assistance benefits.Footnote 124 More recently, the federal government has signaled a wish to more closely align immigrant skills with the immediate needs of the job market,Footnote 125 suggesting the potential for improved economic outcomes among recent immigrants. Developments have included the creation of the Canadian Experience Class in 2008, which provides permanent resident status to migrants who apply from within the country, drawing on temporary foreign workers and international students. This action is based on the idea that those who have already been in Canada prior to immigration may have an easier time transferring their pre-immigration human capital to the Canadian labour market, leading to stronger labour market outcomes. A recent series of Ministerial Instructions (the first was issued in 2008) have also resulted in several key changes that could improve the economic situation of some recent immigrants. For example, those for Federal Skilled Workers (MI-1, MI-2, and MI-3) involve lists of occupations (identified as the most in demand) under which Federal Skilled Workers are eligible to apply, requirements for arranged employment, and applicants are also required under these Ministerial Instructions to submit language test scores as evidence of their proficiency in one of Canada’s official languages. This also applies to applicants under the Canadian Experience Class, and reflects the importance of language proficiency as one of the most important predictors of an immigrant’s labour market success. Ministerial Instructions for Federal Skilled Workers issued in 2011 included a new cap on Federal Skilled Worker applications and the introduction of a new PhD eligibility stream. There has also been a recent set of Ministerial Instructions introducing a temporary moratorium on Federal Entrepreneur Class applications (2011). Other Ministerial changes have concerned family class immigration, including a temporary pause on family class sponsorship applications for parents and grandparents (2011). Finally, with the recent Royal Assent of Protecting Canada’s Immigration System Act (June 2012),Footnote 126 it will be important to consider potential changes to the profile of refugees on the low-income situation of recent immigrants in the years going forward. In brief, there have been many changes to immigration policy over the past decade (many intended to more closely align immigrant skills with the demands of the labour market); the impact of these changes on the low-income situation of immigrants is a key policy research area.
Second, labour market conditions throughout Canada (and many areas of the world) since 2006 have changed considerably. While 2006 and 2007 were in many ways seen as boom years economically, the country experienced a recent recession (from October 2008 to October 2009), creating challenging economic times for many Canadians, but particularly for those in Ontario, where the large manufacturing sector took a hit.Footnote 127 In fact, the road to recovery has been experienced differently throughout the country, with some provinces faring better than others. In particular, although Alberta was also hard hit by the global recession (largely through the decline in crude oil markets), this province had relatively stronger economic indicators throughout the period compared to other provinces (for example in terms of participation, employment, and unemployment rates), and perhaps as a result more immigrants are destined to this province than ever before. In contrast, the traditional immigrant destination hot spot of Ontario experienced a reduction in the proportion of immigrants destined to this province. In fact, immigration destined for Alberta rose from 8.2 percent of total immigrants to Canada in 2006 to 12.4 percent by 2011. In contrast, the proportion of immigrants destined to Ontario fell from 50.0 percent to 40.0 percent over the same period.
As a result, each of these provinces has had a unique experience over the recession. In Alberta, there was an increasing share of immigrants destined to this province at a time of economic downturn, while in Ontario there was a decreasing share of immigration destined to this province at a time of economic downturn. Moreover, while Alberta continued to feel the effects of the global recession in 2010 and recovered relatively more slowly, Ontario benefited from a revival in auto manufacturing.
There have also been changes in economic conditions abroad that may have influenced the socio-economic characteristics of people applying to migrate to Canada. For instance, it is possible that a deeper economic downturn in the United States and in many European countries over recent years relative to that experienced in Canada may have served as a motivation for an increased number of residents from some areas in these countries seeking to migrate to Canada for perceived relatively better economic opportunities. In fact, recent immigration recruitment activities have been undertaken by the Government of Canada to encourage immigration from Ireland, a country currently saddled with a highly educated workforce and an economic slump.Footnote 128 In short, there have been major changes to labour market conditions in Canada and abroad since 2006 that may have impacted the low-income situation of recent immigrants.
In light of the recent changes in immigration policies and economic downturn and recovery, research is needed that looks at the low-income situation of recent immigrants in this new landscape, to address questions such as:
- How does incidence of low-income among immigrants compare to other Canadians? Specifically,
- How have low-income trends for immigrants fared in the later half of the 2000s (since 2006), in light of improved labour market outcomes for skilled immigrants under IRPA?
- Have immigrant low-income outcomes of recent immigrants improved alongside recent policy measures to more closely align immigrant skills with the demands of the labour market, including the growth of Provincial Nominee Programs, the creation of the Canadian Experience Class and the implementation of several sets of Ministerial Instructions?
- What is the low-income situation of those entering Canada in non-economic categories (e.g., such as refugees and those in the family class including those who have entered Canada in the Parents and Grandparents stream)?
- Going forward, will recent Ministerial Instructions and Refugee Reform coincide with changes to the low-income situation of family class immigrants and refugees?
- How long does it take for immigrants in the various immigration programs to be self supporting?
- Specifically, what are the differences among the various refugee groups?
- How do immigrant earnings progress out of low-income situations, for immigrants landing in all admission categories?
- What are some of the factors contributing to these trajectories?
The literature review revealed relatively little research has focused on immigrant economic welfare at the family level. The low-income rate allows for a measure of immigrant family welfare outcomes. Since low-income rates are based on total family income, which includes government transfer payments and investment and pension income, as well as employment earnings, they provide a more inclusive picture of the economic resources available to families than studies of earnings alone.Footnote 129 As a result, low-income rates are influenced not only by changes in median or average earnings, and their numerous determinants, but also by changing earnings and income inequality, the availability and usage of social transfers, investment behaviour, and family formation patterns.Footnote 130 On this later point, one factor influencing aggregate low-income rates is demographic change, such as an increase in the number of single-parent families, which can cause the aggregate rate to rise.Footnote 131 Family formation patterns could be shifting among the immigrant population, as they have been among the Canadian population as a whole, tending to increase family earnings inequality.Footnote 132 Among immigrants, extended family living arrangements may be more common, and may serve to either reduce or expand their low-income incidence.
Research is needed that looks at the low-income situation of recent immigrants from the family perspective to address questions such as:
- What types of individuals, families, and communities are experiencing low-income?
- What is the low-income situation of immigrant children?
- Immigrant seniors?
- Working age immigrants?
- How does the situation compare across person and place?
- How does location of immigrant settlement interact with low-income?
- How much does changing family type contribute to low-income trends among immigrants?
- From a family composition perspective, how is the incidence of low-income among immigrants influenced by the prevalence of extended families?
- What is the low-income situation of established immigrant families compared to more recent immigrant families?
- What are the factors that account for persistent low-income among certain immigrant family groups?
Further investigation into sources of income is needed to more fully understand the low-income situation among immigrants -- an immigrant who falls into low-income due to low-paid work requires different policy action than a senior immigrant who falls into low-income due to insufficient levels of retirement income. Family income is split into two components: market income and government transfers. Market income includes employment income, investment income, private retirement pensions, superannuation and annuities and other money income. Government transfer payments include Employment Insurance (EI), Old Age Security (OAS), Guaranteed Income Supplement (GIS), Canada or Quebec Pension Plan, and child benefits, as well as other government transfers (including social assistance and workers’ compensation). Picot, Lu, and Hou (2009) argue that the direct effect of transfers refers to the extent to which the dollars received from the programs such as the Spouse’s Allowance, Employment Insurance and child tax credits move families from below to above the low-income cut-offs. However, these authors argue, government transfers may have work-disincentive effects: people may be less likely to seek employment if they are receiving transfers, as compared with the hypothetical case where no transfer system existed. The role of the government in the low-income situation of immigrants is also of interest with regards to programs to settle immigrants.
The causes for increased low-income amongst working immigrants are unclear and may be related more to structural labour market situations than to immigration policy. Fleury (2007) suggests it would be interesting to do further research on the working conditions of low-income immigrants, pointing to the findings of a focus group study that revealed an “All or Nothing Approach to Work” among recent immigrants, meaning some of them chose not to work instead of accepting inappropriate jobs and being part of the working poor.Footnote 133 The focus group study also found that recent immigrants often rely on numerous jobs, some in the formal labour market, and some in the cash economy. Citing the same focus group study, Fleury points out many immigrants either choose, or are forced, to work in jobs in the cash economy. If this reality implies that some recent immigrants are faring better economically than statistics on income indicate, this also means that they are often not eligible to government programs, such as Employment Insurance and Canada Pension Plan. Since these observations come from a series of focus groups, Fleury argues it would be interesting to expand this research in order to verify the impact of these phenomena at the national level. As well, Fleury recommends further exploration of their family strategies in terms of labour market participation, noting that working-age recent immigrants living in low-income have more potential earners in their families without having a particularly high level of family participation in the labour market. As a result, she argues, it would be worthwhile to determine whether this is because of greater family responsibilities, stronger barriers to employment for certain members of their families, participation in the cash economy, cultural differences, or other factors.
Research is needed that looks at the low-income situation of recent immigrants from the perspective of sources of income, government supports, and labour force participation of all family members, to address questions such as:
- What is the role of government transfers in smoothing earnings situations of immigrant families?
- How does the role differ with immigration category, family situation, and years since migration?
- Are elderly immigrants more or less dependent on transfer payments in their older age compared to Canadian-born seniors?
- With regards to programs to settle immigrants, what works with respect to reducing barriers to economic integration and lowering the probability of immigrants to enter a low-income situation?
- What are the working-conditions of immigrants in a low-income family situation?
- To what extent are immigrants working in the cash economy?
- What are the factors limiting the labour market participation of low-income immigrant family members?
Data considerations
The past has seen a fairly steady use of several Statistics Canada’s surveys to examine the low-income situation of immigrants and other Canadians, mainly the Census, the Survey of Labour and Income Dynamics (SLID), and to a lesser extent, the Longitudinal Administrative Database (LAD)-Longitudinal Immigration Database (IMDB) (LAD-IMDB Database). Recent developments with regards to these traditionally used surveys have important implications for the continued study of immigrants in low-income going forward. In this section, some of these changes are reviewed and consideration is given to how they may shape future analyses of immigrants in low-income.
The following are some of the key data considerations going forward:
Canadian Census and the National Household Survey (NHS)
Every five years, Statistics Canada conducts a census of population. Traditionally, the census has provided a comprehensive collection of facts about people in Canada. For example, people are asked questions about their: age, marital status, employment, ethnic origin, immigration status, gender, education, income, language, and other subjects. In the 2006 Census, 80% of households in Canada received a short questionnaire containing eight questions, while 20% were given a 61-question long-form (all questions from the short form plus 53 additional questions). The information from the short census form contains questions on basic topics such as age, sex, marital status and mother tongue of all household members. The information from the long-form provides data describing immigrant status, place of birth, place of residence, labour market, education, language and other socio-economic characteristics and information identifying naturalized citizens and their countries of citizenship. Census data also provide detailed information at the community level. Because the Census is collected every five years and the questions are similar, researchers have used these data to compare changes that have occurred in the make-up of Canada's population over time. In fact, the Census is the most fundamental source of information about our country and our society.Footnote 134 Moreover, through the long-form, the census is the most reliable source of detailed data that allows comparison of important sub-segments of the population (such as immigrants, ethnic groups and visible minorities). It is not surprising, then, that the Census is the data base most commonly used to research immigrants, and to date has been the most valuable information source on trends in their low-income situation.
With the 2011 Census, the questions asked of 20% of the population (the long-form) were moved to a voluntary National Household Survey (NHS).Footnote 135 The NHS was conducted in May 2011 with a sample of approximately 4.5 million households and contains all of the questions that Statistics Canada contemplated for inclusion in a 2011 Census long form. As a result, the 2011 Census collected only basic data (age, sex, families, households, marital status, and language) and results will not contain any immigration or income-related content, or other information gathered on the long form. In other words, the NHS is identical in content to what would have been collected in a 2011 Census long-form. Going forward, the NHS will contain the information previously available in the Census used to examine the low-income situation of Canadians, including the immigrant population. Among others, the NHS questionnaire included questions on demography, citizenship and immigration, language, language of work, ethnic origin, population group, religion, place of birth of parents, education, labour market activities, and income from all sources. Although being released in several stages, all information from the NHS will be available from Statistics Canada by October 2013.
The move to the NHS for information on immigrants in low-income may affect our understanding of the low-income situation of immigrants. First, the NHS may affect analysis of low-income trends through time given that comparability with 2006 Census data may be an issue. According to Statistics Canada, any significant change in the methods of a survey can affect the comparability of data over time, and there is a real risk this will be the case for the NHS.Footnote 136 As described by Statistics Canada, there will always and inevitably be an element of uncertainty as to whether and to what extent a change in a variable reflects real change or an artefact arising from the change in methodology from the mandatory long-form census to the voluntary NHS. Second, while all surveys are subject to non-response bias (even a Census with a 98% response rate), it is believed that the most significant source of non-sampling error for the NHS will be non-response bias.Footnote 137 The risk of non-response bias quickly increases as the response rate declines, because non-respondents tend to have characteristics that are different than those of respondents and thus the results are not representative of the true population.Footnote 138 As a result, while a 70% response rateFootnote 139 to the NHS appears high, the missing 30% may be important, because it may be that those who do not respond to the survey share certain characteristics: for example, they may be more likely to have language and literacy issues, to not have access to, or skills for, a computer, characteristics which may be held by considerable segments of the low-income population. In other words, the data gathered by the survey may to some extent exclude segments of the population of interest when it comes to examining the low-income situation of immigrants. Despite these two concerns, and while acknowledging that it will not provide a level of data quality that would have been achieved through a mandatory long-form census, Statistics Canada reports being confident that the NHS will produce usable and useful data that will meet the needs of many users. With these nuances in mind, an updated picture of the low-income situation of all Canadians (based on 2010 income), will be possible based on NHS data by the end of 2013.
Survey of Labour and Income Dynamics (SLID)
The Survey of Labour and Income Dynamics (SLID) is an annual survey that examines changes experienced by individuals over time in terms of their labour market activities and income. At the heart of the survey's objectives is the understanding of the economic well-being of Canadians: what economic shifts do individuals and families live through, and how does it vary with changes in their paid work, family make-up, and receipt of government transfers or other factors? The survey's longitudinal dimension makes it possible to see such concurrent and often related events.Footnote 140 The SLID includes information on people and their jobs including: weekly labour force activity of individuals; characteristics of each job held in the year; personal/family/household characteristics; and sources of income, including Employment Insurance and Social Assistance. The SLID sample is composed of two panels. Each panel includes roughly 15,000 households. A panel is surveyed for a period of six years, and a new panel is introduced very three years, and thus two panels are always overlapping.Footnote 141 Initially, SLID was designed by Statistics Canada to be, first and foremost, a longitudinal survey, with primary focus on labour and income and the relationships between them and family composition.Footnote 142 Then, a decision was made to extend the objectives of SLID to be the primary source of cross-sectional household income data.Footnote 143 The cross-sectional public-use microdata file for the Survey of Labour and Income Dynamics (SLID) is a collection of income, labour and family variables on persons in Canada and their families.
To date, the SLID is the most widely used data source in examining the labour market attachment experience of a number of groups (including recent immigrants) in Canadian society that are particularly at risk of extended spells of low-income and exclusion from the labour market. The great advantage of the SLID is that it has allowed analysis of duration of low-income spells.Footnote 144 However, in June 2012, Statistics Canada announced that changes will be made to the SLID. Specifically, Statistics Canada announced that “the final release of longitudinal data from the Survey of Labour and Income Dynamics was published on June 18, 2012. Statistics Canada will continue to conduct a survey to produce annual estimates on income.”Footnote 145 In other words, Statistics Canada will stop the longitudinal dimension of SLID, but will continue using parts of the questionnaire as a cross-sectional survey. As such, the SLID will retain the capacity to calculate low-income rates, but retain a much more limited capacity to explain how long they are, what causes them to start or end, and how many people experience income losses or gains.Footnote 146 This being the case, without the longitudinal component, the SLID should continue to provide an assessment, albeit a more limited one, of the interactions between economic conditions and immigrant human capital in immigrant labour market integration, allowing the examination of some aspects of low-income.
Longitudinal Administrative Database (LAD) – Longitudinal Immigration Database (IMDB) (LAD-IMDB Database)
To date, the only source of large-scale data available to look at low-income and immigrants by category of admission has been what is referred to as the Longitudinal Administrative Database (LAD) – Longitudinal Immigration Database (IMDB) (LAD-IMDB Database). Statistics Canada’s LAD-IMDB database combines the Longitudinal Administrative Database (LAD) and the Longitudinal Immigration Database (IMDB). The LAD is a random, 20% sample of the T1 Family File, which is a yearly cross-sectional file of all Canadian taxfilers and their families. Individuals selected for the LAD are linked across years to create a longitudinal profile of each individual. Families are formed to allow family income to be determined. Immigrants entering Canada since 1980 are identified on the LAD, and information on immigrant category of admission, educational attainment, intended occupation, and self-reported language is added from the landing records. The immigrant information contained in the LAD comes from the IMDB. The IMDB contains immigrant landing record and annual tax information for immigrants and is a key information source to look at the economic performance of immigrants by a wide range of socio-economic characteristics. All the information from the tax record is current data – the tax year – while all data from the landing record is tombstone data – that is, recorded only once, at time of arrival. Individuals included in the IMDB are immigrants who were landed between 1980 and the most recent tax year, and for whom at least one tax return was filed since their arrival in Canada. The LAD-IMDB database is produced by matching the two databases, with the result that 20% of immigrants on the IMDB are identified on the LAD. The LAD-IMDB Database allows comparisons of known immigrants and other Canadian taxfilers. Moreover, because families are formed in LAD, joining this database with the IMDB allows low-income issues of immigrants to be examined.
The LAD-IMDB has the significant advantage of allowing researchers to look at issues such as low-income longitudinally, and hence get at issues of incidence, entry, exit and duration of low-income spells. However, the LAD-IMDB does not support highly disaggregated analysis. Specifically, because the LAD is a 20% sample of the population (and 20% of information from the IMDB is available in the LAD-IMDB), some analysis using detailed immigrant information can lead to small cell sizes, creating issues of high variability. For example, variability could be higher with some immigration categories (e.g., Business Classes), some education levels (e.g., those with Masters/doctorates), some age groups (e.g., older age groups), and for some world areas.Footnote 147
Redesigned Longitudinal Immigration Database (IMDB)
Historically, the IMDB has provided information on immigrant economic performance by category over time, focusing exclusively on personal income sources of individual immigrant tax filers and not on family income. However, in May 2012, Statistics Canada officially launched a Redesigned IMDB, the overarching goal of which is to allow for new insights into a wide range of policy research issues surrounding immigrant labour market integration, including on the topic of low-income. As part of the redesign, the IMDB moves from raw T1 personal income tax return data to the T1 Family File (T1FF).Footnote 148 There are many advantages in moving to this source, including for the purposes of examining low-income among immigrants. In moving to the T1FF, the IMDB is harmonized with the structure with the Longitudinal Administrative Databank (LAD), meaning the IMDB is similarly organized into individual, spouse/parent, family, and child segments. Moreover, because Census families are formed, and low-income is a family concept, it is becomes possible to look at low-income issues. There are also new measures of income and government transfers available, creating information not only on individual income measures, but also family income measures (before- and after-tax total income, employment earnings, self-employment, investment income, Employment Insurance, Old Age Security, Canada Pension Plan/Quebec Pension Plan, Social Assistance, Registered Retirement Savings Plan income, family and child tax credits, and transfer payments). As well, with harmonization to LAD, it is possible to replicate identical research for other Canadian taxfilers, creating a benchmark, or comparison group, useful for analytical purposes.
Because the Census family is the unit of analysis available in the redesigned IMDB and the LAD, none of the three official low-income lines are directly applicable. The LICO and MBM are both based on economic families, while the LIM is based on households.Footnote 149 However, because the redesigned IMDB is harmonized to the LAD, it is possible to construct a LIM-based low-income measure in the LAD database that could be used to study low-income of immigrants in the IMDB. There are examples of this in the research literature based on LAD (for example, Finnie and Sweetman, 2003), or the IMDB-LAD Database (for example, Picot, Hou, and Coulombe, 2007). Using the LAD to calculate a low-income measure to be applied to the IMDB population takes into account the income distribution of the Canadian taxfiling population. It would not be appropriate to use the IMDB alone to create a low-income line as one would not want to calculate a low-income measure based only on the immigrant tax filing population. Rather, it is meaningful from a policy perspective to consider the entire Canadian population in estimating a measure for low-income. In the IMDB Redesign (as with the LAD), individuals can be considered to be in low-income in a given year when the annual income of their family is below a pre-determined cut-off (e.g., family income below 50% of median income of the total population, adjusted for family size).
In its new capacity, the Redesigned IMDB has the potential to fill the gap in immigrant low-income analysis created by the elimination of the longitudinal component of the SLID, discussed above. The redesigned IMDB is likely to become the key information source to examine the labour market transitions of immigrants, including into and out of low-income situations. Moreover, while a disadvantage of the SLID has always been the small sample size of immigrants, the larger sample size (the taxfiling population) of immigrants in the IMDB will allow the comparison of the dynamics of immigrant labour market transitions (e.g., into and out of paid employment, dependence on Social Assistance and Employment Insurance, etc.). In comparing with LAD results, it will also be possible to compare these outcomes with those of other similarly endowed Canadian taxfilers. The redesigned IMDB is anticipated to be the key data source to provide the evidence base necessary to make informed policy decisions on where to target remedial action to facilitate the transition into paid work of those immigrants who are currently out of the labour force and dependent on government assistance, unemployed, or in a low-income situation.
References
- Aydemir, Abdurrahman, and Mikal Skuterud (2005). “Explaining the Deteriorating Entry Earnings of Canada’s Immigrant Cohorts: 1966-2000.” Canadian Journal of Economics, Vol. 38, No. 2, pp. 641-672.
- Baker, Michael, and Dwayne Benjamin (1995). “The Receipt of Transfer Payments by Immigrants to Canada.” The Journal of Human Resources, 30(4): 650-676.
- Baker, Michael and Dwayne Benjamin (1994). “The Performance of Immigrants in the Canadian Labour Market.” Journal of Labor Economics. 12: 369-405.
- Boudarbat, Brahim, and Maude Boulet (2010). « Un diploma postsecondaire canadien : un tremplin vers des emplois de qualité pour les immigrants. » Institute for Research on Public Policy.
- Bonikowska, Aneta, David A. Green and W. Craig Riddell (2008). “International Adult Literacy Survey: Literacy and the Labour Market: Cognitive Skills and Immigrant Earnings.” Statistics Canada, Catalogue no. 89-552-M No. 020.
- Brady, David (2011). “Power, Policies and Working Poverty in the U.S.” Conference paper presented at the International Conference on Poverty, Social Statistics and Social Exclusion, Montreal, November 30 – December 2, 2011.
- Brink, Satya and Urvashi Dhawan-Biswal (2002). “Investing in our Youth for a Skilled Workforce.” Quarterly Labour Market and Income Review, Human Resources Development Canada, Summer 2002, Vol. 3, No 1. 16-20.
- Burbidge, Magee, and Robb (2002). “The Education Premium in Canada and the United States.” Canadian Public Policy, Vol. XXVIII, No. 2, pp. 203-217.
- Camarota, Steven A. (1999). “Immigration's Impact on the Size and Growth of the Poor Population in the United States.” The Centre for Immigration Studies, Center Paper no. 15.
- Canadian Index of Wellbeing. University of Waterloo, Faculty of Applied Health Sciences, Ontario, Canada.
- Canadian Index of Wellbeing (2011). “How are Canadians Really Doing? Highlights: Canadian Index of Wellbeing 1.0.” Waterloo, ON: Canadian Index of Wellbeing and University of Waterloo.
- Canadian Council on Social Development (2008). “Defining and Re-defining Poverty in Canada.” Perception, Volume 29, Nos. 3 & 4.
- Centre for the Study of Living Standards (CSLS). Index of Economic Well-being.
- Citizenship and Immigration Canada, Evaluation Division (2011a). “Evaluation of the Provincial Nominee Program.”
- Citizenship and Immigration Canada, Evaluation Division (2011b). “Evaluation of the Immigrant Settlement and Adaptation Program (ISAP).”
- Citizenship and Immigration Canada, Evaluation Division (2010). “Evaluation of the Federal Skilled Worker Program.”
- Citizenship and Immigration Canada (2008). “Backgrounder: Action Plan for Faster Immigration: Ministerial Instructions.”
- Citizenship and Immigration Canada, Strategic Research and Review (1998). “Medium Term Research Framework.” Research Unit.
- Citizenship and Immigration Canada (1998b). “The Economic Performance of Immigration: Canadian Language Perspective.” IMDB Profile Series, Strategic Policy, Planning and Research.
- Dempsey, Colleen-Marie (2006). “Immigrant Income and the Family.” Citizenship and Immigration Canada, Research and Evaluation Branch, Research Paper.
- Dempsey, Colleen-Marie, and Stan Kustec (2006). “Recent Immigrant Outcomes – 2004.” Strategic Research and Statistics, Citizenship and Immigration Canada.
- De Silva, Arnold (1997). “Earnings of Immigrant Classes in the Early 1980s in Canada: A Reexamination.” Canadian Public Policy 23(2): 179-202.
- Dalgleish, Kimberley J. (2008). “The Wealth of Immigrants: Expanding our Understanding of Immigrant Economic Integration in Canada.” Ryerson University, Theses and dissertations. Paper 115.
- Dryburgh, Heather (2004). “Building the LAD_IMDB - A Technical Paper, 1980 to 1999.” Housing, Family and Social Statistics Division Research Paper, Statistics Canada, Catalogue no. 89-612-XIE.
- Felligi, Ivan P. (1997). “On Poverty and Low-Income.” Statistics Canada, Catalogue no. 13F0027-XIE.
- Ferrer, Ana, David Green, and Craig Riddell (2004). “The Effect of Literacy on Immigrant Earnings.” Statistics Canada, Catalogue no. 89-552-MIE, no. 12.
- Ferrer, A. and W.C. Riddell (2001). “The Role of Credentials in the Canadian Labour Market.” Discussion Paper No. 01–16, Vancouver: Department of Economics, University of British Columbia.
- Fleury, Dominique (2008). “Low-income Children.” Perspectives on Labour and Income. Vol. 9, no. 5. May. Statistics Canada Catalogue no. 75-001-XIE.
- Fleury, Dominique (2007). “A Study of Poverty and Working Poverty among Recent Immigrants to Canada.” Human Resources and Social Development Canada, SP-680-05-07E.
- Finnie, Ross and Arthur Sweetman (2003). “Poverty Dynamics: Empirical Evidence for Canada.” Canadian Journal of Economics, Vol. 36, No. 2.
- Frenette, Marc and René Morissette (2003). “Will they ever Converge?” Earnings of Immigrant and Canadian-born Workers over the Last Two Decades. Analytical Studies Research Paper Series, Statistics Canada Catalogue No. 11F0019MIE2003215.
- Friedberg, Rachel M. (2000). “You Can’t Take It with You?” Immigrant Assimilation and the Portability of Human Capital. Journal of Labor Economics 18(2):221-51.
- Giles, Philip (2004). “Low-income Measurement in Canada.” Statistics Canada, Catalogue no. 75F0002MIE.
- Gilmore, Jason (2009). “The 2008 Canadian Immigrant Labour Market: Analysis of Quality of Employment.” Immigrant Labour Force Analysis Series Research Paper, Statistics Canada, Catalogue no. 71-606-X, no. 5.
- Gilmore, Jason, and Christel Le Petit (2008). “The Canadian Immigrant Labour Market in 2007: Analysis by Region of Postsecondary Education.” The Immigrant Labour Force Analysis Series, Statistics Canada Catalogue no. 71-606-X2008004.
- Goldmann, Gustave, Arthur Sweetman, and Casey Warman (2011). “The Portability of New Immigrants” Human Capital: Language, Education, and Occupational Matching. Published by the IZA, July 2011.
- Green, David and Christopher Worswick (2010). “Entry Earnings of Immigrant Men in Canada: The roles of Labour Market Entry Effects and Returns to Foreign Experience.” in Canadian Immigration: Economic Evidence for a Dynamic Policy Environment, eds. Ted McDonald, Elizabeth Ruddick, Arthur Sweetman, and Christopher Worswick (Montreal and Kingston: McGill Queen's University Press, Queen's Policy Studies Series), pp. 77-110.
- Green, David A. and Christopher Worswick (2002). “Earnings of Immigrant Men in Canada: The Roles of Labour Market Entry Effects and Returns to Foreign Experience.” University of British Columbia, Department of Economics. Paper prepared for Citizenship and Immigration Canada.
- Grondin, Chantal (2005). “Knowledge of Official Languages Among New Immigrants: How Important Is It in the Labour Market?” Statistics Canada. Catalogue no. 89-624-XIE
- Hatfield, Michael, Wendy Pyper and Burton Gustajtis (2010). “First Comprehensive Review of the Market Basket Measure of Low Income: Final Report.” Human Resources and Skills Development Canada, Social Policy, SP-953-06-10E.
- Hatfield, Michael (2004). “Vulnerability to Persistent Low-income.” Policy Research Initiative, Horizons, Volume 7, number 2, pp. 19-26.
- Hiebert, Daniel (2009). “The Economic Integration of Immigrants in Metropolitan Vancouver.” Institute for Research on Public Policy (IRPP).
- Hou, Feng and Garnet Picot (2003). “Visible Minority Neighbourhood Enclaves and Labour Market Outcomes of Immigrants.” Analytical Studies Branch Research Paper Series, Statistics Canada, Working Paper No. 204.
- Human Resources Development Canada (2003). “Understanding the 2000 Low-income Statistics Based on the Market Basket Measure.” Applied Research Branch, Strategic Policy.
- Human Resources Development Canada. Indicators of Well-being in Canada.
- Kazemipur, Abdolmohammad, and Shiva S. Halli (2001). “Immigrants and New Poverty: The Case of Canada.” International Migration Review, Vol. 35, No. 4: 1129-1156.
- Kustec, Stan, and Li Xue (2009). “Recent Immigrant Outcomes - 2005 Employment Earnings.” Citizenship and Immigration Canada, Research Paper.
- Kustec, Stan, Eden Thompson and Li Xue (2007). “Foreign Credentials: The Tools for Research.” Canadian Issues. Spring. p. 26-30.
- LaRochelle-Côté, Sébastien and Jason Gilmore (2011). “Inside the Labour Market Downturn.” Perspectives on Labour and Income, Statistics Canada, Catalogue no. 75-001-X.
- LaRochelle-Côté, Sébastien and Jason Gilmore (2009). “Canada’s Employment Downturn.” Perspectives on Labour and Income, Statistics Canada, Catalogue no. 75-001-X.
- Lee, Kevin K. (2000). “Urban Poverty in Canada: A Statistical Profile.” Canadian Council on Social Development, Canada.
- Ley, David, and Heather Smith (2000). “Relations between Deprivation and Immigrant Groups in Large Canadian Cities.” Urban Studies, v. 37, issue 1, pp. 37-62.
- Ley, David, and Heather Smith (1997). “Immigration and Poverty in Canadian Cities, 1971-1991.” Canadian Journal of Regional Science, v. 20, issue 1-2, pp. 29-48.
- Lui, Jainye and Don Kerr (2003). “Family Change and Economic Well-Being in Canada: The Case of Recent Immigrant Families with Children.” Discussion Paper No. 03-08, Paper prepared for the 2003 Canadian Population Society Meetings, June 1-3, 2003, Halifax, Nova Scotia.
- McDonald, James Ted, and Christopher Worswick (1998). “The Earnings of Immigrant Men in Canada: Job Tenure, Cohort, and Macroeconomic Conditions.” Industrial and Labor Relations Review 51(3): 465-482.
- Michaud, Sylvie, Cathy Cotton, and Kevin Bishop (2004). “Exploration of Methodological Issues in the Development of the Market Basket Measure of Low-income for Human Resources Development Canada.” Income Research Paper Series, Statistics Canada, Catalogue no. 75F0002MIE – No. 001.
- Morisette, Rene, and Xuelin Zhang (2001). “Experiencing Low-income for Several Years.” Perspectives, Statistics Canada, Catalogue no. 75-001-XIE.
- Murphy, Brian, Xuelin Zhang and Claude Dionne (2012). “Low-income in Canada - A Multi-line and Multi-index Perspective.” Income Research Paper Series, Statistics Canada, Catalogue no. 75F0002M — No. 001.
- Myles, J. and G. Picot (2000). “Poverty Indices and Policy Analysis.” Review of Income and Wealth, 46, 161-179.
- Noël, Alain (2012). “Fighting Poverty, Inequalities, and Social Exclusion: Conference Report,” Montreal: QICSS and CRDCN.
- Oreopoulos, Philip (2009). “Why Do Skilled Immigrants Struggle in the Labour Market?” A Field Experiment with Six Thousand Résumés. Metropolis British Columbia, Working Paper Series, No. 9 (3).
- Organization for Economic Cooperation and Development (OECD) (2012). “Better Life Index.”
- Organization for Economic Cooperation and Development (OECD) (2008). “Growing Unequal? Income Distribution and Poverty in OECD Countries.” Paris.
- Palameta, Boris (2004). “Low-Income Among Immigrants and Visible Minorities.” Perspectives, Statistics Canada, Catalogue no. 75-001-XPE.
- Pendakur, Krishna and Simon Woodcock (2008). “Glass Ceilings or Glass Doors? Wage Disparity Within and Between Firms.” Discussion Papers dp08-02, Department of Economics, Simon Fraser University.
- Pendakur, Krishna, and Ravi Pendakur (1998). “The Colour of Money: Earnings Differentials among Ethnic Groups in Canada.” Canadian Journal of Economics 31(3): 518-548.
- Picot, Garnett and Arthur Sweetman (2012). “Making It in Canada: Immigration Outcomes and Policies.” Institute for Research on Public Policy (IRPP).
- Picot, Garnett and Feng Hou (2009). “Immigrant Characteristics, the IT Bust, and Their Effect on Entry Earnings of Immigrants.” Analytical Studies Branch Research Paper Series, Statistics Canada, Catalogue no. 11F0019M — No. 315.
- Picot, Garnett, Yuqian Lu and Feng Hou (2009). “Immigrant Low-Income Rates: The role of Market Income and Government Transfers.” Perspectives, Statistics Canada, Catalogue no. 75 001 X.
- Picot, Garnett (2008). “Immigrant Economic and Social Outcomes in Canada: Research and Data Development at Statistics Canada.” Analytical Studies Branch Research Paper Series, Statistics Canada, Catalogue no. 11F0019M - No. 319.
- Picot, Garnett, Feng Hou, and Simon Coulombe (2007). “Chronic Low-income and Low-income Dynamics among Recent Immigrants.” Statistics Canada, Analytical Studies Branch Research Paper Series, Catalogue 11F0019MIE # 294.
- Picot, Garnett, Jean-Marie Berthelot, and Maryanne Webber (2006). “Possible Future Directions for Longitudinal Surveys at Statistics Canada.” Paper prepared for Conference on Longitudinal Social and Health Surveys in an International Perspective, Montreal, Quebec, Canada, January 25-27, 2006.
- Picot, Garnett and Arthur Sweetman (2005). “The Deteriorating Economic Welfare of Immigrants and Possible Causes: Update 2005,” Analytical Studies Research Paper Series, Statistics Canada, Catalogue No11F0019MIE -No. 262.
- Picot, Garnett and Feng Hou (2003). “The Rise in Low-income Rates among Immigrants in Canada.” Analytical Studies Research Paper Series, Statistics Canada, Catalogue 11F0019MIF # 198.
- Picot, G., R. Morissette and J. Myles (2003). “Low-Income Intensity during the 1990s: The Role of Economic Growth, Employment Earnings and Social Transfers.” Research Paper, Statistics Canada, Catalogue no. 11F0019MIE — No. 172.
- Plante, Johanne (2010). “Characteristics and Labour Market Outcomes of Internationally-educated Immigrants,” Culture, Tourism and the Centre for Education Statistics Research Paper, Statistics Canada Catalogue no. 81-595-M — No. 084.
- Plante, Charles, and Axel van den Berg (2011). “Family Type and Poverty under Different Welfare Regimes: A Comparison of Canadian Provinces and Select European Countries.” In Perspectives from Quebec, Canada and Abroad: Social Statistics, Poverty, and Social Exclusion, edited by Guy Fréchet, Danielle Gauvreau, and Jean Poirer. Les Presses de l’Université de Montréal.
- Proulx, Christine, Samuel Faustmann, Hicham Raïq and Axel van den Berg (2011). “Internal Diversity in Social Policy Regimes.” In Perspectives from Quebec, Canada and Abroad: Social Statistics, Poverty, and Social Exclusion, edited by Guy Fréchet, Danielle Gauvreau, and Jean Poirer. Les Presses de l’Université de Montréal.
- Reitz, Jeffrey G. (2011). “Pro-Immigration Canada: Social and Economic Roots of Popular Views.” Institute for Research on Public Policy (IRPP), No. 20, October 2011.
- Reitz, Jeffrey G. (2007). “Immigrant Employment Success in Canada, Part I: Individual and Contextual Causes.” Journal of International Migration and Integration, Vol. 8, no.1. p. 11–36.
- Reitz, Jeffrey G., and Anil Verma (2004). “Immigration, Race, and Labor: Unionization and Wages in the Canadian Labor Market.” Industrial Relations. No. 43.4.
- Reitz, Jeffery G. (2001). “Immigrant Skill Utilization in the Canadian Labour Market: Implications of Human Capital Research.” Journal of International Migration and Integration, 2(3): 347-378.
- Reitz, Jeffery G. (2000). “Immigrant Success in the Knowledge Economy: Institutional Change and the Immigrant Experience in Canada, 1970-1995.” Centre for Industrial Relations and Department of Sociology, University of Toronto.
- Ren, Zhe (Jerry) and Kuan Xu (2011). “Low-Income Dynamics and Determinants under Different Thresholds: New findings for Canada in 2000 and Beyond.” Income Research Paper Series, Statistics Canada, Catalogue no. 75F0002M — No. 003.
- Sarlo, Christopher (1996). Poverty in Canada. Second Edition. The Fraser Institute, Vancouver, British Columbia, Canada.
- Sawhill, Isabel V. (1988). “Poverty in the U.S.: Why Is It So Persistent?” Journal of Economic Literature, Vol. 26, no. 3, pp. 1073-1119.
- Schaafsma, Joseph, and Arthur Sweetman (2001). “Immigrant Earnings: Age at Immigration Matters.” Canadian Journal of Economics, November 2001, v. 34, issue 4, pp. 1066-99.
- Schwartz, Bryan (2012). “Admitted but Excluded: Removing Occupational Barriers to Entry for Immigrants to Canada.” Frontier Centre for Public Policy, Policy Series No. 138.
- Skuterud, Mikal (2011). The Return to Language Skills in the New Economy and the Deteriorating Labour Market Performance of Canada’s Immigrant Workers. A report prepared for HRSDC, September 2011.
- Smith, Ekuwa and Andrew Jackson (2002). “Does a Rising Tide Lift All Boats? The Labour Market Experiences and Incomes of Recent Immigrants 1995-98.” Canadian Council on Social Development, Ottawa.
- Spigelman, Martin Research Associates (1998). Unfulfilled Expectations, Missed Opportunities: Poverty among Immigrants and Refugees in British Columbia. Vancouver: Working Group on Poverty, Ministry Responsible for Multiculturalism and Immigration.
- Statistics Canada (2012a). “Income in Canada 2010.” Statistics Canada, Catalogue no. 75-202-X.
- Statistics Canada (2012b). “Low-income Lines, 2010 to 2011.” Income Research Paper Series, Statistics Canada Catalogue no. 75F0002M — No. 002.
- Statistics Canada (2011). “Low-Income Lines, 2009-2010.” Income Research Paper Series, Statistics Canada, Catalogue no. 75F0002M — No. 002.
- Statistics Canada (2008). “Earnings and Incomes of Canadians over the Past Quarter Century, 2006 Census.” Census year 2006, Catalogue no. 97-563-X.
- Statistics Canada (2007). Families Reference Guide, 2006 Census. Statistics Canada, Catalogue no.: 97-553-GWE2006003.
- Statistics Canada (2006). “Women in Canada, 2005.” Fifth Edition, Statistics Canada, Catalogue no. 89-503-XIE, pp. 211-220 (Chapter 9 Immigrant Women ).
- Sweetman, Arthur (2004). “Immigrant Source Country Educational Quality and Canadian Labour Market Outcomes.” Analytical Studies Branch Research Paper Series, Statistics Canada, Catalogue No. 11F0019MIE2004234 – no. 234.
- Thompson, Eden (2004). “Immigrant Labour Market Integration and Absorptive Capacity.” Presentation for the Ninth International Metropolis Conference, Geneva, Switzerland, September 27 – October 1, 2004.
- Thompson, Eden, and Christopher Worswick (2005). “Canadian Research on Immigration and the Labour Market: An Overview,” report prepared for Human Resources and Skills Development Canada.
- United Nations (1995). The Copenhagen Declaration and Programme of Action: World Summit for Social Development. March 6-12 1995, United Nations Department of Publications, New York.
- Wanner, Richard A. (1998). “Prejudice, Profit, or Productivity: Explaining Returns to Human Capital among Male Immigrants to Canada.” Canadian Ethnic Studies, Vol. 30 Issue 3, p24.
- Xue, Li and Li Xu (2010). “Employment Outcomes of Postsecondary Educated Immigrants, 2006 Census.” Citizenship and Immigration Canada, Research and Evaluation Branch, Research Paper.
- Zhang Xuelin, Brian Murphy, and Sylvie Michaud (2011). “The Various Measures of Low-income in Canada: Strengths, Weaknesses, Impacts.” Presentation made at the International Conference on Social Statistics, Poverty and Social Exclusion: Perspectives from Quebec, Canada, and Abroad, Montreal, Quebec, November 30, 2011.
- Zhang, Xuelin (2010). “Low Income Measurement in Canada: What Do Different Lines and Indexes Tell Us?” Income Research Series Paper, Statistics Canada, Catalogue No. 75F0002M — No. 3.
- Zhang, Xuelin (2003). “The Wealth Position of Immigrant Families in Canada.” Analytical Studies Branch Research Paper Series, Statistics Canada, Catalogue No. 11F0019MIE - no. 197.