
Pacific Economic Development Canada’s Quarterly Financial Report for the quarter ended June 30, 2024
View the print-friendly version (PDF, 346 kB)
Statement outlining results, risks and significant changes in operations, personnel and programs
Introduction
This quarterly financial report should be read in conjunction with Main Estimates. It has been prepared by management as required by section 65.1 of the Financial Administration Act (FAA) and in the form and manner prescribed by the Treasury Board. This quarterly report has not been subject to an external audit or review.
Authority, mandate and program activities
PacifiCan is the regional development agency focused on British Columbia’s evolving economy. PacifiCan leads in building a strong, competitive Canadian economy by supporting business, innovation and community economic development unique to British Columbia. PacifiCan operates under the provision of the Western Economic Diversification Act.
PacifiCan is mandated to “support the growth and diversification of British Columbia’s economy and advance the interests of the region in national economic policy, programs and projects.”
The Departmental Plan and Main Estimates provide further information on PacifiCan's authority, mandate and program activities.
Basis of presentation
This quarterly report has been prepared by management using an expenditure basis of accounting. The accompanying Statement of Authorities includes the department's spending authorities granted by Parliament and those used by the department, consistent with the Main Estimates for the 2024-2025 fiscal year. This quarterly report has been prepared using a special purpose financial reporting framework designed to meet financial information needs with respect to the use of spending authorities.
The authority of Parliament is required before money can be spent by the Government. Approvals are given in the form of annually approved limits through appropriation acts, or through legislation in the form of statutory spending authority for specific purposes.
The Agency uses the full accrual method of accounting to prepare and present its annual departmental financial statements that are part of the results reporting process. However, the spending authorities voted by Parliament remain on an expenditure basis.
Financial structure
PacifiCan manages its expenditures under two votes:
- Vote 1 – Net operating expenditures include salary, and other operating costs (e.g., transportation and communications; professional and special services).
- Vote 5 – Grants and contributions include all transfer payments.
Budgetary statutory authorities represent payments made under legislation approved by Parliament and include items such as the Government of Canada's share of employee benefit plans (EBP).
Highlights of fiscal quarter and fiscal year-to-date (YTD) results
The following section highlights significant changes to fiscal quarter results as of June 30, 2024.
Statement of authorities: Vote 1 – Net operating expenditures
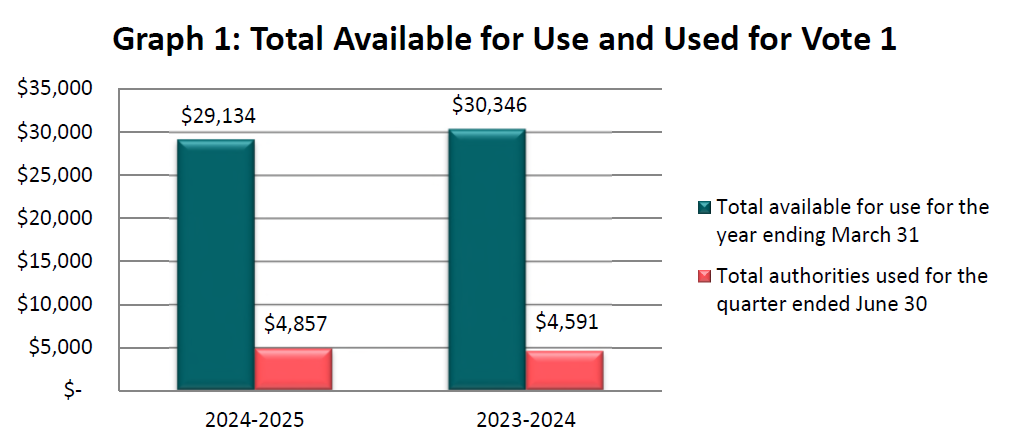
Total authorities available for use for fiscal year 2024-2025 are $29.1 million, a net decrease of $1.2 million compared to the $30.3 million for 2023-2024. The net decrease is explained by:
- $0.8 million increase in funding for Federal Tourism Growth Strategy
- $2.0 million net decrease in funding for the sun-setting of the time-limited programs announced in Budget 2021
Total authorities used year-to-date has increased to $4.9 million for the quarter ended June 30, 2024 compared to $4.6 million at June 30, 2023. The increase of $0.3 million is mainly caused by increase in various operating and maintenance costs.
Graph 1 illustrates total authorities available for use for the fiscal year, and authorities used at quarter-end.
(in thousands of dollars)
Text version: Total available for use and used for Vote 1 (in thousands of dollars)
This bar graph breaks down total authorities available for use for fiscal year 2024-2025 and compares the authorities used at quarter end.
2024-2025
- $29,134 represents total available for use for the year ending March 31
- $4,857 represents total authorities used for the quarter ending June 30
2023-2024
- $30,346 represents total available for use for the year ending March 31
- $4,591 represents total authorities used for the quarter ending June 30
Statement of authorities: Vote 5 – Grants and contributions
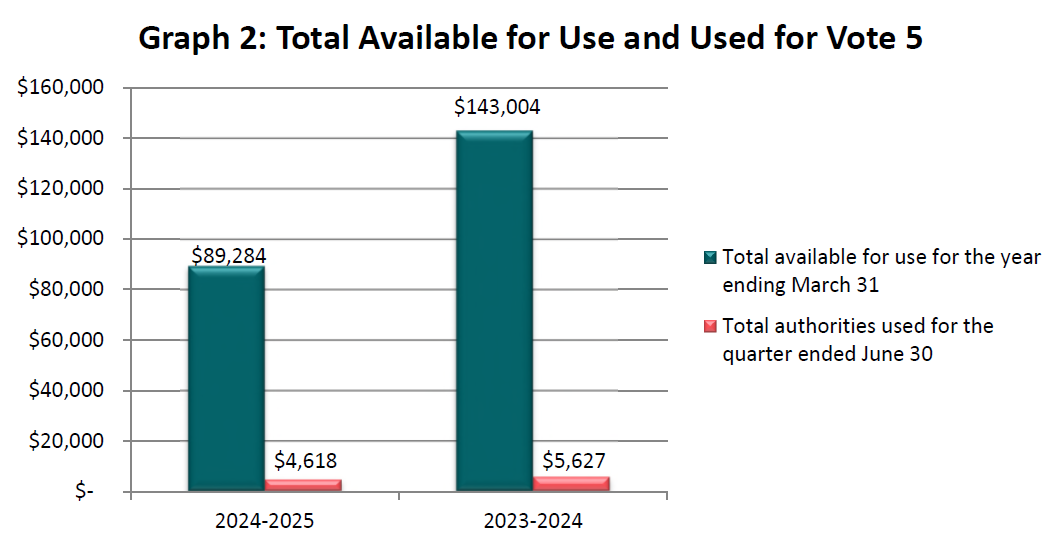
Total authorities available for use for fiscal year 2024-2025 are $89.3 million, a net decrease of $53.7 million compared to the $143.0 million for 2023-2024. The net decrease is mainly due to:
- $4.7 million increase in funding for Federal Tourism Growth Strategy
- $0.1 million increase in reprofile funding for the Regional Quantum Initiative
- $53.1 million net decrease in funding for the sun-setting of the time-limited programs announced in Budget 2021
- $5.4 million decrease in funding for the Lytton Home and Business Rebuild Programs
Total authorities used year-to-date for the quarter ended June 30, 2024 decrease to $4.6 million, compared to $5.6 million at June 30, 2023. The $1.0 million decrease is mainly explained by:
- $1.0 million increase in payments made under the Western Diversification Program (WDP)
- $1.2 million decrease in payments made under the Regional Economic Growth through Innovation program
- $0.8 million decrease for payment timing differences made to support network partners
Graph 2 illustrates total authorities available for use for the fiscal year, and authorities used at quarter-end.
(in thousands of dollars)
Text version: Total available for use and used for Vote 5 (in thousands of dollars)
This bar graph breaks down total authorities available for use for fiscal year 2024-25 and compares the authorities used at quarter end.
2024-2025
- $89,284 represents total available for use for the year ending March 31
- $4,618 represents total authorities used for the quarter ending June 30
2023-2024
- $143,004 represents total available for use for the year ending March 31
- $5,627 represents total authorities used for the quarter ending June 30
Statement of authorities: Budgetary statutory authorities
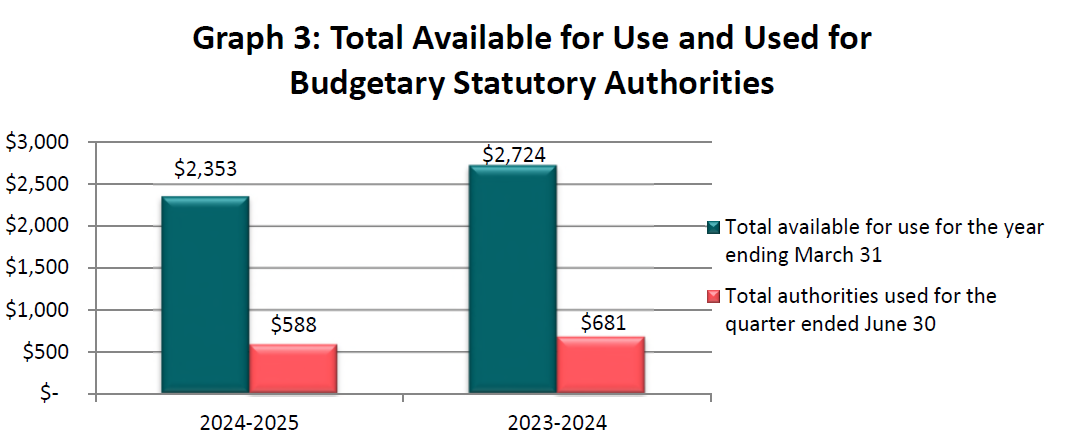
Budgetary statutory authorities for use in fiscal year 2024-2025 are $2.4 million, a decrease of $0.3 million when compared to the $2.7 million in 2023-2024. The variance is due to minor net adjustments in funding.
There are no significant variances in budgetary statutory authorities in this reporting period when compared to fiscal year 2023-2024.
Graph 3 illustrates total authorities available for use for the fiscal year, and authorities used at quarter-end.
(in thousands of dollars)
Text version: Total available for use and used for budgetary statutory authorities (in thousands of dollars)
This bar graph breaks down total authorities available for use for fiscal year 2024-25 and compares the authorities used at quarter end.
2024-2025- $2,353 represents total available for use for the year ending March 31
- $588 represents total authorities used for the quarter ending June 30
2023-2024
- $2,724 represents total available for use for the year ending March 31
- $681 represents total authorities used for the quarter ending June 30
Statement of the departmental budgetary expenditures by standard object
Expenditures by standard object for the quarter ended June 30, 2024 decreased to $10.1 million, compared to $10.9 million at June 30, 2023. The $0.8 million decrease is mainly explained by:
- $1.0 million increase in payments made under the Western Diversification Program (WDP) to invest in a diverse and growing economy
- $0.5 million increase in salary and other personal expenses to deliver transfer payment programming and to build agency capacity
- $1.2 million decrease in Regional Economic Growth through Innovation program
- $0.8 million decrease in payment made to support the network partners
- $0.3 million decrease in operations and maintenance cost
Additional information can be found in the Statement of Authorities, Vote 1 and Vote 5 sections above.
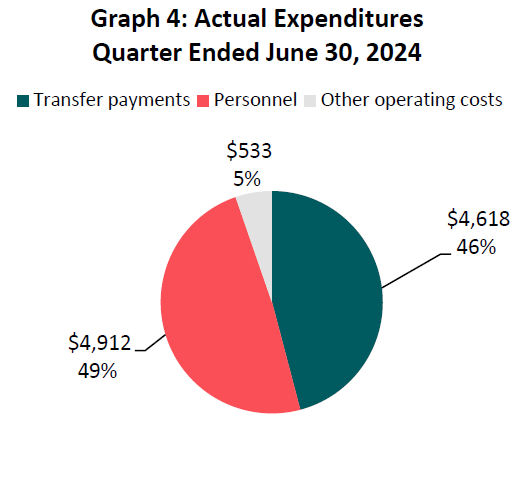
Graph 4 and 5 illustrate the actual baseline expenditures for the quarter-end.
(in thousands of dollars)
Text version: Actual expenditures quarter ended June 30, 2024 (in thousands of dollars)
This pie chart breaks down actual expenditures for quarter ended June 30, 2024.
- $4,618 represents actual spending on Transfer Payments, which accounts for 46% of Actual Expenditures quarter ended June 30, 2024
- $4,912 represents actual spending on Personnel, which accounts for 49% of Actual Expenditures quarter ended June 30, 2024
- $533 represents actual spending on Other operating costs, which accounts for 5% of Actual Expenditures quarter ended June 30, 2024
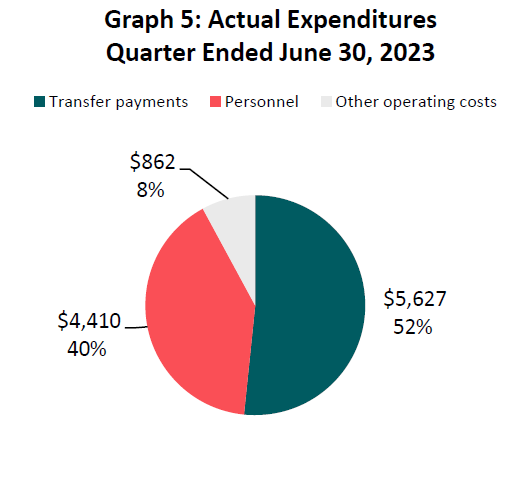
Text version: Actual expenditures quarter ended June 30, 2023 (in thousands of dollars)
This pie chart breaks down actual expenditures for quarter ended June 30, 2023.
- $5,627 represents actual spending on Transfer Payments, which accounts for 52% of Actual Expenditures quarter ended June 30, 2023
- $4,410 represents actual spending on Personnel, which accounts for 40% of Actual Expenditures quarter ended June 30, 2023
- $862 represents actual spending on Other operating costs, which accounts for 8% of Actual Expenditures quarter ended June 30, 2023
Risks and uncertainties
The agency is managing the allocation of resources within a well-defined framework of accountabilities, policies and procedures including a system of budgets, reporting and other internal controls to manage within available resources and authorities from Treasury Board.
British Columbians continue to face economic challenges such as rising costs of living and doing business, higher interest rates, and supply chain disruptions. These and other such risks continue to pose difficulties for businesses, innovators, and communities in British Columbia. We are also winding down our temporary economic relief and recovery programs while simultaneously reducing our workforce. To mitigate risks, PacifiCan remains agile and responsive to its clients’ needs by effectively delivering on its mandates, pivoting available resources, and ensuring timely implementation of budget initiatives.
Significant changes in relation to operations, personnel and programs
There are no significant changes in relation to operations and personnel for this reporting period.
Approval by senior officials
Approved by:
Original signed by:
________________________
Naina Sloan
Acting President
Vancouver, Canada
Date:
Original signed by:
________________________
Tom Switzer
Acting Chief Financial Officer
Statement of authorities (unaudited)
| Authorities | Total available for use for the year ending March 31, 2025* | Used during the quarter ended June 30, 2024 | Year-to-date used at quarter-end |
|---|---|---|---|
| Vote 1 - Net operating expenditures | $29,134 | $4,857 | $4,857 |
| Vote 5 - Grants and contributions | $89,284 | $4,618 | $4,618 |
| Budgetary statutory authorities - Employee Benefits Plans | $2,353 | $588 | $588 |
| Total authorities | $120,771 | $10,063 | $10,063 |
* Includes only authorities available for use and granted by Parliament at quarter-end.
| Authorities | Total available for use for the year ending March 31, 2024* | Used during the quarter ended June 30, 2023 | Year-to-date used at quarter-end |
|---|---|---|---|
| Vote 1 - Net operating expenditures | $30,346 | $4,591 | $4,591 |
| Vote 5 - Grants and contributions | $143,004 | $5,627 | $5,627 |
| Budgetary statutory authorities - Employee Benefit Plans | $2,724 | $681 | $681 |
| Total authorities | $176,074 | $10,899 | $10,899 |
* Includes only authorities available for use and granted by Parliament at quarter-end.
Departmental budgetary expenditures by standard object (unaudited)
| Expenditures | Total available for use for the year ending March 31, 2025* | Expended during the quarter ended June 30, 2024 | Year-to-date used at quarter-end |
|---|---|---|---|
| Personnel | $19,402 | $4,912 | $4,912 |
| Transportation and communications | $1,208 | $219 | $219 |
| Information | $1,088 | $2 | $2 |
| Professional and special services | $8,339 | $267 | $267 |
| Rentals | $725 | $24 | $24 |
| Repair and maintenance | $0 | $0 | $0 |
| Utilities, materials and supplies | $121 | $1 | $1 |
| Acquisition of machinery and equipment | $604 | $18 | $18 |
| Transfer payments | $89,284 | $4,618 | $4,618 |
| Other subsidies and payments | $0 | $2 | $2 |
| Total net budgetary expenditures | $120,771 | $10,063 | $10,063 |
*Includes only authorities available for use and granted by Parliament at quarter-end.
| Expenditures | Total available for use for the year ending March 31, 2024* | Expended during the quarter ended June 30, 2023 | Year-to-date used at quarter-end |
|---|---|---|---|
| Personnel | $20,646 | $4,410 | $4,410 |
| Transportation and communications | $870 | $209 | $209 |
| Information | $745 | $4 | $4 |
| Professional and special services | $9,194 | $361 | $361 |
| Rentals | $1,118 | $281 | $281 |
| Repair and maintenance | $124 | $0 | $0 |
| Utilities, materials and supplies | $124 | $3 | $3 |
| Acquisition of machinery and equipment | $249 | $1 | $1 |
| Transfer payments | $143,004 | $5,627 | $5,627 |
| Other subsidies and payments | $0 | $3 | $3 |
| Total net budgetary expenditures | $176,074 | $10,899 | $10,899 |
* Includes only authorities available for use and granted by Parliament at quarter-end.