
Alignment Among Public Formularies in Canada, Part 3: Medicines Assessed by the Common Drug Review
Table of Contents
- Executive Summary
- Introduction
- Methodology
- Limitations
- 1. Overview of coverage of CDR-reviewed medicines in Canadian public drug programs
- 2. Coverage of selected CDR-reviewed medicines by market segment
- References
- Appendix A: Listing and agreement rates for CDR-reviewed medicines with positive recommendations
- Appendix B: Medicines included in the study
Acknowledgements
This report was prepared by the Patented Medicine Prices Review Board (PMPRB) as part of the National Prescription Drug Utilization Information System (NPDUIS).
The PMPRB wishes to acknowledge the members of the NPDUIS Advisory Committee for their expert oversight and guidance in the preparation of this report. Please note that the statements and findings for this report do not necessarily reflect those of the members or their organizations.
Appreciation goes to Nevzeta Bosnic for leading this project, and to Jeffrey Menzies, Caroline Peterson, Elena Lungu, and Tanya Potashnik for their oversight in the development of the report. The PMPRB also wishes to acknowledge the contributions of Brian O’Shea, the analytical staff Jun Yu, and editorial staff Sarah Parker, Shirin Paynter, and Laura Fortune.
Disclaimer
NPDUIS operates independently of the regulatory activities of the Board of the PMPRB. The research priorities, data, statements, and opinions expressed or reflected in NPDUIS reports do not represent the position of the PMPRB with respect to any regulatory matter. NPDUIS reports do not contain information that is confidential or privileged under sections 87 and 88 of the Patent Act, and the mention of a medicine in a NPDUIS report is not and should not be understood as an admission or denial that the medicine is subject to filings under sections 80, 81, or 82 of the Patent Act or that its price is or is not excessive under section 85 of the Patent Act.
Although based in part on data obtained from the NPDUIS Database of the Canadian Institute for Health Information (CIHI) and under license from the Canadian Drugstore and Hospital Purchases Audit and Private Pay Direct Drug Plan databases proprietary to IQVIA Solutions Canada Inc. and/or its affiliates (“IQVIA”), the statements, findings, conclusions, views and opinions expressed in this report are exclusively those of the PMPRB and are not attributable to CIHI or IQVIA.
Executive Summary
The issue of universal prescription drug coverage, as a complement to universal healthcare, has been debated in Canada for decades. Most recently, a report from the Advisory Council on the Implementation of National Pharmacare recommended that Canada implement universal pharmacare and develop a national formulary to build the foundation for this initiative.Footnote i To inform the dialogue related to the potential composition of such a formulary, the PMPRB has conducted various analyses into the current status of medicine coverage across public drug programs in Canada.
This is the last report in a three-part PMPRB series that explores current overlaps and gaps in Canadian public drug plan formularies. The first report provided insight into the degree of alignment between the general public drug plan formularies in Canada, using data from 2015. The second report addressed the public coverage of oncology medicines reviewed by the interim Joint Oncology Drug Review (iJODR) or by the Canadian Agency for Drugs and Technologies in Health (CADTH) pan-Canadian Oncology Drug Review (pCODR), as of the end of March 2020.
This third and final report analyzes medicines assessed through CADTH’s Common Drug Review (CDR) process. The analysis focuses on a selection of 307 medicines evaluated by the CDR from December 16, 2003, to June 30, 2019. It reports on the percentage of these medicines listed on each of the selected CDR-participating federal, provincial, and territorial drug plans as of June 30, 2020, as well as the private drug programs as of December 31, 2019. These 307 medicines were selected as they represent a majority of the medicines launched in Canada over the past two decades. In 2019, these medicines accounted for more than $13.0 billion in sales, or 43% of total Canadian pharmaceutical spending.
While the report assesses the general overlap and gaps in formulary listings of CDR-reviewed medicines across selected CADTH participating federal, provincial, and territorial drug plans, it is not intended to assess the appropriateness or relevance of these listings.
Key Findings
Formulary listings for CDR medicines are relatively consistent across most of Canada’s public drug plans.
- Many of the CDR-reviewed medicines selected for this study were listed on most public formularies, with drug plans listing an average of 65% of the selected medicines.
- The average listing rate increased to 88% when weighted by sales, which indicates that the medicines not covered by the plans accounted for only a small share of national spending.
- Of the 307 selected medicines, 207 (67%) were listed in six or more provinces and accounted for 90% of sales.
- Agreement rates for listings across public formularies were substantial, at an average of 81%, and increased to 91% when sales were factored in.
Public formulary listing rates vary only slightly across market segments analyzed.
- The average listing rate for biologic medicines was slightly higher than for their small molecule counterparts, but the average agreement rate across provinces was slightly lower.
- Coverage rates for multi-source medicines, which include generics and biologics with available biosimilars, surpassed those for single-source medicines in almost all public drug programs, while their interprovincial agreement rates were almost identical.
- With the exception of smaller public drug programs, expensive drugs for rare diseases (EDRDs) had notably higher listing rates than other CDR-reviewed medicines. In 2019, British Columbia, Ontario, and Alberta listed 93%, 90%, and 80% of these medicines, respectively.
Introduction
Universal drug coverage has been endorsed by major national commissions in Canada dating back more than 50 years.Footnote 1 In the Final Report of the Advisory Council on the Implementation of National Pharmacare, published in 2019, the council recommended that Canada implement universal, single-payer pharmacare. This would provide the basis for a consistent approach to formulary listing and patient access across the country.Footnote 2
Upon approval of a prescription medicine by Health Canada, Canadian public drug programs and cancer agencies decide if the drug will be eligible for public reimbursement. The CADTH drug reimbursement review plays an important role in their decision-making process.
Through its review process, CADTH conducts evaluations of the clinical, economic, patient, and clinician evidence on drugs, and provide reimbursement recommendations and advice to federal, provincial, and territorial public drug plans and provincial cancer agencies (with the exception of Quebec), as well as Canadian Blood Services. Footnote 3
The Common Drug Review (CDR), one of CADTH’s drug reimbursement review processes, evaluates non-oncology medicines.
The pan-Canadian Advisory Panel on a Framework for a Prescription Drug List is currently in the process of creating a recommended framework for developing a potential pan-Canadian formulary. The recommendations will be completed by the end of spring 2022.
To add to the national discussions around national pharmacare and a national formulary, and as part of its work for the National Prescription Drug Utilization Information System (NPDUIS) research initiative, the PMPRB developed a three-part report series on the coverage of prescription medicines in Canada.
Part 1 in the series compared the general public plan formularies by providing a summary of listing alignment between the provinces in 2015, while Part 2 focused on the coverage of oncology medicines. This report, Part 3 in the series, analyzes the coverage of medicines assessed through CADTH’s Common Drug Review (CDR) process.
The first section of the report provides an overview of CDR-reviewed medicines on the public formularies, including listing rates, which compare the percentage of the selected medicines listed in each provincial drug plan as well as their corresponding share of sales; the number of provincial formulary listings for selected medicines; and the rates of agreement between provincial drug programs. The second section analyzes formulary coverage and agreement based on specific market segments—biologic versus small molecule medicines and single- versus multi-source medicines—as well as the coverage for expensive drugs for rare diseases (EDRDs).
Methodology
The analysis focuses on a selection of 307 medicines evaluated by CADTH’s Common Drug Review (CDR) from December 16, 2003, to June 30, 2019. It reports on the percentage of these medicines listed by each of the selected CADTH-participating drug plans as of June 30, 2020, as well as the private drug programs as of December 31, 2019. This list of medicines includes both those for which CADTH issued a positive reimbursement recommendation (78%) and those that received a negative recommendation (22%).Footnote ii These 307 medicines accounted for more than $13.0 billion in sales in 2019, representing 43% of total pharmaceutical spending in Canada.Footnote iii For the purposes of this analysis, a medicine includes all strengths and formulations of the given medicinal ingredient.
A formulary is defined as a list of medicines covered as benefits for eligible beneficiaries, as determined by the individual drug plan. “Public drug plans” encompasses all publicly funded drug programs, including general drug benefit formularies as well as specialized drug benefit formularies and other special access drug programs, in each of the CADTH participating provinces—British Columbia, Alberta, Saskatchewan, Manitoba, Ontario, New Brunswick, Nova Scotia, Prince Edward Island, and Newfoundland and Labrador— as well as Yukon and the NIHB. Each jurisdiction has its own unique set of programs, eligibility criteria, and cost-sharing structures. For an overview of the NPDUIS public drug plans, see the Public Drug Plan Designs reference document on the PMPRB website.
Quebec’s public drug plan was excluded from the analysis due to data limitations.
Data sources
All medicines reviewed by the CDR were extracted from CADTH’s website if final recommendations had been issued and posted during the study period. Submissions and re-submissions for the same medicines were carefully reviewed to ensure that the most recent recommendations were considered. Medicines cancelled by Health Canada post market were excluded from the study, as well as older oncology medicines reviewed by the CDR.
Listing statuses for public formularies were extracted from the CIHI NPDUIS Database. Where unavailable, the listing status was confirmed through the review of available formularies or by public drug plan representatives. Listing statuses were obtained at the active medicinal level. A medicine was considered listed if at least one indication assessed by the CDR was designated as a benefit.
The IQVIA Private Drug Plan database was used to obtain a list of medicines reimbursed by private drug plans in 2019.
Provincial and national sales data was extracted from the 2019 IQVIA Canadian Drugstore and Hospital Purchases Audit (CDH), which captures all sales regardless of the payer (public, private, and out-of-pocket).
Analysis
All analyses were conducted at the medicinal ingredient level, irrespective of indication. If a medicine had generic or biosimilar versions available, any version (brand or generic/biosimilar) available on the formulary would qualify the medicine as listed.
The analysis of market segments includes comparisons of biologic and small molecule medicines as well as single- and multi-source medicines, and analyzes expensive drugs for rare diseases (EDRDs) as a subset of CDR-reviewed medicines.
- Biologics were identified as those listed under Schedule D in Health Canada’s Drug Product Database (DPD). All others were considered small molecule medicines.
- Single-source medicines refer to brand-name medicines produced by one manufacturer without generic or biosimilar versions available on the market. Multi-source medicines are produced by two or more manufacturers and include the original brand-name medicines and/or its generic equivalent(s) and biosimilars.
- EDRDs were defined as medicines with an orphan designation from the FDA or EMA and an annual treatment cost greater than $100,000.
Formulary listing rate are reported for each of the drug plans analyzed both in terms of the number of medicines and their corresponding sales, where applicable.
- Listing rates by number of medicines were calculated by dividing the number of medicines listed on the respective formulary by the total number of medicines selected for analysis.
- Weighting listing rates were calculated based on Canadian national retail and hospital sales in 2019, allocating greater weight to medicines with higher shares of the market.
Agreement rates measure alignment in listing decisions between pairs of public drug plans for the 307 selected medicines. In total, 55 jurisdictional combinations were compared in terms of the number of medicines and their corresponding sales. The drug plans were considered to be in agreement if both drug plans had the same listing decision: either to list or not to list a medicine.
For a list of relevant definitions, see the Glossary provided on the NPDUIS Analytical Studies page of the PMPRB website.
Limitations
The purpose of this report is to assess the general overlap and gaps in formulary listings of CDR-reviewed medicines across selected CADTH participating federal, provincial, and territorial drug plans; it is not intended to assess the appropriateness or relevance of these listings.
To provide an equitable point of comparison, this report only analyzes medicines reviewed by the CDR and their listing status on public formularies as of June 30, 2020, or those available in private drug plan data in 2019. This snapshot does not include any medicines that may have subsequently been listed in the formularies or reimbursed by the private drug plans.
A direct comparison of the number of medicines listed may provide an incomplete picture of coverage across jurisdictions, as this number can depend on the therapeutic needs of the eligible population.
Weighted formulary listing rates are based on overall sales reported in the CDH database, which hosts national data that includes all payers. Some medicines, including a few with significant sales, were not available in the data at the time of the analysis, which may impact the weighted results.
1. Overview of coverage of CDR-reviewed medicines in Canadian public drug programs
Formulary listings for CDR medicines are relatively consistent across most of Canada’s public drug plans. Individually, larger public drug plans list a higher proportion of the selected medicines. When national sales for these medicines are factored in, the formulary listing rates are higher in all jurisdictions, suggesting that the medicines not covered by the drug plans account for only a small share of the entire Canadian market. A direct comparison of listing decisions between pairs of jurisdictions confirms relatively high agreement rates, which indicates that there is an important consensus among the public plans regarding listing decisions for CDR-reviewed medicines.
The analysis at the medicinal ingredient level, irrespective of associated indications, found that a large number of the medicines selected for this study were listed on most public formularies as of June 30, 2020. Listing rates ranged from 53% in Prince Edward Island to 79% in Ontario, with an average of 65% across all formularies analyzed. When the medicines were weighted by national sales, the listing rates were much higher and more consistent across jurisdictions, for an average of 88% across all provinces. For example, the medicines listed in Ontario account for 94% of the total national sales (both public and private markets), which indicates that the medicines not listed represented only a small share of the Canadian market. Variations in the share of medicines listed among the public drug plans may result from differences in factors such as plan designs and therapeutic needs of the eligible population.
Of the 307 medicines selected, 98% were reimbursed by at least one private plan in 2019.
When only medicines with positive recommendations from CDR were considered, the average listing rate rose to 77%, with Ontario and New Brunswick listing 90% and 86% of selected medicines, respectively. For the full results for medicines with positive recommendations, refer to Appendix A.
Figure 1.1 reports formulary listing rates by jurisdiction as of June 30, 2020, in terms of the number of medicines listed and their respective sales, along with the percentage of medicines available in private drug plans in 2019.
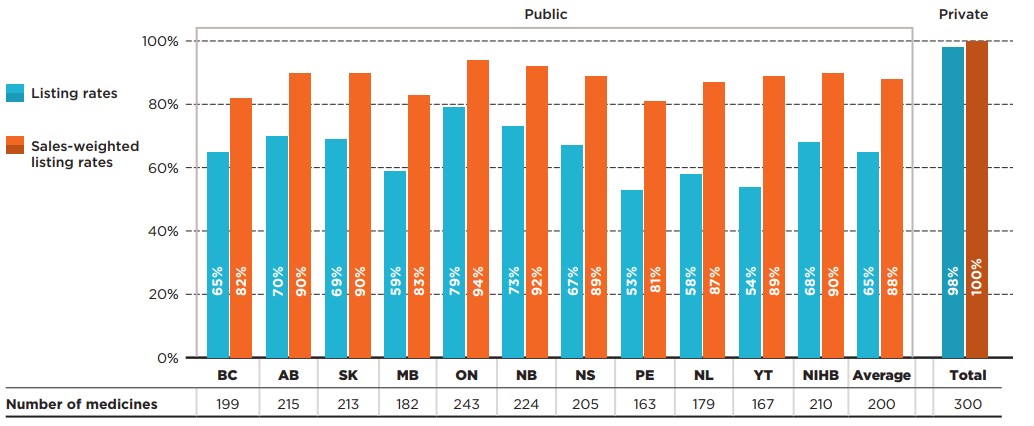
Figure description
This bar graph depicts the percentage of select Common Drug Review (CDR) medicines listed in public drug plans for each of the CDR-participating jurisdictions as well as Canadian private drug plans. Listing rates are given both as a share of the total number of medicines, regardless of indication, and as a sales-weighted share. The number of medicines listed in each jurisdiction is shown in a table below the graph. Public coverage was assessed as of June 30, 2020, and private coverage was assessed as of 2019. Weighted listing rates are based on sales in 2019.
| Number of medicines | Listing rates | Sales-weighted listing rates | |
|---|---|---|---|
British Columbia |
199 |
65% |
82% |
Alberta |
215 |
70% |
90% |
Saskatchewan |
213 |
69% |
90% |
Manitoba |
182 |
59% |
83% |
Ontario |
243 |
79% |
94% |
New Brunswick |
224 |
73% |
92% |
Nova Scotia |
205 |
67% |
89% |
Prince Edward Island |
163 |
53% |
81% |
Newfoundland and Labrador |
179 |
58% |
87% |
Yukon |
167 |
54% |
89% |
Non-Insured Health Benefits |
210 |
68% |
90% |
Average for all public programs |
200† |
65% |
88% |
Private plans |
300 |
98% |
100% |
Note: Listing rates were calculated based on the total number of medicines, regardless of their respective indications.
* Based on 307 medicines assessed by CADTH’s Common Drug Review between December 16, 2003, and June 30, 2019.
† Note that this value was corrected on February 24, 2022.
Data source: Coverage status – CIHI NPDUIS and other publicly available data, June 30, 2020; National and provincial sales - IQVIA Canadian Drugstore and Hospital Purchases Audit (CDH) database, 2019; Private plans - IQVIA Private Drug Plan (PDP) database, 2019.
An analysis of the number of public formulary listings revealed that more than two thirds (67%) of the 307 selected medicines were listed in six or more of the 11 public drug plans studied: 29% were listed in all public formularies, while 38% were listed in six to 10 public formularies (Figure 1.2). Those listed in six or more formularies accounted for 90% of the national sales for all medicines analyzed. A small proportion of the medicines (20%) were listed in fewer than six plans. These medicines accounted for an even lower proportion of total sales, at 6%. Of the medicines analyzed, 12% were not listed on any public formularies, representing 4% of national sales. More than three quarters of the unlisted medicines had received a negative CDR recommendation.
When only medicines with positive recommendations were considered, the share listed in six or more plans increased to 81% of medicines, or 95% of sales.
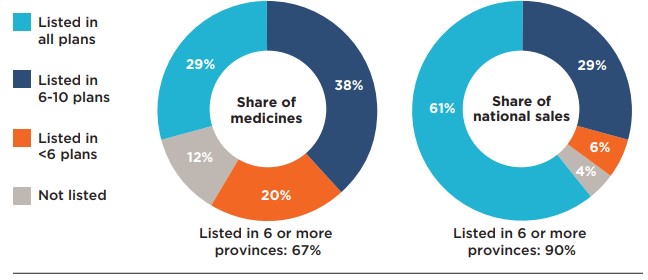
Figure description
This figure is composed of two donut graphs. The left-hand graph gives the percentage of select Common Drug Review medicines that were listed in all public plans; six to ten plans; fewer than six plans; and in none of the public plans as of June 30, 2020. The right-hand graph gives the corresponding share of national sales for these categories of medicines. A total of 67% of the select medicines were listed in six or more public plans and accounted for 90% of sales.
| Share of medicines | Share of national sales | |
|---|---|---|
Listed in all plans |
29% |
61% |
Listed in 6 to 10 plans |
38% |
29% |
Listed in fewer than 6 plans |
20% |
6% |
Not listed |
12% |
4% |
Note: Public drug programs from British Columbia, Alberta, Saskatchewan, Manitoba, Ontario, New Brunswick, Nova Scotia, Prince Edward Island, and Newfoundland and Labrador were included, as well as Yukon and the NIHB.
* Based on 307 medicines assessed by CADTH’s Common Drug Review between December 16, 2003, and June 30, 2019.
Data source: Coverage status – CIHI NPDUIS and other publicly available data, June 30, 2020; National and provincial sales - IQVIA Canadian Drugstore and Hospital Purchases Audit (CDH) database, 2019.
Ontario’s drug benefit program, the largest public drug plan in Canada, listed the greatest number of the selected CDR medicines, at 243. New Brunswick listed 221 (88%) of the same medicines covered in Ontario, as well as three additional medicines. Other public drug plans listed between 67% and 87% of the medicines on the Ontario formulary.
Figure 1.3 illustrates the overlaps and gaps between formulary listings in Ontario and each of the other public drug plans.
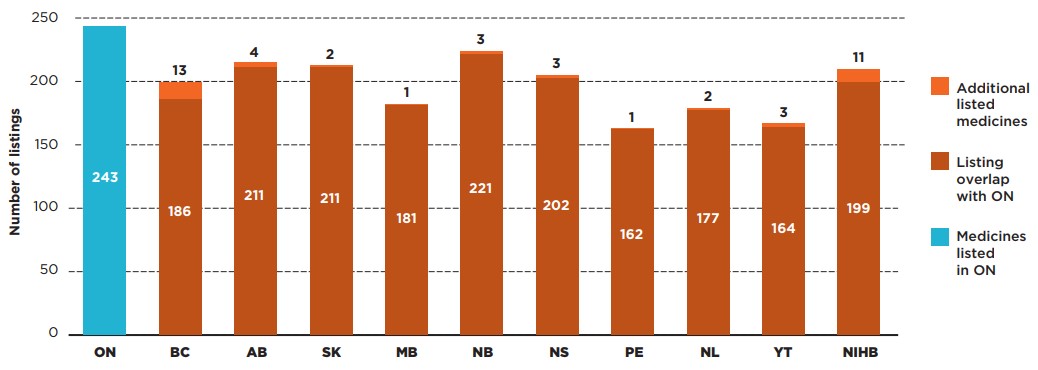
Figure description
This bar graph compares the number of select Common Drug Review (CDR) medicines listed in Ontario with the listings in each public drug plan. The overlap between the plans is shown, as well as the number of additional CDR medicines listed in each jurisdiction.
| Number of listings for medicines listed in Ontario | Number of additional listings | |
|---|---|---|
Ontario |
243 |
N/A |
British Columbia |
186 |
13 |
Alberta |
211 |
4 |
Saskatchewan |
211 |
2 |
Manitoba |
181 |
1 |
New Brunswick |
221 |
3 |
Nova Scotia |
202 |
3 |
Prince Edward Island |
162 |
1 |
Newfoundland and Labrador |
177 |
2 |
Yukon |
164 |
3 |
Non-Insured Health Benefits |
199 |
11 |
* Based on 307 medicines assessed by CADTH’s Common Drug Review between December 16, 2003, and June 30, 2019.
Data source: Coverage status – CIHI NPDUIS and other publicly available data, June 30, 2020; National and provincial sales - IQVIA Canadian Drugstore and Hospital Purchases Audit (CDH) database, 2019.
To provide insight into the extent to which the listing decisions align across public drug plans, agreement rates were measured by comparing the listing decisions for the 307 selected medicines between pairs of plans. In total, 55 bilateral comparisons were made across the 11 public plans, with both yes-yes and no-no formulary listings considered as in agreement.
Table 1.1 provides the range of bilateral agreement rates across plans, both in terms of the number of medicines (unweighted) and their corresponding national sales (sales weighted).
In terms of the number of medicines, the agreement rates ranged from 69% (NIHB and Yukon) to 93% (New Brunswick and Nova Scotia), with an average and median agreement rate of 81% and 80%, respectively. The average and median rates were unchanged when only medicines with positive recommendations were considered. These high levels of alignment are consistent with the harmonized approach to drug review envisioned under CADTH and alignment of government interest at federal and provincial level.
When sales were considered, the average agreement rates increased, ranging from 77% (British Columbia and Prince Edward Island) to 98% (Ontario and New Brunswick), with an average and median rate of agreement of 91% and 92%, respectively. These results further support the finding that the medicines not consistently listed by the public plans account for a relatively small average share of total sales.
Table 1.1. Formulary agreement rates in public drug plans, selected medicines*
| All selected medicines* | Listing rates | Average | Median | Minimum | Maximum | Std. dev. |
|---|---|---|---|---|---|---|
Unweighted |
81% |
80% |
69% |
93% |
6% |
|
Sales weighted |
91% |
92% |
77% |
98% |
5% |
Note: Public drug plans from the following provinces were included: British Columbia, Alberta, Saskatchewan, Manitoba, Ontario, New Brunswick, Nova Scotia, Prince Edward Island, and Newfoundland and Labrador, as well as Yukon and the NIHB.
* Based on 307 medicines assessed by CADTH’s Common Drug Review between December 16, 2003, and June 30, 2019.
Data source: Coverage status – CIHI NPDUIS and other publicly available data, June 30, 2020; National and provincial sales - IQVIA Canadian Drugstore and Hospital Purchases Audit (CDH) database, 2019.
2. Coverage of selected CDR-reviewed medicines by market segment
Public formulary listing rates vary only slightly across market segments analyzed. Biologic CDR-reviewed medicines are listed at a slightly higher rate than their small molecule counterparts, but the average rate of agreement is lower. Listing rates for multi-source medicines surpass those for single-source medicines in almost all public drug programs, while their interprovincial agreement rates are almost identical.
Biologic and small molecule medicines
Biologic medicines represented only 21% of the selected CDR-reviewed medicines but accounted for 48% of their total sales in 2019. Despite their relatively high costs, most provinces had higher listing rates for biologics than for small molecule medicines.
On average, 70% of biologics were publicly covered, with some important variations among the drug plans, while small molecule medicines were listed at an average rate of 64%. The biologics listing rates were above the average in most provinces, with substantially lower rates observed in Prince Edward Island, Newfoundland and Labrador and Yukon. No difference was found for private payers, who reimbursed an average of 98% of both biologics and non-biologics.
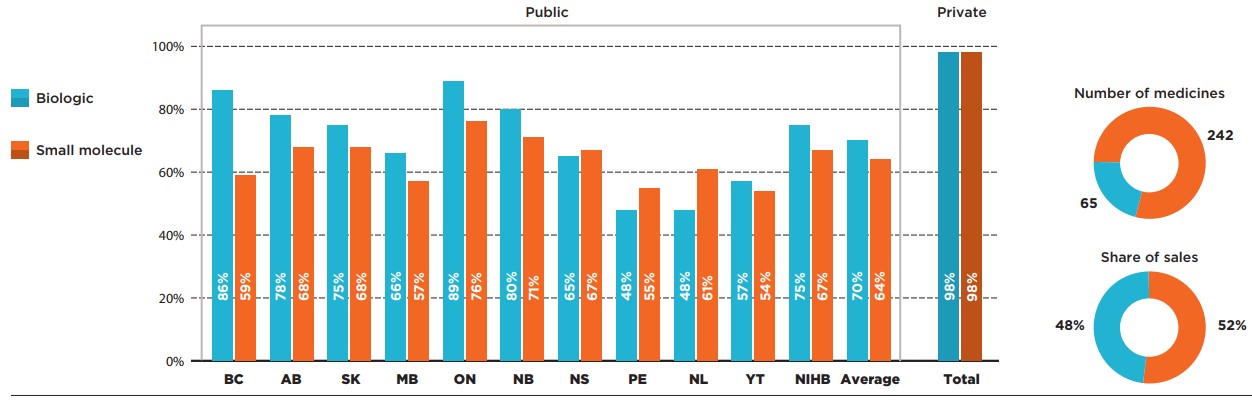
Figure description
This bar graph compares the listing rates for biologic and small molecule medicines in each of the public drug programs. An average is given for all public programs as well as private plans. In total, biologics made up 65 of the 307 medicines and 48% of sales for these medicines while small molecule medicines made up the remaining 242 medicines and 52% of sales.
| Listing rates for biologics | Listing rates for small molecule medicines | |
|---|---|---|
British Columbia |
86% |
59% |
Alberta |
78% |
68% |
Saskatchewan |
75% |
68% |
Manitoba |
66% |
57% |
Ontario |
89% |
76% |
New Brunswick |
80% |
71% |
Nova Scotia |
65% |
67% |
Prince Edward Island |
48% |
55% |
Newfoundland and Labrador |
48% |
61% |
Yukon |
57% |
54% |
Non-Insured Health Benefits |
75% |
67% |
Average for all public programs |
70% |
64% |
Private plans |
98% |
98% |
* Based on 307 medicines assessed by CADTH’s Common Drug Review between December 16, 2003, and June 30, 2019.
Data source: Coverage status – CIHI NPDUIS and other publicly available data, June 30, 2020; National and provincial sales - IQVIA Canadian Drugstore and Hospital Purchases Audit (CDH) database, 2019.
Single-source and multi-source medicines
A substantial majority (242) of the CDR-reviewed medicines selected for the analysis were single-source, brand-only products accounting for almost three quarters of the selected medicine sales. These medicines had slightly lower coverage rates than multi-source medicines in almost all public programs.
The highest listing rate for single-source medicines was observed in Ontario, at 78%, followed by Alberta and New Brunswick, at 70%. The rates in the remaining provinces ranged from 50% to 69%. As a group, single-source medicines had an average listing rate of 64%. An analysis of the multi-source market, which includes 65 generic, biosimilar, and originator products, revealed that these medicines had listing rates in the range of 60% (British Columbia) to 85% (Ontario), resulting in an average of 70%.
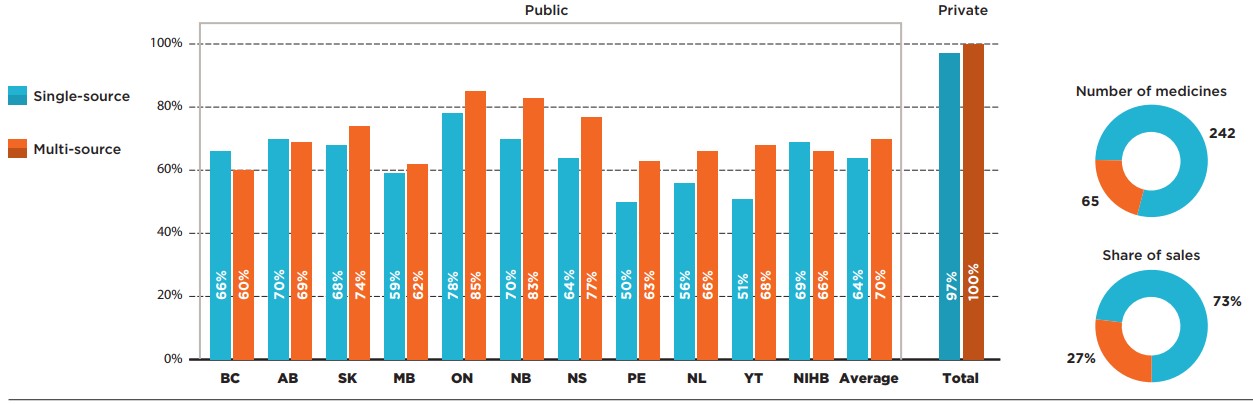
Figure description
This bar graph compares the listing rates for single-source and multi-source medicines in each of the public drug programs. An average is given for all public programs as well as private plans. In total, single-source medicines made up 242 of the 307 medicines and 73% of sales for these medicines while multi-source medicines made up the remaining 65 medicines and 27% of sales.
| Listing rates for single-source medicines | Listing rates for multi-source medicines | |
|---|---|---|
British Columbia |
66% |
60% |
Alberta |
70% |
69% |
Saskatchewan |
68% |
74% |
Manitoba |
59% |
62% |
Ontario |
78% |
85% |
New Brunswick |
70% |
83% |
Nova Scotia |
64% |
77% |
Prince Edward Island |
50% |
63% |
Newfoundland and Labrador |
56% |
66% |
Yukon |
51% |
68% |
Non-Insured Health Benefits |
69% |
66% |
Average for all public programs |
64% |
70% |
Private plans |
97% |
100% |
* Based on 307 medicines assessed by CADTH’s Common Drug Review between December 16, 2003, and June 30, 2019.
Data source: Coverage status – CIHI NPDUIS and other publicly available data, June 30, 2020; National and provincial sales – IQVIA Canadian Drugstore and Hospital Purchases Audit (CDH) database, 2019.
Figure 2.3 provides insight into the interprovincial alignment in listing decisions for each market segment. Overall, the findings suggest that average agreement rates vary slightly between biologics and non-biologics, while agreement rates for single-source and multi-source medicines are comparable.
The average agreement rate for biologics was lower than the average for small molecule medicines, at 75% and 86%, respectively. The range of provincial pair alignments for biologics was also more widely spread, with a maximum alignment of 92% between Alberta and Nova Scotia.
The average agreement rates for single- and multi-source medicines were 81% and 80%, respectively. Nova Scotia aligned with both Alberta and New Brunswick in 92% of listing decisions for single-source medicines, while Ontario and New Brunswick had the highest alignment in listing decisions for multi-source medicines, at 95%.
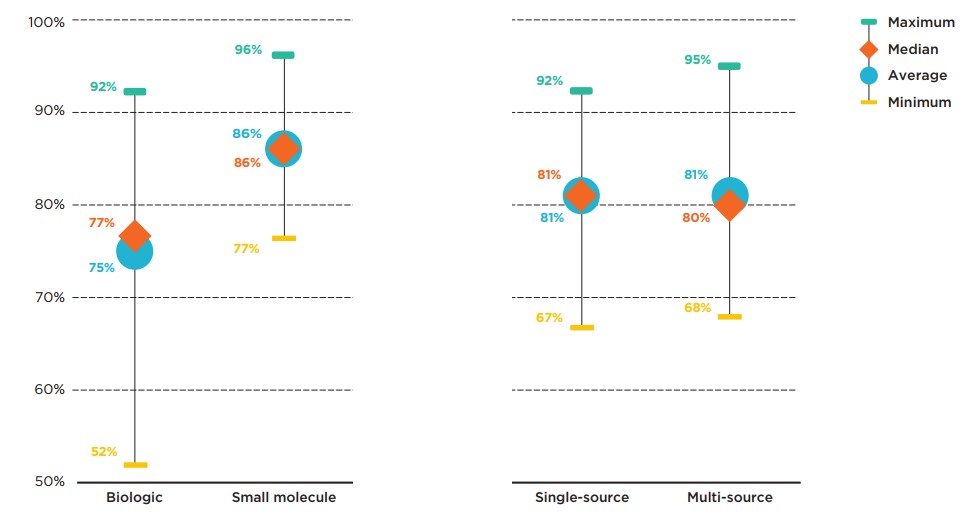
Figure description
This graph gives the range of formulary listing alignment rates for the selected medicines by market segment across all pairs of provincial drug programs. The minimum, maximum, average, and median listing rates are given for each segment analyzed: biologics, small molecule medicines, single-source medicines, and multi-source medicines.
| Market segment | Maximum alignment rate | Average alignment rate | Median alignment rate | Minimum alignment rate |
|---|---|---|---|---|
Biologics |
92% |
75% |
77% |
52% |
Small molecule medicines |
96% |
86% |
86% |
77% |
Single-source medicines |
92% |
81% |
81% |
67% |
Multi-source medicines |
95% |
81% |
80% |
68% |
Note: Public drug programs from British Columbia, Alberta, Saskatchewan, Manitoba, Ontario, New Brunswick, Nova Scotia, Prince Edward Island, and Newfoundland and Labrador were included, as well as Yukon and the NIHB.
* Based on 307 medicines assessed by CADTH’s Common Drug Review between December 16, 2003, and June 30, 2019.
Data source: Coverage status – CIHI NPDUIS and other publicly available data, June 30, 2020; National and provincial sales - IQVIA
Canadian Drugstore and Hospital Purchases Audit (CDH) database, 2019.
Expensive Drugs for Rare Diseases (EDRDs)
In comparison to the full basket of CDR-reviewed medicines, EDRDs had much higher coverage rates in most of the larger public drug plans, including British Columbia (93%), Ontario (90%), and Alberta (80%). Conversely, some of the smallest plans, namely Prince Edward Island, Newfoundland and Labrador, and Yukon, listed only a few of the 30 EDRDs analyzed.
To help Canadians with rare diseases access the drugs they need, the Canadian government has committed to investing up to $1 billion over two years, starting in 2022-23, with up to $500 million per year ongoing. This initiative, introduced in the 2019 federal budget, includes working with willing provinces, territories, and stakeholders to establish a national strategy for drugs for rare diseasesFootnote 5.
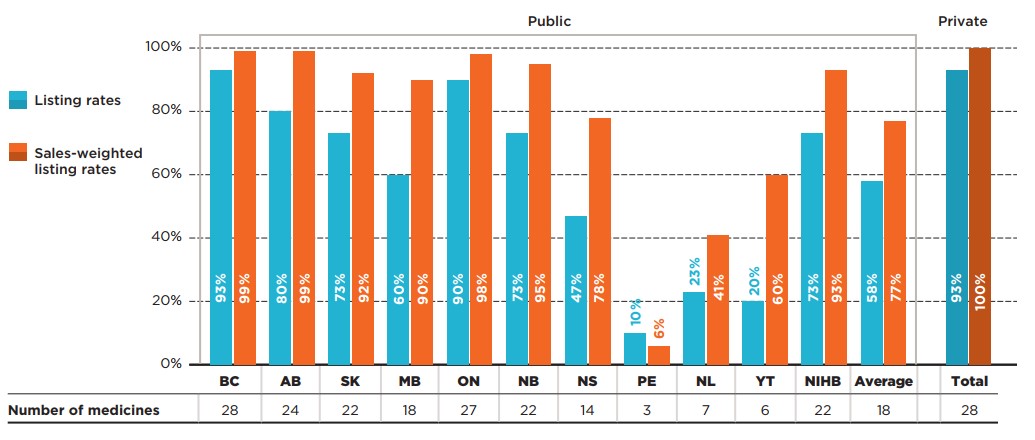
Figure description
This bar graph depicts the percentage of select expensive drugs for rare diseases (EDRDs) listed in public drug plans for each of the CDR-participating jurisdictions as well as Canadian private drug plans. Listing rates are given both as a share of the total number of EDRDs, regardless of indication, and as a sales-weighted share. The number of EDRDs listed in each jurisdiction is shown in a table below the graph. Public coverage was assessed as of June 30, 2020, and private coverage was assessed as of 2019. Weighted listing rates are based on sales in 2019.
| Number of medicines | Listing rates | Sales-weighted listing rates | |
|---|---|---|---|
British Columbia |
28 |
93% |
99% |
Alberta |
24 |
80% |
99% |
Saskatchewan |
22 |
73% |
92% |
Manitoba |
18 |
60% |
90% |
Ontario |
27 |
90% |
98% |
New Brunswick |
22 |
73% |
95% |
Nova Scotia |
14 |
47% |
78% |
Prince Edward Island |
3 |
10% |
6% |
Newfoundland and Labrador |
7 |
23% |
41% |
Yukon |
6 |
20% |
60% |
Non-Insured Health Benefits |
22 |
73% |
93% |
Average for all public programs |
18† |
58% |
77% |
Private plans |
28 |
93% |
100% |
* Based on 30 EDRDs assessed by CADTH’s Common Drug Review between December 16, 2003, and June 30, 2019.
† Note that this value was corrected on February 25, 2022.
Data source: Coverage status – CIHI NPDUIS and other publicly available data, June 30, 2020; National and provincial sales - IQVIA
Canadian Drugstore and Hospital Purchases Audit (CDH) database, 2019.
Appendix A: Listing and agreement rates for CDR-reviewed medicines with positive recommendations
Of the 307 medicines analyzed, 240 (77%) received at least one positive reimbursement recommendation from CADTH’s review process. Listing rates for this group of medicines were higher for all public drug plans, with 81% of the 240 medicines listed in six or more plans. Agreement rates for medicines with positive recommendations were nearly identical to those observed for all medicines.
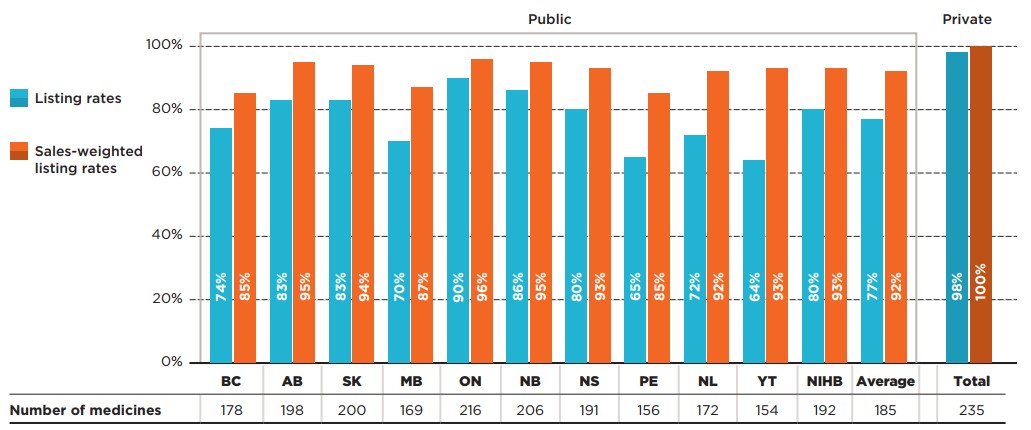
Figure description
This bar graph gives the percentage of Common Drug Review (CDR) medicines with a positive recommendation that are listed in public drug plans in each of the CDR-participating jurisdictions as well as Canadian private drug plans. Listing rates are given both as a share of the total number of medicines, regardless of indication, and as a sales-weighted share. The number of medicines listed in each jurisdiction is shown in a table below the graph. Public coverage was assessed as of June 30, 2020, and private coverage was assessed as of 2019. Weighted listing rates are based on sales in 2019.
| Number of medicines | Listing rates | Sales-weighted listing rates | |
|---|---|---|---|
British Columbia |
178 |
74% |
85% |
Alberta |
198 |
83% |
95% |
Saskatchewan |
200 |
83% |
94% |
Manitoba |
169 |
70% |
87% |
Ontario |
216 |
90% |
96% |
New Brunswick |
206 |
86% |
95% |
Nova Scotia |
191 |
80% |
93% |
Prince Edward Island |
156 |
65% |
85% |
Newfoundland and Labrador |
172 |
72% |
92% |
Yukon |
154 |
64% |
93% |
Non-Insured Health Benefits |
192 |
80% |
93% |
Average for all public programs |
185† |
77% |
92% |
Private plans |
235 |
98% |
100% |
Note: Listing rates were calculated based on the total number of medicines, regardless of their respective indications.
* Based on 240 medicines with positive recommendations by CADTH’s Common Drug Review, assessed between December 16, 2003, and June 30, 2019. Negative recommendations include “Do not reimburse” and “Do not list”; all other recommendations for listing are considered positive recommendations.
† Note that this value was corrected on February 24, 2022.
Data source: Coverage status – CIHI NPDUIS and other publicly available data, June 30, 2020; National and provincial sales - IQVIA Canadian Drugstore and Hospital Purchases Audit (CDH) database, 2019; Private plans - IQVIA Private Drug Plan (PDP) database, 2019.
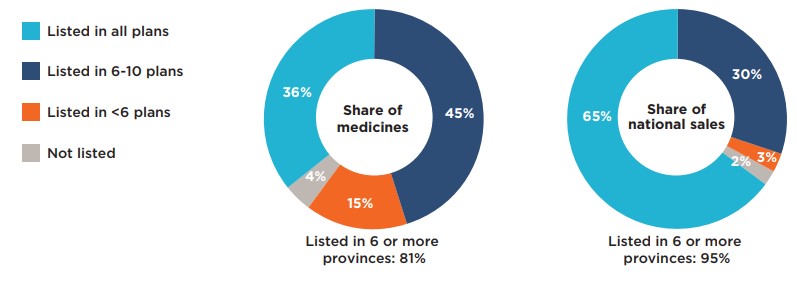
Figure description
This figure is composed of two donut graphs. The left-hand graph gives the percentage of Common Drug Review medicines with a positive recommendation that were listed in all public plans; six to ten plans; fewer than six plans; and in none of the public plans as of June 30, 2020. The right-hand graph gives the corresponding share of national sales for this category of medicines. A total of 81% of the selected medicines were listed in six or more public plans and accounted for 95% of sales.
| Share of medicines | Share of national sales | |
|---|---|---|
Listed in all plans |
36% |
65% |
Listed in 6 to 10 plans |
45% |
30% |
Listed in fewer than 6 plans |
15% |
3% |
Not listed |
4% |
2% |
Note: Public drug programs from British Columbia, Alberta, Saskatchewan, Manitoba, Ontario, New Brunswick, Nova Scotia, Prince Edward Island, and Newfoundland and Labrador were included, as well as Yukon and the NIHB.
* Based on 240 medicines with positive recommendations by CADTH’s Common Drug Review, assessed between December 16, 2003, and June 30, 2019. Negative recommendations include “Do not reimburse” and “Do not list”; all other recommendations for listing are considered positive recommendations.
Data source: Coverage status – CIHI NPDUIS and other publicly available data, June 30, 2020; National and provincial sales - IQVIA Canadian Drugstore and Hospital Purchases Audit (CDH) database, 2019.
Table A1 Formulary agreement rates in public drug plans, medicines with positive recommendations*
| All selected medicines* | Listing rates | Average | Median | Minimum | Maximum | Std. dev. |
|---|---|---|---|---|---|---|
Unweighted |
81% |
80% |
66% |
94% |
7% |
|
Sales weighted |
92% |
92% |
78% |
99% |
5% |
Note: Public drug plans from the following provinces were included: British Columbia, Alberta, Saskatchewan, Manitoba, Ontario, New Brunswick, Nova Scotia, Prince Edward Island, and Newfoundland and Labrador, as well as Yukon and the NIHB.
* Based on 240 medicines with positive recommendation by CADTH’s Common Drug Review, assessed between December 16, 2003, and June 30, 2019. Negative recommendations include “Do not reimburse” and “Do not list”; all other recommendations for listing are considered positive recommendations.
Data source: Coverage status – CIHI NPDUIS and other publicly available data, June 30, 2020; National and provincial sales - IQVIA Canadian Drugstore and Hospital Purchases Audit (CDH) database, 2019.
Appendix B: Medicines included in the study
The following medicines were included in the analysis for this report. All analyses were conducted at the medicinal ingredient level, irrespective of indication. If a medicine had generic or biosimilar versions available, any version (brand or generic/biosimilar) available on the formulary would qualify the medicine as listed.
| Medicinal ingredient(s) | Originator trade name | Medicinal ingredient(s) | Originator trade name |
|---|---|---|---|
Abacavir/lamivudine |
Kivexa |
Infliximab |
Remicade |
Abatacept |
Orencia |
Insulin aspart / insulin aspart protamine |
Novomix 30 |
Abobotulinumtoxina |
Dysport Therapeutic |
Insulin degludec |
Tresiba |
Acamprosate calcium |
Campral |
Insulin detemir |
Levemir |
Aclidinium bromide |
Tudorza Genuair |
Insulin glargine |
Lantus |
Aclidinium bromide / formoterol fumarate dihydrate |
Duaklir Genuair |
Insulin glulisine |
Apidra |
Adalimumab |
Humira |
Interferon beta-1a |
Rebif |
Adefovir dipivoxil |
Hepsera |
Isavuconazole |
Cresemba |
Aflibercept |
Eylea |
Ivabradine |
Lancora |
Agalsidase alfa |
Replagal |
Ivacaftor |
Kalydeco |
Agalsidase beta |
Fabrazyme |
Ivermectin |
Rosiver |
Alemtuzumab |
Lemtrada |
Ixekizumab |
Taltz |
Alendronate sodium / cholecalciferol |
Fosavance |
Lacosamide |
Vimpat |
Alglucosidase |
Myozyme |
Lanreotide acetate |
Somatuline Autogel |
Alirocumab |
Praluent |
Lanthanum carbonate hydrate |
Fosrenol |
Aliskiren |
Rasilez |
Laronidase |
Aldurazyme |
Alitretinoin |
Toctino |
Latanoprost |
Monoprost |
Almotriptan |
Axert |
Latanoprostene bunod |
Vyzulta |
Alogliptin |
Nesina |
Ledipasvir/sofosbuvir |
Harvoni |
Alogliptin/metformin |
Kazano |
Letermovir |
Prevymis |
Ambrisentan |
Volibris |
Levodopa/carbidopa |
Duodopa |
Amlodipine besylate / atorvastatin calcium |
Caduet |
Levofloxacin |
Quinsair |
Apixaban |
Eliquis |
Linaclotide |
Constella |
Apomorphine hydrochloride |
Movapo |
Linagliptin |
Trajenta |
Apremilast |
Otezla |
Linagliptin/metformin |
Jentadueto |
Aprepitant |
Emend |
Liraglutide |
Victoza |
Aripiprazole |
Abilify |
Lisdexamfetamine dimesylate |
Vyvanse |
Asenapine |
Saphris |
Lixisenatide |
Adlyxine |
Asfotase alfa |
Strensiq |
Lixisenatide / insulin glargine |
Soliqua |
Atazanavir |
Reyataz |
Lomitapide |
Juxtapid |
Atomoxetine hydrochloride |
Strattera |
Loteprednol etabonate |
Lotemax |
Azelaic acid |
Finacea |
Lumacaftor/ivacaftor |
Orkambi |
Azelastine HCl / fluticasone propionate |
Dymista |
Lurasidone |
Latuda |
Azilsartan medoxomil |
Edarbi |
Macitentan |
Opsumit |
Azilsartan medoxomil / chlorthalidone |
Edarbyclor |
Maraviroc |
Celsentri |
Aztreonam for inhalation solution |
Cayston |
Memantine hydrochloride |
Ebixa |
Belimumab |
Benlysta |
Mepolizumab |
Nucala |
Benralizumab |
Fasenra |
Methylnaltrexone bromide |
Relistor |
Bictegravir / emtricitabine / tenofovir alafenamide |
Biktarvy |
Mifepristone/misoprostol |
Mifegymiso |
Brexpiprazole |
Rexulti |
Migalastat |
Galafold |
Brimonidine tartrate / timolol maleate |
Combigan Ophthalmic Solution |
Miglustat |
Zavesca |
Brinzolamide/brimonidine |
Simbrinza |
Mirabegron |
Myrbetriq |
Brinzolamide / timolol maleate suspension |
Azarga |
Mixed amphetamine salts |
Adderall XR |
Brivaracetam |
Brivlera |
Mometasone furoate |
Asmanex |
Brodalumab |
Siliq |
Mometasone/formoterol |
Zenhale |
Budesonide |
Cortiment |
Mycophenolate sodium |
Myfortic |
Buprenorphine |
Sublocade |
Natalizumab |
Tysabri |
Buprenorphine hydrochloride |
Probuphine |
Nebivolol |
Bystolic |
Buprenorphine transdermal patch |
Butrans |
Netupitant/palonosetron |
Akynzeo |
Buprenorphine/naloxone |
Suboxone |
Nintedanib |
Ofev |
Calcitriol |
Silkis |
Nitisinone |
Nitisinone |
Canagliflozin |
Invokana |
Norgelestromin / ethinyl estradiol |
Evra |
Canagliflozin / metformin hydrochloride |
Invokamet |
Nusinersen |
Spinraza |
Canakinumab |
Ilaris |
Obeticholic acid |
Ocaliva |
Carbidopa/levodopa/entacapone |
Stalevo |
Ocrelizumab |
Ocrevus |
Cerliponase alfa |
Brineura |
Ocriplasmin |
Jetrea |
Certolizumab pegol |
Cimzia |
Olmesartan medoxomil |
Olmetec |
Ciclesonide |
Alvesco |
Olmesartan medoxomil / hydrochlorothiazide |
Olmetec Plus |
Ciclesonide nasal spray |
Omnaris |
Omalizumab |
Xolair |
Cinacalcet hydrochloride |
Sensipar |
Onabotulinumtoxina |
Botox |
Ciprofloxacin hydrochloride / dexamethasone otic suspension |
Ciprodex |
Oxycodone HCl / naloxone HCl |
Targin |
Cladribine |
Mavenclad |
Ozenoxacin |
Ozanex |
Clostridium botulinum neurotoxin type A, free from complexing proteins |
Xeomin |
Paliperidone |
Invega |
Colesevelam hydrochloride |
Lodalis |
Paliperidone palmitate |
Invega Sustenna |
Crisaborole |
Eucrisa |
Palonosetron hydrochloride |
Aloxi |
Cyclosporine |
Restasis Ophthalmic Emulsion |
Pasireotide diaspartate |
Signifor |
Cysteamine |
Cystadrops |
Pegfilgrastim |
Neulasta |
Cysteamine bitartrate |
Procysbi |
Peginterferon beta-1a |
Plegridy |
Dabigatran etexilate |
Pradaxa |
Pegvisomant |
Somavert |
Dapagliflozin |
Forxiga |
Perampanel |
Fycompa |
Dapagliflozin / metformin hydrochloride |
Xigduo |
Perindopril arginine / amlodipine |
Viacoram |
Daptomycin |
Cubicin |
Phleum pratense |
Grastek |
Darifenacin hydrobromide |
Enablex |
Pirfenidone |
Esbriet |
Darunavir |
Prezista |
Plerixafor |
Mozobil |
Darunavir/cobicistat |
Prezcobix |
Prasugrel |
Effient |
Darunavir / cobicistat / emtricitabine / tenofovir alafenamide |
Symtuza |
Pregabalin |
Lyrica |
Deferasirox |
Exjade |
Propiverine hydrochloride |
Mictoryl |
Deferiprone |
Ferriprox |
Propranolol oral solution |
Hemangiol |
Delta-9-tetrahydrocannabinol/cannabidiol |
Sativex |
Prucalopride |
Resotran |
Denosumab |
Prolia |
Quinagolide hydrochloride |
Norprolac |
Denosumab |
Xgeva |
Raltegravir |
Isentress |
Desvenlafaxine succinate |
Pristiq |
Ramipril/hydrochlorothiazide |
Altace HCT |
Dexamethasone |
Ozurdex |
Ranibizumab |
Lucentis |
Dienogest |
Visanne |
Rasagiline mesylate |
Azilect |
Dimethyl fumarate |
Tecfidera |
Reslizumab |
Cinqair |
Dolutegravir |
Tivicay |
Rifaximin |
Zaxine |
Dolutegravir/abacavir/lamivudine |
Triumeq |
Rilpivirine |
Edurant |
Dolutegravir/rilpivirine |
Juluca |
Riociguat |
Adempas |
Doravirine |
Pifeltro |
Risankizumab |
Skyrizi |
Doravirine / lamuvidine / tenofovir disoproxil fumarate |
Delstrigo |
Rituximab |
Rituxan |
Doxycycline monohydrate |
Apprilon |
Rivaroxaban |
Xarelto |
Dronedarone hydrochloride |
Multaq |
Rivastigmine |
Exelon Patch |
Drospirenone / ethinyl estradiol |
Yasmin |
Roflumilast |
Daxas |
Dulaglutide |
Trulicity |
Romiplostim |
Nplate |
Duloxetine hydrochloride |
Cymbalta |
Rotigotine |
Neupro |
Dupilumab |
Dupixent |
Rufinamide |
Banzel |
Dutasteride |
Avodart |
Sacubitril/valsartan |
Entresto |
Eculizumab |
Soliris |
Sapropterin dihydrochloride |
Kuvan |
Edaravone |
Radicava |
Sarilumab |
Kevzara |
Edoxaban |
Lixiana |
Saxagliptin |
Onglyza |
Efavirenz / emtricitabine / tenofovir disoproxil fumarate |
Atripla |
Saxagliptin/metformin |
Komboglyze |
Efinaconazole |
Jublia |
Sebelipase alfa |
Kanuma |
Elbasvir/grazoprevir |
Zepatier |
Secukinumab |
Cosentyx |
Eletriptan hydrobromide |
Relpax |
Selexipag |
Uptravi |
Eliglustat |
Cerdelga |
Semaglutide |
Ozempic |
Elosulfase alfa |
Vimizim |
Sildenafil citrate |
Revatio |
Eltrombopag |
Revolade |
Silodosin |
Rapaflo |
Eluxadoline |
Viberzi |
Sitagliptin phosphate |
Januvia |
Elvitegravir / cobicistat / emtricitabine / tenofovir disoproxil fumarate |
Stribild |
Sitagliptin phosphate monohydrate / metformin hydrochloride |
Janumet |
Elvitegravir / cobicistat / emtricitabine / tenofovir alafenamide |
Genvoya |
Sodium oxybate |
Xyrem |
Empagliflozin |
Jardiance |
Sodium phenylbutyrate |
Pheburane |
Empagliflozin and metformin |
Synjardy |
Sofosbuvir |
Sovaldi |
Emtricitabine / tenofovir alafenamide |
Descovy |
Sofosbuvir/velpatasvir/voxilaprevir |
Vosevi |
Emtricitabine / rilpivirine / tenofovir disoproxil fumarate |
Complera |
Sofosbuvir/velpatasvir |
Epclusa |
Emtricitabine / rilpivirine / tenofovir alafenamide |
Odefsey |
Solifenacin succinate |
Vesicare |
Emtricitabine / tenofovir disoproxil fumarate |
Truvada |
Somatropin |
Genotropin |
Entecavir |
Baraclude |
Stiripentol |
Diacomit |
Eplerenone |
Inspra |
Sucroferric oxyhydroxide |
Velphoro |
Eprosartan mesylate / hydrochlorothiazide |
Teveten Plus |
Tadalafil |
Adcirca |
Ertugliflozin |
Steglatro |
Taliglucerase alfa |
Elelyso |
Ertugliflozin / metformin hydrochloride |
Segluromet |
Tapentadol hydrochloride |
Nucynta |
Escitalopram oxalate |
Cipralex |
Teduglutide |
Revestive |
Eslicarbazepine acetate |
Aptiom |
Telmisartan/amlodipine |
Twynsta |
Etonogestrel / ethinyl estradiol |
Nuvaring |
Telotristat |
Xermelo |
Etravirine |
Intelence |
Tenofovir alafenamide |
Vemlidy |
Everolimus |
Afinitor |
Tenofovir disoproxil fumarate |
Viread |
Evolocumab |
Repatha |
Teriflunomide |
Aubagio |
Exenatide |
Byetta |
Teriparatide (rDNA origin) injection |
Forteo |
Fampridine |
Fampyra |
Tesamorelin |
Egrifta |
Febuxostat |
Uloric |
Ticagrelor |
Brilinta |
Fentanyl buccal |
Fentora |
Tiotropium/olodaterol |
Inspiolto Respimat |
Fesoterodine fumarate |
Toviaz |
Tiotropium bromide |
Spiriva Respimat |
Fidaxomicin |
Dificid |
Tipranavir |
Aptivus |
Fingolimod |
Gilenya |
Tocilizumab |
Actemra |
Fluorouracil / salicylic acid |
Actikerall |
Tofacitinib |
Xeljanz |
Fluticasone furoate |
Arnuity Ellipta |
Tolvaptan |
Jinarc |
Fluticasone furoate / vilanterol |
Breo Ellipta |
Tramadol hydrochloride |
Zytram XL |
Fluticasone furoate / umeclidinium / vilanterol |
Trelegy Ellipta |
Travoprost / timolol maleate |
Duotrav |
Fluticasone propionate |
Aermony Respiclick |
Travoprost ophthalmic solution |
Izba |
Fluticasone propionate / salmeterol xinafoate |
Arbesda Respiclick |
Treprostinil sodium |
Remodulin |
Fosamprenavir calcium |
Telzir |
Triptorelin pamoate |
Trelstar |
Galsulfase |
Naglazyme |
Trospium chloride |
Trosec |
Glatiramer acetate |
Copaxone |
Ulipristal acetate |
Fibristal |
Glecaprevir/pibrentasvir |
Maviret |
Umeclidinium |
Incruse Ellipta |
Glycerol phenylbutyrate |
Ravicti |
Umeclidinium/vilanterol |
Anoro Ellipta |
Glycopyrronium bromide |
Seebri |
Ustekinumab |
Stelara |
Golimumab |
Simponi |
Varenicline tartrate |
Champix |
Grass pollen allergen extract |
Oralair |
Vedolizumab |
Entyvio |
Guanfacine hydrochloride |
Intuniv XR |
Velaglucerase alfa |
Vpriv |
Guselkumab |
Tremfya |
Voriconazole |
Vfend |
Icatibant |
Firazyr |
Ziprasidone hydrochloride |
Zeldox |
Idursulfase |
Elaprase |
Zoledronic acid |
Aclasta |
Indacaterol |
Onbrez |
Zolpidem tartrate |
Sublinox |
Indacaterol/glycopyrronium |
Ultibro Breezhaler |
|
|