
Health Status of Canadians 2016: Report of the Chief Public Health Officer - How healthy are we? - Low birth weight
How healthy are we?
Low birth weight
In 2013, 24,000 or just over 6% of newborns had a low birth weight.Footnote 1
Low birth weight is defined as a weight of less than 2,500 grams at birth. Being born at a low birth weight increase the risk for short- and long-term impacts on health.Footnote 2-6
Over time
Just over 18,000 or 5.6% of babies born in 2000 and just under 24,000 or 6.3% in 2013 had a low birth weight.Footnote 1
By income
National data on low birth weight by income are not available. Data by income are available for pre-term birth and small-for-gestational-age. Pre-term birth and being small for gestational age are conditions associated with low birth weight.Footnote 2,Footnote 3
In 2006-2007, the proportion of preterm births and babies that were small for their gestational age was higher n low income neighbourhoods than in the highest income neighbourhood (see Figure 1)Footnote 3.
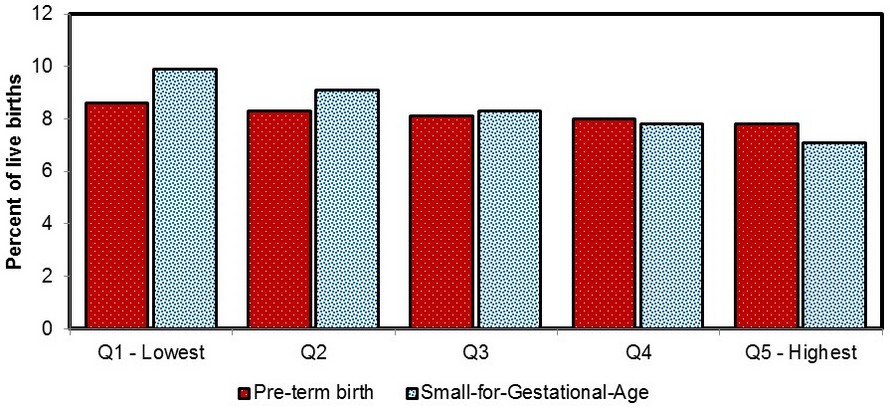
Quintiles (Q) are calculated by dividing the Canadian population into five groups of equal size (quintiles) based on neighbourhood income.
Text Equivalent
Bar chart showing percent of live births for pre-term birth and small-for-gestational-day by neighbourhood income in 2006-2007. These data are divided into income quintiles. Quintiles are calculated by dividing the Canadian population into five groups of equal size (quintiles) based on neighbourhood income.
Pre-term birth
- Quintile 1 (lowest): 8.6%
- Quintile 2: 8.3%
- Quintile 3: 8.1%
- Quintile 4: 8.0%
- Quintile 5 (highest): 7.8%
Small-for-gestational-age
- Quintile 1 (lowest): 9.9%
- Quintile 2: 9.1%
- Quintile 3: 8.3%
- Quintile 4: 7.8%
- Quintile 5 (highest): 7.1%
By age
A higher proportion of babies with a low birth weight are born to mothers under the age of 20 years and between the ages of 35 to 49 years.Footnote 7
| Mother's age | 2000 | 2013 |
|---|---|---|
| Under the age of 20 years | 6.8% | 6.6% |
| 20 to 34 years | 5.3% | 5.9% |
| 35 to 49 years | 6.6% | 7.5% |
Indigenous populations
Data on low birth weight in Indigenous populations are not directly comparable to the data described above.
In First Nations on-reserve in 2008/2010, mothers aged 35 years or older were more likely to report giving birth to a baby with low birth weight than mothers in other age groups.Footnote 8
| Mother's age | % of live births |
|---|---|
| Under the age of 20 years | 3.4%* |
| 20 to 34 years | 4.5% |
| Over the age of 35 years | 8.4%Tableau 2 note de bas de page a |
In Inuit regions in 2004-2008, the proportion of low birth weights in Nunavut and Nunavik was higher than the overall Canadian population (which included all Inuit regions).Footnote 9
| Region | % of live births |
|---|---|
| Inuvialuit region (Northwest Territories) | 3.9% |
| Nunavut | 7.6% |
| Nunavik (northern Quebec) | 6.6% |
| Nunatsiavut (northern Labrador) | 5.7% |
| Canada (overall) | 6% |
International comparison
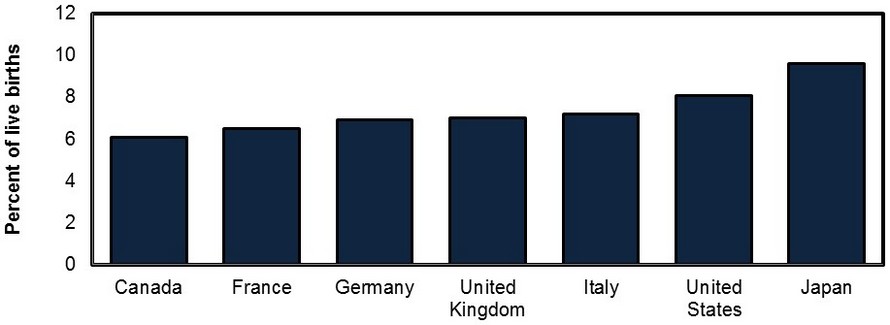
In 2011, the proportion of newborns with a low birth weight among G7 countries ranged from 6% to 10%. Canada had the lowest proportion of babies born at a low birth weight at 6% (see Figure 2)Footnote 10.
Text Equivalent
Bar chart showing percent of live births with low birth weight in G7 countries in 2011.
- Canada = 6.1%
- United States = 8.1%
- United Kingdom = 7%
- France = 6.5%
- Germany = 6.9%
- Italy = 7.2%
- Japan = 9.6%
Notes to the reader
- Indigenous populations consist of First Nations, Métis and Inuit.
- Data on First Nations on -reserve are from the First Nations Regional Health Survey (2008/10). Prenatal health data, including information on birth weight, were obtained through the child survey. This survey was completed by the child's primary caregiver.Footnote 8
- G7 countries include seven of the world's industrialized countries, namely the United States, Japan, Germany, France, the United Kingdom, Italy and Canada, that form an informal discussion group and economic partnership.