
Health Status of Canadians 2016: Report of the Chief Public Health Officer - How healthy are we? - Perceived health
How healthy are we?
Perceived health
In 2014, 18 million or three in five Canadians said they felt they had very good or excellent (see Figure 1)Footnote 1.
Perceived health is a subjective measure of how people feel about their health and can be a good reflection of actual health.Footnote 2-4 Health means not only the absence of disease or injury but also physical, mental and social well-being.Footnote 1
Over time
The proportion of Canadians reporting that they felt they had very good or excellent health has not changed.Footnote 1
- 58% in 2003.
- 59% in 2014.
By income
In 2014, Canadians in the lowest household incomes were less likely to report feeling they had very good or excellent health than those living in the highest income households (see Figure 2)Footnote 5.
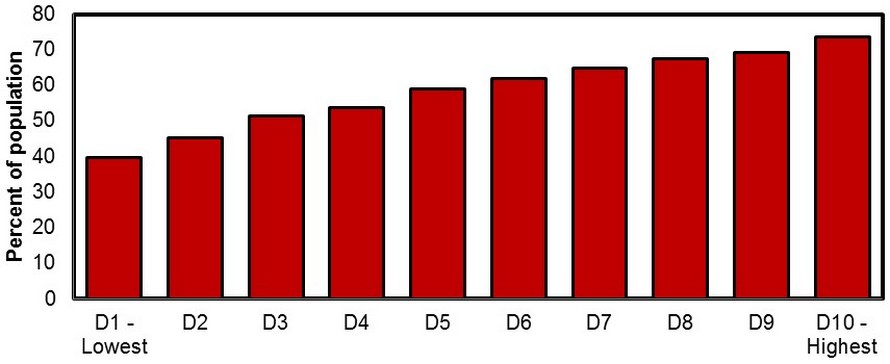
Deciles (D) are calculated by dividing the Canadian population into ten groups of equal size (deciles) based on household income.
Text Equivalent
Bar chart showing percent of the population who report being in very good or excellent health by household income in 2014. These data are divided into income deciles. Deciles are calculated by dividing the Canadian population into ten groups of equal size (deciles) based on neighbourhood income.
- Decile 1 (lowest) = 39.7%
- Decile 2 =45.3%
- Decile 3 = 51.3%
- Decile 4 = 53.8%
- Decile 5 = 59%
- Decile 6 =62%
- Decile 7 = 64.9%
- Decile 8 = 67.4%
- Decile 9 = 69.2%
- Decile 10 (highest) = 73.7%
By sex
In 2014, the same proportion of men and women rated their health as very good/excellent or fair/poor.Footnote 1
| Very good or excellent | Fair or poor | |
|---|---|---|
| Men | 59% | 12% |
| Women | 59% | 12% |
Indigenous populations
Data on perceived health in Indigenous populations are not directly comparable to the data described above. In 2008/2010, 44% of First Nations on-reserve rated their health as very good or excellent.Footnote 6
| First Nations on-reserve | 44% |
|---|
In 2007-2010, First Nations off reserve, Métis and Inuit were less likely than non-Indigenous people to report that their health was very good or excellent.Footnote 7
| First Nations off reserve | 50% |
|---|---|
| Métis | 54% |
| Inuit | 55% |
| Non-Indigenous | 63% |
Data presented in this table are adjusted by age. Indigenous populations tend to be younger than non-Indigenous populations which can affect the ability to compare data across groups. |
|
International comparison
Perceived health is not measured the same way across all countries, so data were adjusted so that they could be compared. Data presented above represent very good or excellent perceived health. These data can be reported over time, by income and by sex. The data below for Canada represent good, very good and excellent health (they include all positive responses) in order to allow for the comparison of perceived health among G7 countries.Footnote 8
At 88%, Canada and the United States had the highest proportion of people among G7 countries in 2014 who said that they felt they had good or very good health (see Figure 3)Footnote 8. It should be noted that perceived health is a subjective measure that can be affected by factors such as culture. This means that for some cultures, perceived health may not accurately reflect actual health.Footnote 10
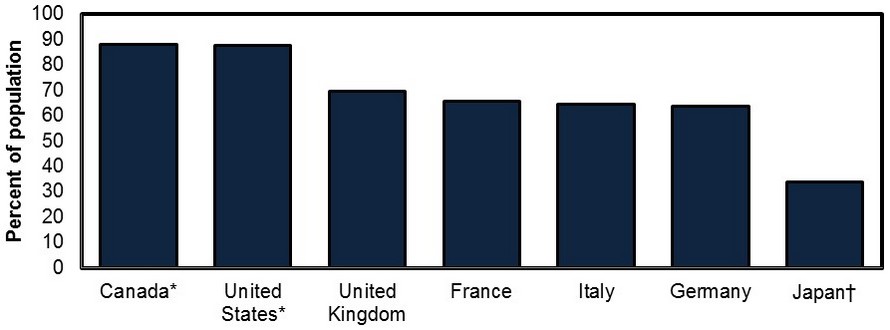
* For Canada and the United States: Adjusted to match WHO methodology.Footnote 10
** For Canada, good/very good data indicate any positive response, including "excellent". This adjustment was made in order to be consistent with other countries' data collection.Footnote 9
† For Japan: Data for 2013
Text Equivalent
Bar chart showing percent of population in G7 countries who reported being in good or very good health in 2014.
- Canada = 88.1%
- United States = 88.1%
- United Kingdom = 70%
- France = 68.1%
- Italy = 67.9%
- Germany = 65.2%
- Japan = 35.4%
Notes to the reader
- To measure perceived health, Canadians 12 years and older were asked if they felt their health was excellent, very good, fair or poor.Footnote 1
- Indigenous populations consist of First Nations, Métis and Inuit.
- G7 countries include seven of the world's industrialized countries, namely the United States, Japan, Germany, France, the United Kingdom, Italy and Canada, that form an informal discussion group and economic partnership.
- To compare across countries, answers from national surveys were regrouped to match three categories: "good or very good" (includes all positive responses), "fair" (includes any neutral responses), and "bad or very bad" (includes all negative responses).Footnote 9