
Process for Incorporating Economic Evidence into Federal Vaccine Recommendations
Download the alternative format
(PDF format, 2,63 MB, 90 pages)
Organization:
Public Health Agency of Canada
Published: February 22, 2021
Stakeholder consultation feedback
The National Advisory Committee on Immunization (NACI) provides the Public Health Agency of Canada (PHAC) with ongoing and timely medical, scientific, and public health advice relating to immunization.
In addition to safety, efficacy, effectiveness, immunogenicity, and burden of illness, PHAC has expanded the mandate of NACI to include the systematic consideration of programmatic factors in developing evidence-based recommendations to facilitate timely decision-making for publicly funded vaccine programs at provincial and territorial levels. The additional factors to be systematically considered by NACI include: economics, ethics, equity, feasibility, and acceptability.
The NACI economic process outlines the process of determining when and how NACI incorporates economic evidence into its recommendations.
NACI is now seeking input on the draft economic process from stakeholders, including but not limited to:
- Provinces and territories
- The Canadian Immunization Committee (CIC)
- Vaccine Safety Working Group
- The Council of the Chief Medical Officers of Health
- National Immunization Technical Advisory Groups (NITAGs)
- Provincial Immunization Technical Advisory Group (PITAGs)
- Health Technology Assessment (HTA) agencies
- Researchers
- Policy makers
- Industry
- Other interested parties
The questionnaire has been prepared to make it easier for you to engage your colleagues in reviewing the economic process and convey your overall comments and position. The questionnaire addresses each section of the economic process in modules and poses key questions for your feedback. Modules A, B and J are mandatory, whereas Modules C through I are optional. Further instructions for completing the questionnaire are provided once you click on the button below.
All feedback received will be considered by the NACI Secretariat in their final review of the economic process before it is tabled for final approval through the NACI and made publicly available.
On this page
- NACI draft economic process (Mandatory survey module A)
- Supporting tool #1: Economic prioritization tool (Mandatory survey module B)
- Supporting tool #2: Submission criteria for model-based economic evaluations (Mandatory survey module C)
- Supporting tool #3: Presentation template for proposed economic evidence (Optional survey module D)
- Supporting tool #4: Interim guidelines for the economic evaluation of vaccines (Optional survey module E)
- Supporting tool #5: Standard operating procedure (SOP) on reporting guidelines for economic evaluations of vaccines (Optional survey module F)
- Supporting tool #6: Standard operating procedure (SOP) on systematic review of economic evaluations (Optional survey module G)
- Supporting tool #7: Presentation template for presenting economic evaluations (Optional survey module H)
- Supporting tool #8: Presentation template for presenting systematic reviews (Optional survey module I)
National Advisory Committee on Immunization (NACI): Process for Incorporating Economic Evidence into Federal Vaccine Recommendations
Module A
DRAFT Economic Process
Preamble
The National Advisory Committee on Immunization (NACI) provides the Public Health Agency of Canada (PHAC) with ongoing and timely medical, scientific, and public health advice related to immunization. Through the work of working groups and with the support of a secretariat at the Public Health Agency of Canada, NACI makes recommendations on the use of human vaccines that are currently or newly approved in Canada.
Traditionally, NACI reviewed safety, efficacy, immunogenicity, effectiveness and burden of illness. PHAC has recently expanded this mandate to include the systematic consideration of programmatic factors-economics, ethics, equity, feasibility and vaccine acceptability-in developing evidence-based recommendations. This expanded mandate is to facilitate timely decision-making for publicly funded vaccine programs at provincial and territorial levels.
Over the coming years, NACI is continuing to refine methodological approaches to include these programmatic factors. NACI statements will include varying degrees of programmatic analyses for public health programs.
The NACI Economic Process is a document that outlines when and how NACI incorporates economic evidence for vaccine recommendation. To inform the development of the Process, information was gleaned from Canadian and international health technology assessment agencies, the Vaccine Industry Committee (VIC), and other National Immunization Technical Advisory Groups (NITAGs) from several countries.
The stakeholder consultation seeks to obtain input from partners and stakeholders to ensure the most accurate and useful product.
Overview of Economic Process
Types of Economic Evidence
Two common types of economic evidence are economic evaluations and budget impact analyses (Figure 1). Systematic reviews (of economic evaluations), which are syntheses of existing cost-utility, cost-effectiveness, cost-benefit analyses, etc., are also increasingly used.
Figure 1. Two types of economic evidence commonly used in decision-making
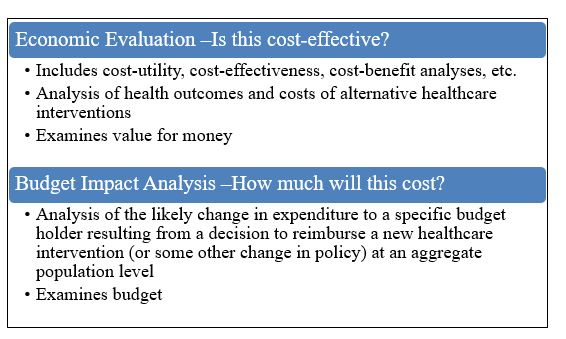
Figure 1 - Text Description
This figure presents two types of economic evidence commonly used in decision-making.
- Economic Evaluation - Is this cost-effective?
- Includes cost-utility, cost-effectiveness, cost-benefit analyses, etc.
- Analysis of health outcomes and costs of alternative healthcare interventions
- Examines value for money
- Examines value for money
- Analysis of the likely change in expenditure to a specific budget holder resulting from a decision to reimburse a new healthcare intervention (or some other change in policy) at an aggregate population level
- Examines budget
Based on feedback from the provinces and territories (P/Ts) the NACI economic analyses will bring considerations of cost-effectiveness into NACI guidance. Discussions about budget impact analyses will be re-visited by NACI at a later date. Therefore, in the remainder of this document, the term "economic evidence" refers to economic evaluations (de novo economic evaluations and systematic reviews of existing economic evaluations).
NACI Work plan
The NACI work plan consists of projects that have been prioritized for a given fiscal year. These projects will not necessarily be completed within the fiscal year. The work plan may be reassessed based on emerging public health needs. Figure 2 outlines possible triggers that may drive activation of Working Groups (WGs) and the development of new NACI guidance documents, or the adoption of new priorities.
Figure 2. Triggers that may determine the NACI work plan

Figure 2 - Text Description
This figure outlines possible triggers that may drive activation of Working Groups (WGs) and the development of new NACI guidance documents, or the adoption of new priorities. Possible triggers include: a new vaccine or new indication, new recommendation by authoritative Canadian body (government or professional organization), P/T programmatic concerns, recommendation adoption by reputable international organization (ACIP, WHO), new safety signal detected, vaccine supply issues, anticipated public health emergency (e.g. EVD imported case), changes in disease epidemiology (including outbreaks), CIG chapter review, or key publication (pivotal trial). Abbreviations: ACIP, Advisory Committee on Immunization Practices (United States Centers for Disease Control and Prevention); CIG, Canadian Immunization Guide; EVD, Ebola virus disease; P/T, provinces/territories; WHO, World Health Organization
There are several expert WGs that draft products for NACI consideration and voting. WGs are comprised of NACI members and external experts. WGs may require the following evidence to inform NACI guidance:
- Clinical evidence (including safety, efficacy, immunogenicity, effectiveness and burden of illness)
- Ethics, Equity, Feasibility, Acceptability (EEFA) considerations
- Economic evidence
Figure 3 outlines the process of determining when and how NACI incorporates economic evidence into its guidance. Please see each step in the "Economic Process in Detail" section.
Figure 3. Overview of the NACI Economic Process
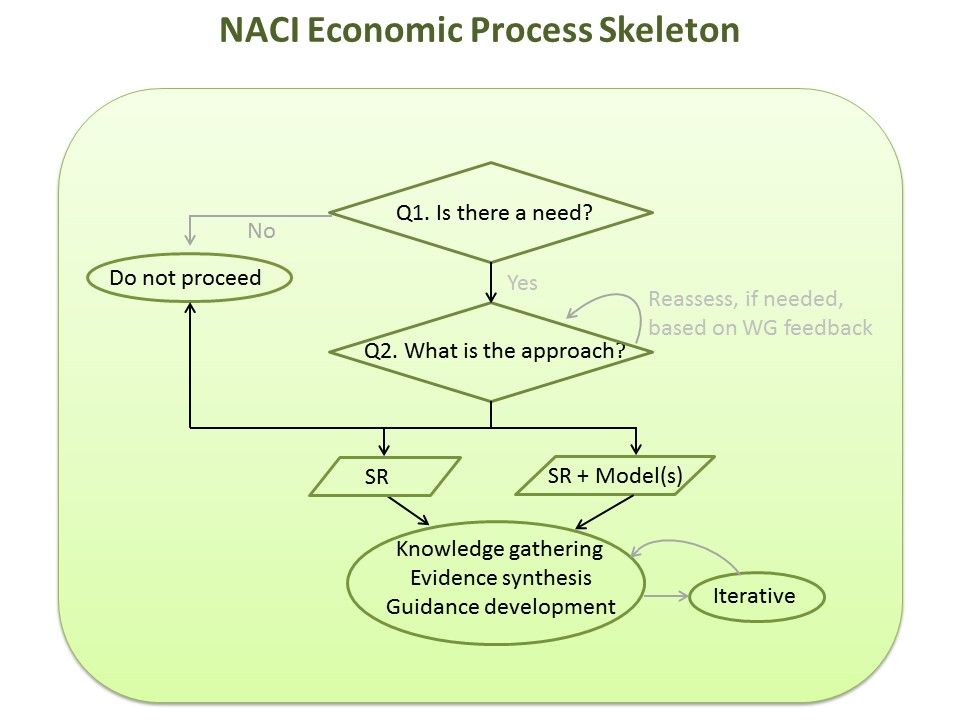
Figure 3 - Text Description
This figure presents a flow chart depicting the general NACI Economic Process. The first step queries whether there is a need for an economic evaluation. If there is no need for an economic evaluation, there are no further steps in the process. If a need is identified, the next step is to determine the approach for generating economic evidence. The approach may take the form of a systematic review of economic evaluations or a systematic review plus one or more models. The approach (or the decision to proceed with an economic evaluation) may be reassessed based on WG feedback. The last step is an iterative process of knowledge gathering, evidence synthesis, and guidance development. Abbreviations: Q, question; SR, systematic review; WG, working group
Economic Process in Detail
The Economic Process consists of three basic steps:
- Assessing need
- Determining the approach
- Knowledge gathering, evidence synthesis, guidance development
1. Assessing Need
Once a NACI work plan item has been identified, the first step of the Economic Process is to determine if economic evidence is needed for NACI to make a vaccine recommendation.
- The annual work plan is developed through a collaborative process between NACI and the P/Ts. This process consists of a survey and/or discussion with members of NACI and Canadian provinces and territories (e.g. Canadian Immunization Committee (CIC) and/or Council of Chief Medical Officers of Health (CCMOH)). Based on these priorities, a few key work plan items are selected each year for NACI to investigate.
- Once the NACI annual work plan has been finalized, the Economic Prioritization Tool will be applied to assess need and urgency.
Supporting tool #1: Economic prioritization tool
The Economic Prioritization Tool is a qualitative tool to assess need and urgency of generating/ synthesizing economic evidence for each policy question. The assessment is based on epidemiology, safety, economics and social values. There is no quantitative rating scale or weighting of the criteria assessed. Rather, the Economic Prioritization Tool is meant to provide structure and guidance to considering the need and urgency for economic evidence. The Prioritization Tool will be completed and deliberated upon by the WG Chair/ Vice Chair, the Secretariat (including at least one epidemiologist/ medical specialist, and one health economist), and if needed, additional WG subject matter experts.
If there is a need identified, then the work plan topic will move forward to the second step of the Economic Process (Section 2). Economic evidence will not be included for a work plan topic that does not have a sufficient need for it.
2. Determining the Approach
The second step of the Economic Process is to determine the approach for generating economic evidence for the work plan topic. This step will be informed by an environmental scan of the peer-reviewed literature, grey literature, and expert/ stakeholder input.
Several factors will be considered:
- Type of economic evidence base needed
- Timeliness of issuing NACI guidance
- Operational considerations
Below are three options of "information packages" to make up the economic evidence base for NACI decision-making:
- Systematic review
- Systematic review AND a de novo (i.e., purpose-built) or adapted model-based economic evaluation
- Systematic review AND a multi-model comparison
Note that all three options include a systematic review, where study quality will be appraised and data will be extracted from the included economic evaluations. In the second and third options, an additional de novo (or adapted) model and multi-model comparison will be included as part of the evidence base, respectively. These are described below. Once an approach has been decided upon, a Presentation Template for Proposed Economic Evidence is available to outline the rationale.
- De Novo (or Adapted) Model-Based Economic Evaluation: This refers to either a de novo (i.e., purpose-built) economic evaluation, or to an existing economic evaluation that will be updated or adapted for NACI's purposes.
- Based on separate consultations with NACI, P/Ts, and the PHAC Public Health Ethics Consultative Group, an adapted model will not be based on a model developed by industry (i.e., developed by industry employees or by consultants sponsored by industry).
- When determining which existing economic evaluation to update or adapt, many factors will be considered including: (i) ability to engage with the authors (i.e., willingness of authors to update/ adapt their work for NACI's needs); (ii) relevance of the economic evaluation to NACI needs in terms of the population, intervention, comparator, outcome, applicability (i.e., jurisdiction, recency, data sources); (iii) study quality; (iv) source(s) of study funding and the role of funders.
- Multi-Model Comparison: This refers to the comparison of two or more model-based economic evaluations. Model structures, inputs, assumptions, and results will be assessed and compared.
- One of the economic evaluations in a multi-model comparison will be a de novo/ adapted model.
- The other economic evaluation(s) included may be developed/ funded by others such as academia, government, a recognized funding agency, and industry.
- Relevant manufacturers will be invited to submit their economic models in the event that NACI seeks to conduct a multi-model comparison. If stakeholders choose to submit their economic model to NACI, please refer to the Submission Criteria for Model-based Economic Evaluations. Industry stakeholders can stay informed about NACI work plan topics on the NACI website
Supporting tool #2: Submission Criteria for Model-based Economic Evaluations
The Submission Criteria for Model-based Economic Evaluations outline the mandatory standards before submitting an economic model to NACI. The criteria include how to conduct and report the economic evaluation, software and run time requirements, as well as the submission of the model code.
Supporting tool #3: Submission Criteria for Model-based Economic Evaluations
The Presentation Template for Proposed Economic Evidence outlines the rationale for the approach proposed. Specifically, it outlines the results of the Economic Prioritization Tool, results of the environmental scan, and other considerations.
3. Knowledge Gathering, Evidence Synthesis, Guidance Development
The third step of the Economic Process is to gather knowledge, synthesize evidence and develop NACI guidance. The core work is to develop the project plan for the work plan topic; to generate and synthesize economic evidence; to review and discuss (within the WG) work plan items; and to draft an economic report that can be incorporated into NACI guidance. Five tools have been developed by NACI for conducting, reporting and presenting both economic evaluations and systematic reviews:
Supporting tool #4: Interim Guidelines for the Economic Evaluation of Vaccines: Canada
The purpose of the Interim Guidelines for the Economic Evaluation of Vaccines is to inform best practices for conducting economic evaluations of vaccines in Canada. This is to ensure the economic information is standardized, credible, and relevant for decision-makers in Canada's publicly funded health care system.
The Interim Guidelines are to be used while the official guidelines for economic evaluations are being developed by the NACI Economic Guidelines Task Group. The group was convened in January 2019 and consists of international experts who have expertise in economics, modelling, infectious diseases/vaccines, as well as experience on guideline development panels. In addition to having P/T representation in its membership, the Task Group will continue to seek further P/T feedback via CIC and CCMOH. Feedback from other stakeholders including industry, the Canadian research community, health technology assessment agencies and the public will be sought. Further information on the public consultation will be communicated when it becomes available. The official guidelines are outside the scope of this present public consultation process, which is on the Economic Process.
Supporting tool #5: Reporting Guidelines for Economic Evaluations of Vaccines: Canada
The purpose of the Reporting Guidelines is to provide guidance on reporting economic evaluations to NACI. Users include the Secretariat, contractors, and industry stakeholders submitting documentation to NACI as part of a multi-model comparison.
Supporting tool #6: Standard Operating Procedure (SOP) on Systematic Reviews of Economic Evaluations
The purpose of the SOP on Systematic Reviews is to provide guidance on conducting and reporting a systematic review of economic evaluations for NACI.
Supporting tool #7: Presentation Template for Presenting Economic Evaluations
The purpose of the Template for Presenting Economic Evaluations is to ensure economic evaluations presented to WGs and NACI are uniform in presentation, understandable, and of the highest quality.
Supporting tool #8: Presentation Template for Presenting Systematic Reviews
The purpose of the Template for Presenting Systematic Reviews is to ensure systematic reviews presented to WGs and NACI are uniform in presentation, understandable, and of the highest quality.
Closing Remarks
In summary, economic evidence may be one component of NACI guidance. Other components include clinical evidence (i.e., safety, efficacy, immunogenicity, effectiveness and burden of illness) as well as Ethics, Equity, Feasibility, Acceptability (EEFA) considerations. NACI guidance will be published on NACI's website with notifications to stakeholders, web subscribers, and typically with a notification in the Canada Communicable Disease Report (CCDR).
Abbreviations
- ACIP
- Advisory Committee on Immunization Practices (United States Centers for Disease Control and Prevention)
- CADTH
- Canadian Agency for Drugs and Technologies in Health
- CCDR
- Canada Communicable Disease Report
- CCMOH
- Council of Chief Medical Officers of Health
- CIC
- Canadian Immunization Committee
- CIG
- Canadian Immunization Guide
- EFFA
- Ethics, Equity, Feasibility, Acceptability
- EVD
- Ebola virus disease
- NACI
- National Advisory Committee on Immunization
- NITAG
- National Immunization Technical Advisory Groups
- PHAC
- Public Health Agency of Canada
- P/Ts
- Provinces and Territories
- SOP
- Standard Operating Procedure
- WG
- Working Group
- WHO
- World Health Organization
National Advisory Committee on Immunization (NACI): Supporting Tool #1
Prioritization Guide to Economic Evidence
Module B
Preamble
- Adapted from Health Quality Ontario's prioritization toolNote de bas de page 25 and revised to meet specific needs of vaccine evaluations
- Multiple iterations of feedback from various stakeholders (i.e., Canadian Immunization Committee, NACI, NACI Economics Task Group) and from piloting within NACI Secretariat
For Users
- Purpose: Provide structure and guidance for assessing whether there is a need or urgency for economic evidence
- Tool is meant to be qualitative
- No quantitative rating or weighting of criteria
- Meant to be used for specific policy question (i.e., preferably with a PICO question defined)
The National Advisory Committee on Immunization's Prioritization Guide to Economic Evidence
- Date tool was used
- List of users and roles
- Policy question of interest
| Criteria | Sub criteria | Assessment | Rationale for Assessment | ||||
|---|---|---|---|---|---|---|---|
| High | Moderate | Low | Unknown | ||||
| Burden of disease | a) | Incidence/prevalence (endemic levels), and potential for outbreaks | Moderate to high incidence/prevalence, or moderate to high potential for outbreaks | Low incidence/prevalence, or limited potential for outbreaks | Under eradication or no potential for outbreaks | Unknown | no data |
| b) | Severity of disease (manifestations, sequelae) | Significant mortality or morbidity | Some mortality or morbidity | No expected impact on mortality or morbidity | Unknown | no data | |
| c) | Unmet health need (whether there are existing products available as standard of care for (sub)populations of interest, i.e., by age groups) |
Significant unmet need | Some unmet need | No unmet need | Unknown | no data | |
| d) | Economic burden of disease (direct burden to health system) | Significant economic burden | Some economic burden | Low economic burden | Unknown | no data | |
| Proposed benefit and potential safety issues | a) | Effectiveness: potential to improve health outcomes relative to existing alternatives | Potential significant benefit | Some benefit | No benefit is expected, or inferior benefit is possible | Unknown | no data |
| b) | Changing disease dynamics/indirect effects of the program | Potential significant benefit | Some benefit | No benefit is expected | Unknown | no data | |
| c) | Potential burden due to safety issues (incidence, severity) | No safety concerns | Some safety concerns | Substantial safety concerns | Unknown | no data | |
| Economic considerations | a) | Incremental costs to make vaccine available (cost per fully vaccinated individual, vaccine + vaccine delivery) | > $300 | $100-$300 | < $100 | Unknown | no data |
| b) | Potential budget impact (from implementing vaccine program) | Significant budget impact | Some budget impact | Low budget impact | Unknown | no data | |
| c) | Cost offsets to the health system (i.e., due to reduced healthcare visits, reduced morbidity/ mortality, reduced treatment costs, etc.) | Significant offsets expected | Some offsets expected | No offsets expected | Unknown | no data | |
| Social value considerations | a) | Potential to impact on social values and equity (see EEFA) | Significant social values or equity issues | Some social values or equity issues | No remarkable impact on social values or equity | Unknown | no data |
What is the need for economic evidence?: High/Moderate/Low The main considerations for this decision were:
Etc. |
|||||||
| Criteria | Sub criteria | Assessment | Rationale for Assessment | ||||
|---|---|---|---|---|---|---|---|
| High | Moderate | Low | Unknown | ||||
| Urgency | a) | Canadian recommendation (e.g. CATMAT, CPS, SOGC, P/Ts) | ≥3 organizations/ strong recommendation | 1-2 organizations/ moderate recommendation | No organizations/ weak recommendation | Unknown | no data |
| b) | Current availability of vaccine (publicly funded) | Widely available (≥3 provinces) | Some availability (1-2 provinces) | Limited or no availability | Unknown | no data | |
| c) | International recommendation (e.g., ACIP, JCVI, ATAGI) | Multiple international regions | One international region | None | Unknown | no data | |
| d) | P/T programmatic concerns | Strong demand / ≥ 3 provinces | Some demand / 1-2 provinces | None | Unknown | no data | |
| e) | Demand from stakeholders including the public, clinicians, manufacturers, etc. | Demand from multiple stakeholders / national stakeholder(s) | Demand from 1 stakeholder / provincial stakeholder(s) | None | Unknown | no data | |
What is the urgency for economic evidence?: High/Moderate/Low The main considerations for this decision were:
Etc. Abbreviations: CATMAT, Committee to Advise on Tropical Medicine and Travel; CPS, Canadian Paediatric Society; SOGC, Society of Obstetricians and Gynaecologists of Canada; P/Ts, provinces and territories; ACIP, US Advisory Committee on Immunization Practices; JCVI, UK Joint Committee on Vaccination and Immunisation; ATAGI, Australian Technical Advisory Group on Immunisation |
|||||||
National Advisory Committee on Immunization (NACI): Supporting Tool #2
Submission Criteria for Model-based Economic Evaluations
Module C
For stakeholders submitting model-based economic evaluations to NACI, the following criteria must be met:
- Follow the NACI Interim Guidelines for the Economic Evaluation of Vaccines. This document will outline the requirements for conducting an economic evaluation including the required perspective, discount rate, comparator, etc.
- Follow the NACI Reporting Guidelines for Economic Evaluations. This document will outline the requirements for the report that should be submitted alongside the model-based economic evaluation.
- Provide full access to programming code (e.g., macros, VBA code). NACI must be able to vary individual parameters, view the calculations, and run the model to generate results. In other words, model must be fully unlocked and executable.
- Use the following software: Excel, TreeAge, R
- Before using other specialized software, the submitter must contact NACI in advance to ensure the alternative software is acceptable. If acceptable, submitters will receive direction on how the model and software should be provided as part of the submission (e.g., licenses, software), which will be returned to the submitter at the end of the review process, at the submitter's expense.
- Provide basic user information on how to modify input parameters and run model.
- Ensure model run time is not excessive on a personal computer (i.e., cannot exceed over one business day or 8 hours on a standard computer)
Deviations from these requirements must be discussed with and accepted by NACI in advance of submission. Please contact phac.naci-ccni.aspc@canada.ca to provide complete details of the deviations from these requirements.
National Advisory Committee on Immunization (NACI): Supporting Tool #3
Presentation Template for Proposed Economic Evidence
Module D
Slide 3-1. Proposed Economic Evidence: Topic

Slide 3-1 - Text Description
Proposed Economic Evidence: Topic
Slide 3-2. Economic Prioritization Tool: Summary
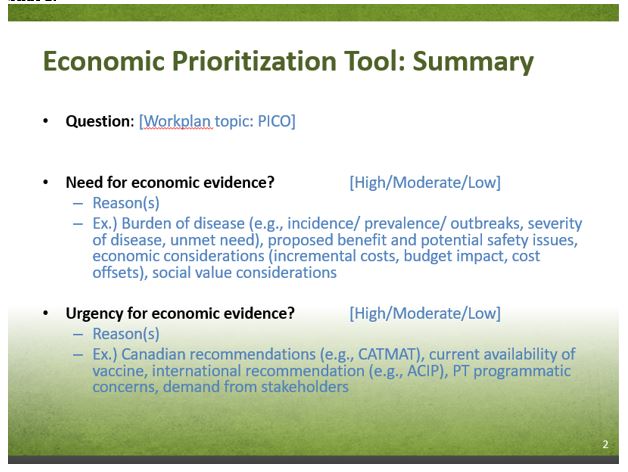
Slide 3-2 - Text Description
- Question: [Work plan topic: PICO]
- Need for economic evidence? [High/Moderate/Low]
- Reason(s)
- Ex.) Burden of disease (e.g., incidence/ prevalence/ outbreaks, severity of disease, unmet need), proposed benefit and potential safety issues, economic considerations (incremental costs, budget impact, cost offsets), social value considerations
- Urgency for economic evidence? [High/Moderate/Low]
- Reason(s)
- Ex.) Canadian recommendations (e.g., CATMAT), current availability of vaccine, international recommendation (e.g., ACIP), PT programmatic concerns, demand from stakeholders
Slide 3-3. Economic Prioritization Tool: Summary continued
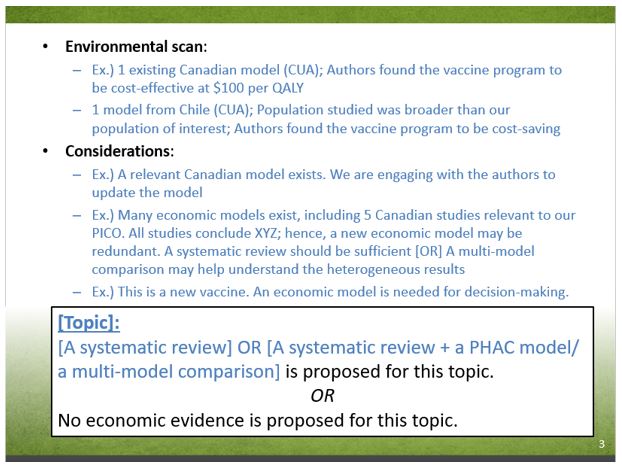
Slide 3-3 - Text Description
- Environmental scan:
- Ex.) 1 existing Canadian model (CUA); Authors found the vaccine program to be cost-effective at $100 per QALY
- 1 model from Chile (CUA); Population studied was broader than our population of interest; Authors found the vaccine program to be cost-saving
- Considerations:
- Ex.) A relevant Canadian model exists. We are engaging with the authors to update the model
- Ex.) Many economic models exist, including 5 Canadian studies relevant to our PICO. All studies conclude XYZ; hence, a new economic model may be redundant. A systematic review should be sufficient [OR] A multi-model comparison may help understand the heterogeneous results
- Ex.) This is a new vaccine. An economic model is needed for decision-making.
[Topic]:
[A systematic review] or [A systematic review + a PHAC model/ a multi-model comparison] is proposed for this topic.
or
No economic evidence is proposed for this topic.
National Advisory Committee on Immunization (NACI): Supporting Tool #4
Interim Guidelines for the Economic Evaluation of Vaccines: Canada
Module E
Purpose
The purpose of these Interim Guidelines is to inform best practices for conducting de novo economic evaluations of vaccines in Canada. This is to ensure the economic information is standardized, credible, and relevant for decision-makers in Canada's publicly funded health care system.
Background
Traditionally, Canada's National Advisory Committee on Immunization (NACI) assessed vaccines based on clinical efficacy and safety. In 2016, NACI had expanded its mandate to address economic considerations, ethics, equity, feasibility and acceptability in its recommendations of vaccines.
Currently, guidelines for conducting economic evaluations exist in Canada for health technologies in general. The Canadian Agency for Drugs and Technologies in Health (CADTH) had published updated guidelines in 2016.Note de bas de page 1 Health technologies can refer to drugs, medical devices, diagnostics, and procedures, among others.
While recommendations found in the CADTH Guidelines are generally applicable to vaccines, a need for vaccine-specific guidelines was identified. This is based on the unique nature of vaccines and the infectious diseases they prevent.
Vaccine-specific guidelines are under development by the NACI Economic Guidelines Task Group. In their absence, these Interim Guidelines will be used by NACI for conducting economic evaluations. They are largely based on the CADTH Guidelines with modifications or additional commentary to highlight vaccine-specific nuances.
Guideline Statements
Please refer to the 15 guideline statements found in the CADTH Guidelines.Note de bas de page 1 The Interim Guidelines follow CADTH recommendations unless otherwise indicated below. The letter "M" beside the interim statements below indicates modifications to the CADTH statement. The letter "A" indicates additional commentary, but no change to the CADTH statement. Modifications and additional commentary are presented in the subsequent section.
| # | Topic | Change? | Statement |
|---|---|---|---|
| 1 | Decision Problem | - | no data |
| 2 | Types of Evaluations | - | no data |
| 3 | Target Population | - | no data |
| 4 | Comparators | - | no data |
| 5 | Perspective | M | CADTH: Interim: |
| 6 | Time Horizon | M | CADTH: Interim: The population-level time horizon should not be defined prior to the analysis, as the model should be run until steady state is achieved. |
| 7 | Discounting | A | no data |
| 8 | Modelling | M | CADTH: Interim: |
| 9 | Effectiveness | A | no data |
| 10 | Measurement and Valuation of Health | A | no data |
| 11 | Resource Use and Cost | A | no data |
| 12 | Analysis | M | CADTH: Interim: For dynamic models, researchers should use their best judgement to determine if probabilistic analyses are appropriate (if at all). For sensitivity analyses, researchers can consider deterministic analyses of parameter uncertainty (i.e., one-way, multi-way, or threshold analyses). |
| 13 | Uncertainty | - | no data |
| 14 | Equity | - | no data |
| 15 | Reporting | - | no data |
| A = additional commentary, but no change to the CADTH statement; M = modifications to the CADTH statement; Abbreviation: CADTH = Canadian Agency for Drugs and Technologies in Health guidelines | |||
Modified Statements or Additional Commentary
5. Perspective
CADTH Statement(s):
"5.1 In the reference case, the perspective should be that of the publicly funded health care payer. The perspective of the economic evaluation should be related to the decision problem.
5.3 Where perspectives other than the reference case perspective are of interest to the decision-maker and could have a substantial impact on the results of the analysis, these should be included as additional non-reference case analyses."
NACI Commentary:
In the context of vaccines and infectious diseases, a societal perspective may be of particular interest to the decision-maker. The Advisory Committee on Immunization Practices (ACIP) in the United States recommend a societal perspective unless strong justification is provided for doing otherwise.Footnote 2 The perspective considers a broad range of health and non-health costs and effects.
Non-health costs include those to the:Footnote 1
- Government payer: social services such as home help, meals on wheels,
- Private insurance: community-based services, nursing home care
- Patient and informal caregivers: out-of-pocket payments (e.g., copayments), cost of travel, paid caregivers, premiums paid to private insurers, patient's time spent for travel and receiving treatment
- Productivity costs: lost productivity due absenteeism from paid work or school, lost time at unpaid work (e.g., housework) by patient and informal caregiver, costs to employer to hire and train replacement worker
Non-health effects include:Footnote 1,Footnote 3
- Improved education attainment
- Increased work productivity
- Reduced household financial risk
- Increased attractiveness of tourism
- Information available to patients
- Reduction in criminal behaviour
Researchers should be careful not to double-count the non-health costs and effects.Footnote 4
NACI Interim Statement:
In the reference case, the perspective should be that of the publicly funded health care payer. If indicated, the societal perspective may be included as an additional non-reference case analysis.
6. Time horizon
CADTH Statement(s):
"6.1 In the reference case, the time horizon should be long enough to capture all relevant differences in the future costs and outcomes associated with the interventions being compared. Thus, the time horizon should be based on the condition and the likely impact of the intervention."
NACI Commentary:
In chronic diseases, an economic model follows individuals with the health condition of interest over a length of time, known as the time horizon. In infectious diseases, an economic model may follow (i) only those with infection, or (ii) those with and without infection, over a length of time. The former does not consider disease dynamics (i.e., transmission of pathogens between individuals or segments of populations). Hence, the time horizon of this type of infectious disease model may be thought of similarly to that of a chronic disease model. The time horizon here can be referred to as an individual-level time horizon. The latter infectious disease model considers disease dynamics. The time horizon here can be referred to as a population-/ program-level time horizon.
Individual-level time horizon: Length of time to follow a single cohort/ individuals. When choosing this time horizon, the researchers should consider:
- Duration of vaccine effectivenessFootnote 3
- Reductions in chronic sequelae (e.g., deafness or neurological deficits after meningitis) due to the vaccineFootnote 3
- Delayed disease outcomes (e.g., cervical cancer or decompensated liver disease) due to the vaccineFootnote 3
A lifetime time horizon is often recommended if the vaccine is expected to impact survival or to provide benefits that persist for the remainder of a person's life.Footnote 5,Footnote 6 However, a lifetime time horizon will almost always involve extrapolating data beyond the follow-up time of available clinical trials or observational studies. This adds uncertainty to the analysis. Short time horizons can be justified if the duration of effectiveness, and relevant costs and effects are captured within that time frame. For instance, a short time horizon is appropriate in the case of an acute infection that does not have long term sequelae.Footnote 6 Sensitivity analyses should be conducted for different time horizons.
Population-level time horizon: Length of time required to achieve herd immunity effects after the implementation of a vaccine program. In other words, this is the number of cohorts modelled. Usually, dynamic models simulate the epidemiology prior to the vaccine program (known as a run-in/ burn-in phase), the epidemiology after program implementation (known as an evaluation phase), and the epidemiology after estimates reach a plateau (i.e., when epidemiological estimates, such as disease outcomes, stabilize and no longer change over time).Footnote 5 This last phase is known as steady state. Researchers should let the model run until steady state is achieved, which means the population-level time horizon should not be defined prior to the analysis.Footnote 5
This time horizon can have a substantial impact on the results of a dynamic model.Footnote 7 Hence, the German Standing Committee on Vaccination (STIKO) recommends reporting cost-effectiveness results from the steady state phase, as well as from varying points of time before the steady-state.Footnote 8
NACI Interim Statement:
In the reference case, the individual-level time horizon should be long enough to capture all relevant differences in the future costs and outcomes associated with the interventions being compared. Thus, the time horizon should be based on the condition and the likely impact of the intervention.
The population-level time horizon should not be defined prior to the analysis, as the model should be run until steady state is achieved.
7. Discounting
CADTH Statement(s):
"7.1 In the reference case, costs and outcomes that occur beyond one year should be discounted to present values at a rate of 1.5% per year.
7.2. The impact of uncertainty in the discount rate should be assessed by comparing the results of the reference case to those from non-reference case analyses, using discount rates of 0% and 3% per year."
NACI Commentary:
Unlike other curative therapies, the cost-effectiveness of vaccine programs is likely highly sensitive to discounting.Footnote 9 This is because benefits are not necessarily accrued immediately after vaccination. Rather, benefits are accrued over the longer term. For instance, a vaccine administered today can take effect after many years (i.e., avoid cervical cancer after human papilloma virus vaccination). Or, a vaccine that prevents premature death or chronic disability at early ages (i.e., polio, fatal rotavirus) can have benefits that last for the rest of the beneficiary's lifetime and beyond to future generations.Footnote 9 The cost-effectiveness of vaccine programs is highly sensitive to discounting distant benefits into present value because those benefits may be given little weight.
For this reason, some health economists argue that health effects should be discounted at a lower rate than costs (i.e., differential discounting).Footnote 9 However, some paradoxical situations can occur with differential discounting (known as the Keeler-Cretin paradox).Footnote 10 In brief, researchers may see the most cost-effective results if an intervention is postponed indefinitely into the future. Most guidelines recommend discounting costs and outcomes at the same rate.Footnote 9 One agency has suggested exploring lower discount rates in sensitivity analysis when the time horizon is over 30 years.Footnote 11 Others have suggested considering a non-constant (declining) discount rate.Footnote 9
The methodological discussions on discounting will continue to evolve. The Interim Guidelines will follow the CADTH recommendations of using constant discount rates for both costs and effects at 1.5%, 0%, and 3%. Cost-effectiveness results discounted at 0% (also called undiscounted) and results discounted at 3% represent the range of possible results due to discounting. Cost-effectiveness results from differential discount rates and declining discount rates should fall within this range.
NACI Interim Statement:
No change to CADTH statement
8. Modelling
CADTH Statement(s):
"8.1 Model conceptualization and development should address the decision problem.
[p. 33 [Model conceptualization] involves the development of a model structure that is defined by specific states or events and the relationships among them that together constitute the clinical or care pathway for the condition of interest and the interventions being compared.]
8.4. The choice of modelling technique should be justified. The approach should be no more complex than is necessary to address the decision problem.
[p.34 There are many decision-modelling techniques available to researchers when conducting economic evaluations, including decision trees, cohort-level state-transition models (i.e., Markov models), patient-level state-transition models (i.e., microsimulations or first order Monte Carlo simulations), system dynamic models, discrete event simulation models, and agent-based models.]"
NACI Commentary:
Model Conceptualization: In infectious disease modelling, the natural history of infection and disease are commonly represented by the following model structures:
- SIS (susceptible-infectious- susceptible): Assumes no natural immunity
- SIR (susceptible-infectious-recovered): Assumes a host can only be infected once over the model time horizon
- SIRS (susceptible-infectious-recovered-susceptible): Assumes a host is protected from re-infection after recovering until natural immunity wanes
- SEIR (susceptible-exposed-infectious-recovered): Assumes a SIR model with an additional latency period where the host is infected but does not transmit infection
Modelling Technique: Modelling can predict the impact of vaccines on the disease epidemiology on the population-level rather than on the individual-level.Footnote 12 Models can be described by combinations of the following three model attributes:Footnote 13
- Static versus dynamic
- Static model: Assumes a constant risk of infection (i.e., force of infection) in susceptible individuals. Although the transmissible nature of infectious diseases cannot be captured by static models, they may still be appropriate for modelling disease epidemiology in certain cases:
- when vaccine coverage is low (which means the vaccine is unlikely to change the force of infection)Footnote 14
- when the group targeted for vaccination does not impact overall transmission or prevent the circulation of the pathogen (which means the vaccine is unlikely to change the force of infection); (e.g., hepatitis A vaccination in travelers from low- to high-incidence countries)Footnote 14
- when the vaccine does not produce "potential negative direct or indirect health effects (e.g., changes in the average age of those infected, serotype replacement, or changes in outbreak periodicity at different coverage rates")Footnote 3
- when the decision-maker is only interested in a conservative estimate of cost-effectiveness for a vaccine compared to no intervention.Footnote 12 (For example, if a static model shows the vaccine is cost-effective, then a dynamic model will likely predict the vaccine is even more cost-effective. This is because the dynamic model can capture indirect protection via herd immunity and can predict a faster reduction in the number of infections)Footnote 12
- Dynamic model: Assumes the risk of infection in susceptible individuals is a function of the proportion of the population infected. Common metrics for infection risk are the basic reproduction number and effective reproduction number. Dynamic models can account for indirect effects such as herd immunity, natural immunity, and age distribution shifts. There are various instances where dynamic models are appropriate for modelling disease epidemiology:
- when the vaccine impacts disease transmission (e.g., "decreasing the proportion susceptible (e.g., mass vaccination), contact rates between individuals (e.g., closing schools during a pandemic), the duration of infectiousness, or the probability of transmission per act")Footnote 14
- when the vaccine induces selective pressures on that pathogen, allowing some types to gain a competitive advantage (i.e., strain replacement)Footnote 14
- Static model: Assumes a constant risk of infection (i.e., force of infection) in susceptible individuals. Although the transmissible nature of infectious diseases cannot be captured by static models, they may still be appropriate for modelling disease epidemiology in certain cases:
- Deterministic versus stochastic
- Deterministic model: Events occur in a pre-specified way set by the parameter values and initial model conditionsFootnote 13
- Stochastic model: Events in the model occur by chance.Footnote 13
- Population-based versus individual-based
- Population-based model: Tracks groups. Individuals are assigned to compartments (also known as health states) and are assumed to be homogeneous in that health state. They transition to different health states based on parameter values at the aggregate level.
- Individual-based model: Tracks individuals. Individuals are modelled with their own patient characteristics, allowing for population heterogeneity to be captured. They transition to different compartments based on parameters values at the individual level and their history can be tracked. Individual-based models, by their nature, are stochastic (not deterministic).Footnote 13
In infectious disease modelling, the following combinations of model attributes are common:
- Dynamic, stochastic, population-based: An example is the system dynamics model, where groups of individuals transition between health states based on differential equations
- Dynamic, stochastic, individual-based: Examples include the agent-based model and the discrete-event simulation, where individuals (not groups) transition between health states. The main difference between an agent-based model and a discrete-event simulation is that the modelling unit is individuals (also called agents) in the former, and is events in the latter.Footnote 16
- Static, deterministic, population-based: Examples include decision trees, state-transition Markov models, or hybrids of the two.Footnote 13 These models are commonly seen in economic evaluations of chronic conditions
- Static, stochastic, individual-based: An example is the state-transition microsimulation
NACI Interim Statement:
The choice of modelling technique should be justified. The approach should be no more complex than is necessary to address the decision problem. Researchers should consider transmission dynamics, as appropriate.
Figure 4. World Health Organization flow chart15 for model choice adopted by Ultsch.5
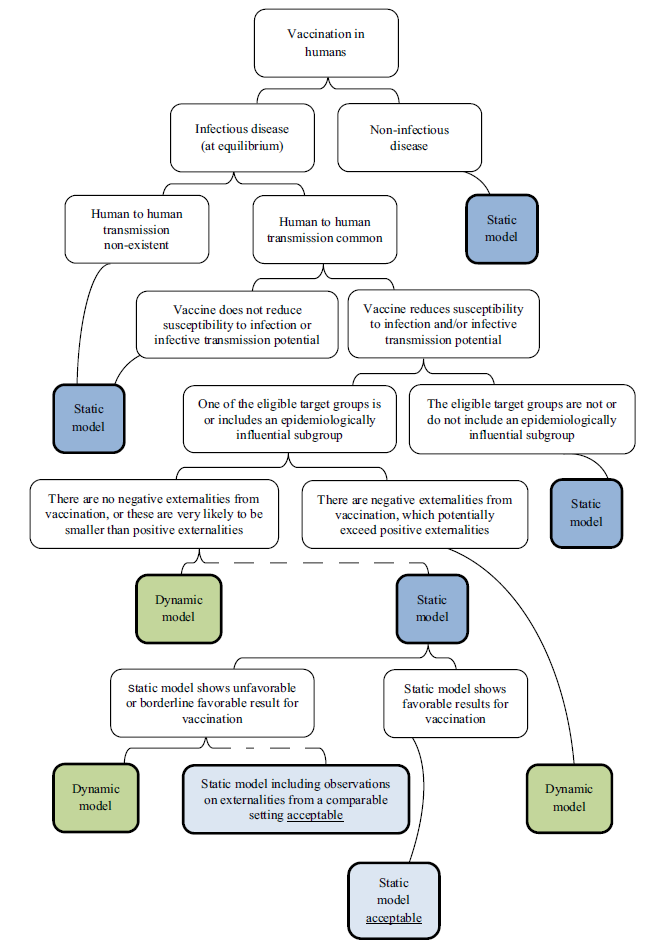
Figure 4 - Text Description
This figure is a flow chart developed by the World Health Organization to guide researchers in selecting the type of model (dynamic vs. static). The flow chart begins at the top with the concept of modelling vaccination in humans. This concept splits into two considerations: infectious disease (at equilibrium) on the left and non-infectious disease on the right. For a non-infectious disease, a static model is recommended. For an infectious disease, the flow chart splits depending on whether human to human transmission is common (on the right) or non-existent (on the left). Where human to human transmission is non-existent, a static model is recommended. If human to human transmission is common, the flow chart splits again depending on whether the vaccine does (right), or does not (left), reduce susceptibility to infection or infective transmission potential. If the vaccine does not reduce susceptibility to infection or infective transmission potential, a static model is recommended. Otherwise, the flow chart splits depending on whether on of the eligible target groups is/includes an epidemiologically influential subgroup (left) or not (right). The target groups do not include an epidemiologically influential subgroup, a static model is recommended. Otherwise, the flow chart splits depending on whether there are negative externalities from vaccination, which potentially exceed positive externalities (right) or not (left). If there are negative externalities, a dynamic model is recommended. If there are no negative externalities, or they are likely to be smaller than positive externalities, then a dynamic model is recommended. A dotted line shows how a static model may also be acceptable depending on additional considerations. The flow chart shows these considerations by splitting from the static model depending on whether the static model shows unfavourable or borderline favourable results for vaccination (right) or not (left). If the static model shows favourable results for vaccination, then a static model is acceptable. If the static model does not show favourable (or borderline favourable) results for vaccination then a dynamic model is recommended or a static model that includes observations on externalities from a comparable setting is acceptable.
9. Effectiveness
CADTH Statement(s):
"9.1. A comprehensive search of the available data sources should be conducted to inform the estimates of effectiveness and harms associated with the interventions. Report the included studies and methods used to select or combine the data.
9.3. Researchers should evaluate and justify the validity of any surrogate end points used for parameter estimation. Uncertainty in the association of the surrogate to the final clinical outcome should be reflected in the reference case probabilistic analysis. This uncertainty can also be explored through appropriate scenario analyses. The existence of multiple potential surrogates should be reflected in the analysis of uncertainty. When considering the use of biomarkers as surrogate end points, the researcher should evaluate and justify the validity of the biomarker and the degree to which the biomarker satisfies the criteria of a surrogate end point."
NACI Commentary:
Efficacy and effectiveness data of vaccines often come from randomized controlled trials and surveillance studies, respectively. When researchers use randomized controlled trial data, they should be aware that efficacy will be underestimated because indirect effects are not captured.Footnote 14 Trials recruit a small fraction of the population and thus do not experience a reduced force of infection.Footnote 14 Further, trials often assess surrogate end points such as immune response. Consequently, researchers need to extrapolate to hard end points such as mortality and morbidity.Footnote 14 Sensitivity analyses should be conducted for different assumptions for extrapolating future vaccine benefit (i.e., continuous treatment effect, one-time effect, rebound effect, etc.)Footnote 4 When researchers use surveillance study data, they should be aware that only individuals with sufficiently severe symptoms will present to the healthcare system for diagnosis and care.Footnote 14 Hence disease incidence may be underestimated and disease severity, hospitalization and case-fatality may be overestimated.Footnote 14
For data on adverse events from immunization, researchers should be aware that adverse events may not be observed in clinical trials (due to their small size compared to a vaccination program). Signals should be considered in sensitivity analysis.
Other data required for building epidemiologic models include:
- Disease incidence and mortalityFootnote 3
- Vaccine coverageFootnote 3
- Waning of immunityFootnote 3
- Force of infectionFootnote 3
- Social contact matrices Footnote 3
- Compliance with full schedulesFootnote 15
Interim Statement:
No change to CADTH statement
10. Measurement and Valuation of Health
CADTH Statement(s):
"10.1. In the reference case, the QALY should be used as the method for capturing the value of the effect of an intervention."
NACI Commentary:
In the vaccine literature, economic evaluations often value health using the metric, disability-adjusted life year (DALY) averted, but also the quality-adjusted life-year (QALY) gained. This choice appears to be based on historic reasons, rather than on inherent advantages of one over the other.Footnote 17 The World Health Organization had promoted the use of DALYs in their Global Burden of Disease study. Cost-per-DALY studies are more commonly used in low and lower-middle income countries, whereas cost-per-QALY studies are more commonly used in upper-middle income and high-income countries.Footnote 17 The Interim Guidelines will follow the CADTH recommendations of using the QALY metric.
Given that a societal perspective is often of interest in the context of vaccines, non-health effects should be valued where possible and appropriate (see Section 5: Perspective).
NACI Interim Statement:
No change to CADTH statement
11. Resource Use and Costs
CADTH Statement(s):
"11.1. In the reference case, researchers should systematically identify, measure, value, and report all relevant resources based on the perspective of the publicly funded health care payer. When a range of perspectives is relevant to the decision problem, researchers should classify resources and their associated costs in categories according to each perspective, reporting results separately for the reference case perspective and any additional non-reference case perspectives."
NACI Commentary:
Direct costs for vaccine and infectious disease modelling may include:Footnote 15
- Supplies (i.e., vaccine purchase, syringes, safety boxes)
- Program costs (i.e., labour, vaccine administration; note there may be cost variations across P/T's and across facility volumes)
- Public health costs (i.e., contact tracing, outbreak response)
- Disease surveillance
- Distribution system (i.e., transport and cold storage)
- Vaccine wastage and waste management
- Adverse events from immunization
Given that a societal perspective is often of interest in the context of vaccines, non-health costs should be valued where possible and appropriate (see Section 5: Perspective). Researchers should consider "any potential spillover impacts beyond those individuals for whom the interventions are being targeted. For example, an intervention aimed at patients may have spillover impacts on informal caregivers due to changes in the level of care required by patients".Footnote 1
Note that there may be significant variations in epidemiology (i.e., disease burden) and vaccine administration costs across P/T's. Researchers may consider using Canadian averages for both. Researchers may also consider using P/T-specific estimates for different scenarios to represent a range of possible cost-effectiveness results.
NACI Interim Statement:
No change to CADTH statement
12. Analysis
CADTH Statement(s):
"12.4. In the reference case, expected values of costs and outcomes should be derived through probabilistic analysis, whereby all uncertain parameters are defined probabilistically."
NACI Commentary:
Many current guidelines recommend conducting probabilistic analyses as part of sensitivity analysis.Footnote 3,Footnote 6,Footnote 15 The CADTH Guidelines appear singular, where they recommend conducting probabilistic analyses as the reference case rather than as sensitivity analysis.Footnote 1
The International Society for Pharmacoeconomics and Outcomes Research (ISPOR) Task Force on dynamic modelling in 2012 did not include probabilistic sensitivity analysis as part of their best practice recommendations.Footnote 14 They noted methodological challenges for dynamic models, where "many of the parameters related to mixing and transmission are correlated and these correlations need to be preserved to ensure sensible models and reasonable fit to data".Footnote 14 A separate ISPOR Task Force on vaccines in 2018 recommended performing probabilistic sensitivity analysis to generate acceptability curves.Footnote 3
NACI Interim Statement:
In the reference case for static models, expected values of costs and outcomes should be derived through probabilistic analysis, whereby all uncertain parameters are defined probabilistically.
For dynamic models, researchers should use their best judgement to determine if probabilistic analyses are appropriate (if at all).
For sensitivity analyses, researchers can consider deterministic analyses of parameter uncertainty (i.e., one-way, multi-way, or threshold analyses).
National Advisory Committee on Immunization (NACI): Supporting Tool #5
Standard Operating Procedure on Reporting Economic Evaluations of Vaccines
Module F
Purpose
The purpose of the standard operating procedure (SOP) is to provide guidance on how to report economic evaluations to NACI.
Development of SOP
We conducted an environmental scan of the grey literature to identify guidance on how to report economic evaluations. We searched the following:
- CADTH "Grey Matters: a practical tool for searching health-related grey literature"- This is a comprehensive list of Canadian and international HTA agencies
- Google search engine
- EQUATOR Network -This is an online database of reporting guidelines
- NITAGs
We reviewed relevant reporting guidelines and consolidated elements for minimum standard reporting:
- Consolidated Health Economic Evaluation Reporting Standards (CHEERS)Footnote 18
- CADTH Methods for the Economic Evaluation of Health Technologies - Section 15 on ReportingFootnote 1
- WHO guide for standardization of economic evaluations of immunization programmesFootnote 19
- WWORTH SOP for Economic EvaluationFootnote 20,
- HIQA - Guidelines for the Economic Evaluation of Health Technologies in Ireland (2018)Footnote 21
- EUNETHA - European Network for Health Technology AssessmentFootnote 22
- Developing NICE guidelines: the Manual - Approaches to bespoke economic evaluationFootnote 23
- Belgian guidelines for economic evaluations and budget impact analyses: 2nd Ed.Footnote 24
- Health Quality Ontario (HQO) - Health Technology Assessment Methods and Process GuideFootnote 25
- Haute Autorité de Santé (HAS) - Choices in Methods for Economic Evaluation (2012)Footnote 26
- Guideline for Economic Evaluations in Healthcare - Zorginstituut Netherlands (2016)Footnote 27
- Methods for Health Economic Evaluation of Vaccines and Immunization Decision Frameworks: A Consensus Framework from a European Vaccine Economics CommunityFootnote 5
- Economic evaluation using decision analytical modelling: design, conduct, analysis, and reportingFootnote 28
- Increasing the generalizability of economic evaluations: recommendations for the design, analysis, and reporting of studiesFootnote 29
- Good Research Practices for Cost-Effectiveness Analysis Alongside Clinical Trials: The ISPOR RCT-CEA Task Force ReportFootnote 30
- Economic evaluation alongside randomised controlled trials: design, conduct, analysis, and reportingFootnote 31
- U.S. Advisory Committee on Immunization Practices (ACIP) Handbook for Developing Evidence-based RecommendationsFootnote 32
- Modelling methods for predicting epidemiological and health economic effects of vaccinations - Guidance for analyses to be presented to the German Standing Committee on Vaccination (STIKO)Footnote 8
- Peter J. Neumann, Theodore G. Ganiats, Louise B. Russell. Cost-Effectiveness in health and medicine. New York Oxford University Press. 2017Footnote 33
Below, we provide guidance in the form of a checklist, as well as provide standard templates for tables/ figures when reporting to NACI. The recommended content can appear in the main report or technical appendix.
Reporting Guidelines - Checklist
| Section | Recommendation on How to Report |
|---|---|
| 1. Title |
|
| 2. Executive Summary |
|
| 3. Background and Decision Problem |
|
| 4. Target Population and Subgroups |
|
| 5. Interventions and Comparators |
|
| 6. Study Perspective |
|
| 7. Time Horizon |
|
| 8. Discount Rate |
|
| 9. Choice of Health Outcomes |
|
| 10. Measurement of Effectiveness |
|
| 11. Measurement and Valuation of Preference-based Outcomes |
|
| 12. Resource Use and Costs |
Ex.) Indirect costs of carers, sick pay, productivity lossFootnote 22 |
| 13. Currency, price, date and conversion |
|
| 14. Modelling |
|
| 15. Study Parameters |
|
| 16. Assumptions |
Ex.) Vaccine-related assumptions can include:
Other assumptions can include:
|
| 17. Characterizing Heterogeneity |
|
| 18. Characterizing Uncertainty |
|
| 19. Analytical Methods |
|
| 20. Validation and Calibration |
|
| 21. Incremental Costs and Outcomes |
|
| 22. Limitations, Generalizability and Key Findings |
|
| 23. Equity Considerations |
|
| 24. Sources of funding |
|
| 25. Conflicts of Interest |
|
Reporting Guidelines - Templates for Tables/ Figures
Below are sample templates for your consideration:
| Type of analysis | Cost-utility analysis |
|---|---|
| Disease | Pneumococcal disease (pneumonia, otitis media, invasive pneumococcal disease) |
| Population | Infants (birth cohort) |
| Intervention | PCV13 |
| Comparator(s) | No vaccine |
| Outcomes | Cases, deaths, DALYs/QALYs, cost |
| Perspective | Healthcare payer |
| Time horizon | Lifetime |
| Discounting | 1.5% |
| Sensitivity analysis | Base case, scenarios, deterministic sensitivity analysis |
| Type of model | Single disease with multiple manifestations; decision tree |
| Variable | Description | Mean | Range/ Distribution & parameters (e.g. SD, 95% CI, α1, α2…) | Source |
|---|---|---|---|---|
| Reference Case: | no data | no data | no data | no data |
| A | no data | no data | no data | no data |
| B | no data | no data | no data | no data |
| Scenario Analysis: | no data | no data | no data | no data |
| A | no data | no data | no data | no data |
| B | no data | no data | no data | no data |
| Abbreviations: SD = standard deviation; CI = confidence interval | ||||
| Cost Variable | Unit Cost | Number of units | Billing code/ Description | Source |
|---|---|---|---|---|
| A | no data | no data | no data | no data |
| B | no data | no data | no data | no data |
| C | no data | no data | no data | no data |
| no data | Vaccine Program A | Vaccine Program B | Vaccine Program C |
|---|---|---|---|
| Clinical outcomes: | |||
| LYs | no data | no data | no data |
| Cases averted | no data | no data | no data |
| Hospitalizations averted | no data | no data | no data |
| Deaths averted | no data | no data | no data |
| QALYs | |||
| Costs: | |||
| Vaccine-related | no data | no data | no data |
| Downstream | no data | no data | no data |
| Total | no data | no data | no data |
| Incremental Cost per QALY Gained (ICER): | |||
| Versus Program A | no data | no data | no data |
| Sequential ICER | no data | no data | no data |
If relevant, i.e., if the intervention is not dominated or dominant. Consider reporting confidence intervals/ credibility intervals Abbreviations: ICER = incremental cost-effectiveness ratio; QALY = quality-adjusted life-year |
|||
Consider reporting other tables/ figures:
- Schematic of model structure
- Cost-effectiveness plane
- Cost-effectiveness acceptability curve
- Tornado diagram
- Two-way sensitivity analysis for vaccine cost and vaccine effectiveness
National Advisory Committee on Immunization (NACI): Supporting Tool #6
Standard Operating Procedure (SOP) for National Advisory Committee on immunization: Systematic Reviews of Economic Evaluations
Module G
Purpose
This standard operating procedure (SOP) outlines the steps that are needed to conduct a systematic review of economic evaluations for NACI
Introduction
The National Advisory Committee on Immunization (NACI) regularly produces recommendations, statements and updates related to the use of vaccines currently or newly approved for use in humans in Canada. The Centre for Immunization and Respiratory Infectious Diseases (CIRID) of the Public Health Agency of Canada (PHAC) provides direct support for this work. One form of this direct support is completion of economic evaluations and/ or systematic reviews of economic evaluations on various vaccines as a means of gathering evidence related to vaccines.
Search and development
1.1 Research Question, PICO (TS)
A systematic review of economic evaluations should be conducted in accordance with the Preferred Reporting Items for Systematic Reviews and Meta-Analyses (PRISMAFootnote 34) guidelines. Research questions and objectives evaluating a systematic review of economic evaluations are defined and include the population, intervention, comparator(s), and outcome(s) of interest. Where relevant, research questions also address whether a specific timing or type of study and setting are of interest. (PICO (TS))
1.2 Inclusion and Exclusion criteria
Systematic review inclusion criteria should include: study population, intervention, language, dates included, countries and types of study; cost-utility analysis (CUA), cost-effectiveness analysis (CEA), cost-benefit analysis (CBA), as well as anything else relevant to the systematic review.
1.3 Register with PROSPERO
The systematic review of economic evaluations should be registered with PROSPERO during the initial stages of research development. PROSPEROFootnote 35 is an international database of registered systematic reviews in health and social care, welfare, public health, education, crime, justice, and international development, where there is a health related outcome. Features from the protocol are recorded and maintained as a permanent record. PROSPERO is produced by the Centre for Reviews and Dissemination and funded by the National Institute for Health Research (NIHR).
1.4 Develop Search Strategy
The search strategy should be developed with a research librarian (Health Canada) using medical subject headings (MeSH) and text words related to economic evaluations, cost-effectiveness, and the disease area. NACI strongly recommends the use of the Canadian Agency of Drugs and Technologies in Health (CADTH) search filters for Economic Evaluations/Cost/Economic ModelsFootnote 36. At the minimum, the following three recommended electronic databases should be searched: MEDLINE, EMBASE, and The Cochrane Library, which includes the Health Technology Assessment Database (HTA), the NHS Economic Evaluation Database (NHS EED) and the Database of Abstracts of Reviews of Effects (DARE). The Health Canada librarian can run the search and provide search results.
1.5 Grey Literature Search Strategy
NACI recommends the use of CADTH's search tool for grey literature that focuses on health technology assessments and economic evaluationsFootnote 37. (Please see Grey Literature Search Extraction Table 1). Also, please contact organizations directly for grey literature that is not publicly available.
1.6 Organize the References and Distiller SR
NACI recommends the use of Distiller SRFootnote 38 or equivalent software for managing and tracking screening; however Excel could be used as well. DistillerSR is systematic review software that manages, tracks, and streamlines the screening, data extraction, and reporting processes of systematic reviews and literature reviews.
1.7 Revise the proposed search strategy, inclusion/exclusion criteria, PICO (TS) and PROSPERO registration
The search strategy, study inclusion / exclusion criteria, PICO (TS) and registration with PROSPERO should be done in consultation with PHAC, working groups (WG) and in consultation with Health Canada librarians. Revise the proposed search strategy, inclusion/exclusion criteria, PICO (TS) and PROSPERO registration based on feedback from these groups.
Screening, data extraction and quality appraisals
2.1 Retrieve Abstracts and Relevant Literature
Retrieve abstracts and relevant literature from the Health Canada librarian search.
2.2 Conduct Abstract and Full Text Screen
Conduct abstract and full text screen based on the inclusion/exclusion criteria. At the beginning of the screening process, complete a reviewer calibration using a sample size of the total number of studies (suggestion of 5% or another reasonable number) between the two reviewers to ensure consistency. Two reviewers conduct title abstract level 1 screening and full text level 2 screening. Conflicts should be resolved through discussion, and if needed via a third reviewer.
2.3 Hand searching of bibliographies of included studies.
Hand search the bibliographies of included studies.
2.4 Complete Data Extraction Template
To complete the data extraction template, two extractors extract in duplicate and agree on the results. (Please see Data Extraction Table 1a, 1b and 1c. They can be merged into one table for extraction purposes). NACI encourages proper documentation for data extraction. Data extraction forms are to be submitted to PHAC. This data may also be made available for public access.
2.5 Quality appraisal
For quality appraisal of the included studies, use The Joanna Briggs Institute Critical Appraisal Checklist for Economic EvaluationsFootnote 39. Two reviewers assess quality in duplicate and agree on assessment. Quality appraisal can be done in Distiller SR or Excel concurrently during data extraction or after data extraction. (See Data Extraction Table 2 and Report Figure 1)
Reviewers need to work with PHAC and the NACI WG to make the decision of whether to include or exclude low quality studies and to consider the appropriateness of excluding low quality studies. For instance, reviewers could report only the "best evidence" by including studies deemed high quality or acceptable and excluding unacceptable studiesFootnote 40. Reviewers can work with PHAC and NACI WG to determine the essential appraisal questions. Studies can be considered "high quality" if they satisfy essential appraisal questions and do not have any severe deficiencies. Studies can be considered "acceptable" if they satisfy essential appraisal questions, but have some minor deficiencies in other sections of the quality appraisal. Studies can be considered "unacceptable" if they have clear issues across essential questions in the quality appraisal. Screening out these low quality studies may prevent bias from being introduced into the final dataset and from potentially generating misleading results.
JBI does not include a summary score; however, the stacked bar graphs (Report Figure 1) may be able to provide a visual representation of the quality of the studies. Reviewers are to discuss with PHAC and the NACI WG if they want to use alternative/ additional quality appraisal tool(s) based on the research question.
2.6 Vaccine Model-specific appraisal
For the vaccine model-specific appraisal, use the World Health Organization (WHO) guide for standardization of economic evaluations of immunization programmes, chapter 6Footnote 15. Two reviewers assess the quality in duplicate and agree on assessment. (See Data Extraction Table 3 and Report Figure 1).
Note: In appraising the model, the reviewers should also consider vaccine-specific items such as:
- Herd immunity
- Natural immunity
- Supplies (i.e., vaccines, syringes, safety boxes)
- Public health costs (i.e., contact tracing)
- Disease surveillance
- Distribution system (i.e., transport and cold storage)
- Vaccine wastage and waste management
2.7 Applicability and Transferability appraisal
Transferability of ICERs: NACI recommends that an Applicability and Transferability tool be used to measure the fit to the Canadian context (see Data Extraction Table 3 and Report Figure 1):
- Recommended tools are either Heyland's generalizability criteria
- Or Antonanzas' transferability indexFootnote 42 (formula is not necessary just use the checklist)
- Or a combination of both
Summary and results
3.1 Inclusion of Studies
Reviewers should describe if they are reporting on all studies or if they are reporting on select studies based on their quality or on conflict of interest.
In terms of obtaining grey literature that is not publicly available, report which organizations were contacted, whether multiple attempts were made to contact them, and whether you were successful in obtaining the grey literature.
Reviewers can comment on publication bias.
Reviewers may also consider a stratified analysis where studies with conflicts of interest are excluded from analysis.
3.2 Summary
Prepare a summary of the included studies. Prepare a PRISMA Flow Diagram, track documents and synthesize the included studies for PHAC and the relevant NACI Working Group(s) for comment and feedback. The summary will focus on a high level synthesis of the literature retrieved and includes, but is not limited to, a summary of: (Use a version of Data Extraction Table 1a, 1b and 1c or Report Table 1)
- Location of study;
- Year of study;
- Population and subgroups;
- Age range/ gestational age;
- Health condition;
- Intervention/ comparator;
- Funding;
- Vaccine Coverage and duration of Protection
- Vaccine Schedule assessed;
- Study designs;
- Type of study design, analytic technique
- Study perspective;
- Time horizon, discount rate;
- Cost outcome;
- Effectiveness outcomes;
- Results, ICERs, Net health/ monetary benefit, reduction in hospitalization etc.;
- Influential parameters from Sensitivity Analysis, results from influential parameters;
- Stratified analysis excluding those with conflicts of interest (COIs)
3.3 Inflate the Incremental Cost- Effectiveness Ratios (ICER)
Inflate ICERs (or any monetary outcomes) to current Canadian dollars by converting the local currency to Canadian dollars using the Organization for Economic Co-operation and Development's (OECD) purchasing power parity rates, then the Bank of Canada's inflation rates. Note: Keep the unadjusted and adjusted ICERs for analysis purposes
3.4 Prepare evidence tables and any summary measures
Prepare evidence tables and any summary measures for all studies included in the review as per specifications of NACI methodology. (See Report Tables 1 - 3)
Update the literature review prior to preparation of report and update as per input from PHAC, relevant NACI WG(s) and if required, NACI. NACI encourages proper documentation for all evidence tables and summary measures. All evidence tables and summary measures are to be submitted to PHAC. This data may be made available for public access.
What's needed in the report
4.1 What's needed in the report?
1. Executive Summary/Abstract
2. Introduction
3. Detailed Technical Report Methods
- Methods - Search Strategy, PROSPERO registration number
- PICO(TS), Eligibility criteria (Inclusion / Exclusion criteria)
- Screening, data extraction, quality appraisal and vaccine model-specific appraisal.
- Critical appraisal/Planned analysis (subgroup analysis) and evidence synthesis (or descriptive reporting)
- Reviewers' conflicts of interest or funding source(s)
4. Results
- PRISMA Flow chart of studies screened and included, use of PRISMA guidelinesFootnote 34
- Summary/ Overview of studies included (Patient characteristics, study characteristics) (Report Table 1)
- Summary of Economic analytic technique, Model Structure if applicable, Perspective, Time horizon, Discount rate, Health outcomes measured, Cost outcomes measured and Vaccination cost.
- Main Results and Conclusions
- Preference to have reviewers report both discounted and undiscounted results.
-
For all studies conducted in non-Canadian jurisdictions report the cost-effectiveness threshold of the country.
Preference to have reviewers report unconverted ICERs and converted ICERs (in CAD and converted/inflated) in the results table. (Report Table 2 and 3)
- Graphical representation of ICERs (e.g. scatterplot, or histogram) to illustrate cost-effectiveness in a cost-effectiveness plane or in relation to another variable (e.g. incidence of X, age of patients).
- Canadian Results and Conclusions (Report Table 2 and/or 3)
- Highlights of Canadian studies, summary of results
- Summary of ICERs
- Conclusions
- Comparison of Canadian Studies
- Description of Sensitivity Analysis/Scenario analysis (i.e., one-way, PSA, threshold analysis, etc. how methodological, parameter, and structural uncertainty were addressed). As well, report findings of sensitivity analysis and which variables the analysis were sensitive to.
- Study Sponsorship and any potential impact on cost-effectiveness results. Stratified analysis excluding those with COIs. Reviewers could also provide a narrative summary on industry results versus other results.
5. Discussion/ Overall Conclusions
- Brief summary of key findings
- Limitations and strengths of the review
- Transferability of ICERs: Recommend that an Applicability and Transferability tool be used to measure the fit to the Canadian context
- Recommended tools are either Heyland's generalizability criteria
- Or Antonanzas' transferability index (formula is not necessary just use the checklist)
- Or a combination of both
(Please answer questions in excel, yes, no or unclear as well as an answer to justify your answer) (See Data Extraction Table 4)
4.2 Tables/ Figures/ Appendices
- Full search strategy
- PRISMA Flow chart
- Grey Literature Search Extraction Table 1
- Data Extraction Table: Characteristics to Review Studies; (Data Extraction Table 1a, 1b, 1c)
- Report Table: Detailed Characteristics of Included Studies (examples: Author, year, perspective, study type, comparators, population, model type, time horizon, discount rate, cost-effectiveness threshold, included interventions and results); (Report Table 1 or combination of Data Extraction Table 1a, 1b, 1c)
- Table/ Figure: Critical appraisal, Model appraisal and Transferability appraisal for individual studies (Data Extraction Table 2, 3 and 4) and as a summary figure (stacked bar charts); (Report Figure 1)
- List/ Frequency history for the influential parameters from the sensitivity analysis
- Additional graphical representation of ICERs (e.g. scatterplot, or histogram) to illustrate cost-effectiveness in a cost-effectiveness plane or in relation to another variable (e.g. incidence of X, age of patients). May consider adding additional graphs for subgroups of interest.
- Cost-effectives results table (Report Table 2 and 3)
- Stratified analysis excluding those with COIs. (Modified Report Table 2 or 3 for excluding industry studies or COIs)
Definitions
- SOP: Standard operating procedure
- NACI: The National Advisory Committee on Immunization
- CIRID: The Centre for Immunization and Respiratory Infectious Diseases
- PHAC: Public Health Agency of Canada
- PRISMA: Preferred Reporting Items for Systematic Reviews and Meta-Analyses
- PICO (TS): Population, intervention, comparator(s), and outcome(s) of interest (specific timing or type of study and setting)
- CUA: Cost-utility analysis
- CEA: Cost-effectiveness analysis
- CBA: Cost-benefit analysis
- PROSPERO: International database of registered systematic reviews in health and social care, welfare, public health, education, crime, justice, and international development, where there is a health related outcome. Features from the protocol are recorded and maintained as a permanent record. PROSPERO is produced by the Centre for Reviews and Dissemination and funded by the National Institute for Health Research (NIHR).
- HC: Health Canada
- MeSH: Medical subject headings
- CADTH: Canadian Agency of Drugs and Technologies in Health
- HTA: Health Technology Assessment Database
- NHS EED: NHS Economic Evaluation Database
- DARE: Database of Abstracts of Reviews of Effects
- DistillerSR is systematic review software that manages, tracks, and streamlines the screening, data extraction, and reporting processes of systematic reviews and literature reviews.
- WG: Working groups
- WHO: World Health Organization
- ICER: Incremental Cost- Effectiveness Ratios
- OECD: Organization for Economic Co-operation and Development
- PSA: Probabilistic sensitivity analysis
- ID: Identifier
- AEFI: Adverse event following immunization
- CE: Cost-effectiveness
- GA: Gestational Age
- QALY: Quality-adjusted life year
- COI: Certificate of Insurance
Template for grey literature search strategy
All Tables are examples and items may be modified, added to or deleted based on your discretion and on your review. NACI encourages proper documentation for all evidence tables, figures and summary measures. They are to be submitted to PHAC. This data may be made available for public access.
| Resource/ Website | Search Terms | Number of Results Screened | Number of Results Retained |
|---|---|---|---|
| no data | no data | no data | no data |
| no data | no data | no data | no data |
| no data | no data | no data | no data |
Templates for data extraction
All Tables are examples and items may be modified, added to or deleted based on your discretion and on your review.
NACI encourages proper documentation for data extraction. Data extraction forms are to be submitted to PHAC. This data may also be made available for public access.
| Author, Year | Age range/ Gestational age | Location of Study | Population and Subgroups | Characteristics of population and Setting | Health Condition | Intervention/ Comparator | Herd Effect | Vaccine Coverage and Duration of Protection | Funding / Funding Source |
|---|---|---|---|---|---|---|---|---|---|
| no data | no data | (Country) | no data | no data | no data | no data | (Yes/ No) | no data | (Yes/ No) and Source |
| no data | no data | no data | no data | no data | no data | no data | no data | no data | no data |
| no data | no data | no data | no data | no data | no data | no data | no data | no data | no data |
(All tables can be broken up into more categories if needed) * Optional Categories: Reference ID, Direct Vaccine Efficacy, Strain Coverage, Protection Against Carriage and Adverse event following immunization (AEFI) |
|||||||||
| Author, Year | Analytic technique | Study design | Study perspective | Dosing schedule assessed | Time horizon and discount rate | Cost outcome | Cost of intervention | Effectiveness outcomes | Threshold used |
|---|---|---|---|---|---|---|---|---|---|
| no data | (e.g., CBA, CEA, CUA) | (e.g. decision analysis, Markov, etc.) | no data | no data | (Years, %) | (Currency, year) | no data | ($/ QALY, hospital admission avoided) | no data |
| no data | no data | no data | no data | no data | no data | no data | no data | no data | no data |
| no data | no data | no data | no data | no data | no data | no data | no data | no data | no data |
(All tables can be broken up into more categories if needed) * Optional Categories: Reference ID, Hospitalization Rate, Mortality Rate and Reduction in Hospitalization, Reduction in Mortality |
|||||||||
| Author, Year | Results for CE or Health Outcomes | Results for CE or Health Outcomes Units | Results Context | Result Conclusion | Type of Sensitivity Analysis | Influential Parameters from SA | Results from Influential Parameters |
|---|---|---|---|---|---|---|---|
| no data | (absolute numbers, Cost/ QALY, reduction in hospitalization etc) | $/QALY | no data | (Cost-effective or not?) | (e.g. 1-way, PSA) | (e.g. CE to not, and vice versa) | no data |
| no data | no data | no data | no data | no data | no data | no data | no data |
| no data | no data | no data | no data | no data | no data | no data | no data |
(All tables can be broken up into more categories if needed) * Optional Categories: Reference ID, Scenario Analysis and Results from Scenario Analysis **Note tables can be used for Data Extraction or inclusion in report |
|||||||
| Author, Year | Yes/No/Unclear | Comments |
|---|---|---|
| Q1: Is there a well-defined question? | no data | no data |
| Q2: Is there comprehensive description of alternatives? | no data | no data |
| Q3: Are all important and relevant costs and outcomes for each alternative identified? | no data | no data |
| Q4: Has clinical effectiveness been established? | no data | no data |
| Q5: Are costs and outcomes measured accurately? | no data | no data |
| Q6: Are costs and outcomes valued credibly? | no data | no data |
| Q7: Are costs and outcomes adjusted for differential timing? | no data | no data |
| Q8: Is there an incremental analysis of costs and consequences? | no data | no data |
| Q9: Were sensitivity analyses conducted to investigate uncertainty in estimates of cost or consequences? | no data | no data |
| Q10: Do study results include all issues of concern to users? | no data | no data |
| Q11: Are the results generalizable to the setting of interest in the review? | no data | no data |
| Author, Year | Yes/No/Unclear | Comments |
|---|---|---|
| Q1: Model structure and assumptions | no data | no data |
| Q2: Model type | no data | no data |
| Q3: Validation (i.e., verification, calibration) | no data | no data |
| Q4: Vaccine Specific Considerations: | no data | no data |
| a. Herd immunity | no data | no data |
| b. Natural immunity | no data | no data |
| c. Supplies (i.e., vaccines, syringes, safety boxes) | no data | no data |
| d. Public health costs (i.e., contact tracing) | no data | no data |
| e. Disease surveillance | no data | no data |
| f. Distribution system (i.e., transport and cold storage) | no data | no data |
| g. Vaccine wastage and waste management | no data | no data |
Questions for vaccine model-specific appraisal
- Are the model structure and implicit or explicit assumptions clearly described?
- Is the model type (static, dynamic or stochastic) clearly stated and justified in light of likely changes to the force of infection and the role of chance in the transmission process? Have the model's strengths and weaknesses been discussed?
- Has the model been validated? If so, has it been validated in as many facets of validation as possible?
- Vaccine Specific Considerations:
- Herd immunity
- Natural immunity
- Supplies (i.e., vaccines, syringes, safety boxes)
- Public health costs (i.e., contact tracing)
- Disease surveillance
- Distribution system (i.e., transport and cold storage)
- Vaccine wastage and waste management
Please answer questions in excel, yes, no or unclear as well as an answer to justify your answer for either Heyland's generalizability criteria or Antonanzas' transferability index (without formula) or a combination of both.
Example: Heyland's Generalizability Criteria
| Author, Year | Yes/No/Unclear | Comments |
|---|---|---|
| Q1: Clinical generalizability; patients described in the analysis similar to those patients you see in your own setting? | no data | no data |
| Q2: Systems generalizability; viewpoint relevant to your clinical setting/situation? | no data | no data |
| Q3: Intervention under study generalizable to your setting? | no data | no data |
| Q4: Costing methods applicable | no data | no data |
| Q4a: Unit price | no data | no data |
| Q4b: Mix of resources consumed the same? | no data | no data |
| Q4c: Average cost per patient, similar across systems? | no data | no data |
| Q4d: Convert exchange rates across countries appropriately? | no data | no data |
| Q5: Outcomes measured appropriate to your setting? | no data | no data |
| Q5a: Method to measure the outcomes compatible | no data | no data |
| Q5B: Preferences of your patients are the same as those preferences used in the analysis? | no data | no data |
| Q6: Discount rate applicable to your setting? | no data | no data |
Templates for report: tables and figures
Please consider the following table/ figure templates when writing the NACI report. Items in the tables may be modified, added to or deleted based on your discretion and on your review. Formatting should be followed however.
NACI encourages proper documentation for all evidence tables, figures and summary measures. They are to be submitted to PHAC. This data may be made available for public access.
| Health conditions reported | Number of studies* |
|---|---|
| Pre-term | no data |
| <=32 weeks GA | no data |
| 32-35 weeks GA | no data |
| Health Conditions | no data |
| Other risk factors | no data |
| NR or healthy | no data |
| Country | Number of studies |
| US | no data |
| Canada | no data |
| UK etc. | no data |
| Age (months) | Cumulative number of estimates from all studies* |
| < 3 months | no data |
| < 6 months | no data |
| < 12 months | |
| <24 months | no data |
| Not reported | no data |
| Outcomes | Number of studies |
| Cost per cases averted | no data |
| Cost per hospitalizations averted | no data |
| Cost per QALY | no data |
| Other | no data |
| Industry Sponsored | Number of studies |
| Yes | no data |
| No | no data |
*Can exceed total n since some studies report multiple population, scenarios, and outcomes (Can add more outcomes of characteristics that are study specific) |
|
| Authors, Year | Country | Perspective | Analytic Technique | Study Design | Outcome Measure | Population | Time Horizon | Industry Funding |
|---|---|---|---|---|---|---|---|---|
| no data | no data | no data | no data | no data | no data | no data | no data | no data |
| no data | no data | no data | no data | no data | no data | no data | no data | no data |
| no data | no data | no data | no data | no data | no data | no data | no data | no data |
*Analytic Technique = CUA or CEA or CBA, Study Design = Markov model, piggyback trial, etc. |
||||||||
Report Figure 1a. Quality Appraisal: Proportion of appraisal items met in each study
Vaccine Model-Specific Appraisal: Proportion of appraisal items met in each study
Transferability Appraisal: Proportion of criteria considered generalizable/ applicable in each study
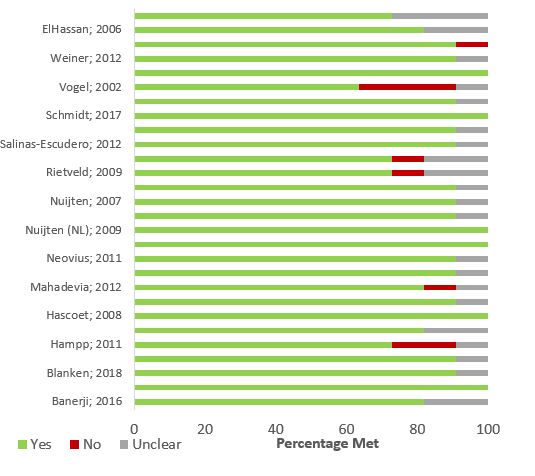
Report Figure 1a - Text Description
This generic figure shows a horizontal stacked bar graph. Each horizontal bar represents a study, labelled by its author and year of publication on the y axis. The x axis is labelled as "Percentage Met" and ranges from 0% to 100%. The purpose of the figure is to show the proportion of items/ criteria met by each study. In other words, if using this figure to depict the results of the quality appraisal, the stacked bar graph will show how many of the appraisal items in the checklist were met, not met, or were unclear. To show this visually, each study's horizontal bar is comprised of up to three bars-- green represents "Yes", red represents "No", and grey represents "Unclear". The smaller bars all add up to 100%.
Report Figure 1b. Quality Appraisal: Proportion of appraisal items met in each study
Vaccine Model-Specific Appraisal: Proportion of appraisal items met in each study
Transferability Appraisal: Proportion of criteria considered generalizable/ applicable in each study
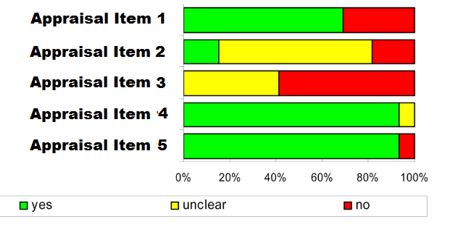
Report Figure 1b - Text Description
This generic figure shows a horizontal stacked bar graph. Each horizontal bar represents a checklist item/ criterion, labelled as "Item 1", "Item 2", and so forth in the y axis. The x axis represents the proportion of studies meeting each checklist item/ criterion and ranges from 0% to 100%. Each item/ criterion's horizontal bar is comprised of up to three bars-- green represents "Yes", red represents "No", and yellow represents "Unclear". The smaller bars all add up to 100%. Note that this figure is similar to Figure 1 except that its axes are flipped.
| no data | Health Conditions* | ||||||
|---|---|---|---|---|---|---|---|
| no data | BPD | CHD | Healthy | Pre-term | Pre-term with BPD | Pre-term with risk factors | Other risk factors* |
| Number of estimates | no data | no data | no data | no data | no data | no data | no data |
| ICER (Minimum) | no data | no data | Dominant | no data | no data | no data | Dominant |
| ICER (Maximum) | no data | no data | no data | no data | no data | no data | no data |
| Proportion of estimates CE at $50,000/QALY | no data | no data | no data | no data | no data | no data | no data |
| Proportion of estimates CE at $100,000/QALY | no data | no data | no data | no data | no data | no data | no data |
| Proportion of estimates CE at $200,000/QALY | no data | no data | no data | no data | no data | no data | no data |
*Health conditions that pertain to your Economic Systematic Review |
|||||||
| Study Author & Year | Condition | weeks GA | Perspective | ICER (Original) | Currency Year | ICER (2017 CAD per QALY) |
|---|---|---|---|---|---|---|
| no data | no data | no data | no data | no data | no data | no data |
| no data | no data | no data | no data | no data | no data | no data |
| no data | no data | no data | no data | no data | no data | no data |
| no data | no data | no data | no data | no data | no data | no data |
| no data | no data | no data | no data | no data | no data | no data |
National Advisory Committee on Immunization (NACI): Supporting Tool #7
Presentation Template for Presenting Economic Evaluations
Module H
Slide 7-1. Title of study (should clearly represent the study question)

Slide 7-1 - Text Description
Slide 7-1. Title of study (should clearly represent the study question)
Authors names and affiliations
Can include logos, as desired, to identify affiliation of authors
Slide 7-2. Conflicts of Interest and Funding
Slide 7-2 - Text Description
Slide 7-2. Conflicts of Interest and Funding
- List any potential conflicts of interest for each author. If there are no potential conflicts of interest, a statement to that effect must be included (e.g., Author A: No conflicts of interest).
- Describe how the study was funded and the role of the funder in the identification, design, conduct, and reporting of the analysis. Describe other non-monetary sources.
Slide 7-3. Decision Problem
Slide 7-3 - Text Description
Slide 7-3. Decision Problem
- The study question should be well defined, stated in an answerable form and relevant to the decision the target audience is facing.
- For example: What is the cost-effectiveness of routinely vaccinating age group XX against Disease Y, using vaccine Z compared to the current approach of A?
Slide 7-4. Methods (Title Page)
Slide 7-4 - Text Description
Slide 7-4. Methods (Title Page)
Slide 7-5. Methods: PICO
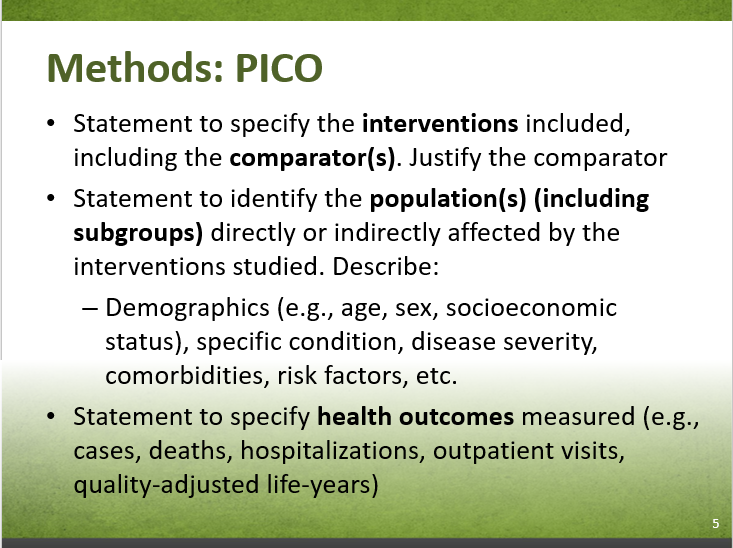
Slide 7-5 - Text Description
Slide 7-5. Methods: PICO
- Statement to specify the interventions included, including the comparator(s). Justify the comparator
- Statement to identify the population(s) (including subgroups) directly or indirectly affected by the interventions studied. Describe:
- Demographics (e.g., age, sex, socioeconomic status), specific condition, disease severity, comorbidities, risk factors, etc.
- Statement to specify health outcomes measured (e.g., cases, deaths, hospitalizations, outpatient visits, quality-adjusted life-years)
Slide 7-6. Methods: Study Design
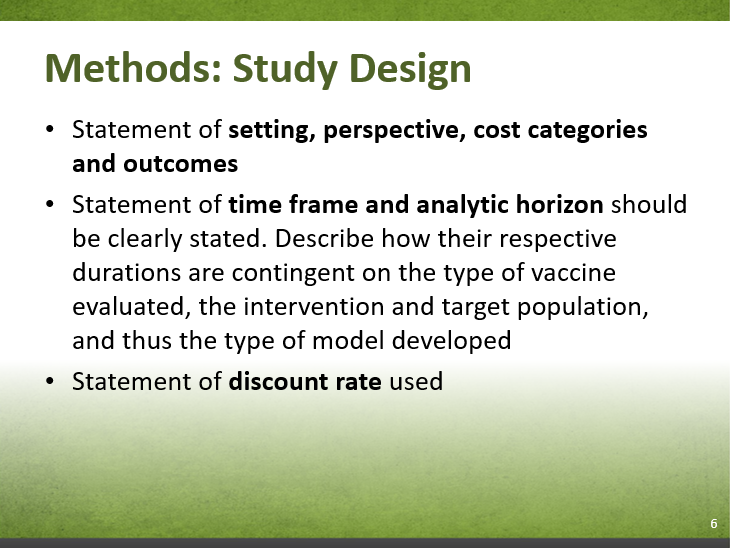
Slide 7-6 - Text Description
Slide 7-6. Methods: Study Design
- Statement of setting, perspective, cost categories and outcomes
- Statement of time frame and analytic horizon should be clearly stated. Describe how their respective durations are contingent on the type of vaccine evaluated, the intervention and target population, and thus the type of model developed
- Statement of discount rate used
Slide 7-7. Methods: Economic Model

Slide 7-7 - Text Description
Slide 7-7. Methods: Economic Model
- Specify analytic method
- Identify summary measure
- Cost per case averted = etc., etc.
- This could be presented as a word equation such as
- Cost per case averted = etc., etc.
- Identify summary measure
- Simple statement of economic model
- Schematic of model structure
- Describe - and give reasons for - the specific type of analytical decision model used. If applicable, describe why was a dynamic model not used?
Slide 7-8. Methods: Dynamic Model
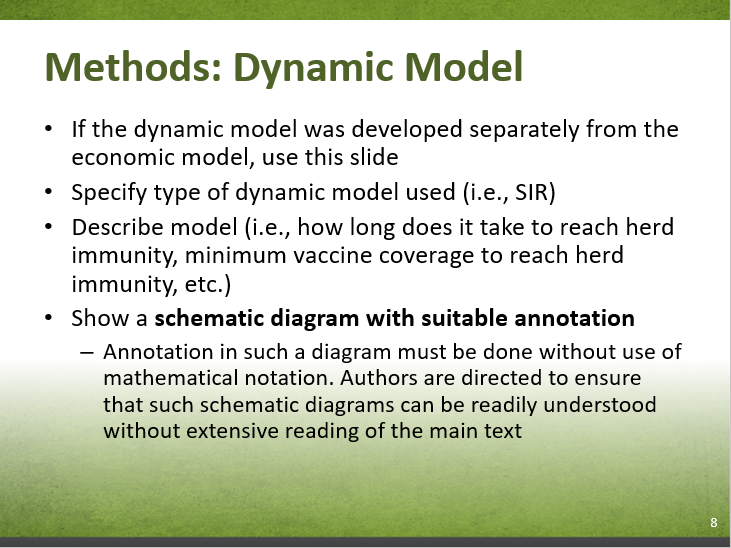
Slide 7-8 - Text Description
Slide 7-8. Methods: Dynamic Model
- If the dynamic model was developed separately from the economic model, use this slide
- Specify type of dynamic model used (i.e., SIR)
- Describe model (i.e., how long does it take to reach herd immunity, minimum vaccine coverage to reach herd immunity, etc.)
- Show a schematic diagram with suitable annotation
- Annotation in such a diagram must be done without use of mathematical notation. Authors are directed to ensure that such schematic diagrams can be readily understood without extensive reading of the main text
Slide 7-9. Methods: Key Assumptions
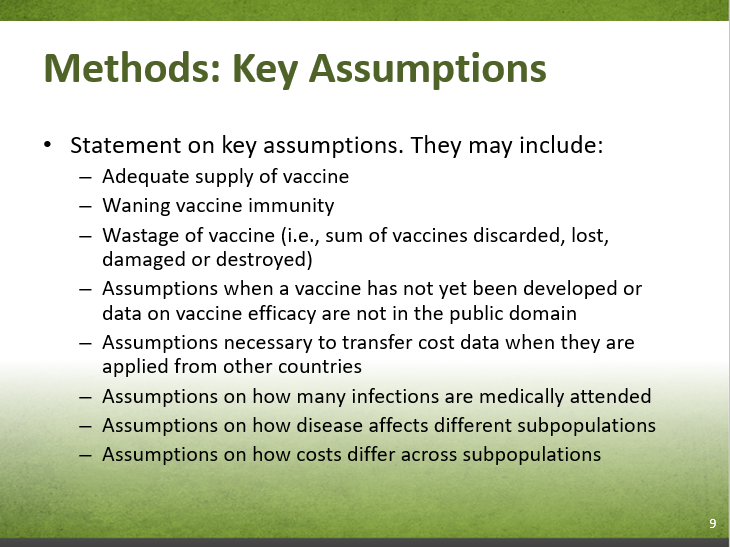
Slide 7-9 - Text Description
Slide 7-9. Methods: Key Assumptions
- Statement on key assumptions. They may include:
- Adequate supply of vaccine
- Waning vaccine immunity
- Wastage of vaccine (i.e., sum of vaccines discarded, lost, damaged or destroyed)
- Assumptions when a vaccine has not yet been developed or data on vaccine efficacy are not in the public domain
- Assumptions necessary to transfer cost data when they are applied from other countries
- Assumptions on how many infections are medically attended
- Assumptions on how disease affects different subpopulations
- Assumptions on how costs differ across subpopulations
Slide 7-10. Reference Case: Key Inputs
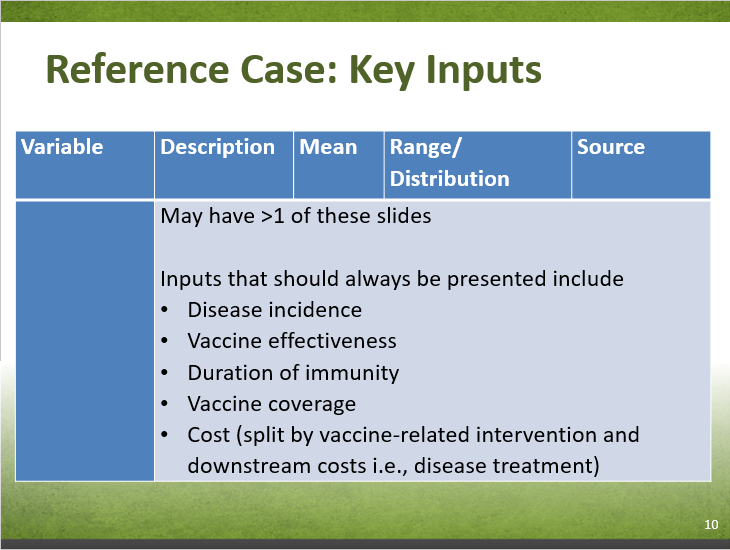
Slide 7-10 - Text Description
Slide 7-10. Reference Case: Key Inputs
| Variable | Description | Mean | Range/Distribution | Source |
|---|---|---|---|---|
| no data | May have >1 of these slides Inputs that should always be presented include:
|
|||
Slide 7-11. Methods: Sensitivity Analyses

Slide 7-11 - Text Description
Slide 7-11. Methods: Sensitivity Analyses
- Description of what sensitivity analyses were conducted
- Type (i.e., probabilistic, two-way SA for vaccine cost and vaccine effectiveness, threshold analyses, scenario analyses for relevant perspectives, best- and worst-case)
- Variables included
- Ranges/ distributions and data sources
Slide 7-12. Summary of Methods
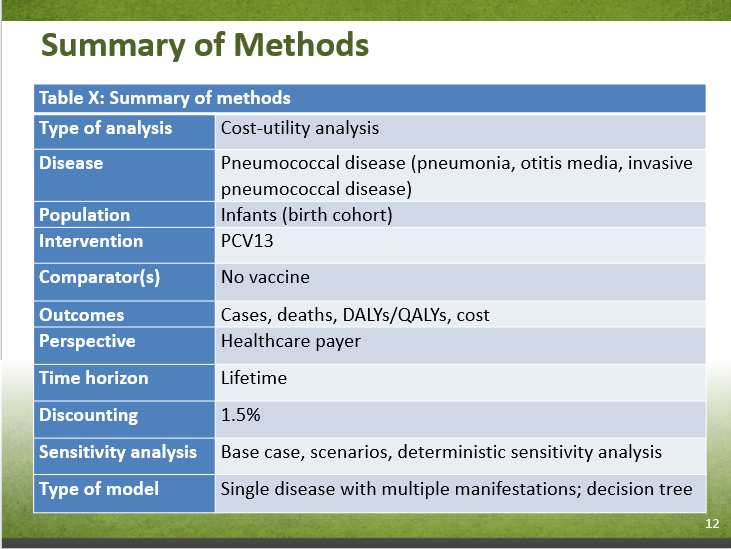
Slide 7-12 - Text Description
Slide 7-12. Example Template: Table X: Summary of Methods
- Type of analysis
- Cost-utility analysis
- Disease
- Pneumococcal disease (pneumonia, otitis media, invasive pneumococcal disease)
- Population
- Infants (birth cohort)
- Intervention
- PCV13
- Comparator(s)
- No vaccine
- Outcomes
- Cases, deaths, DALYs/QALYs, cost
- Perspective
- Healthcare payer
- Time horizon
- Lifetime
- Discounting
- 1.5%
- Sensitivity analysis
- Base case, scenarios, deterministic sensitivity analysis
- Type of model
- Single disease with multiple manifestations; decision tree
Slide 7-13. Results (Title page)

Slide 7-13 - Text Description
Slide 7-13. Results (Title page)
Slide 7-14. Results
Slide 7-14 - Text Description
Slide 7-14. Results
- Present:
- Health outcomes
- Costs
- Summary measure(s) - combining health outcomes and costs
- These could be presented in either a table or a graph. (See sample table in the next slide. Also see SOP for recommended tables and figures)
Slide 7-15. Table X.
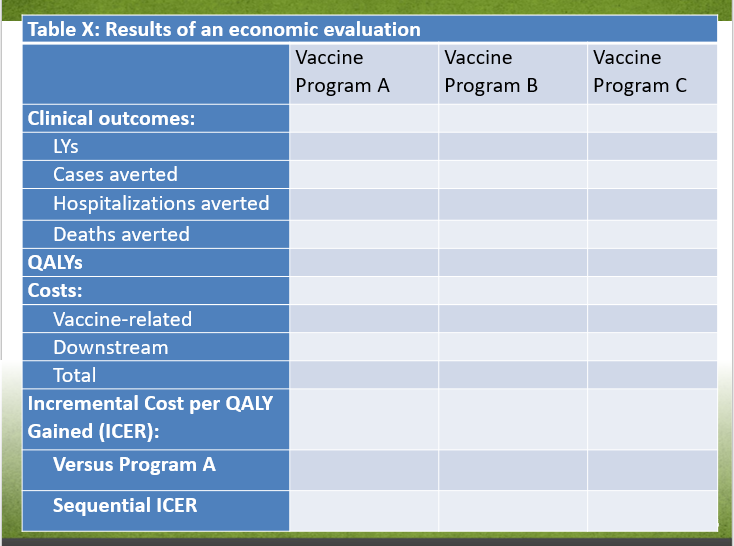
Slide 7-15 - Text Description
Slide 7-15. Example Template: Table X: Results of an economic evaluation
| no data | Vaccine Program A | Vaccine Program B | Vaccine Program C |
|---|---|---|---|
| Clinical outcomes: | |||
| LYs | no data | no data | no data |
| Cases averted | no data | no data | no data |
| Hospitalizations averted | no data | no data | no data |
| Deaths averted | no data | no data | no data |
| QALYs | |||
| Costs: | |||
| Vaccine-related | no data | no data | no data |
| Downstream | no data | no data | no data |
| Total | no data | no data | no data |
| Incremental Cost per QALY Gained (ICER): | |||
| Versus Program A | no data | no data | no data |
| Sequential ICER | no data | no data | no data |
Slide 7-16. Results: Additional Results

Slide 7-16 - Text Description
Slide 7-16. Results: Additional Results
- 1-2 tables and/or graphs presenting some additional results (See SOP for recommended tables and figures)
Slide 7-17. Results: Sensitivity Analyses

Slide 7-17 - Text Description
Slide 7-17. Results: Sensitivity Analyses
- 1-2 slides presenting tables or graphs showing results from sensitivity analyses
Slide 7-18. Results: Influential Variables
Slide 7-18 - Text Description
Slide 7-18. Results: Influential Variables
- List/table/graph of influential variables (typically 3-5) (See SOP for recommended tables and figures)
- Include how they might change results
Slide 7-19. Limitations and Generalizability
Slide 7-19 - Text Description
Slide 7-19. Limitations and Generalizability
- List of important limitations and how they may impact the conclusions
- Comment on generalizability (i.e., regional differences in terms of disease epidemiology, population characteristics, clinical practice patterns, resource-use patterns, unit costs, and other factors of relevance. Where differences exist, discuss the impact on the results (expected direction and magnitude), and the conclusions.)
Slide 7-20. Key Findings

Slide 7-20 - Text Description
Slide 7-20. Key Findings
- Summarize the key findings of the study
Slide 7-21. Relation to Other Studies

Slide 7-21 - Text Description
Slide 7-21. Relation to Other Studies
- If appropriate, compare results to results from other studies, including a fulsome discussion on comparability, differences, and significance. Could be presented as a list or table.
Slide 7-22. References

Slide 7-22 - Text Description
Slide 7-22. References
Slide 7-23. Supplementary Material

Slide 7-23 - Text Description
Slide 7-23. Supplementary Material
National Advisory Committee on Immunization (NACI): Supporting Tool #8
Presentation Template for Presenting Systematic Reviews
Module I
Slide 8-1. Title of systematic review on economic evaluations (should clearly represent the study question)

Slide 8-1 - Text Description
Slide 8-1. Title of systematic review on economic evaluations (should clearly represent the study question)
Authors names and affiliations
Can include logos, as desired, to identify affiliation of authors
Slide 8-2. Conflicts of Interest and Funding
Slide 8-2 - Text Description
Slide 8-2. Conflicts of Interest and Funding
- List any potential conflicts of interest for each author. If there are no potential conflicts of interest, a statement to that effect must be included (e.g., Author A: No conflicts of interest).
- Describe how the study was funded and the role of the funder in the identification, design, conduct, and reporting of the analysis. Describe other non-monetary sources.
Slide 8-3. Research Question

Slide 8-3 - Text Description
Slide 8-3. Research Question
- Define PICO (TS)
- Where relevant, address type of study and setting are of interest
Slide 8-4. Methods [Please keep to 1 - 2 slides]
![Slide 8-4. Methods [Please keep to 1 - 2 slides]. Text description follows.](/content/dam/phac-aspc/images/programs/process-incorporating-economic-evidence-federal-vaccine-recommendations-stakeholder-consultation/slide8-4-eng.png)
Slide 8-4 - Text Description
Slide 8-4. Methods [Please keep to 1 - 2 slides]
Search Strategy:
- State time frame searched & rationale for it (if applicable)
Inclusion and Exclusion Criteria:
- Please list
Reporting:
- Outcomes are reported in CAD [index year]
If any methods diverged from the NACI SOP, please briefly describe here (in terms of the search strategy, appraisal tools used, etc.)
Slide 8-5. PRISMA Flow Diagram

Slide 8-5 - Text Description
Slide 8-5. PRISMA Flow Diagram
- This slide marks the beginning of the "Results" section
- Please provide diagram
Slide 8-6. Overview of Included Studies (N =)
Slide 8-6 - Text Description
Slide 8-6. Overview of Included Studies (N =)
Study Characteristics
- Countries/ jurisdictions (n =)
- Model-based (n =) versus Non-model-based (n =)
- Studies funded by industry (n =)
- Years of publication
- Etc.
Patient Characteristics
- Relevance to PICO of interest (i.e., age, health condition, comparator, etc.)
Slide 8-7. I. Overview of Non-Model Studies (N =) [such as trial-based studies, studies based on admin data, etc.]
![Slide 8-7. I. Overview of Non-Model Studies (N =) [such as trial-based studies, studies based on admin data, etc.]. Text description follows.](/content/dam/phac-aspc/images/programs/process-incorporating-economic-evidence-federal-vaccine-recommendations-stakeholder-consultation/slide8-7-eng.png)
Slide 8-7 - Text Description
Slide 8-7. I. Overview of Non-Model Studies (N =) [such as trial-based studies, studies based on admin data, etc.]
- Comparators
- Perspective
- Types of sensitivity analysis
- Sample size(s)
- Time horizon(s)
- Choice of effectiveness outcomes/ intermediate outcomes
- Analysis: comment on protocol driven care vs. clinical practice; how missing/ censored/ skewed data were handled
- Etc.
Slide 8-8. II. Overview of Economic Models (N =)
Slide 8-8 - Text Description
Slide 8-8. II. Overview of Economic Models (N =)
- Types of models (i.e., Markov, agent-based, etc.)
- Comment on model structure, if possible (i.e., what were the health states)
- Perspective(s) used
- Time horizon(s) used
- Types of sensitivity analyses conducted
- Assessment of study quality
- Etc.
Slide 8-9. II. Economic Models, Key Model Parameters
Slide 8-9 - Text Description
Slide 8-9. II. Economic Models, Key Model Parameters
- Provide the average and range of some key model parameters
- Mandatory variables to report: vaccine cost, vaccine effectiveness, epidemiology (i.e., incidence)
- Influential parameters
- Etc.
- For face validity
Slide 8-10. Summary of Results

Slide 8-10 - Text Description
Slide 8-10. Summary of Results
- Report clinical outcomes, cost outcomes, and ICER outcomes in graphical or tabular form
- Consider disaggregating outcomes
- Specify if the ICERs are sequential or against a reference case (specify comparator)
- Consider presenting key parameters (i.e., vaccine price, vaccine effectiveness, epidemiology) alongside results
- Consider presenting sensitivity analyses (i.e., deterministic, probabilistic)
- See SOP example tables (i.e., Report Table 2 and 3; as well as following 2 slides)
Slide 8-11. Example Results Table #1
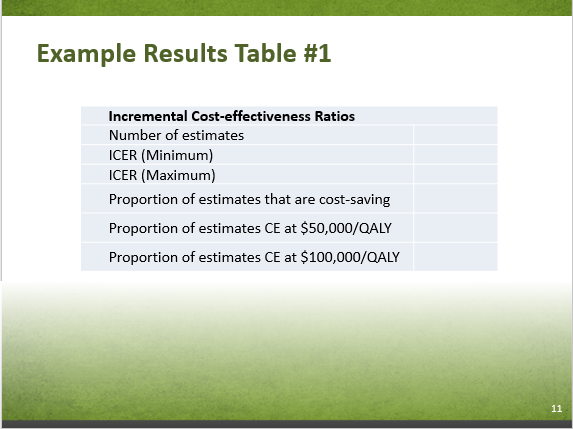
Slide 8-11 - Text Description
Slide 8-11. Example Results Table #1
| Incremental Cost-effectiveness Ratios | |
|---|---|
| Number of estimates | no data |
| ICER (Minimum) | no data |
| ICER (Maximum) | no data |
| Proportion of estimates that are cost-saving | no data |
| Proportion of estimates CE at $50,000/QALY | no data |
| Proportion of estimates CE at $100,000/QALY | no data |
Slide 8-12. Example Results Table #2
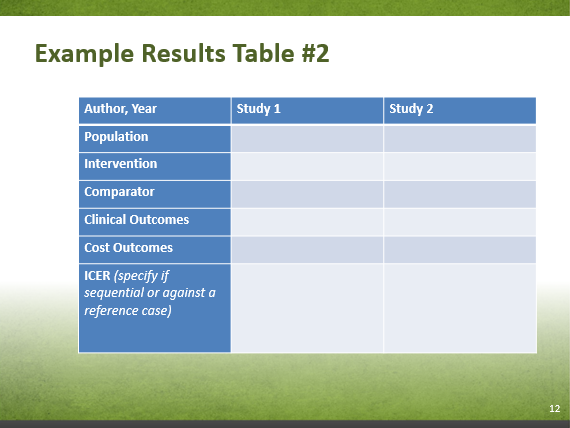
Slide 8-12 - Text Description
Slide 8-12. Example Results Table #2
| Author, Year | Study 1 | Study 2 |
|---|---|---|
| Population | no data | no data |
| Intervention | no data | no data |
| Comparator | no data | no data |
| Clinical Outcomes | no data | no data |
| Cost Outcomes | no data | no data |
| ICER (specify if sequential or against a reference case) | no data | no data |
Slide 8-13. Stratified Results
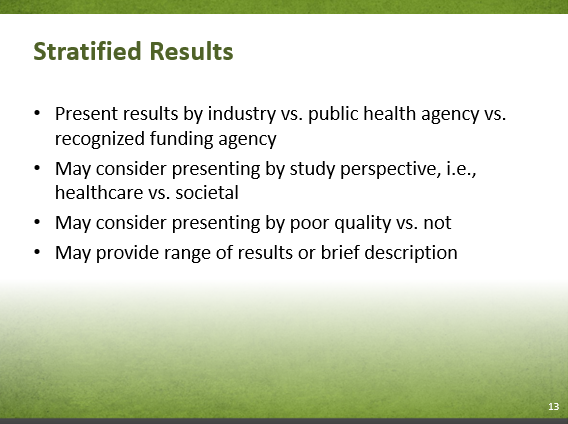
Slide 8-13 - Text Description
Slide 8-13. Stratified Results
- Present results by industry vs. public health agency vs. recognized funding agency
- May consider presenting by study perspective, i.e., healthcare vs. societal
- May consider presenting by poor quality vs. not
- May provide range of results or brief description
Slide 8-14. Canadian Studies (N =)

Slide 8-14 - Text Description
Slide 8-14. Canadian Studies (N =)
- State key findings
- Compare results to non-Canadian studies
- Industry funding (n =)
- Discuss study quality and applicability to PICO of interest
Slide 8-15. Key Findings and Discussion
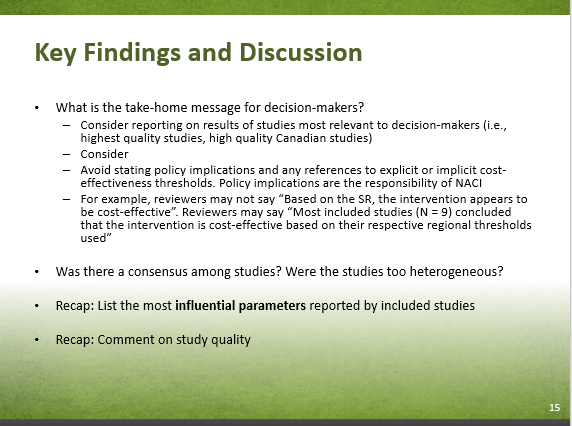
Slide 8-15 - Text Description
Slide 8-15. Key Findings and Discussion
- What is the take-home message for decision-makers?
- Consider reporting on results of studies most relevant to decision-makers (i.e., highest quality studies, high quality Canadian studies)
- Consider
- Avoid stating policy implications and any references to explicit or implicit cost-effectiveness thresholds. Policy implications are the responsibility of NACI
- For example, reviewers may not say "Based on the SR, the intervention appears to be cost-effective". Reviewers may say "Most included studies (N = 9) concluded that the intervention is cost-effective based on their respective regional thresholds used"
- Was there a consensus among studies? Were the studies too heterogeneous?
- Recap: List the most influential parameters reported by included studies
- Recap: Comment on study quality
Slide 8-16. Strengths and Limitations
Slide 8-16 - Text Description
Slide 8-16. Strengths and Limitations
- Of the included studies (i.e., Were disease dynamics appropriately captured? Were the data sources appropriate?)
- Of the systematic review itself
Slide 8-17. Generalizability
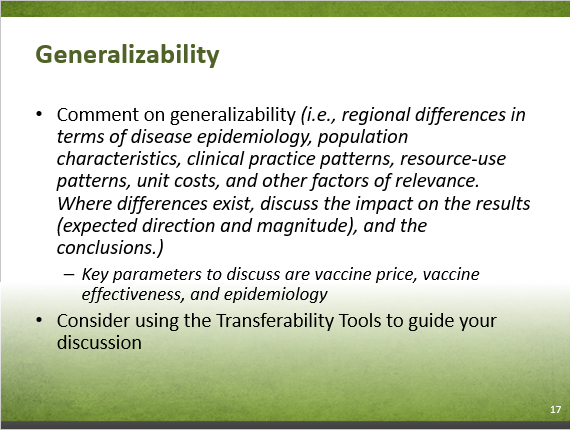
Slide 8-17 - Text Description
Slide 8-17. Generalizability
- Comment on generalizability (i.e., regional differences in terms of disease epidemiology, population characteristics, clinical practice patterns, resource-use patterns, unit costs, and other factors of relevance. Where differences exist, discuss the impact on the results (expected direction and magnitude), and the conclusions.)
- Key parameters to discuss are vaccine price, vaccine effectiveness, and epidemiology
- Consider using the Transferability Tools to guide your discussion
Slide 8-18. References

Slide 8-18 - Text Description
Slide 8-18. References
Slide 8-19. Supplementary Material

Slide 8-19 - Text Description
Slide 8-19. Supplementary Material
References
- Reference 1
-
Canadian Agency for Drugs and Technologies in Health. Guidelines for the economic evaluation of health technologies: Canada. 4th ed. Ottawa: CADTH; 2017 Mar.
- Reference 2
-
Lieu T, Meltzer M, ML M. Guidance for health economics studies presented to the Advisory Committee on Immunization Practices (ACIP). Centers for Disease Control and Prevention. Atlanta, GA. 2008. Available from: www.cdc.gov/vaccines/recs/acip/economic-studies.htm.
- Reference 3
-
Mauskopf J, Standaert B, Connolly M, et al. ISPOR Task Force Report: Economic Analysis of Vaccination Programs. Value Health. Oct 2018;21(10):1133-1149. doi: 1110.1016/j.jval.2018.1108.1005.
- Reference 4
-
Drummond MF. Methods for the economic evaluation of health care programmes. Oxford; New York: Oxford University Press; 1997.
- Reference 5
-
Ultsch B, Damm O, Beutels P, et al. Methods for Health Economic Evaluation of Vaccines and Immunization Decision Frameworks: A Consensus Framework from a European Vaccine Economics Community. Pharmacoeconomics. Mar 2016;34(3):227-244. doi: 210.1007/s40273-40015-40335-40272.
- Reference 6
-
National Institute for Health and Care Excellence. Guide to the methods of technology appraisal [Internet]. 2013. Available from: https://www.nice.org.uk/process/pmg9/chapter/the-reference-case.
- Reference 7
-
Mauskopf J, Talbird S, Standaert B. Categorization of methods used in cost-effectiveness analyses of vaccination programs based on outcomes from dynamic transmission models. Expert review of pharmacoeconomics & outcomes research. Jun 2012;12(3):357-371.
- Reference 8
-
STIKO. Modelling methods for predicting epidemiological and health economic effects of vaccinations - Guidance for analyses to be presented to the German Standing Committee on Vaccination (STIKO). Berlin: STIKO; 2016 Mar.
- Reference 9
-
Ungar W. Economic evaluation in child health. Oxford; Toronto: Oxford University Press, 2010.
- Reference 10
-
Keeler E, Cretin S. Discounting of life-saving and other nonmonetary effects. Management Science. 1983;29(3):300-306.
- Reference 11
-
Wilkinson T, Sculpher MJ, Claxton K, et al. The International Decision Support Initiative Reference Case for Economic Evaluation: An Aid to Thought. Value in health : the journal of the International Society for Pharmacoeconomics and Outcomes Research. Dec 2016;19(8):921-928.
- Reference 12
-
Jit M, Brisson M. Modelling the epidemiology of infectious diseases for decision analysis: a primer. PharmacoEconomics. May 2011;29(5):371-386.
- Reference 13
-
Kim S-Y, Goldie SJ. Cost-Effectiveness Analyses of Vaccination Programmes. PharmacoEconomics. March 01 2008;26(3):191-215.
- Reference 14
-
Pitman R, Fisman D, Zaric GS, et al. Dynamic transmission modeling: a report of the ISPOR-SMDM Modeling Good Research Practices Task Force--5. Value in health : the journal of the International Society for Pharmacoeconomics and Outcomes Research. Sep-Oct 2012;15(6):828-834.
- Reference 15
-
World Health Organization. WHO guide for standardization of economic evaluations of immunization programmes. Geneva : World Health Organization. http://www.who.int/iris/handle/10665/69981. 2008.
- Reference 16
-
Marshall DA, Burgos-Liz L, MJ IJ, et al. Selecting a dynamic simulation modeling method for health care delivery research-part 2: report of the ISPOR Dynamic Simulation Modeling Emerging Good Practices Task Force. Value in health : the journal of the International Society for Pharmacoeconomics and Outcomes Research. Mar 2015;18(2):147-160.
- Reference 17
-
Neumann PJ, Anderson JE, Panzer AD, et al. Comparing the cost-per-QALYs gained and cost-per-DALYs averted literatures. Gates open research. 2018;2:5-5.
- Reference 18
-
Husereau D, Drummond M, Petrou S, Carswell C, Moher D, Greenberg D, et al. Consolidated Health Economic Evaluation Reporting Standards (CHEERS) statement. BMJ. 2013 25 March 2013;346:f1049.
- Reference 19
-
Walker DG, Hutubessy R, Beutels P. WHO Guide for Standardization of Economic Evaluations of Immunization Programmes. Vaccine. 2009 9 July 2009;28(11):2356-9.
- Reference 20
-
SOP 26: Standard Operating Procedure for Economic Evaluation. West Wales Organisation for Rigorous Trials in Health (WWORTH) - the Clinical Trials Unit in Swansea; 2014 11 July 2014. Report No.: Version 2.2.
- Reference 21
-
Guidelines for the Economic Evaluation of Health Technologies in Ireland 2018. Health Information and Quality Authority; 2018 17 Jan 2018.
- Reference 22
-
Kristensen FB, Mäkelä M, Neikter SA, Rehnqvist N, Håheim LL, Mørland B, et al. European network for Health Technology Assessment, EUnetHTA: Planning, development, and implementation of a sustainable European network for Health Technology Assessment. Int J Technol Assess Health Care. 2009;25(S2):107-16.
- Reference 23
-
Developing NICE guidelines: the manual. UK: NICE National Institute for Health and Care Excellence; 2014 October 2014.
- Reference 24
-
Belgian Guidelines for Economic Evaluations and Budget Impact Analyses: SECOND EDITION. Belgian Health Care Knowledge Centre; 2015 8 December 2015. Report No.: 183C.
- Reference 25
-
Health Technology Assessment Methods and Process Guide. Health Quality Ontario (HQO); 2018 March 2018. Report No.: Version 2.0.
- Reference 26
-
Choices in Methods for Economic Evaluation (2012). Haute Autorité de Santé (HAS): Department of Economics and Public Health Assessment; 2012 October 2012.
- Reference 27
-
Guideline for Economic Evaluations in Healthcare - (2016). Netherlands: Zorginstituut; 2016 16 June 2016.
- Reference 28
-
Petrou S, Gray A. Economic evaluation using decision analytical modelling: design, conduct, analysis, and reporting. BMJ. 2011 11 April 2011;342:d1766.
- Reference 29
-
Drummond M, Manca A, Sculpher M. Increasing the generalizability of economic evaluations: recommendations for the design, analysis, and reporting of studies. Int J Technol Assess Health Care. 2005;21(2):165-71.
- Reference 30
-
Ramsey S, Willke R, Briggs A, Brown R, Buxton M, Chawla A, et al. Good Research Practices for Cost-Effectiveness Analysis Alongside Clinical Trials: The ISPOR RCT-CEA Task Force Report. Value Health. 2005 September-October 2005;8(5):521-33.
- Reference 31
-
Petrou S, Gray A. Economic evaluation alongside randomised controlled trials: design, conduct, analysis, and reporting. BMJ. 2011 07 April 2011;342:d1548.
- Reference 32
-
Ahmed F. U.S. Advisory Committee on Immunization Practices (ACIP) Handbook for Developing Evidence-based Recommendations. Atlanta, GA, USA: Centers for Disease Control and Prevention (CDC); 2013 Novmeber 1 2013. Report No.: Version 1.2.
- Reference 33
-
Neumann, Peter J., Ganiats, Theodore G., Russell, Louise B., Sanders, Gillian D., Siegel, Joanna E.,Oxford University Press.,. Cost-effectiveness in health and medicine. New York: Oxford University Press; 2017.
- Reference 34
-
Moher D, Liberati A, Tetzlaff J, Altman DG, The PRISMA Group. Preferred Reporting Items for Systematic Reviews and Meta-Analyses: The PRISMA Statement. PLoS Medicine. 2009 July 21 2009;6(7): e1000097.
- Reference 35
-
PROSPERO [Internet]. Available from: https://www.crd.york.ac.uk/prospero/.
- Reference 36
-
CADTH Economic Search Filters [Internet]; 2016 [updated 2018 11 13]. Available from: https://www.cadth.ca/resources/finding-evidence/strings-attached-cadths-database-search-filters#eco.
- Reference 37
-
Grey matters: a practical tool for searching health-related literature. [Internet]. Ottawa: CADTH; 2018 [updated August 2018; ]. Available from: https://www.cadth.ca/resources/finding-evidence/grey-matters.
- Reference 38
-
Distiller SR [Internet]. Available from: https://v2dis-prod.evidencepartners.com/Login/Login.php.
- Reference 39
-
The Joanna Briggs Institute Critical Appraisal Checklist for Economic Evaluations [Internet]. Available from: http://joannabriggs.org/assets/docs/critical-appraisal-tools/JBI_Critical_Appraisal-Checklist_for_Economic_Evaluations2017.pdf.
- Reference 40
-
Ting E.E.K. Systematic Review of the Cost-effectiveness of Influenza Immunization Programs: A Canadian Perspective [dissertation]. Toronto: Institute of Health Policy, Management, and Evaluation; 2015.9.
- Reference 41
-
Heyland DK, Kernerman P, Gafni A, Cook DJ. Economic evaluations in the critical care literature: do they help us improve the efficiency of our unit? Crit Care Medicine. 1996 01 Sep 1996;24(9):1591-8.
- Reference 42
-
Antonanzas F, Rodriguez-Ibeas R, Juarez C HF, Lorente R, Pinillos M. Transferability indices for health economic evaluations: methods and applications. Health Economics. 2009 07 May 2009;18(6):629-43.