
Group A Streptococcal diseases: For health professionals
On this page
- What health professionals need to know about Group A streptococcal diseases
- Clinical manifestations
- Treatment
- Risk factors
- Surveillance
What health professionals need to know about Group A streptococcal diseases
Group A streptococcus (GAS) bacteria, Streptococcus pyogenes, are Gram-positive beta-hemolytic bacteria of which over 240 emm types (genotypes) have been identified.
GAS can be present on the skin and throat, as well as in the vagina or perianal area of asymptomatic carriers. It can also cause a range of clinical presentations in the form of non-invasive and invasive disease.
Infections typically peak during the winter and early spring and decrease over the summer.
Clinical manifestations
Common presentations of GAS include:
- pharyngitis
- skin infection such as impetigo, erysipelas, cellulitis
- scarlet fever
Occasionally, GAS causes invasive infections, which can be severe and possibly life threatening. This occurs when GAS infects deep tissues and organs that are usually sterile. This can result in serious conditions, such as:
- septicemia
- necrotizing fasciitis (flesh eating disease)
- pneumonia
- Streptococcal Toxic Shock Syndrome
- septic arthritis
- meningitis
- puerperal sepsis
Treatment
Antibiotics are used to treat both non-invasive and invasive GAS infections. iGAS cases must be reported to local public health, as close contacts may be eligible for post-exposure prophylaxis. More information on the management of iGAS can be found in the guidelines for the Prevention and Control of Invasive Group A Streptococcal Disease.
Risk factors
Multiple studies have highlighted that the risk of invasive GAS disease is significantly associated with:
- open wounds or breaks in the skin (e.g. cuts, burns, sores, varicella or shingles)
- chronic diseases (e.g. diabetes, pulmonary, hepatic or cardiac disease)
- weakened immune system (immunosuppression) either from:
- disease (HIV/AIDS)
- cancer treatments (radiation, chemotherapy)
- taking anti-rejection drugs following an organ or bone-marrow transplant
- living in a crowded environment (e.g. dormitories, shelters, army barracks)
- recent infection with chickenpox or with respiratory viruses such as influenza
- substance use, including use of injectable drugs
- recent close contact with someone with a GAS or iGAS infection
- during childbirth and in the post-partum period
Invasive GAS occurs more often in young children under 5 years of age and adults aged 65 years of age and older.
Surveillance
The Public Health Agency of Canada (PHAC) conducts annual national routine iGAS surveillance. This is done through the Canadian Notifiable Disease Surveillance System. iGAS has been nationally notifiable since January 2000.
Basic demographic information is available, such as:
- sex
- age group
- province or territory
Non-invasive GAS (i.e., strep throat, scarlet fever) is not reported nationally.
The National Microbiology Laboratory (NML) conducts laboratory-based surveillance of the bacteria that causes invasive GAS. Data are collected by the NML when provinces and territories send iGAS isolates for laboratory testing and emm sequencing. Laboratory data is an important source to monitor current trends in iGAS.
For more information:
- National Case Definition: Invasive group A streptococcal disease
- Canadian Notifiable Diseases Online
- Invasive group A streptococcal disease surveillance in Canada, 2020
- Invasive bacterial diseases in northern Canada, 1999 to 2018
- Determination of emm type for Streptococcus pyogenes
Number of invasive Group A streptococcal disease cases in Canada
Since the early 2000s, the incidence rate of iGAS has increased steadily, with the exception of 2020 and 2021, where incidence rates decreased during the COVID-19 pandemic.
The rate has doubled from 2.7 cases per 100,000 people in 2001 to 5.6 cases per 100,000 people in 2021. Figure 1 shows the number of cases and incidence rates of iGAS in Canada by year from 2000 to 2021.
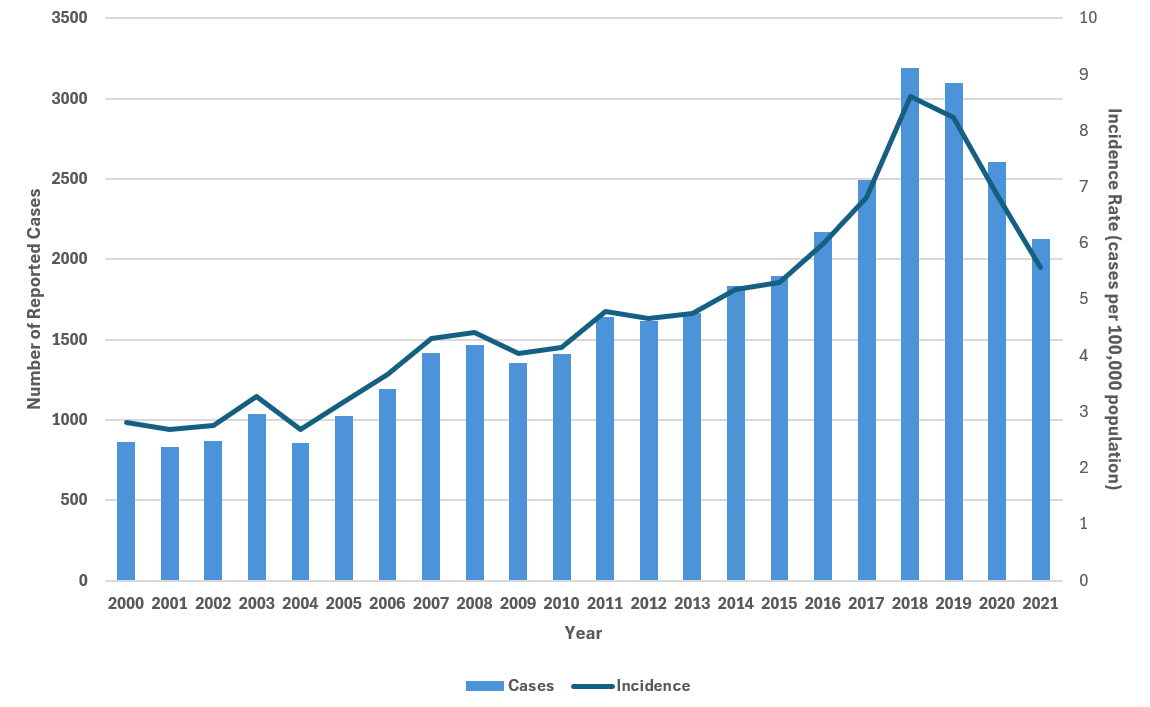
Figure 1 - Text description
| Year | Cases | Incidence |
|---|---|---|
| 2000 | 863 | 2.81 |
| 2001 | 830 | 2.68 |
| 2002 | 866 | 2.76 |
| 2003 | 1,039 | 3.28 |
| 2004 | 857 | 2.68 |
| 2005 | 1,025 | 3.18 |
| 2006 | 1,194 | 3.67 |
| 2007 | 1,419 | 4.31 |
| 2008 | 1,469 | 4.42 |
| 2009 | 1,354 | 4.03 |
| 2010 | 1,410 | 4.15 |
| 2011 | 1,643 | 4.78 |
| 2012 | 1,618 | 4.66 |
| 2013 | 1,665 | 4.75 |
| 2014 | 1,831 | 5.17 |
| 2015 | 1,894 | 5.3 |
| 2016 | 2,168 | 6 |
| 2017 | 2,492 | 6.82 |
| 2018 | 3,190 | 8.61 |
| 2019 | 3,095 | 8.23 |
| 2020 | 2,603 | 6.85 |
| 2021 | 2,127 | 5.56 |

Figure 2 - Text description
| Year | < 1 | 1-4 | 5-9 | 10-14 | 15-19 | 20-24 | 25-29 | 30-39 | 40-59 | 60 + |
|---|---|---|---|---|---|---|---|---|---|---|
| 2000 | 5.61 | 3.99 | 2.95 | 1.12 | 0.76 | 0.82 | 2.94 | 3.14 | 1.97 | 5.56 |
| 2001 | 4.87 | 3.58 | 2.23 | 0.87 | 1.18 | 1.09 | 2.12 | 3.12 | 1.98 | 5.34 |
| 2002 | 6.4 | 3.3 | 2.01 | 1.09 | 0.94 | 1.4 | 2.01 | 2.68 | 2.44 | 5.41 |
| 2003 | 6.66 | 4.65 | 2.77 | 1.59 | 1.03 | 1.42 | 1.57 | 3.91 | 2.8 | 6.11 |
| 2004 | 7.4 | 3.58 | 2.2 | 0.98 | 1.03 | 1.45 | 2.68 | 3.15 | 2.23 | 4.48 |
| 2005 | 6.49 | 2.99 | 3 | 1.13 | 0.97 | 0.98 | 2.93 | 4.13 | 3.04 | 5.12 |
| 2006 | 6.38 | 3.83 | 3.18 | 1.1 | 0.9 | 2.04 | 2.84 | 5.1 | 3.5 | 5.67 |
| 2007 | 8.33 | 3.8 | 3.11 | 1.31 | 1.3 | 1.77 | 3.33 | 6.21 | 4.31 | 6.57 |
| 2008 | 6.71 | 4.43 | 2.74 | 1.33 | 1.51 | 2.87 | 3.34 | 5.5 | 4.66 | 6.57 |
| 2009 | 9.53 | 3.65 | 2.68 | 1.65 | 1.24 | 1.66 | 3.27 | 4.46 | 4.04 | 6.61 |
| 2010 | 8.47 | 4.08 | 3.85 | 1.38 | 1.2 | 1.89 | 2.59 | 4.51 | 4.04 | 7 |
| 2011 | 9.83 | 5.78 | 4.31 | 2.29 | 1.97 | 2.21 | 2.53 | 5.24 | 4.7 | 7.45 |
| 2012 | 9 | 4.87 | 2.92 | 1.48 | 1.37 | 2.26 | 2.98 | 4.91 | 4.97 | 7.42 |
| 2013 | 9.72 | 4.6 | 3.28 | 2.01 | 1.02 | 2.19 | 3.3 | 5.27 | 5.06 | 7.19 |
| 2014 | 9.18 | 5.24 | 3.62 | 1.37 | 1.27 | 2.48 | 3.69 | 5.29 | 5.05 | 8.72 |
| 2015 | 13.87 | 4.4 | 3.6 | 1.06 | 1.53 | 2.71 | 3.99 | 5.57 | 5.39 | 8.36 |
| 2016 | 7.31 | 6.41 | 3.64 | 1.77 | 1.34 | 2.81 | 5.07 | 7.53 | 6.17 | 8.7 |
| 2017 | 8.71 | 6.21 | 3.12 | 1.74 | 1.77 | 3.54 | 5.05 | 8.33 | 7.83 | 9.48 |
| 2018 | 10.63 | 6.58 | 4.38 | 2.31 | 2.23 | 3.94 | 6.95 | 9.33 | 9.89 | 12.69 |
| 2019 | 8.87 | 6.47 | 4.07 | 1.13 | 1.8 | 3.68 | 6.93 | 9.39 | 9.59 | 11.95 |
| 2020 | 7.57 | 3.68 | 1.71 | 0.68 | 1.81 | 3.71 | 5.71 | 8.7 | 9.35 | 8.35 |
| 2021 | 7.77 | 1.9 | 0.64 | 0.67 | 0.87 | 2.9 | 3.72 | 7.17 | 8.38 | 6.44 |
Based on Canadian data, the age groups most affected are infants under 1 year of age and adults between 40 to 59 years of age and those 65 years of age and older. The 10-year average (2011-2021) age group-specific incidence rates for those age groups were:
- 9.31 cases per 100,000 for infants under 1 year of age
- 8.79 cases per 100,000 in adults 65 years of age and older
- 6.94 cases per 100,000 for adults between 40 to 59 years of age