
Chapter 2: Population-Specific HIV/AIDS Status Report: People living with HIV/AIDS - Epidemiological Profile of HIV and AIDS in Canada
Chapter 2 - Epidemiological Profile of HIV and AIDS in Canada
2.1 Evolution of HIV and AIDS in Canada
In March of 1982, the first case of a death in Canada from what was soon to be known as AIDS was reported.Footnote 1 This followed a report from the United States on a cluster of cases of gay men presenting with Pneumocystis Carinii Pneumonia (PCP) and Kaposi's Sarcoma, both rare infections occurring only in people with severely compromised immune systems. As early identified cases were concentrated in the gay community, one of the proposed names for this emerging illness was Gay-Related Immune Deficiency (GRID). By late 1982, it became clear that other groups were also affected, leading the U.S. Centers for Disease Control and Prevention to name this pattern of symptoms Acquired Immune Deficiency Syndrome (AIDS). In 1983, it was established that a new retrovirus - subsequently named Human Immunodeficiency Virus (HIV) - was the cause of AIDS.
When it first emerged in Canada, HIV was overwhelmingly concentrated among gay men, although it also affected hemophiliacs, and people who use injection drugs. In the late 1980s and early 1990s, women emerged as an affected population. More recently, Aboriginal people and people from countries where HIV is endemic have become over-represented in Canada's HIV epidemic. The rate of HIV infection among people in prison is also higher than among Canada's general population.Footnote 2Footnote 3Footnote 4
2.1.1 Current status
Canada has a relatively low HIV prevalence, with an estimated national prevalence of 0.2% in 2011.Footnote 5 Canada now has a growing population of PHA, as a result of the following two factors: new HIV infections continue to occur and HIV-related deaths have declined after the introduction of antiretroviral medications. The rate of new HIV infections in Canada has remained relatively stable over the past decade.
Although anyone can be affected by HIV, it continues to be concentrated in specific populations in Canada. As discussed above, the populations affected by HIV have become more diverse, although gay men continue to be the most affected population. The Federal Initiative to Address HIV in Canada now focuses on the following populations most affected by HIV in Canada: gay men and other men who have sex with men, people who use injection drugs, people from countries where HIV is endemic, Aboriginal Peoples, people in prisons, youth at risk, women, and people living with HIV/AIDS (PHA).Footnote 4
It is important to note that many people living with or at-risk of HIV in Canada may be members of more than one of these groups. HIV surveillance tracks the main routes of exposure to the virus - men who have sex with men, heterosexual contact, and injection drug use - but the people affected also belong to distinct racial/ethnic, gender and age groups necessitating a nuanced policy and program response to prevention, care, treatment and support.
2.2 HIV and AIDS Data in Canada
The Public Health Agency of Canada uses multiple data sources to provide an overall picture of HIV among Canadians, including routine surveillance, enhanced surveillance of specific at-risk populations, research data, and modelling methods, which are used to provide national estimates. This chapter presents both routine and enhanced surveillance data, as well as estimates of the number of new HIV infections (i.e., incidence) and the total number of people living with HIV infection (i.e., prevalence) in order to characterize HIV and AIDS in Canada.
HIV is a reportable condition in every province and territory in Canada, meaning that every positive HIV test obtained by a laboratory or healthcare provider must be reported to provincial health authorities. AIDS is only a reportable condition in some jurisdictions, although physicians are required to report the occurrence of AIDS-defining illnessesFootnote 4 in patients already diagnosed with HIV. For surveillance purposes, these cases are included in the national AIDS data. For all AIDS cases, death data are also collected.
Provinces and territories provide routine surveillance data to the Agency on a voluntary basis. These data consist of reported positive HIV test reports and reported AIDS cases, with no identifying information. While a minimum amount of information is provided for each case - usually age, sex, and diagnosis date - the amount of supplementary data provided from each province and territory varies, with only some jurisdictions reporting country of birth, ethnicity, and exposure category. Supplemental data on ethnicity are important because this information can identify infection patterns among different racial/ethnic groups. Supplementary data on exposure categories are also important because this information identifies the most likely route by which an individual became infected.
Monitoring HIV is difficult because routine surveillance can only tell us about persons who have been tested and diagnosed with HIV or AIDS. It is estimated that 25% of those living with HIV in Canada are unaware of their infection.Footnote 5 Routine surveillance also has limitations with regards to underreporting, reporting delays, potential duplicate reporting, and missing information. As a consequence, routine surveillance data alone do not fully reflect the extent of the HIV epidemic in Canada.
To develop a clearer picture of HIV in Canada, the Agency uses several approaches, including enhanced (i.e., behavioural and biological) surveillance and estimates of HIV prevalence and incidence. Enhanced surveillance entails gathering behavioural information, such as sexual behaviours, injecting and testing behaviours, as well as HIV infection status among a targeted group of people. The Agency conducts enhanced surveillance among gay, bisexual and other men who have sex with men (called the M-Track surveillance system) and people who inject drugs (called the I-Track surveillance system) to gain more detailed knowledge about HIV testing patterns, risk behaviour, and HIV prevalence. Similar enhanced surveillance systems are under development for monitoring HIV and associated risk behaviours among people from countries where HIV is endemic (to be called the E-Track surveillance system) and among Aboriginal peoples (to be called the A-Track surveillance system).
National data on the HIV status of infants exposed perinatally to HIV infection are collected through the Canadian Perinatal HIV Surveillance Program, an initiative of the Canadian Pediatric AIDS Research Group.
The Agency also develops national HIV prevalence and incidence estimates to assess the number of people living with HIV who are unaware of their status. These estimates rely on mathematical modelling, and are based on a combination of the findings from routine surveillance, enhanced surveillance, and research data. Methods to estimate prevalence and incidence at the national level are complex and, while they do contain a level of uncertainty, provide a more complete picture of the HIV epidemic, enabling governments and service providers to develop focussed programs and approaches.
2.2.1 Estimated HIV Incidence
New HIV infections in Canada continue to occur. The Agency estimates that the range of new HIV infections in 2011 was between 2,250 and 4,100 (Figure 1). This is a decrease from the peak in 1985, when there were an estimated 3,250 to 6,050 new infections. The number of incident infections decreased steadily after 1985 until the mid-1990s, levelled off from 1996 to 1999, followed by an increase from 1999 to 2002, and has levelled off again since 2002.Footnote 5
Figure 1: Estimated number of incident HIV infections in Canada for selected years
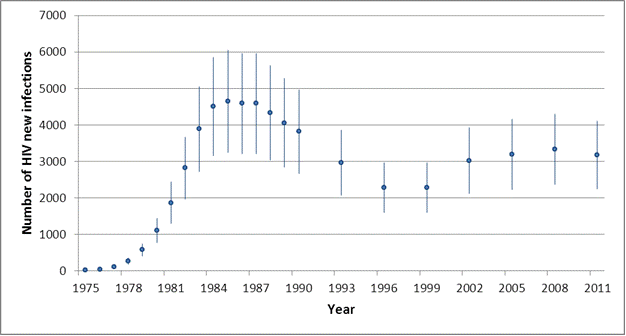
Text equivalent - Figure 1
Figure 1 is a graph that shows the estimated number of incident HIV infections in Canada between 1975 and 2011. The y axis shows the number of new HIV infections, with numbers ranging from 0 to 7,000. The x axis shows the year, beginning in 1975 and ending in 2011. After 1990, data was collected every 3 years.
The Agency estimates that the range of new HIV infections in 2011 was between 2,250 and 4,100. This is a decrease from the peak in 1985, when the estimated range was between 3,250 and 6,050 new infections. The number of incident infections decreased steadily after 1985 until the mid-1990s, levelled off from 1996 to 1999, followed by an increase from 1999 to 2002, and has levelled off again since 2002.
| Year | High | Low | Middle |
|---|---|---|---|
| 1975 | 34 | 18 | 26 |
| 1976 | 61 | 33 | 47 |
| 1977 | 148 | 80 | 114 |
| 1978 | 351 | 189 | 270 |
| 1979 | 751 | 405 | 578 |
| 1980 | 1435 | 773 | 1104 |
| 1981 | 2434 | 1310 | 1872 |
| 1982 | 3667 | 1975 | 2821 |
| 1983 | 5056 | 2722 | 3889 |
| 1984 | 5863 | 3157 | 4510 |
| 1985 | 6044 | 3254 | 4649 |
| 1986 | 5964 | 3212 | 4588 |
| 1987 | 5964 | 3212 | 4588 |
| 1988 | 5634 | 3034 | 4334 |
| 1989 | 5278 | 2842 | 4060 |
| 1990 | 4969 | 2675 | 3822 |
| 1991 | |||
| 1992 | |||
| 1993 | 3858 | 2078 | 2968 |
| 1994 | |||
| 1995 | |||
| 1996 | 2959 | 1593 | 2276 |
| 1997 | |||
| 1998 | |||
| 1999 | 2959 | 1593 | 2276 |
| 2000 | |||
| 2001 | |||
| 2002 | 3934 | 2118 | 3026 |
| 2003 | |||
| 2004 | |||
| 2005 | 4160 | 2240 | 3200 |
| 2006 | |||
| 2007 | |||
| 2008 | 4300 | 2370 | 3375 |
| 2009 | |||
| 2010 | |||
| 2011 | 4100 | 2250 | 3175 |
Note: Range of uncertainty represented by vertical bars
Source: Public Health Agency of Canada. Summary: Estimates of HIV prevalence and incidence in Canada, 2011. Ottawa: Centre for Communicable Diseases and Infection Control, Public Health Agency of Canada; 2012.
2.2.2 Estimated HIV Prevalence
At the end of 2011, an estimated 71,300 (58,600 - 84,000) people were living with HIV infection (including AIDS). An estimated 25% of this number, or between 14,500 and 21,500 people, were unaware of their HIV infection.Footnote 5 Figure 2 presents the estimated number of prevalent HIV infections over time in Canada with associated ranges of uncertainty.
Figure 2: Estimated number of people living with HIV infection in Canada (all ages)

Text equivalent - Figure 2
Figure 2 is a graph that shows the estimated number of people of all ages living with the human immunodeficiency virus (HIV) infection in Canada over time, with associated ranges of uncertainty. The y axis shows the number of prevalent HIV infections, with numbers ranging from 0 to 90,000. The x axis shows the years, ranging from 1975 and 2011. There are two curves of uncertainty which represent the low estimate of uncertainty and the high estimate of uncertainty. Together they indicate the range of uncertainty by year.
| Year | Low estimate | Point estimate | High estimate |
|---|---|---|---|
| 1975 | 22 | 26 | 30 |
| 1976 | 56 | 67 | 78 |
| 1977 | 145 | 173 | 201 |
| 1978 | 354 | 422 | 490 |
| 1979 | 802 | 955 | 1108 |
| 1980 | 1656 | 1972 | 2288 |
| 1981 | 3102 | 3693 | 4284 |
| 1982 | 5279 | 6284 | 7289 |
| 1983 | 8268 | 9843 | 11418 |
| 1984 | 11697 | 13925 | 16153 |
| 1985 | 15154 | 18041 | 20928 |
| 1986 | 18415 | 21923 | 25431 |
| 1987 | 21501 | 25597 | 29693 |
| 1988 | 24273 | 28897 | 33521 |
| 1989 | 26662 | 31741 | 36820 |
| 1990 | 28745 | 34220 | 39695 |
| 1991 | 30446 | 36245 | 42044 |
| 1992 | 31757 | 37806 | 43855 |
| 1993 | 32664 | 38886 | 45108 |
| 1994 | 33327 | 39675 | 46023 |
| 1995 | 33692 | 40110 | 46528 |
| 1996 | 34258 | 40783 | 47308 |
| 1997 | 35270 | 41988 | 48706 |
| 1998 | 36396 | 43328 | 50260 |
| 1999 | 37650 | 44821 | 51992 |
| 2000 | 38998 | 46426 | 53854 |
| 2001 | 40624 | 48362 | 56100 |
| 2002 | 42457 | 50544 | 58631 |
| 2003 | 44365 | 52815 | 61265 |
| 2004 | 46347 | 55175 | 64003 |
| 2005 | 47880 | 57000 | 66120 |
| 2006 | 49766 | 59245 | 68724 |
| 2007 | 51660 | 61500 | 71340 |
| 2008 | 53000 | 64000 | 75000 |
| 2009 | 55805 | 66434 | 77063 |
| 2010 | 57200 | 68867 | 80500 |
| 2011 | 58600 | 71300 | 84000 |
Note: The curve includes the range of uncertainty by year.
Source: Public Health Agency of Canada. Summary: Estimates of HIV prevalence and incidence in Canada, 2011. Ottawa: Centre for Communicable Diseases and Infection Control, Public Health Agency of Canada; 2012.
2.3 Biological Sex
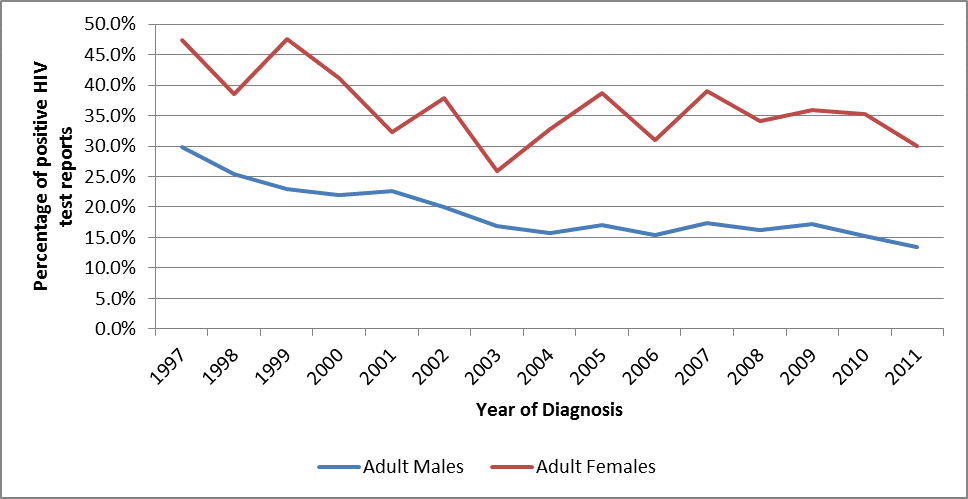
An estimated 54,700 males and 16,600 females were living with HIV (including AIDS) in Canada as of December 31, 2011.Footnote 5 Routine surveillance data show that the relative proportion of males and females diagnosed with HIV has shifted over time. In 1985, fewer than 5% of positive HIV test reports with reported sex information were attributed to adult females; by 2011, women accounted for 23.3% of new positive HIV test reports with reported sex information.Footnote 6 For the past 10 years, however, the proportions of male and female cases have remained relatively stable (see Figure 3).
Figure 3: Proportion of positive HIV test reports, by sex (all ages), 1985-2011 (n=71,361)
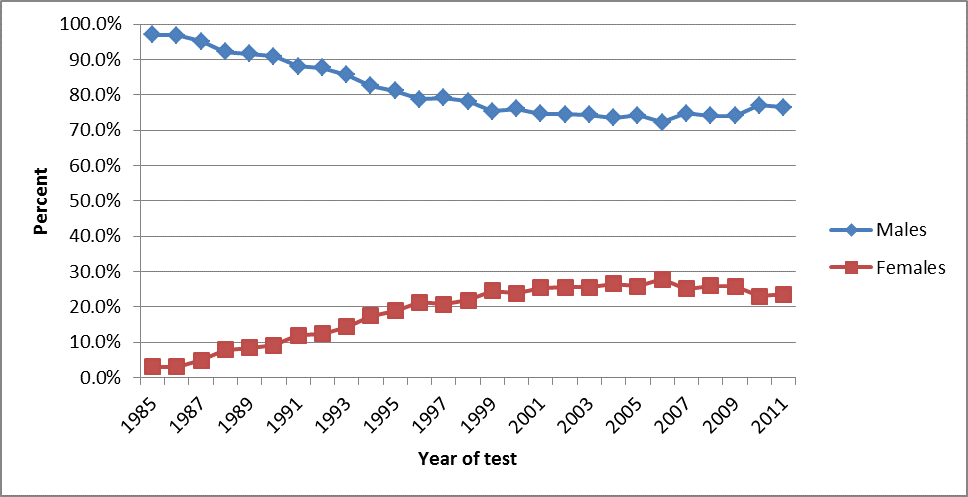
Text equivalent - Figure 3
Figure 3 is a graph that shows the proportion of positive human immunodeficiency virus (HIV) test reports by sex, of all ages, between 1985 and 2011. The y axis shows the percentage of positive HIV test reports, ranging from 0 to 100 percent. The x axis shows the year, ranging from 1985 to 2011. The source is internal data from the Public Health Agency of Canada, 2012.
| Year | 1985 | 1986 | 1987 | 1988 | 1989 | 1990 | 1991 | 1992 | 1993 | 1994 | 1995 | 1996 | 1997 | 1998 | 1999 | 2000 | 2001 | 2002 | 2003 | 2004 | 2005 | 2006 | 2007 | 2008 | 2009 | 2010 | 2011 |
|---|---|---|---|---|---|---|---|---|---|---|---|---|---|---|---|---|---|---|---|---|---|---|---|---|---|---|---|
| Males | 603 | 2685 | 3217 | 2621 | 2854 | 5256 | 2802 | 2867 | 2487 | 2334 | 2317 | 2090 | 1889 | 1732 | 1620 | 1553 | 1624 | 1809 | 1815 | 1836 | 1824 | 1816 | 1806 | 1927 | 1763 | 1755 | 1661 |
| Females | 19 | 86 | 165 | 222 | 262 | 528 | 380 | 406 | 417 | 494 | 539 | 564 | 495 | 483 | 528 | 488 | 553 | 619 | 625 | 662 | 635 | 698 | 607 | 674 | 616 | 523 | 511 |
| Total | 622 | 2771 | 3382 | 2843 | 3116 | 5784 | 3182 | 3273 | 2904 | 2827 | 2856 | 2654 | 2384 | 2215 | 2148 | 2041 | 2177 | 2428 | 2440 | 2498 | 2459 | 2514 | 2413 | 2601 | 2379 | 2278 | 2172 |
| Year | 1985 | 1986 | 1987 | 1988 | 1989 | 1990 | 1991 | 1992 | 1993 | 1994 | 1995 | 1996 | 1997 | 1998 | 1999 | 2000 | 2001 | 2002 | 2003 | 2004 | 2005 | 2006 | 2007 | 2008 | 2009 | 2010 | 2011 |
|---|---|---|---|---|---|---|---|---|---|---|---|---|---|---|---|---|---|---|---|---|---|---|---|---|---|---|---|
| Males | 96.9% | 96.9% | 95.1% | 92.2% | 91.6% | 90.9% | 88.1% | 87.6% | 85.6% | 82.6% | 81.1% | 78.7% | 79.2% | 78.2% | 75.4% | 76.1% | 74.6% | 74.5% | 74.4% | 73.5% | 74.2% | 72.2% | 74.8% | 74.1% | 74.1% | 77.0% | 76.5% |
| Females | 3.1% | 3.1% | 4.9% | 7.8% | 8.4% | 9.1% | 11.9% | 12.4% | 14.4% | 17.4% | 18.9% | 21.3% | 20.8% | 21.8% | 24.6% | 23.9% | 25.4% | 25.5% | 25.6% | 26.5% | 25.8% | 27.8% | 25.2% | 25.9% | 25.9% | 23.0% | 23.5% |
| Total | 100% | 100% | 100% | 100% | 100% | 100% | 100% | 100% | 100% | 100% | 100% | 100% | 100% | 100% | 100% | 100% | 100% | 100% | 100% | 100% | 100% | 100% | 100% | 100% | 100% | 100% | 100% |
Source: Public Health Agency of Canada, Internal data 2012
2.4 Age at Diagnosis
Since 1985, among positive HIV test reports in which information on age was included, the largest proportion of cases has been attributed to the 30 to 39 year age groupFootnote 5. Although that proportion has been decreasing since 1994, it remains the highest overall and in 2011, this age group accounted for 30.3% of cases. In contrast, the proportion of positive HIV test reports among those aged 40 to 49 years has for the most part been increasing since the beginning of the epidemic, reaching a peak of 30.5% in 2008, though decreasing again slightly to 25.7% in 2011. The proportion of annual HIV test reports among those aged 50 years and older has also increased since the beginning of the epidemic, reaching a high of 19.4% in 2011.Footnote 6
The proportion of positive HIV test reports among those aged 20-29 years has decreased significantly over time, from a high of 35.6% in 1985 to a low of 19.3% in 1999. Since 1999, the proportion of positive HIV test reports in this age group has remained stable, increasing only slightly to 22.7% in 2011. The proportion of positive HIV test reports in the youngest age groups have remained quite low since the beginning of the epidemic, both those aged 0-14 years and 15-19 years peaking at 3.0% in 1985. In 2011, the proportion among those aged 0-14 years was 0.6%, and 1.7% among those aged 15-19 years.
Figure 4: Proportion of positive HIV test reports in Canada, by age group Figure 4 - Footnote *, 1985-2011 (n=69,637)
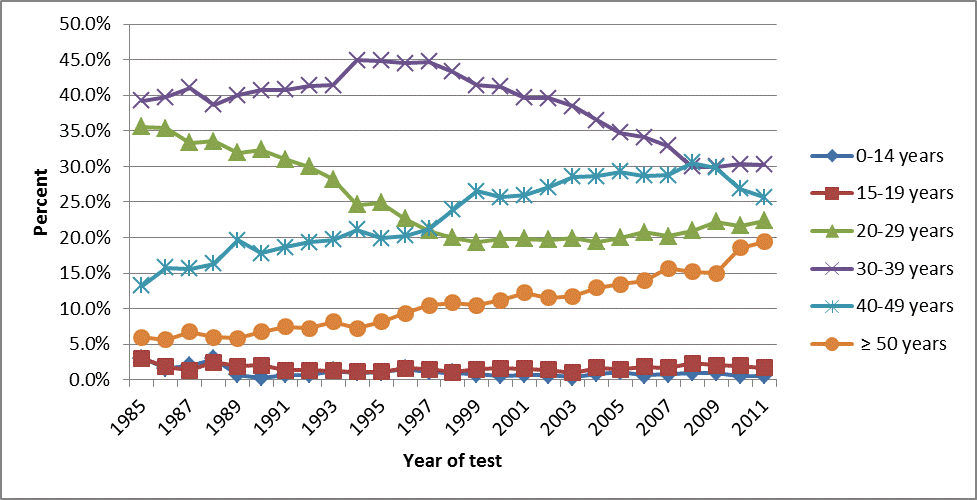
Text equivalent - Figure 4
This is a graph that shows the proportion of positive human immunodeficiency virus (HIV) test reports in Canada from 1985 to 2011, by age range where age was reported. The data is taken from Public Health Agency of Canada internal sources, in 2012.
The y axis shows percent, ranging from 1 to 100. The x axis shows the year in which the test was taken, ranging from 1985 to 2011.
| 1985 | 1986 | 1987 | 1988 | 1989 | 1990 | 1991 | 1992 | 1993 | 1994 | 1995 | 1996 | 1997 | 1998 | 1999 | 2000 | 2001 | 2002 | 2003 | 2004 | 2005 | 2006 | 2007 | 2008 | 2009 | 2010 | 2011 | |
|---|---|---|---|---|---|---|---|---|---|---|---|---|---|---|---|---|---|---|---|---|---|---|---|---|---|---|---|
| 0-14 years | 3.0% | 1.7% | 2.0% | 2.9% | 0.7% | 0.3% | 0.7% | 0.7% | 1.2% | 1.0% | 1.1% | 1.6% | 1.1% | 1.0% | 0.8% | 0.6% | 0.7% | 0.6% | 0.3% | 0.8% | 1.1% | 0.7% | 0.8% | 1.0% | 1.0% | 0.6% | 0.6% |
| 15-19 years | 3.0% | 1.8% | 1.4% | 2.5% | 1.9% | 2.0% | 1.4% | 1.4% | 1.2% | 1.1% | 1.1% | 1.7% | 1.5% | 1.0% | 1.5% | 1.6% | 1.6% | 1.4% | 1.0% | 1.7% | 1.5% | 1.9% | 1.7% | 2.3% | 2.1% | 1.9% | 1.7% |
| 20-29 years | 35.6% | 35.4% | 33.3% | 33.6% | 31.9% | 32.4% | 31.0% | 30.0% | 28.2% | 24.6% | 24.9% | 22.7% | 21.0% | 19.9% | 19.3% | 19.8% | 19.8% | 19.7% | 19.9% | 19.4% | 20.0% | 20.7% | 20.2% | 21.0% | 22.2% | 21.7% | 22.3% |
| 30-39 years | 39.2% | 39.8% | 41.0% | 38.7% | 40.0% | 40.7% | 40.8% | 41.3% | 41.4% | 45.0% | 44.9% | 44.5% | 44.7% | 43.3% | 41.4% | 41.2% | 39.7% | 39.6% | 38.4% | 36.5% | 34.7% | 34.1% | 32.9% | 30.0% | 30.0% | 30.3% | 30.3% |
| 40-49 years | 13.2% | 15.7% | 15.6% | 16.3% | 19.6% | 17.8% | 18.7% | 19.3% | 19.7% | 21.1% | 19.9% | 20.3% | 21.3% | 23.9% | 26.5% | 25.7% | 25.9% | 27.1% | 28.6% | 28.6% | 29.3% | 28.7% | 28.7% | 30.5% | 29.8% | 26.9% | 25.7% |
| ≥50 years | 6.0% | 5.7% | 6.7% | 6.0% | 5.9% | 6.7% | 7.5% | 7.3% | 8.2% | 7.3% | 8.2% | 9.3% | 10.5% | 10.8% | 10.5% | 11.2% | 12.3% | 11.6% | 11.8% | 12.9% | 13.4% | 13.9% | 15.7% | 15.2% | 15.0% | 18.6% | 19.4% |
| Total | 100% | 100% | 100% | 100% | 100% | 100% | 100% | 100% | 100% | 100% | 100% | 100% | 100% | 100% | 100% | 100% | 100% | 100% | 100% | 100% | 100% | 100% | 100% | 100% | 100% | 100% | 100% |
- Footnote 1
-
Where age was reported.
Source: Public Health Agency of Canada, 2012 data.
2.5 Geographic Distribution
The majority of positive HIV test reports and reported AIDS cases in Canada have been concentrated in the four most populous provinces - Ontario, Quebec, British Columbia and Alberta, which account for approximately 86% of the general Canadian population.Footnote 7 These four provinces together account for 93.3% of all positive HIV test reports since 1985, and 94.4% of all AIDS cases since 1979.Footnote 6 It is important to note that surveillance systems record the province where the positive HIV test or AIDS case is diagnosed, which is not necessarily the province in which the person was infected, or where they reside.
Figure 5: Number of positive HIV test reports (n=74,162) and reported AIDS cases (n=22,473) by province/territory, 1985-2011
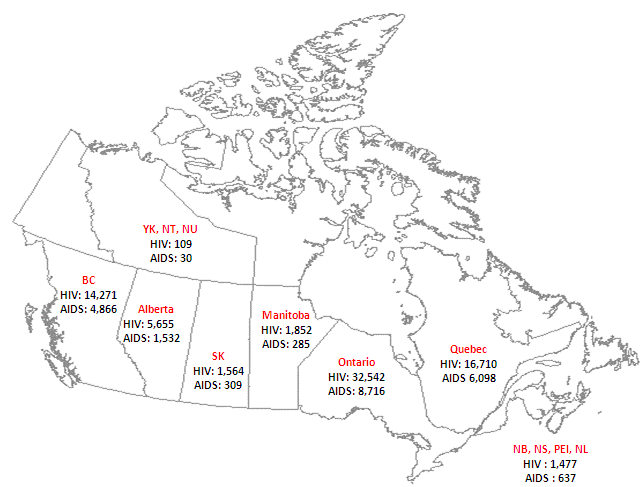
Text equivalent - Figure 5
Figure 5 is a map of Canada, with inset boxes that provide information, by province/territory or region, on human immunodeficiency virus (HIV) test reports and reported acquired immune deficiency syndrome (AIDS) cases. The source of the information is internal data from the Public Health Agency of Canada, 2012.
The majority of positive HIV tests and reported AIDS cases in Canada are concentrated in the four most populous provinces - Ontario, Quebec, British Columbia and Alberta. Together, the four provinces account for approximately 86 percent of the population, 93.3 percent of all positive HIV test reports since 1985, and 94.4 percent of all AIDS cases reported since 1979.
It is important to note that surveillance systems record the province where the positive HIV test or AIDS case is diagnosed, which is not necessarily the province in which the person was infected, or where they reside.
| HIV | AIDS |
|---|---|
| BC - 14,271 | BC - 4,866 |
| AB - 5,655 | AB - 1,532 |
| YK,NT,NV - 109 | YK,NT,NV - 30 |
| SK - 1,564 | SK - 309 |
| MB - 1,852 | MB - 285 |
| ON - 32,542 | ON - 8,716 |
| QC - 16,710 | QC - 6,098 |
| NB, NS, PE, NL - 1,477 | NB, NS, PE, NL - 637 |
| n = 74,162 | n = 22,473 |
Source: Public Health Agency of Canada, 2012 Internal Data.
2.6 National HIV Infection Exposure Categories
This section explains the classification of positive HIV test reports by exposure category, and provides a broad overview of the HIV epidemic in Canada.
2.6.1 Exposure Category Classification
Most positive HIV test reports and AIDS cases reported to the Agency through routine surveillance include one or more reported risk factors, such as sex with a male, sex with a female, injection of non-prescription drugs, and received blood transfusion.
For the purpose of national reporting, positive HIV test reports and reported AIDS cases are assigned to a single exposure category (based on the reported risk factor[s]) within a risk exposure hierarchy (see Figure 6). The exposure category hierarchy was developed as a way of classifying positive HIV test reports and reported AIDS cases where the actual route of transmission for acquisition of HIV was unknown, or more than one risk factor is reported. If more than one risk factor is reported, the case is classified according to the exposure category listed first (or highest) in the hierarchy. For example, if a positive HIV test report or AIDS case cites the risk factors 'injection drug use' (IDU) and 'heterosexual contact', the report or case would be attributed to the IDU exposure category for the purpose of national data collection, as IDU is accepted as the higher risk activity.Footnote 8
If a person who uses injection drugs is known to have contracted HIV through occupational exposure, they would be classified under 'occupational exposure', even though this is lower on the hierarchy, because the actual route of HIV infection is known.
The exposure category hierarchy was created in conjunction with national stakeholders when the HIV surveillance system was first established in Canada. It was based on the epidemic trends at the time and was meant to serve as an epidemiological tool for the surveillance and classification of cases.
Figure 6: National hierarchy of HIV infection exposure categories

Text equivalent - Figure 6
Figure 6 is a vertically stacked chart that depicts the national hierarchy of human immunodeficiency virus (HIV) infection exposure categories in Canada. For the purpose of national reporting, positive HIV test reports and reported acquired immune deficiency syndrome (AIDS) cases are assigned to a single category (based on the reported risk factor(s) within a risk exposure hierarchy). The source is internal data from the Public Health Agency of Canada, 2012.
The hierarchy is as follows:
- Perinatal transmission
- MSM-IDU (men who have sex with men and inject drugs)
- MSM (men who have sex with men)
- IDU (injection drug use)
- Recipient of blood/blood products
- Heterosexual contact
- Subcategories
- Origin from an HIV-endemic country
- Sexual contact with a person at risk
- No identified risk/heterosexual
- Occupational exposure
- Other
- No identified risk
Source: Public Health Agency of Canada, Internal Data 2012.
2.6.2. Overview of HIV in Canada, by Exposure Category
This section provides a broad overview of the HIV epidemic in Canada by exposure category, using data from national estimates and routine surveillance. It describes the difference in the distribution of these categories over time, and between adult males and females.
At the end of 2011 in Canada, the largest proportion of estimated prevalent infections were attributed to the men who have sex with men (MSM) exposure category with an estimated 46.7% of cases. This was followed by the heterosexual non-endemicFootnote 6 and heterosexual endemicFootnote 7 exposure categories with an estimated 17.6% and 14.9% of HIV prevalent cases respectively, and the injection drug use (IDU) exposure category with 16.9%. The combined category of men who have sex with men and who inject drugs (MSM-IDU) made up an estimated 3% of the total proportion of prevalent HIV cases, and 'other' exposure categories - such as recipients of blood or clotting factor, perinatal transmission, and occupational transmission - made up an estimated 0.8% cumulatively.Footnote 5
The estimated number of new HIV infections in 2011 attributed to the MSM exposure category was 1,480 (or 46.6%). The estimated number of new HIV infections attributed to the heterosexual endemic and non-endemic exposure categories was 645 (20.3%) and 535 (16.9%) respectively, an estimated 435 cases (13.7%) were attributed to the IDU exposure category, and 80 cases (2.5%) to MSM-IDU.Footnote 5 Figure 7 illustrates trends for estimated incident HIV infections by exposure category over time.
Figure 7: Estimated number of incident HIV infections per year by exposure category (range of uncertainty omitted)
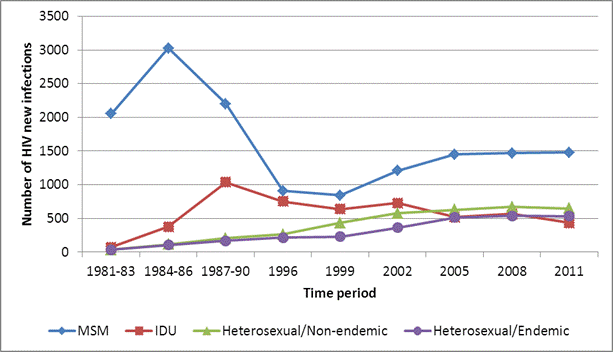
Text equivalent - Figure 7
Figure 7 is a graph that shows the number of incident human immunodeficiency virus (HIV) infections per year by exposure category. In this graph, the range of uncertainty is omitted. Data is used from national estimates and routine surveillance. It describes the difference in the distribution of these categories over time. The source is Centre for Communicable Diseases and Infection Control, Public Health Agency of Canada, 2012.
The exposure categories being reported are men who have sex with men (MSM), injection drug use (IDU), heterosexual/non-endemic and heterosexual/endemic.
The y axis shows the number of new HIV infections, with numbers ranging from 0 to 3,500. The x axis shows the years, ranging from 1981 to 2011.
| Time period | Men who have sex with men (MSM) | Injection drug use (IDU) | Heterosexual non-endemic | Heterosexual endemic |
|---|---|---|---|---|
| 1981-1983 | 2054 | 72 | 34 | 34 |
| 1984-1986 | 3029 | 379 | 118 | 104 |
| 1987-1990 | 2202 | 1039 | 208 | 166 |
| 1996 | 910 | 751 | 262 | 216 |
| 1999 | 842 | 637 | 432 | 228 |
| 2002 | 1210 | 726 | 575 | 363 |
| 2005 | 1450 | 520 | 630 | 515 |
| 2008 | 1470 | 565 | 670 | 540 |
| 2011 | 1480 | 435 | 645 | 535 |
Source: Public Health Agency of Canada. Summary: Estimates of HIV prevalence and incidence in Canada, 2011. Ottawa: Centre for Communicable Diseases and Infection Control, Public Health Agency of Canada; 2012.
The burden of HIV in Canada has changed over the past 30 years. When HIV reporting began in 1985, the MSM exposure category accounted for over 80% of all cases, and continued to account for the majority of cases for the next ten years (see Figure 8a). Although it is still the predominant exposure category, the proportion has diminished significantly over the years. Between 2002 and 2011, the MSM exposure category accounted for 42.0% of new positive HIV test reports among adults, followed by the heterosexual contact (30.8%) and IDU (20.7%) exposure categories (see Figure 8b).Footnote 6
Figure 8a: The proportion of positive HIV test reports among adults (≥ 15 years), by exposure category, 1985-1994 (n=15,372)
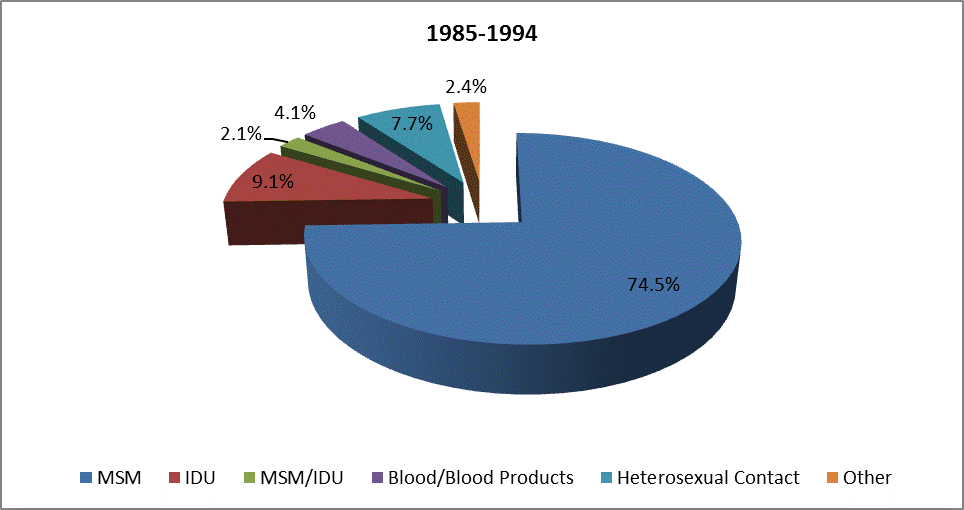
Text equivalent - Figure 8a
Figure 8a is a pie chart that shows the proportion of positive human immunodeficiency virus (HIV) test reports among adults aged 15 and older, by exposure category, between 1985 and 1994. The pie chart excludes cases where exposure was not indicated or unknown. The source is internal data from the Public Health Agency of Canada, 2012.
The results indicate that of the positive HIV test reports among adults older than 15 years of age, men who have sex with other men (MSM) accounted for 74.5% of cases, injection drug use (IDU) accounted for 9.1% of cases, men who have sex with men and who use injection drugs accounted for 2.1% of cases, those exposed to blood or blood products accounted for 4.1% of cases, heterosexual contact accounted for 7.7% of cases and other exposure categories accounted for 2.4% of cases.
Of note is that when HIV reporting began in 1985, the men who have sex with men (MSM) exposure category accounted for over 80 percent of all cases, and continued to account for the majority of cases for the next 10 years. Although it is still the predominant exposure category, the proportion has diminished significantly over the years.
Note: Excludes cases where exposure category was not indicated or unknown.
Source: Public Health Agency of Canada, Internal Data, 2012.
Figure 8b: The proportion of positive HIV test reports among adults (≥ 15 years), by exposure category, 2002-2011 (n=12,966)
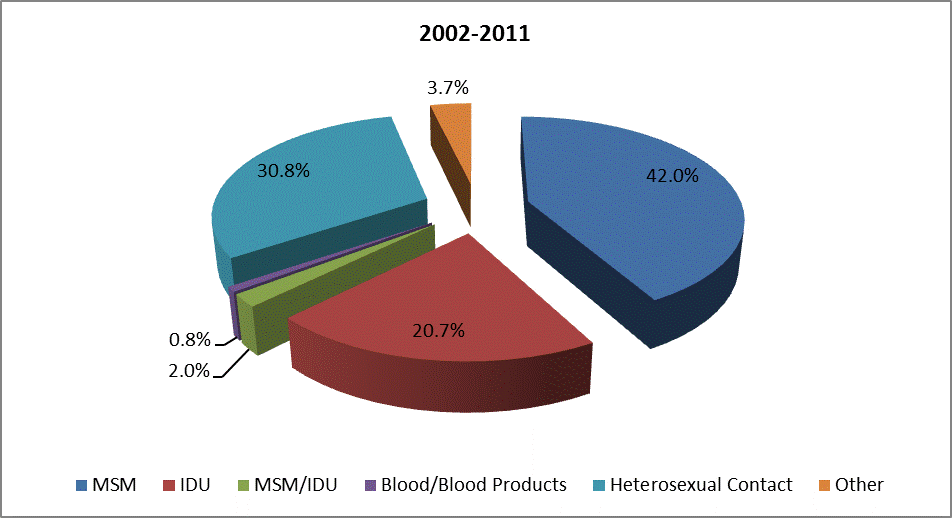
Text equivalent - Figure 8b
Figure 8B is a pie chart that shows the proportion of positive human immunodeficiency virus (HIV) test reports among adults aged 15 and older, by exposure category, between 2002 and 2012. The pie chart excludes cases where exposure was not indicated or unknown. The source is internal data from the Public Health Agency of Canada, 2012.
The results indicate that of the positive HIV test reports among adults older than 15 years of age, men who have sex with other men (MSM) accounted for 42% of cases, injection drug use (IDU) accounted for 20.7% of cases, men who have sex with men and who use injection drugs accounted for 2.0% of cases, those exposed to blood or blood products accounted for 0.8% of cases, heterosexual contact accounted for 30.8% of cases and other exposure categories accounted for 3.7% of cases.
Important to note is that the relative proportion of positive HIV case reports attributed to adult males and females aged 15 and older has shifted over time. In 1985, over 95 percent of positive HIV test reports with known age and exposure category were among adult males, and over 80 percent of those reports were attributed to the MSM exposure category. By 2011, adult females with known age and exposure category accounted for 20.5 percent of new test reports, down from a peak of 25.9 percent in 2006, with heterosexual contact and injection drug use identified as the two main exposure categories.
Note: Excludes cases where exposure category was unknown.
Source: Public Health Agency of Canada, Internal Data, 2012.
The relative proportion of positive HIV case reports attributed to adult (≥ 15 years) males and females has also shifted over time. In 1985, over 95% of positive HIV test reports with known age and exposure category were among adult males, and 85% of those reports were attributed to the MSM exposure category. By 2011, adult females with known age and exposure category accounted for 20.5% of new test reports, down from a peak of 25.9% in 2006, with heterosexual contact and injection drug use identified as the two main exposure categories. Figure 9 shows the breakdown of exposure categories for adult males and females.
Figure 9: Number of positive HIV test reports among adults (≥ 15 years), by sex and exposure category, 2002-2011 (n=12,950)
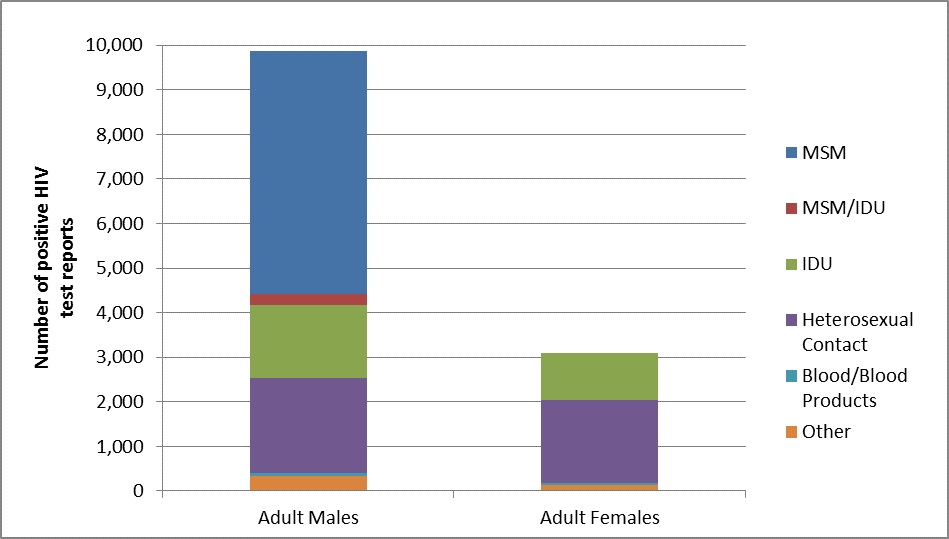
Text equivalent - Figure 9
Figure 9 is a bar chart that shows the number of positive human immunodeficiency virus (HIV) test reports among adults aged 15 and older. The y axis shows the number of positive test reports, with numbers ranging from 0 to 10,000. The x axis shows two vertical bars: one for adult males, and one for adult females. Each bar chart shows the number of positive test reports in six exposure categories. The bar chart excludes cases where exposure category or sex is unknown. The source for the information is internal data from the Public Health Agency of Canada, 2012.
| Adult Males | Adult Females | |
|---|---|---|
| MSM | 5440 | |
| MSM/IDU | 259 | |
| IDU | 1627 | 1054 |
| Heterosexual Contact | 2147 | 1845 |
| Blood/Blood Products | 61 | 45 |
| Other | 332 | 140 |
| Total | 9866 | 3084 |
Note: Excludes cases where exposure category or sex is unknown.
Source: Public Health Agency of Canada, Internal Data 2012.
2.7 Trends within each Exposure Category
The following sections provide an overview of trends within each exposure category using estimates and routine and enhanced surveillance data (where available). The order of presentation follows the national HIV infection exposure category hierarchy, not the relative number of people infected in each exposure category.
2.7.1 Perinatal Transmission
The data presented in this section represent infants born to women who were known to be HIV-positive during pregnancy. It should be noted that although all provinces and territories offer HIV testing for pregnant women, not all HIV-positive pregnant women are aware of their HIV status or diagnosed during pregnancy, and thus are not able to benefit from antiretroviral medication during pregnancy.Footnote 9
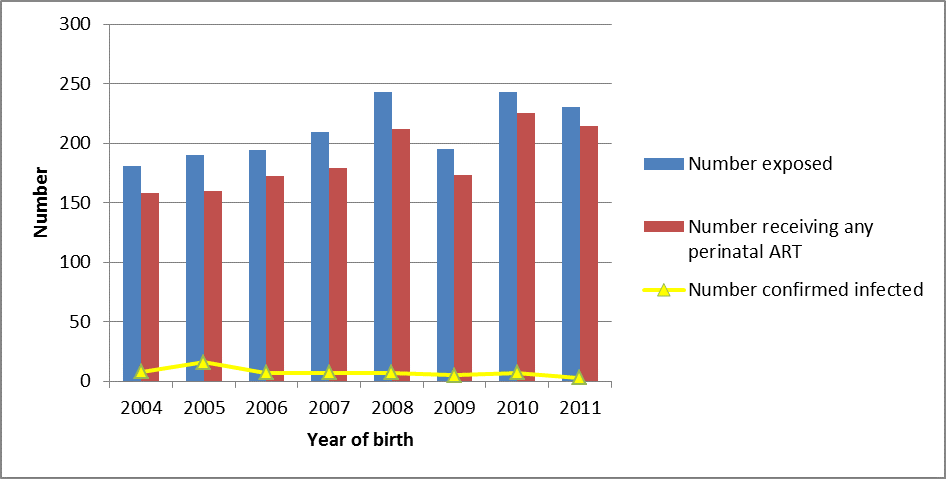
Figure 10: Number of reported infants exposed to HIV perinatally, maternal use of antiretroviral therapy, and number of infants with confirmed HIV infection, Canada, 2004-2011 (n=1,685)
Text equivalent - Figure 10
Figure 10 is a bar chart that shows the number of reported infants exposed to the human immunodeficiency virus (HIV); the maternal use of antiretroviral therapy; and, the number of infants with confirmed HIV infection. These cases are reported in Canada from the years 2004-2011. Source information is from Public Health Agency of Canada internal data, 2012.
The y axis shows the number of cases, ranging from 0 to 300. The x axis shows the year of birth, ranging from 2004 to 2011.
Source: Public Health Agency of Canada, Internal Data 2012.
Between 1984 and 2011, a reported 3,567 infants were perinatally exposed to HIV. Of these, 584 (16.4%) were confirmed to be infected, 2,908 (81.5%) were confirmed to be uninfected, and the status of the remaining 75 was unconfirmed, i.e., lost to follow-up.Footnote 6
The number of reported infants who are perinatally exposed to HIV each year in Canada has fluctuated in recent years, from 181 in 2004 to a high of 243 in both 2008 and 2010. However, the number of infants confirmed to be HIV-positive following perinatal exposure decreased from 16 (8.8% of perinatally exposed infants) in 2005 to 3 (1.3%) in 2011. This reduction is largely the result of widespread voluntary HIV testing of pregnant women and the subsequent administration of antiretroviral medication; for example, in 2011, a reported 93.0% % of known HIV-positive pregnant women received antiretroviral therapies during pregnancy.Footnote 6
Black and Aboriginal infants are disproportionately represented in confirmed HIV infections among infants in Canada. Black infants accounted for 48.3% (1,723 of 3,567) of all reported infants perinatally exposed to HIV between 1984 and 2011, although Black people make up only 2.5% of the Canadian population.Footnote 10 Over the same time period, Aboriginal infants accounted for 16.8% of all reported infants perinatally exposed to HIV, although Aboriginal peoples make up only 3.8% of the Canadian population.Footnote 5Footnote 6Footnote 11
2.7.2 Men who have Sex with Men - Injection Drug Use (MSM-IDU)
The MSM-IDU exposure category made up an estimated 3%, or 2,160 cases (ranging from 1,520 to 2,800), of prevalent infections in Canada in 2011. (5) The MSM-IDU exposure category has historically accounted for a relatively small number of the positive HIV tests reported annually through routine surveillance. Among adults, the MSM-IDU exposure category accounted for 876 (2.4%) positive HIV test reports between 1985 and 2011 In 2011 alone, 23 positive test reports were attributed to this exposure category, representing 2.1% of reported cases among all adults, and 2.6% of cases among adult males that year.Footnote 6
2.7.3 Men who have Sex with Men (MSM)
MSM has been and continues to be the single largest reported exposure category in Canada. The MSM exposure category accounted for an estimated 46.7%, or 33,330 cases (28,160 to 38,500), of prevalent infections in Canada in 2011.Footnote 5 According to routine surveillance data, the MSM exposure category accounted for 48.1% of all positive tests among adults (≥15 years old) in 2011, a proportion that has been relatively stable over the past 10 years (Figure 11). Cumulatively from 1985 to2011, 54.7% of adult positive test reports have been attributed to the MSM exposure category.Footnote 6
Figure 11: Total number of positive HIV test reports among adults (≥ 15 years), overall and attributed to the MSM exposure category (MSM comparison), 1997-2011 (n=18,768)
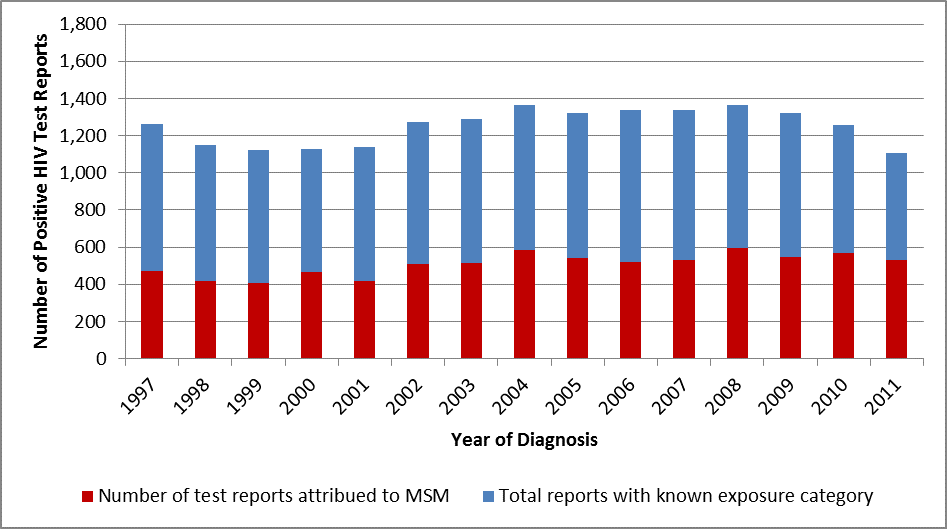
Text equivalent - Figure 11
Figure 11 is a bar chart that shows the total number of positive human immunodeficiency virus (HIV) test reports among adults 15 years of age and older overall and attributed to the men who have sex with men (MSM) exposure category, between the years 1997 and 2011.
The y axis shows the number of positive HIV test reports. The x axis shows the year of diagnosis, ranging from the years 1997 to 2011.
The chart provides information on the number of test reports attributed to MSM, and the total reports with known exposure category. The bar chart excludes cases where exposure category was unknown. Source information is from internal data provided by the Centre for Communicable Diseases and Infection Control, Public Health Agency of Canada, 2012.
The bar chart shows that the MSM exposure category accounted for an estimated 46.7 percent, or 33,000 cases (28,160 to 38,500), of prevalent infections in Canada in 2011. The total number of reports with known exposure category accounted for 48.1 percent of all positive tests in 2011.
Note: Excludes cases where exposure category was unknown.
Source: Public Health Agency of Canada, Centre for Communicable Diseases and Infection Control. Internal data 2012.
In addition to routine surveillance data, data from a national enhanced surveillance system called M-Track are also available. M-Track monitors HIV and other sexually transmitted and blood-borne infections and associated risk behaviours among men who have sex with men across sentinel sites in Canada. Phase 1 of M-Track, conducted in five sites (Montréal, Ottawa, Toronto, Winnipeg and Victoria) between 2005 and 2007, surveyed over 4,800 men. Phase 2, conducted in two sites between 2008 and 2010, surveyed over 3,000 men. Of those surveyed in M-Track Phase 1, 86% had been previously tested for HIV at least once. Among M-Track participants who provided a biological sample of sufficient quantity for laboratory testing, the overall prevalence of HIV was 15.1%, ranging from a low of 11.1% in Ottawa, to a high of 23.1% in Toronto (Figure 12). Just over 80% of HIV-positive men were aware of their serostatus, ranging from a low of 76.8% in Montréal to a high of 87.5% in Victoria. Conversely, 19% were unaware of their HIV-positive status.Footnote 12
Figure 12: Prevalence (%) of HIV among MSM who participated in Phase 1 of M-Track, 2005-2007 (n=3,309Figure 12 - Footnote *)
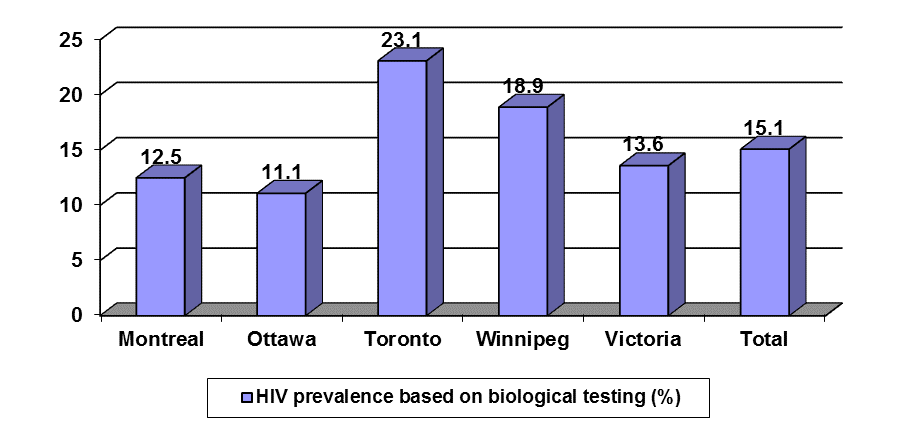
Text equivalent - Figure 12
Figure 12 is a bar chart that shows the prevalence of human immunodeficiency virus (HIV) among men who have sex with men (MSM) who participated in Phase 1 of the M-Track survey. M-Track monitors HIV and other sexually transmitted and blood-borne infections and associated risk behaviours among MSM across sentinel sites in Canada.
The y axis shows the prevalence or percentage of HIV among MSM who participated in Phase 1 of the M-Track survey. The percent number ranges from 0 percent to 25 percent. The x axis shows the percentage by sentinel city. There are bars shown in the x axis representing five cities in the following order: Montreal, Ottawa, Toronto, Winnipeg, Victoria. There is a sixth bar, showing "total". The bars represent HIV prevalence based on biological testing.
Important to note is that of the 4,793 men who completed a questionnaire in Phase 1 of M-Track, 3,309 provided a dried blood sample of sufficient quantity for HIV testing.
The source for this information is from M-Track: Enhanced surveillance of HIV, sexually transmitted and blood-borne infections, and associated risk behaviours among men who have sex with men in Canada. Phase 1 Report. Ottawa: Centre for Communicable Diseases and Infection Control, Public Health Agency of Canada: 2011.
The prevalence (in percentages) of HIV among MSM is as follows:
Montreal: 12.5 percent
Ottawa: 11.1 percent
Toronto: 23.1 percent
Winnipeg: 18.9 percent
Victoria: 13.6 percent
Total: 15.1 percent
- Footnote 1
-
Of 4,793 men who completed a questionnaire in Phase 1 of M-Track, 3,309 provided a dried blood sample of sufficient quantity for HIV testing.
Source: Public Health Agency of Canada. M-Track: Enhanced surveillance of HIV, sexually transmitted and blood-borne infections, and associated risk behaviours among men who have sex with men in Canada. Phase 1 Report. Ottawa: Centre for Communicable Diseases and Infection Control, Public Health Agency of Canada; 2011.
2.7.4 Injection Drug Use (IDU)
People who use injection drugs made up an estimated 16.9%, or 12,040 cases (estimated range of 9,580 to 14,500) of prevalent HIV infections in Canada in 2011.Footnote 5 For the past decade, IDU has been the third most commonly reported exposure category among adults (after MSM and heterosexual contact). Routine surveillance data demonstrate that the IDU exposure category accounts for 18.1% of cumulative adult positive HIV test reports for the period 1985 to 2011(Figure 13).Footnote 6
Among adults in the IDU exposure category, the majority (64.2%) of positive HIV tests in 2011 were attributed to individuals 30 to 49 years of age (where age and exposure category data were available).Footnote 6
Figure 13: Total number of positive HIV test reports among adults (≥ 15 years) overall, and attributed to the IDU exposure category, 1997-2011 (n=18,768)
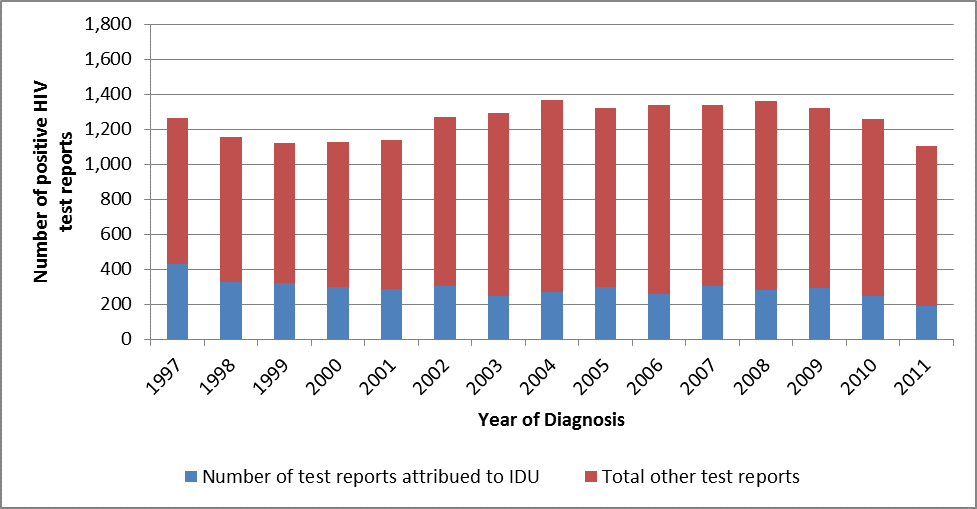
Text equivalent - Figure 13
Figure 13 is a bar chart that shows the total number of positive human immunodeficiency virus (HIV) test reports among adults aged 15 years and older overall and attributed to the injection drug use (IDU) exposure category for the years 1997 to 2011.
The y axis shows the number of positive HIV test reports, with numbers ranging from 0 to 1,800. The x axis shows the year of diagnosis, ranging from 1997 to 2011. The vertical bars, one for each year, show the number of test reports attributed to IDU and total other test reports.
This information excludes reports where exposure category or age was unknown. The source of information is internal data from the Public Health Agency of Canada, 2012.
| Year | 1997 | 1998 | 1999 | 2000 | 2001 | 2002 | 2003 | 2004 | 2005 | 2006 | 2007 | 2008 | 2009 | 2010 | 2011 | Total |
|---|---|---|---|---|---|---|---|---|---|---|---|---|---|---|---|---|
| Number of test reports attributed to IDU | 427 | 328 | 321 | 295 | 286 | 305 | 244 | 271 | 297 | 260 | 305 | 282 | 292 | 245 | 187 | 4345 |
| Total other test reports | 838 | 824 | 799 | 831 | 853 | 967 | 1046 | 1095 | 1023 | 1076 | 1033 | 1081 | 1028 | 1011 | 918 | 14423 |
| Total | 1265 | 1152 | 1120 | 1126 | 1139 | 1272 | 1290 | 1366 | 1320 | 1336 | 1338 | 1363 | 1320 | 1256 | 1105 | 18768 |
Note: Excludes reports where exposure category or age was unknown.
Source: Public Health Agency of Canada, Internal Data 2012.
Over the last decade, surveillance data reveal a decreasing trend in the proportion of positive HIV tests attributed to the injection drug use exposure category among adult males , whereas the proportion among adults females has been higher overall and much less stable (see Figure 14). Over the last decade, surveillance data indicate that IDU played a relatively greater role in positive HIV test reports among adult females compared to adult males. As illustrated in Figure 14, the proportion of HIV test reports attributed to IDU among adult males has dropped fairly steadily, from 29.9% in 1997 to 13.5% in 2011. In contrast, this exposure category has fluctuated over time among adult females, from a high of 47.5% in 1999 to a low of 25.8% in 2003.
Figure 14: Proportion of positive HIV test reports among adult (≥ 15 years) females and males attributed to the IDU exposure category, 1997-2011 (n=4,328)
Text equivalent - Figure 14
Figure 14 is a graph chart that shows the proportion of positive human immunodeficiency virus (HIV) test reports among adult males and female aged 15 and older attributed to the injection drug use (IDU) exposure category for the years 1997 to 2011. The chart excludes cases where exposure category and sex where unknown.
The chart includes two curves, one representing the percentage of positive HIV test reports attributed to the IDU exposure category for females and the other for males.
The y axis shows the proportion of positive HIV test reports in percentages. The range of numbers is from 0 to 50. The x axis shows the year of diagnosis, ranging from 1997 to 2011.
Note: Excludes cases where exposure category and sex were unknown.
Source: Public Health Agency of Canada, Internal data 2012.
Results from I-Track, a national enhanced surveillance system that monitors HIV and hepatitis C risk behaviours among people who use injection drugs, show that HIV prevalence varies across Canada. Among I-Track Phase 2 (2005-2008) participants who provided a biological sample of sufficient quantity for testing, the overall proportion who tested positive for HIV was 13.2%: 11.4% among female participants and 14.1% among male participants. HIV prevalence ranged across sentinel sites from 2.5% in Kingston and 3.2% in Toronto to 17.3% in Prince George and 19.9% in the SurvUDI network, which includes Ottawa and various cities in the province of Quebec (Figure 15). Among those who tested HIV-positive according to laboratory results, 20.9% were unaware of their HIV-positive status.Footnote 12
Figure 15: Prevalence (%) of HIV among people who use injection drugs participating in Phase 2 of I-Track, 2005-2008 (n=2,970)
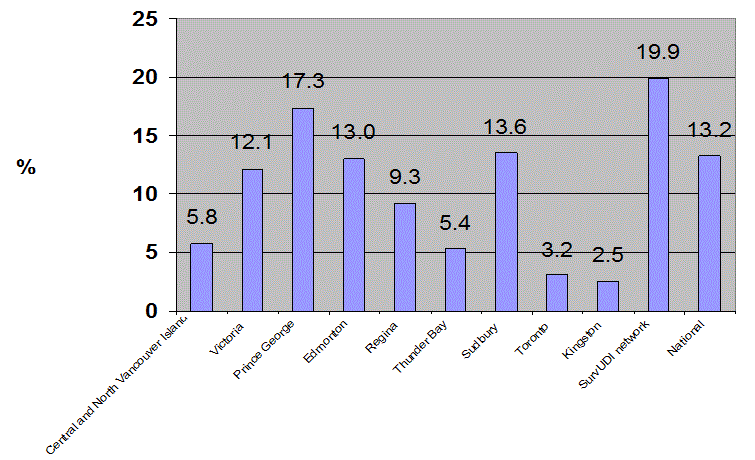
Text equivalent - Figure 15
Figure 15 is a bar chart that shows the prevalence (percentage) of human immunodeficiency virus (HIV) among people who use injection drugs participating in Phase 2 of the I-Track survey, 2005-2008. I-Track is a national enhanced surveillance system that monitors HIV and hepatitis C risk behaviours among people who use injection drugs.
The y axis shows the percentage, with numbers ranging from 0 to 25 percent. The x axis shows prevalence of HIV based on biological testing in cities/regions identified across Canada. The cities/regions are: Central and North Vancouver Island, Victoria, Prince George, Edmonton, Regina, Thunder Bay, Sudbury, Toronto, Kingston, the SurvUDI network, and National.
The source for the information is the Centre for Communicable Diseases and Infection Control, Public Health Agency of Canada. It is taken from unpublished data from I-Track: Enhanced surveillance of risk behaviours among people who inject drugs, Phase 2, 2005-2008.
| Prevalence (percentage) of HIV among IDU | City/region |
|---|---|
| 5.8 | Central and North Vancouver Island |
| 12.1 | Victoria |
| 17.3 | Prince George |
| 13.0 | Edmonton |
| 9.3 | Regina |
| 5.4 | Thunder Bay |
| 13.6 | Sudbury |
| 3.2 | Toronto |
| 2.5 | Kingston |
| 19.9 | SurvUDI network |
| 13.2 | National |
Source: Public Health Agency of Canada. Unpublished data from I-Track: Enhanced surveillance of risk behaviours among people who inject drugs. Phase 2 (2005-2008). Ottawa: Centre for Communicable Diseases and Infection Control, Public Health Agency of Canada; 2012.
2.7.5 Recipient of Blood and/or Blood Products
From 1985 to 1995, a cumulative total of 815 positive HIV test reports were attributed to the recipient of blood or blood products (e.g. clotting factor) exposure category. Many of those affected were haemophiliacs. When it became clear that HIV could be passed through blood donations and transfusions, HIV screening of blood products was instituted in 1985.
From 1995 onwards, the annual number of positive HIV test reports attributed to the blood or blood products category has decreased substantially. Since 2000, there have been between 6 and 16 HIV cases reported each year attributed to this category.Footnote 6 Given the procedures in place for the screening of blood and blood products, it is hypothesized that these are either people who received blood products in Canada before 1985, or people who received blood products in other countries where screening practices may differ.
2.7.6 Heterosexual Contact
Surveillance data identify the following three sub-categories of exposure through heterosexual contact: origin from an HIV-endemic country (Het-Endemic)Footnote 8, sexual contact with a person at risk (Het-Risk) and heterosexual contact with no identified risk (NIR-Het).
The heterosexual contact exposure category accounted for an estimated 32.5%, or 23,170 cases (19,040 to 27,300) of prevalent infections in Canada at the end of 2011. An estimated 17.6% of total prevalent infections were attributed to heterosexual non-endemic (including both Het-Risk and NIR-Het) and 14.9% of total prevalent infections were attributed to heterosexual contact among persons born in an HIV-endemic country.Footnote 5
Routine surveillance data show that in 2001 the heterosexual contact exposure category surpassed IDU as the second-most reported exposure category among adults (after MSM,) and has subsequently accounted for approximately one-third of positive HIV test reports each year.Footnote 6
Positive HIV test reports among adults show that from 1997 to 2011, 29.5%, (5,543) of cases were attributed to the combined heterosexual contact exposure category. Of these, 13.8% (2,597) of reports were attributed to NIR-Het , 9.5% (1,789) to Het-Risk , and 6.2% (1,157) to Het-Endemic (see Figure 16).Footnote 6 These sub-categories are explored in further detail in the following sections.
Figure 16: Total number of positive HIV test reports among adults (≥ 15 years), overall and attributed to the heterosexual exposure category,1997-2011 (n= 18,768)
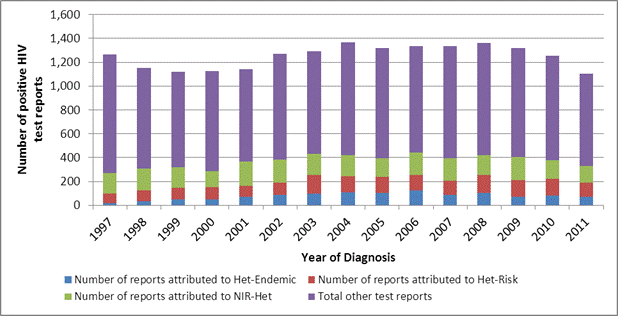
Text equivalent - Figure 16
Figure 16 is a bar chart that shows the total number of positive human immunodeficiency virus (HIV) test reports among adults 15 years and older overall and attributed to the heterosexual exposure category for the years 1997 to 2011. It excludes cases where exposure category was unknown. The source of the information is internal data from the Public Health Agency of Canada, 2012.
The y axis shows the number of positive HIV test reports. The number ranges from 0 to 1,600. The x axis shows the year of diagnosis. The years range from 1997 to 2011. Bars are shown for each year, with numbers shown for four groups in the heterosexual exposure category. They are:
Number of test reports with origins from an HIV endemic country (Het-Endemic)
Number of test reports among hetersexuals with no identified risk (NIR-Het)
Number of test reports with origins from a person at risk (Het-Risk)
Total other test reports
| Year | 1997 | 1998 | 1999 | 2000 | 2001 | 2002 | 2003 | 2004 | 2005 | 2006 | 2007 | 2008 | 2009 | 2010 | 2011 | Total |
|---|---|---|---|---|---|---|---|---|---|---|---|---|---|---|---|---|
| Number of reports attributed to Het-Endemic | 17 | 35 | 48 | 52 | 71 | 89 | 100 | 108 | 101 | 123 | 85 | 104 | 72 | 80 | 72 | 1157 |
| Number of reports attributed to Het-Risk | 80 | 91 | 99 | 99 | 93 | 99 | 154 | 135 | 136 | 132 | 119 | 152 | 139 | 143 | 118 | 1789 |
| Number of reports attributed to NIR-Het | 172 | 180 | 172 | 136 | 203 | 197 | 178 | 176 | 156 | 186 | 191 | 162 | 193 | 156 | 139 | 2597 |
| Total other test reports | 996 | 846 | 801 | 839 | 772 | 887 | 858 | 947 | 927 | 895 | 943 | 945 | 916 | 877 | 776 | 13225 |
Note: Excludes cases where exposure category was unknown.
Source: Public Health Agency of Canada, Internal data, 2012.
2.7.6.1 Heterosexual Contact - Analysis by Biological Sex
Within the heterosexual exposure category, the number of positive HIV test reports attributed to adult males and females is fairly similar. (See Figure 17.)
Figure 17: Number of positive HIV test reports attributed to the heterosexual contact exposure category among adults (≥ 15 years), by sex, 1997-2011 (n=5,537)
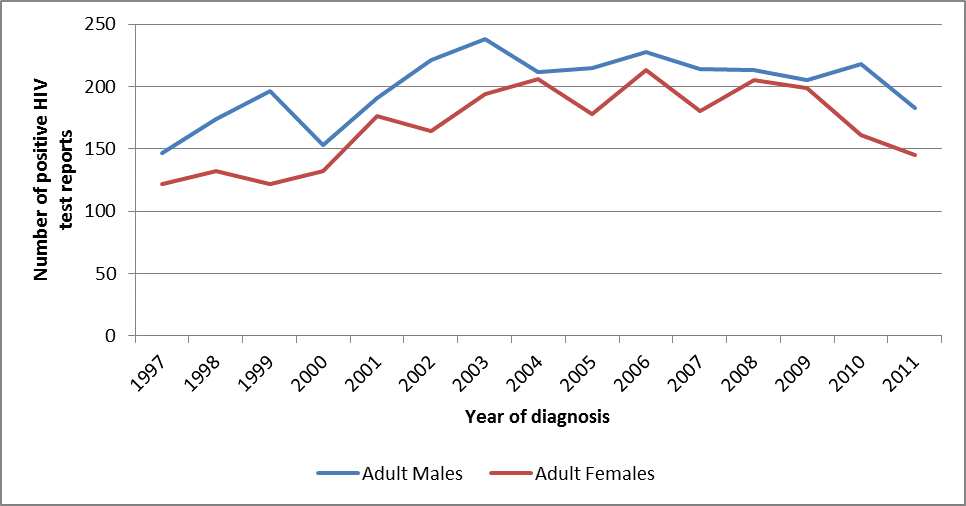
Text equivalent - Figure 17
Figure 17 is a graph chart that shows the number of positive human immunodeficiency virus (HIV) test reports attributed to the heterosexual contact exposure category among adults aged 15 years and over, by sex, for the years 1997 to 2011. It excludes cases where exposure category, sex and age were unknown. The source of the information is internal data from the Public Health Agency of Canada, 2012.
The y axis shows the number of positive HIV test reports, with numbers ranging from 0 to 250. The x axis shows the year of diagnosis, with years ranging from 1997 to 2011.
The graph contains two curves showing the number of positive HIV test reports, one for adult males and one for adult females.
| Year | 1997 | 1998 | 1999 | 2000 | 2001 | 2002 | 2003 | 2004 | 2005 | 2006 | 2007 | 2008 | 2009 | 2010 | 2011 | Total |
|---|---|---|---|---|---|---|---|---|---|---|---|---|---|---|---|---|
| Adult Males | 147 | 174 | 196 | 153 | 191 | 221 | 238 | 212 | 215 | 228 | 214 | 213 | 205 | 218 | 183 | 3008 |
| Adult Females | 122 | 132 | 122 | 132 | 176 | 164 | 194 | 206 | 178 | 213 | 180 | 205 | 199 | 161 | 145 | 2529 |
Note: Excludes cases where exposure category, sex and age were unknown.
Source: Public Health Agency of Canada, Internal data, 2012.
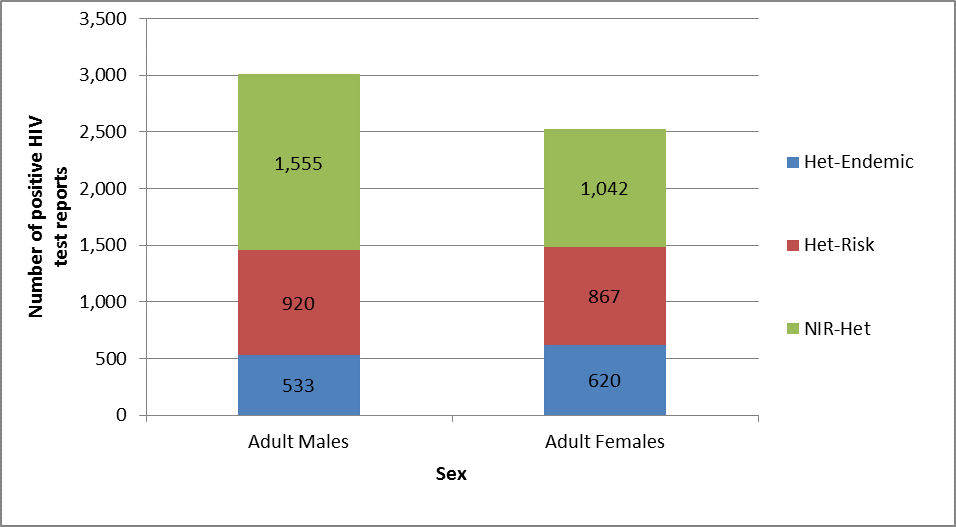
While the proportions of positive HIV test reports among adults attributed to the Het-Risk sub-category are similar for females and males (34.3% and 30.6% respectively), a higher proportion of cases among females has been attributed to the Het-Endemic sub-category, accounting for 24.5 % of all female cases between 1997 and 2011, compared with 17.7% of all male cases (see Figure 18).
Figure 18: Total number of positive HIV test reports attributed to the heterosexual contact exposure subcategories among adults (≥ 15 years), by sex, 1997-2011 (n=5,537)
Text equivalent - Figure 18
Figure 18 is a bar chart that shows the total number of positive human immunodeficiency virus (HIV) test reports attributed to the heterosexual contact exposure subcategories among adults aged 15 years and older, by sex, in the years 1997 to 2011. The information excludes cases where sex is unknown. The source for the information is internal date from the Public Health Agency of Canada, 2012.
The y axis shows the number positive HIV test reports, with numbers ranging from 0 to 2,000. The x axis shows the number of positive HIV test reports for adult males and adult females in three subcategories of the heterosexual contact exposure. They are:
Number of test reports of male and female adults with origins from an HIV endemic country (Het-Endemic)
Number of test reports with origins from a person at risk (Het-Risk)
Number of test reports among hetersexuals with no identified risk (NIR-Het).
| Adult Males | Adult Females | Total | % | |
|---|---|---|---|---|
| Het-Endemic | 533 | 620 | 1153 | 20.80% |
| Het-Risk | 920 | 867 | 1787 | 32.30% |
| NIR-Het | 1555 | 1042 | 2597 | 46.90% |
Note: Excludes cases where sex is unknown
Source: Public Health Agency of Canada, Internal Data 2012.
2.7.6.2 Heterosexual Contact - Analysis by Age Group
Examination of HIV case reports by age distribution reveals a different pattern in the Het-Endemic exposure subcategory relative to the other heterosexual contact subcategories. From 1997 to 2011, 74.7% of positive HIV test reports (adults only) attributed to the Het-Endemic category were among people between the ages of 15 and 39 years. This is significantly higher than the Het-Risk and NIR-Het subcategories, at 63.4% and 59.1% respectively, for this same age range. These data suggest that HIV cases attributed to the Het-Endemic exposure subcategory tend to be diagnosed at younger ages.Footnote 6
2.7.6.3 Heterosexual Contact - Origin from an HIV-Endemic Country
Disproportionate rates of infection have been noted among people living in Canada who were born in a country where HIV is endemic. This group makes up approximately 2.2% of the Canadian population; (15) but according to the 2011 HIV estimates, it accounted for an estimated 16.9% of new infections and 14.9% of prevalent infections to the end of 2011. Thus, the 2011 estimated new infection rate among people from HIV-endemic countries was about 9.0 times higher than among other Canadians.Footnote 5
While Canada tests for HIV during the Immigrant Medical Examination (IME), an HIV-positive diagnosis does not automatically preclude entry into Canada. Positive HIV tests from IMEs performed in Canada are reported to the provinces and territories and are forwarded to the national level, as are all other positive HIV test reports. Thus, the data presented as 'heterosexual contact - origin from an HIV-endemic country' in surveillance reports include a combination of test reports from routine medical testing (i.e., prenatal), IMEs and other sources. Due to the reporting system, it is not always possible to determine whether infections attributed to the Het-Endemic subcategory actually occurred in another country before the newcomer arrived to Canada, or whether the infection occurred after arrival.
Overall, females represented 23.4% of all positive HIV test reports in Canada among adults which included data on sex, for the period of 1997 to 2011. Within the Het-Endemic exposure subcategory, however, the proportion is quite different, with adult females accounting for 53.8% of positive HIV test reports during this period. (6) This is the only exposure category or sub-category with a higher proportion of cases attributed to adult females than adult males.
2.7.6.4 Heterosexual Contact - Sexual Contact with a Person at Risk
Adult males and females may identify a sexual partner who is HIV-positive or who engages in behaviours associated with a high risk of HIV transmission, such as using injection drugs, as their most likely route of transmission. Such a risk factor would be classified as Heterosexual Contact, under the subcategory of sexual contact with a person at risk (Het-Risk) Cumulatively from 1985-2011, 6.9% of all adult HIV cases have been attributed to the Het-Risk exposure category.Footnote 6 Over this same time period, the absolute number of HIV cases in the Het-risk category reported among males are very similar to those attributed to females (1270 and 1285 respectively), however proportionately, this category plays a relatively larger role in case reports among females. For example, where sex and exposure category are known, the Het Risk exposure category accounts for 21% of all positive HIV test reports among adult females, compared to 4.1% among adult males.
2.7.6.5 Heterosexual Contact - Sexual Contact with a Person with No Identified Risk
This category (NIR-Het) captures individuals for whom heterosexual sexual contact is the only risk factor reported and nothing is known about the HIV-related risk factors associated with any sexual partner(s), a country of origin, injection drug use, etc. Within the heterosexual exposure category, the NIR-Het and Het-Risk exposure subcategories have accounted for the highest number of HIV case reports among adult females. Cumulatively from 1985 to 2011, 9.0% of adult HIV cases were attributed to the NIR-Het exposure subcategory. Within the Heterosexual Contact exposure category, NIR-Het accounted for 45.8% of cumulative HIV cases among adults.Footnote 6
2.8 Race/Ethnicity and HIV
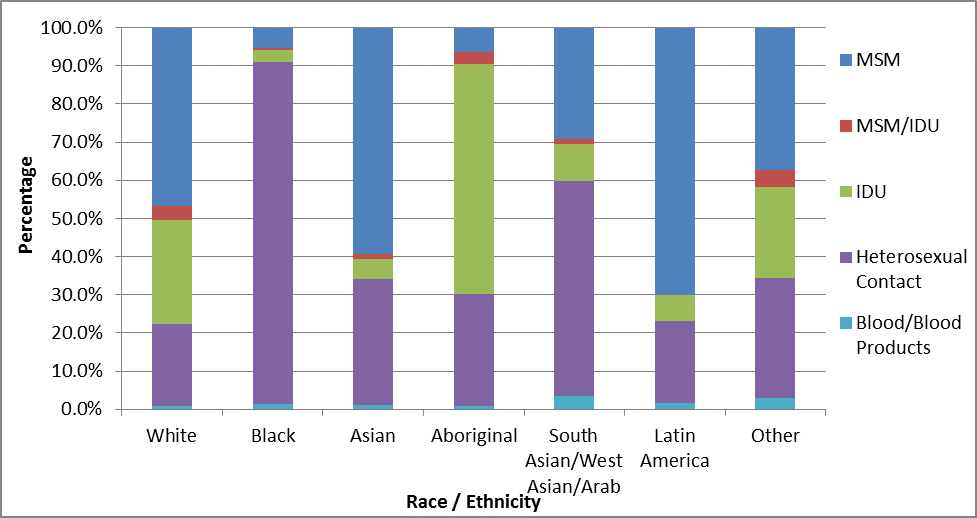
There are a number of challenges in collecting data on race/ethnicity in Canada - the categories are limited, they differ from province to province, some provinces do not submit these data to the Agency, and, even when they do, the information is not always complete. Nonetheless, the available surveillance data and targeted studies of at-risk populations suggest that the exposure category distribution varies between different racial/ethnic groups. The highest proportion of positive HIV test reports among adults attributed to heterosexual contact (89.7%) is among those who self-identify as Black, while the highest proportion of positive HIV test reports attributed to injection drug use (60.1%) are reported among Aboriginal peoples.Footnote 6
Figure 19: Proportion of positive HIV test reports among adults (≥ 15 years) by race/ethnicity and exposure category, 1998-2011 (n=9,964)
Text equivalent - Figure 19
Figure 19 is a bar chart that shows the proportion of positive human immunodeficiency virus (HIV) test reports among adults aged 15 and older, by race/ethnicity, and exposure category, for the years 1998 to 2011. It excludes cases where race/ethnicity is unknown. Source information is internal data from the Public Health Agency of Canada, 2012.
The y axis shows the percentage of HIV test reports and ranges from 0 to 100.
The x axis shows the race/ethnicity of the test subjects. There are bars respesenting the following race/ ethnicities: White; Black; Asian; Aboriginal; South Asian/West Asian/Arab; Latin American; and, Other. The bars also include the exposure category: men who have sex with men (MSM); MSM and who are injection drug users (MSM-IDU); IDU; heterosexual contact; and, blood/blood products.
| White | Black | Asian | Aboriginal | South Asian/West Asian/Arab | Latin America | Other | Total | |
|---|---|---|---|---|---|---|---|---|
| MSM | 46.8% | 5.3% | 59.4% | 6.4% | 29.1% | 70.1% | 37.3% | 32.6% |
| MSM/IDU | 3.5% | 0.5% | 1.2% | 3.2% | 1.5% | 0.0% | 4.5% | 2.9% |
| IDU | 27.3% | 3.2% | 5.4% | 60.1% | 9.7% | 6.6% | 23.9% | 31.8% |
| Heterosexual Contact | 21.5% | 89.7% | 32.8% | 29.5% | 56.1% | 21.6% | 31.3% | 31.7% |
| Blood/Blood Products | 0.8% | 1.3% | 1.2% | 0.8% | 3.6% | 1.7% | 3.0% | 1.0% |
Note: Excludes cases where race/ethnicity is unknown.
Source: Public Health Agency of Canada, Internal Data 2012.
2.8.1 Aboriginal People
Aboriginal people are disproportionately affected by HIV. Given the challenges in collecting data on race/ethnicity, the estimates of HIV incidence and prevalence provide a more accurate picture of the burden of HIV infection on the Aboriginal population than surveillance of positive HIV test reports. Although Aboriginal people made up only 3.8% of the overall Canadian population in 2006,Footnote 11 this population accounted for an estimated 12.2% of new infections in 2008 and 8.9% of all prevalent infections at the end of 2011. Thus, the 2011 estimated new infection rate among the Canadian Aboriginal population was about 3.5 times higher than among the non-Aboriginal population. (5) Routine surveillance data indicate that 89.6% of positive HIV test reports among Aboriginal adults are attributed to injection drug use or heterosexual contact (see Figure 19).Footnote 6
2.8.2 Black People
The exposure subcategory of 'Heterosexual contact - origin from an HIV-endemic country' (Het-Endemic) does not capture a specific race or ethnicity; however, Black people of African and Caribbean descent make up a large proportion of positive HIV test reports in this exposure category. Sixty-five of the 71 countries identified as being HIV-endemic are in Africa and the Caribbean. Routine surveillance data indicate that Black adults account for 93.8% of positive HIV test reports in the Het-Endemic exposure subcategory.Footnote 6
2.9 People in Prison
Surveillance data provided by the Correctional Service of Canada (CSC) indicate that in 2006, 52.1% of all new admissions to federal correctional facilities had a blood test for HIV. Based on the sample of those who tested, the year-end prevalence of HIV was 1.6% in the federal prison population. The year-end prevalence differed between females (4.5%) and males (1.5%). In 2006, an estimated total of 375 people in prison were living with HIV.Footnote 16
CSC reports that the majority of people who test positive upon admission to federal prison are already aware of their HIV status. Of the 162 persons identified as HIV-positive on admission in 2006, only seven persons were newly diagnosed, while the remaining 155 had been previously diagnosed as HIV-positive. People in prison come from, and return to, the general population. In 2006, 193 known HIV-positive persons were released from federal correctional facilities across Canada back into the community.Footnote 16
In 2007, CSC conducted a survey among people in prison, the National Inmate Infectious Diseases and Risk Behaviours Survey (NIIDRBS). Respondents were asked to self-report their HIV and hepatitis C (HCV) status. Among those who had ever been tested for HIV infection (including those who were tested prior to admission, at admission, and/or since admission), 4.6% reported being HIV-positive. Proportions differed between females and males: 7.9% of females and 4.5% of males reported being HIV-positive. Among female Aboriginal survey respondents, the self-reported prevalence of HIV (11.7%) was more than twice that of other females (5.5%).Footnote 17 Methodological differences between the surveillance and research data preclude direct comparisons between the results of the NIIDRBS and CSC surveillance data.
Figure 20: Percentage of persons in prison ever reporting a positive HIV or HCV test; result by sex and Aboriginal self-identification
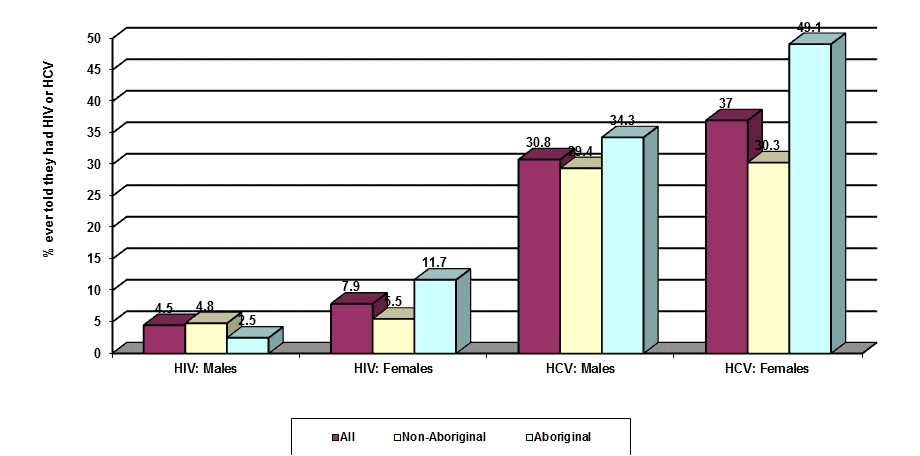
Text equivalent - Figure 20
Figure 20 is a bar chart that shows the percentage of persons in prison ever reporting a positive human immunodeficiency virus (HIV) or hepatitis C virus (HCV) test result by sex and Aboriginal self-identification.
The y axis shows the percentage of persons in prison who had ever been told they had HIV or HCV. This number ranges from 0 to 50.
The x axis contains four sections, two for HIV, one for males and the other for females, and two for HCV, again one for males and one for females. Within each section, there are three bars representing the total, Non-Aboriginal and Aboriginal prison populations respectively.
The source of the information is from a summary of emerging findings from the 2007 National Inmate Infectious Diseases and Risk-Behaviours Survey, Correctional Services Canada, 2010.
| Population | Percentage | ||
|---|---|---|---|
| All | Aboriginal | Non-Aboriginal | |
| HIV: males | 4.5 | 4.8 | 2.5 |
| HIV: females | 7.9 | 5.5 | 11.7 |
| HCV: males | 30.8 | 29.4 | 34.3 |
| HCV: females | 37 | 30.3 | 49.1 |
Source: Zakaria D, Thompson JM, Jarvis A, Borgatta F. Summary of emerging findings from the 2007 National Inmate Infectious Diseases and Risk-Behaviours Survey. Ottawa: Correctional Service of Canada; 2010.
In addition to the data gathered from CSC, studies exploring HIV and HCV prevalence and associated risk factors among people in provincial and territorial prisons are ongoing. The short duration of prison sentences create ever-changing populations that make surveillance within these institutions difficult. Below is a summary of available data and literature results for the period 2002-2011.
- A study was conducted in 2003 to determine the prevalence of HIV and HCV, and to examine associated risk factors among people in provincial prisons in Quebec. Poulin et al. surveyed seven prisons using a self-administered questionnaire and collected saliva samples from survey respondents. Among the 1,607 participants, the overall prevalence of HIV was 3.4%. The prevalence of HIV was 8.8% among females, which was significantly higher than the prevalence of HIV among males (2.4%). Among all respondents, 20% of those who tested positive for HIV were unaware of their status. Injection drug use was the strongest risk factor associated with HIV infection in the sample population.Footnote 18
- The Ontario Remand Study was conducted in 2003-2004 across 13 Ontario remand facilities and consisted of a voluntary, anonymous, cross-sectional survey and provision of a saliva test. This study had 1,528 respondents and reported a weighted HIV prevalence of 2.0% among adults in Ontario prisons. This study found that the prevalence of HIV in males was higher than among females (2.1% versus 1.8% respectively); and the prevalence of HIV infection was lower among Aboriginal peoples (0.0%) than among other survey respondents (2.2%). The Ontario Remand Study identified a history of injection drug use as the risk behaviour most strongly associated with HIV infection.Footnote 19
- A recent study of the prevalence of sexually transmitted and blood-borne infections conducted among a random sample of 374 people in Manitoba provincial prisons found that 0.8% tested positive for HIV. HIV prevalence among females was more than three times that among males, with 1.9% of females testing positive for HIV and 0.6% of males testing positive.Footnote 20
- A self-administered survey of 104 women in the Burnaby Correctional Centre for Women in British Columbia found that 8% of respondents self-reported living with HIV.Footnote 21
Reported infections may underestimate the true burden of disease within correctional facilities, as not all of those who are HIV-positive undergo testing or self-identify, in part due to fears of discrimination. In the NIIDRBS study, 67% of PHA in federal prisons reported concerns about discrimination.Footnote 17
2.10 Co-infection with Sexually Transmitted and Blood-borne Infections
For PHA, living with another infection, such as HCV or a sexually transmitted infection, can have complex implications for care. Little national data are available on co-infections with other sexually transmitted and bloodborne infections. There is some information from enhanced surveillance systems about co-seropositivity with HCV and syphilis among specific populations at risk. The term co-seropositivity is used here instead of co-infection because the laboratory test used in enhanced surveillance only detects lifetime prevalence and cannot distinguish between past and current infection (i.e., it detects only antibodies).Among M-Track Phase 1 participants (2005-2007) who provided a biological sample of sufficient quantity for testing for both HIV and syphilis, and for both HIV and HCV, 2.9% were seropositive for both HIV and syphilis and 2.2% were seropositive for both HIV and HCV.Footnote 12 Among people who use injection drugs who participated in I-Track Phase 2 (2005-2008), laboratory-confirmed HIV-HCV co-seropositivity was 11.6%.Footnote 14
2.11 Drug Resistance
Advances in antiretroviral therapy have improved HIV management and reduced morbidity and mortality rates for many PHA in Canada. Despite simplified and highly effective treatment regimens, there are concerns that widespread use of antiretroviral medications may increase transmission of drug-resistant HIV strains. The Canadian HIV Strain and Drug Resistance (SDR) Surveillance Program monitors transmitted HIV drug resistance among treatment-naïve persons newly diagnosed with HIV infection in Canada.
Of 4,521 HIV diagnostic samples collected by the SDR Program from 1999 to 2008, the overall prevalence of resistance to at least one antiretroviral drug among newly diagnosed PHA who never received antiretroviral treatment was 9.8%. The proportion with resistance to two or more classes of antiretroviral drugs was 1.0%. Available data suggest that these estimates are similar to those observed in other developed countries where highly active antiretroviral treatment is used. Infection with drug-resistant HIV strains likely reflects HIV transmission from persons already diagnosed and under care. People infected with drug-resistant HIV strains may have limited treatment options and are at increased risk of drug failure. From a public health perspective, transmission of HIV drug resistance complicates prevention and control of HIV and may result in increased healthcare costs.Footnote 22
2.12 AIDS Reporting
In Canada, physicians are required to report the occurrence of AIDS-defining illnesses in patients already diagnosed with HIV. A total of 22,473 AIDS cases have been reported to the Agency up to December 31, 2011, with the first case being retrospectively identified as having occurred in 1979. The greatest number of reported cases occurred in 1993, when 1,833 AIDS cases were reported. In 2011, 189 AIDS cases were reported.Footnote 6
In the period before the widespread use of antiretroviral medications, the occurrence of an AIDS-defining illness was significant and usually an indicator of severe disease progression, often approaching death. In 1996 however, the profile of the disease changed dramatically with the introduction of antiretroviral medications. For many, HIV was no longer a death sentence. The onset of an AIDS-defining illness has become less likely except in particular circumstances; for example, where the medications are not working or a person living with HIV/AIDS is not getting regular medical care or is not adhering to treatment. HIV has become, for many, a complex chronic disease that can be managed over time.
Given the changes described above, not all doctors continue to report AIDS-defining illnesses in patients already living with HIV. Furthermore, while AIDS is still a nationally notifiable disease, not all provinces and territories collect and submit data on AIDS cases to the Agency. It is understood, therefore, that AIDS cases are under-reported at the national level, making it difficult to form a national picture of the AIDS epidemic in Canada.Footnote 6
2.13 AIDS Deaths
There have been a total of 13,584 reported AIDS deaths in Canada between 1980 and 2011.Footnote 6 Figure 21 shows the dramatic decline in AIDS mortality after 1996.
Figure 21: Number of reported deaths of reported AIDS cases, 1980-2011, (n=13,584)
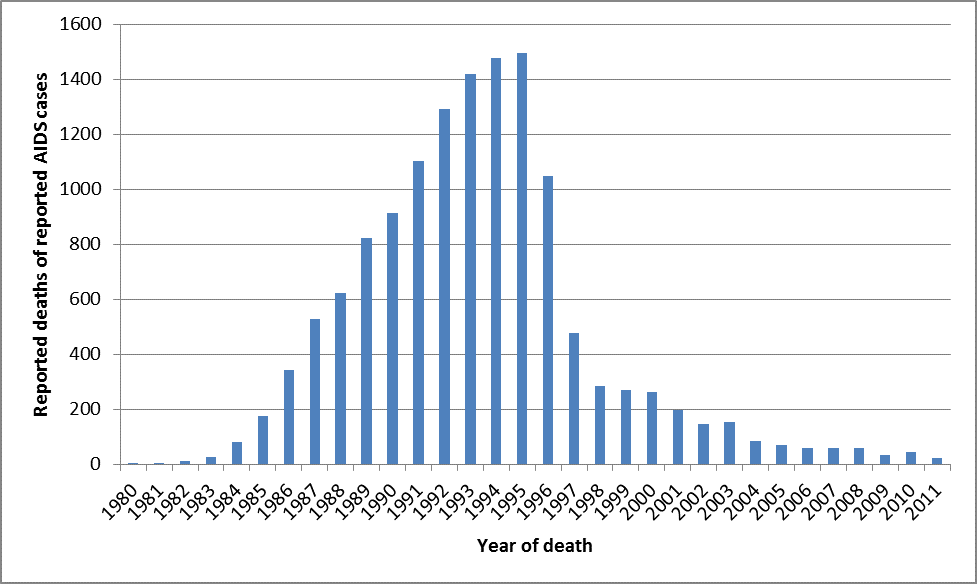
Text equivalent - Figure 21
Figure 21 is a bar chart that shows the number of reported deaths of reported cases of acquired immune deficiency syndrome (AIDS) cases between the years 1980 and 2011.
The y axis shows the reported deaths of reported AIDS cases, with numbers ranging from 0 to 1,600.
The x axis shows the year of death, with the years ranging from 1980 to 2011.
| Reported deaths of reported AIDS cases | Year of death |
|---|---|
| 2 | 1980 |
| 5 | 1981 |
| 13 | 1982 |
| 28 | 1983 |
| 80 | 1984 |
| 175 | 1985 |
| 341 | 1986 |
| 527 | 1987 |
| 622 | 1988 |
| 821 | 1989 |
| 912 | 1990 |
| 1104 | 1991 |
| 1292 | 1992 |
| 1417 | 1993 |
| 1476 | 1994 |
| 1495 | 1995 |
| 1049 | 1996 |
| 479 | 1997 |
| 285 | 1998 |
| 269 | 1999 |
| 262 | 2000 |
| 199 | 2001 |
| 145 | 2002 |
| 154 | 2003 |
| 85 | 2004 |
| 70 | 2005 |
| 61 | 2006 |
| 58 | 2007 |
| 59 | 2008 |
| 33 | 2009 |
| 44 | 2010 |
| 22 | 2011 |
Source: Public Health Agency of Canada, Internal Data 2012.
It should be noted that the number of reported deaths among reported AIDS cases does not accurately capture the actual number of deaths among people with AIDS. There are several reasons for this: reporting delays; related causes of death, such as pneumonia, may be listed instead of AIDS; AIDS cases themselves are underreported and therefore deaths in unreported cases are not recorded; death is not a mandatory reportable variable in the HIV and AIDS surveillance system; and not all provinces and territories submit AIDS data.
2.14 Conclusion
Notwithstanding certain limitations regarding the collection and reporting of data, a number of helpful inferences and conclusions can be based on the information presented in this chapter. Surveillance and epidemiological data paint the picture of an increasingly diverse population of PHA in Canada, supporting the move to targeted population-specific research and programming. The fact that new infections continue to occur points to the need for a sustained and renewed approach to prevention, care, treatment and support that addresses the specific needs of the diverse populations that are at risk of and living with HIV.
2.15 References
- Footnote 1
Doherty, J, King, S. Bureau of Epidemiology LCDC. Case Report: Pneumocystis carinii pneumonia in a homosexual male - Ontario. Canada Diseases Weekly Report 1982 Mar 27;8(13):65-8.
- Footnote 2
Public Health Agency of Canada. Population-specific HIV/AIDS status report: People from countries where HIV is endemic - Black people of African and Caribbean descent living in Canada. Ottawa: Public Health Agency of Canada; 2009.
- Footnote 3
Public Health Agency of Canada. Population-specific HIV/AIDS status report: Aboriginal Peoples. Ottawa: Public Health Agency of Canada; 2010.
- Footnote 4
Government of Canada. The Federal Initiative to HIV/AIDS in Canada: Strengthening federal action in the Canadian response to HIV/AIDS. Ottawa: Government of Canada; 2004.
- Footnote 5
Public Health Agency of Canada. Summary: Estimates of HIV prevalence and incidence in Canada, 2011. Ottawa: Centre for Communicable Diseases and Infection Control, Public Health Agency of Canada; 2012.
- Footnote 6
Public Health Agency of Canada. HIV and AIDS in Canada: Surveillance report to December 31, 2011. Ottawa: Centre for Communicable Diseases and Infection Control, Public Health Agency of Canada; 2012.
- Footnote 7
Statistics Canada. Population and dwelling counts, for Canada, provinces and territories, 2006 and 2001 censuses - 100% data. Ottawa: Statistics Canada; 2007.
- Footnote 8
Health Canada, Canadian AIDS Society. A guide to HIV/AIDS epidemiological and surveillance terms. Ottawa: Canadian AIDS Society and Health Canada; 2002.
- Footnote 9
Public Health Agency of Canada. HIV/AIDS Epi Updates, July 2010. Chapter 7: Perinatal HIV/AIDS among women in Canada. Ottawa: Centre for Communicable Diseases and Infection Control, Public Health Agency of Canada; 2010.
- Footnote 10
Statistics Canada. Visible minority groups, 2006 counts for Canada, provinces and territories - 20% sample data. Ottawa: Statistics Canada; 2012.
- Footnote 11
Statistics Canada. Aboriginal ancestry, Area of residence, Age groups, Sex and selected demographic, cultural, labour force, educational and income characteristics. Census 2006. Ottawa: Statistics Canada, 2009.
- Footnote 12
Public Health Agency of Canada. M-Track: Enhanced surveillance of HIV, sexually transmitted and blood-borne infections, and associated risk behaviours among men who have sex with men in Canada. Phase 1 Report. Ottawa: Centre for Communicable Diseases and Infection Control, Public Health Agency of Canada; 2011.
- Footnote 13
Public Health Agency of Canada. HIV/AIDS Epi Updates, July 2010. Chapter 10: HIV/AIDS among people who inject drugs in Canada. Ottawa: Centre for Communicable Diseases and Infection Control, Public Health Agency of Canada; 2010.
- Footnote 14
Public Health Agency of Canada. Unpublished data fromI-Track: Enhanced surveillance of risk behaviours among people who inject drugs. Phase 2 (2005-2008). Ottawa: Centre for Communicable Diseases and Infection Control, Public Health Agency of Canada; 2012.
- Footnote 15
Statistics Canada. Immigrant status and place of birth (38), Immigrant status and period of immigration (8A), Age groups (8), Sex (3) and Selected demographic, cultural, labour force, educational and income characteristics (277), for the total population of Canada, provinces, territories, Census metropolitan areas and Census agglomerations, 2006 Census - 20% Sample Data, Census 2006. Ottawa: Statistics Canada; 2012.
- Footnote 16
Correctional Service of Canada. Infectious disease surveillance in Canadian federal penitentiaries, 2005-2006. Ottawa: Correctional Service of Canada; 2011.
- Footnote 17
Zakaria D, Thompson JM, Jarvis A, Borgatta F. Summary of emerging findings from the 2007 National Inmate Infectious Diseases and Risk-Behaviours Survey. Ottawa: Correctional Service of Canada; 2010.
- Footnote 18
Poulin C, Alary M, Lambert G, Godin G, Landry S, Gagnon H, et al. Prevalence of HIV and hepatitis C virus infections among inmates of Quebec provincial prisons. CMAJ 2007;177(3):252-6.
- Footnote 19
Calzavara L, Ramuscak N, Burchell AN, Swantee C, Myers T, Ford P, et al. Prevalence of HIV and hepatitis C virus infections among inmates of Ontario remand facilities. CMAJ 2007;177(3):257-61.
- Footnote 20
Beaudoin C, Sloane M, Wood M, Larsen T, Wylie J, Dawood M, et al. The epidemiology of sexually transmitted infections and blood borne pathogens in a random sample of inmates in Manitoba correctional centres: Statistical report for stakeholders. Winnipeg; 2009..
- Footnote 21
Martin RE, Gold F, Murphy W, Remple V, Berkowitz J, Money D. Drug use and risk of bloodborne infections: a survey of female prisoners in British Columbia. Can J Public Health 2005;96(2):97-101.
- Footnote 22
Public Health Agency of Canada. HIV/AIDS Epi Updates, July 2010. Chapter 12: Primary HIV antiretroviral drug resistance in Canada. Ottawa: Centre for Communicable Diseases and Infection Control, Public Health Agency of Canada; 2010.
Page details
- Date modified: