
COVID-19 in Canada: Modelling update
Download the alternative format
(PDF format, 272 KB, 21 pages)
Organization: Health Canada
Date published: 2020-04-28
On this page
- Technical briefing for Canadians
- Strategy: Action now determines our future
- Epidemiology: The pandemic in Canada today
- Looking forward: Modelling scenarios
- Annex
Strategy: Action now determines our future
Data and modelling are guiding Canada's response to COVID-19
- Earlier this month, we shared with Canadians information from our modelling work on COVID-19
- This presentation aims to provide an update on that important work
- The data continue to reinforce the critical message that the measures we are taking now remain essential to controlling Canada's COVID-19 epidemic:
- physical (social) distancing
- detection and isolation of cases
- tracing and quarantine of contacts
- preventing importation of infection from other countries
Reminder of our strategy for this phase of the epidemic: Control epidemic, increase health case system capacity
Control the epidemic
Measures to reduce the number of people a person infects to less than 1 to end onward transmission (e.g., physical distancing, travel restrictions, self isolation). Represented by the downward arrow in Figure 1.
Increase health care capacity
Measures to increase the healthcare hard assets (e.g., ventilators) and health human resources. Represented by the upward arrow in Figure 1.
Figure 1

Figure 1 - Long description
A blue line describes a bell curve that shows the number of new cases over time. A blue downward arrow represents “Control the epidemic”
A red horizontal dotted line indicating the capacity of the health care system cuts across the curve. A red upward arrow represents “Increase health care capacity”
If each person infects fewer than one person on average, the epidemic dies out
Figure 2
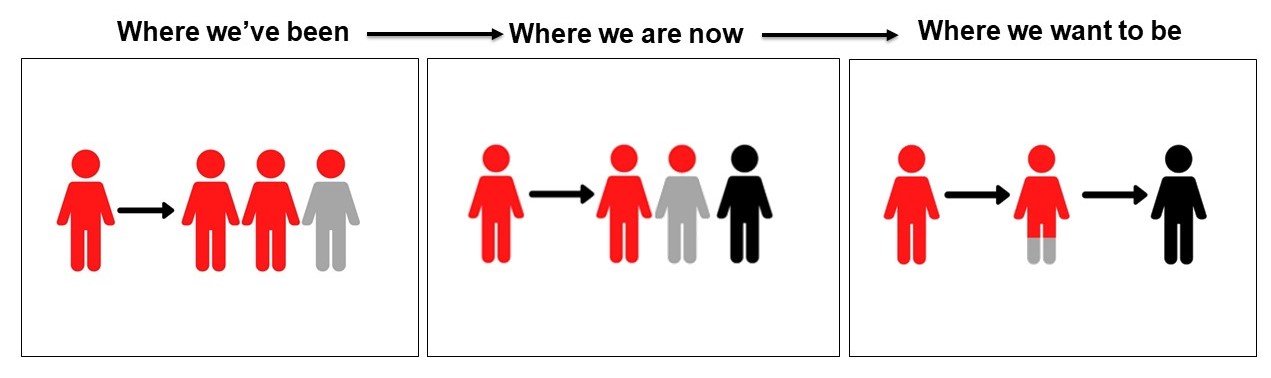
Figure 2 - Long description
Where we've been: Image 1 illustrates one person infecting 2.19 other people.
Where we are now: Image 2 illustrates one person infecting fewer than two people.
Where we want to be: Image 3 illustrates one person infecting less than one other person.
Where we've been
Prior to stronger public health measures, each infected person (case) in Canada infected 2.19 other people on average.
Where we are
Today, stronger controls including physical distancing and self-isolation are helping to reduce the average number of people each case infects to just above 1.
Where we want to be
Goal: Each person infects fewer than one person on average; epidemic dies out.
Epidemiology: The pandemic in Canada today
National overview, by province and territory, age and gender
Data as of April 27, 2020 at 11:00 am
Figure 3

Figure 3 - Long description
Table 1: Total number of confirmed and reported COVID-19 cases in Canada as of April 27, 2020 at 11:00 am
| Province, territory or other | Number of total cases |
|---|---|
| Canada | 47,327 |
| Alberta | 4,448 |
| British Columbia | 1,948 |
| Manitoba | 271 |
| New Brunswick | 118 |
| Newfoundland and Labrador | 258 |
| Northwest Territories | 5 |
| Nova Scotia | 873 |
| Nunavut | 0 |
| Prince Edward Island | 26 |
| Quebec | 24,107 |
| Ontario | 14,856 |
| Saskatchewan | 353 |
| Yukon | 11 |
| Repatriated travellers | 13 |
Note: The total number includes publicly reported confirmed and probable cases
Median age: 52 years old (cases from less than a year old to 111 years old)
| Gender | Proportion of casesFootnote a |
|---|---|
| Females | 55% |
| Males | 45% |
| Other gender | Les than 1% |
Footnote
|
|
| Severity indicator | Total number of reported cases | Proportion of cases |
|---|---|---|
| Deaths | 2,617 | 5.5% |
| Hospitalization | 2,795 | 17.1%Footnote b |
| Admissions to intensive care unit | 692 | 4.2%Footnote b |
Footnote
|
||
Older Canadians and males are at greater risk of severe outcomes
Data as of April 27, 2020 at 3:30 pm
Figure 4
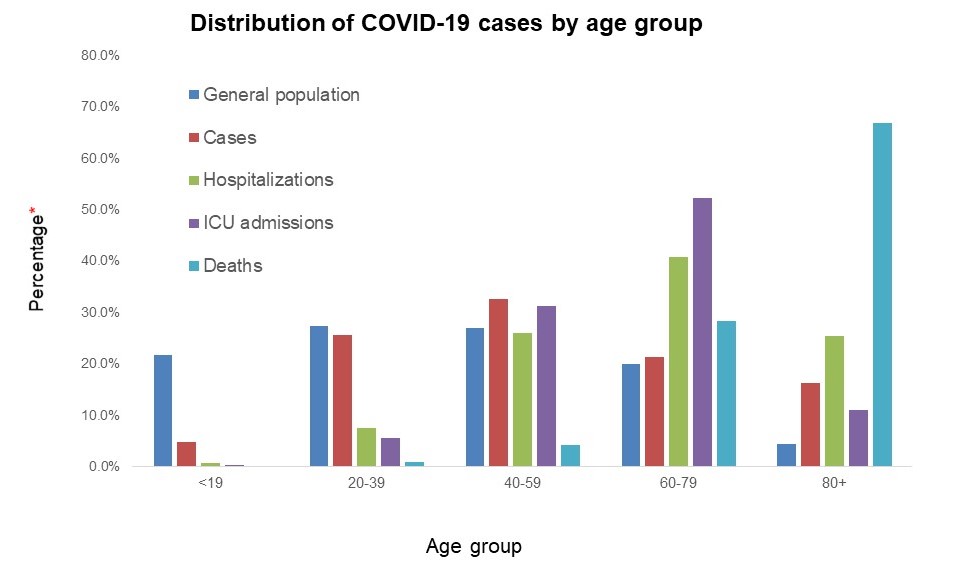
Figure 4 - Long description
| Percentage of severity indicator | Less than 19 | 20-39 | 40-59 | 60-79 | 80+ |
|---|---|---|---|---|---|
| General population | 21.6% | 27.4% | 26.8% | 19.9% | 4.3% |
| Cases | 4.7% | 25.5% | 32.5% | 21.2% | 16.1% |
| Hospitalisation | 0.6% | 7.5% | 26.0% | 40.6% | 25.3% |
| ICU admissions | 0.3% | 5.4% | 31.1% | 52.3 % | 10.9% |
| Deaths | 0.0% | 0.8% | 4.2% | 28.2% | 66.8% |
- Individuals aged ≥ 60 years compriseFootnote 1 :
- 1,018 (95%) of 1,072 deaths
- 1,811 (66%) of 2,747 hospital admissions
- 429 (63%) of 679 ICU admissions
- 2,012 (79%) of 2,561 deaths are linked to long-term care and seniors’ homes (as of April 26)
- Males are more likely to be admitted to hospital
- 20% of male vs. 14% of female cases are hospitalised
- 6% of male vs. 3% of female cases are admitted to the ICU
- 74% of hospitalised cases reported one or more underlying health condition, but no one is immune to severe outcomes of COVID-19
Canada has several regional epidemics
Data as of April 27, 2020 at 3:30 pm
Figure 5
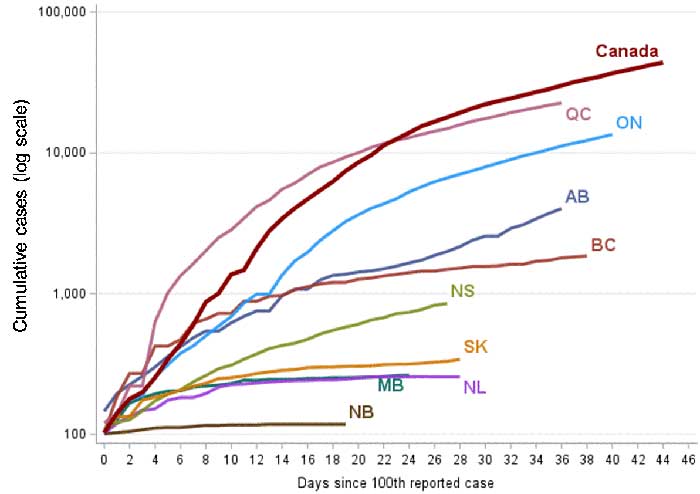
Figure 5 - Long description
| Days since 100th reported case | Canada | AB | BC | MB | NB | NL | NS | ON | QC | SK |
|---|---|---|---|---|---|---|---|---|---|---|
| 1 | 103 | 146 | 103 | 103 | 101 | 102 | 110 | 103 | 121 | 104 |
| 2 | 141 | 195 | 186 | 127 | 103 | 120 | 122 | 145 | 139 | 134 |
| 3 | 179 | 226 | 271 | 167 | 105 | 135 | 127 | 177 | 221 | 134 |
| 4 | 199 | 259 | 271 | 182 | 108 | 148 | 147 | 189 | 221 | 175 |
| 5 | 253 | 301 | 424 | 194 | 111 | 152 | 173 | 258 | 628 | 184 |
| 6 | 341 | 358 | 424 | 203 | 112 | 175 | 193 | 311 | 1,013 | 193 |
| 7 | 440 | 419 | 472 | 204 | 112 | 183 | 207 | 377 | 1,339 | 206 |
| 8 | 597 | 486 | 617 | 217 | 114 | 183 | 236 | 425 | 1,629 | 220 |
| 9 | 873 | 542 | 659 | 221 | 116 | 195 | 262 | 503 | 2,021 | 231 |
| 10 | 1,004 | 542 | 725 | 224 | 116 | 217 | 293 | 588 | 2,498 | 249 |
| 11 | 1,371 | 621 | 725 | 230 | 117 | 226 | 310 | 688 | 2,840 | 253 |
| 12 | 1,471 | 690 | 884 | 243 | 117 | 228 | 342 | 858 | 3,430 | 260 |
| 13 | 2,091 | 754 | 884 | 242 | 117 | 232 | 373 | 993 | 4,162 | 271 |
| 14 | 2,792 | 754 | 960 | 246 | 118 | 236 | 407 | 993 | 4,611 | 278 |
| 15 | 3,409 | 968 | 970 | 246 | 118 | 239 | 428 | 1,355 | 5,518 | 285 |
| 16 | 4,043 | 1,075 | 1,066 | 246 | 118 | 241 | 445 | 1,706 | 6,101 | 289 |
| 17 | 4,689 | 1,075 | 1,121 | 250 | 118 | 242 | 474 | 1,966 | 6,997 | 298 |
| 18 | 5,425 | 1,250 | 1,174 | 250 | 118 | 244 | 517 | 2,392 | 7,944 | 300 |
| 19 | 6,258 | 1,348 | 1,203 | 253 | 118 | 244 | 549 | 2,793 | 8,580 | 301 |
| 20 | 7,437 | 1,373 | 1,203 | 253 | 118 | 247 | 579 | 3,255 | 9,340 | 304 |
| 21 | 8,548 | 1,423 | 1,266 | 254 | 118 | 252 | 606 | 3,630 | 10,031 | 305 |
| 22 | 9,613 | 1,451 | 1,291 | 255 | 118 | 256 | 649 | 4,038 | 10,912 | 307 |
| 23 | 11,283 | 1,500 | 1,336 | 257 | 118 | 257 | 675 | 4,347 | 11,677 | 313 |
| 24 | 12,537 | 1,569 | 1,370 | 262 | n/a | 257 | 721 | 4,726 | 12,292 | 315 |
| 25 | 13,904 | 1,651 | 1,410 | 263 | n/a | 257 | 737 | 5,276 | 12,846 | 316 |
| 26 | 15,512 | 1,732 | 1,445 | 267 | n/a | 257 | 772 | 5,759 | 13,557 | 320 |
| 27 | 16,667 | 1,870 | 1,445 | 271 | n/a | 256 | 827 | 6,237 | 14,248 | 326 |
| 28 | 17,897 | 1,996 | 1,490 | 272 | n/a | 256 | 850 | 6,648 | 14,860 | 331 |
| 29 | 19,289 | 2,158 | 1,517 | n/a | n/a | 256 | 865 | 7,049 | 15,857 | 341 |
| 30 | 20,765 | 2,397 | 1,561 | n/a | n/a | 257 | 873 | 7,470 | 16,798 | 349 |
| 31 | 22,148 | 2,562 | 1,561 | n/a | n/a | 258 | 900 | 7,953 | 17,521 | 353 |
| 32 | 23,318 | 2,562 | 1,575 | n/a | n/a | 258 | n/a | 8,447 | 18,357 | 365 |
| 33 | 24,383 | 2,908 | 1,618 | n/a | n/a | n/a | n/a | 8,961 | 19,319 | n/a |
| 34 | 25,680 | 3,095 | 1,618 | n/a | n/a | n/a | n/a | 9,525 | 20,126 | n/a |
| 35 | 27,063 | 3,401 | 1,699 | n/a | n/a | n/a | n/a | 10,010 | 20,965 | n/a |
| 36 | 28,381 | 3,720 | 1,724 | n/a | n/a | n/a | n/a | 10,578 | 21,838 | n/a |
| 37 | 30,092 | 4,017 | 1,795 | n/a | n/a | n/a | n/a | 11,184 | 22,616 | n/a |
| 38 | 31,884 | 4,233 | 1,824 | n/a | n/a | n/a | n/a | 11,735 | 23,267 | n/a |
| 39 | 33,354 | 4,480 | 1,853 | n/a | n/a | n/a | n/a | 12,245 | 24,107 | n/a |
| 40 | 34,786 | 4,696 | 1,948 | n/a | n/a | n/a | n/a | 12,879 | 24,982 | n/a |
| 41 | 36,831 | n/a | 1,948 | n/a | n/a | n/a | n/a | 13,519 | n/a | n/a |
| 42 | 38,422 | n/a | 1,998 | n/a | n/a | n/a | n/a | 13,995 | n/a | n/a |
| 43 | 40,190 | n/a | n/a | n/a | n/a | n/a | n/a | 14,432 | n/a | n/a |
| 44 | 42,110 | n/a | n/a | n/a | n/a | n/a | n/a | 14,856 | n/a | n/a |
| 45 | 43,888 | n/a | n/a | n/a | n/a | n/a | n/a | n/a | n/a | n/a |
| 46 | 45,354 | n/a | n/a | n/a | n/a | n/a | n/a | n/a | n/a | n/a |
- Epidemic growth has levelled off in several provinces
- Cases in Quebec, Ontario, Alberta and Nova Scotia are driving recent national epidemic growth
- There is no community transmission occurring in Prince Edward Island, the Northwest Territories or the Yukon
- There have been no cases reported to date in Nunavut
Driving forces behind regional epidemics
- Outbreaks in long-term care and seniors' homes where older medically vulnerable adults reside
- Driving recent epidemic growth in Quebec, Ontario and Nova Scotia currently
- Responsible for the majority (79%) of deaths country-wide
- Outbreaks in other congregate living and work settings involving vulnerable populations with inadequate space for physical distancing including:
- Shelters serving people experiencing homelessness in Toronto
- Correctional facilities in British Columbia, Quebec and Ontario
- Work settings and associated congregate housing for workers in Alberta and British Columbia
Canada's epidemic growth is slower than many international partners
Data as of April 27, 2020 at 3:30 pm
Figure 6
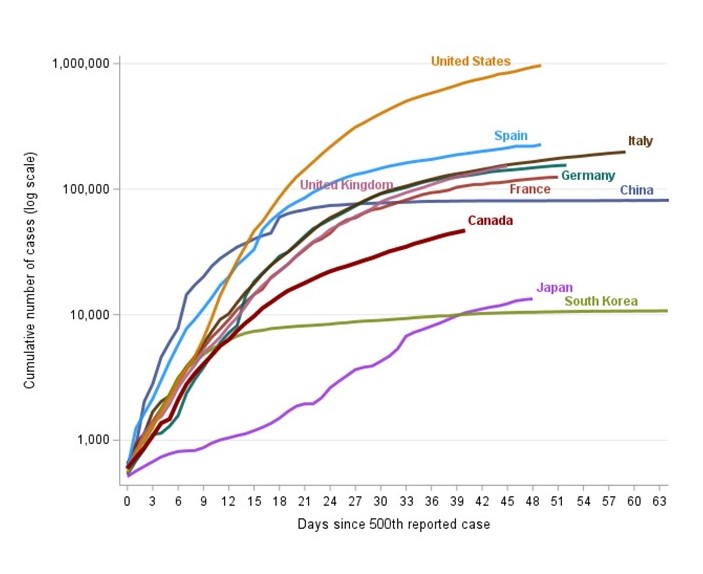
Figure 6 - Long description
| Days since 500th case | Canada | China (Mainland) | France | Germany | Italy | Japan | South Korea | Spain | United Kingdom | United States |
|---|---|---|---|---|---|---|---|---|---|---|
| 0 | 597 | 606 | 613 | 534 | 650 | 514 | 602 | 589 | 590 | 554 |
| 1 | 725 | 885 | 949 | 684 | 888 | 568 | 833 | 1,235 | 798 | 754 |
| 2 | 873 | 2,033 | 1,126 | 847 | 1,128 | 620 | 977 | 1,639 | 1,140 | 1,039 |
| 3 | 1,081 | 2,809 | 1,412 | 1,112 | 1,689 | 675 | 1,261 | 2,140 | 1,391 | 1,312 |
| 4 | 1,371 | 4,585 | 1,784 | 1,139 | 2,036 | 737 | 1,766 | 3,004 | 1,543 | 1,663 |
| 5 | 1,474 | 6,057 | 2,281 | 1,296 | 2,263 | 780 | 2,337 | 4,231 | 1,950 | 2,174 |
| 6 | 2,091 | 7,801 | 2,876 | 1,567 | 3,089 | 814 | 3,150 | 5,753 | 2,630 | 2,951 |
| 7 | 2,792 | 14,451 | 3,661 | 2,369 | 3,858 | 824 | 3,736 | 7,753 | 3,277 | 3,774 |
| 8 | 3,409 | 17,302 | 4,499 | 3,062 | 4,636 | 829 | 4,212 | 9,191 | 3,983 | 4,661 |
| 9 | 4,043 | 20,028 | 5,423 | 3,795 | 5,884 | 873 | 4,812 | 11,178 | 5,018 | 6,427 |
| 10 | 4,757 | 24,384 | 6,633 | 4,838 | 7,375 | 950 | 5,328 | 13,716 | 5,683 | 9,415 |
| 11 | 5,655 | 28,083 | 7,730 | 6,012 | 9,172 | 1,007 | 5,766 | 17,147 | 6,650 | 14,250 |
| 12 | 6,320 | 31,203 | 9,134 | 7,156 | 10,149 | 1,046 | 6,284 | 19,980 | 8,077 | 19,624 |
| 13 | 7,448 | 34,609 | 10,995 | 8,198 | 12,462 | 1,089 | 6,767 | 24,926 | 9,529 | 26,747 |
| 14 | 8,591 | 37,097 | 12,612 | 14,138 | 15,113 | 1,128 | 7,134 | 28,572 | 11,658 | 35,206 |
| 15 | 9,731 | 40,046 | 14,459 | 18,323 | 17,660 | 1,193 | 7,382 | 33,089 | 14,543 | 46,442 |
| 16 | 11,285 | 42,651 | 16,018 | 21,463 | 21,157 | 1,268 | 7,513 | 47,610 | 17,089 | 55,231 |
| 17 | 12,537 | 44,682 | 19,856 | 24,774 | 24,747 | 1,364 | 7,755 | 56,188 | 19,522 | 69,194 |
| 18 | 14,018 | 59,822 | 22,302 | 29,212 | 27,980 | 1,499 | 7,869 | 64,059 | 22,141 | 85,996 |
| 19 | 15,512 | 63,862 | 25,233 | 31,554 | 31,506 | 1,693 | 7,979 | 72,248 | 25,150 | 104,686 |
| 20 | 16,667 | 66,496 | 29,155 | 36,508 | 35,713 | 1,866 | 8,086 | 78,797 | 29,474 | 124,686 |
| 21 | 17,897 | 68,440 | 32,964 | 42,288 | 41,035 | 1,953 | 8,162 | 85,195 | 33,718 | 143,025 |
| 22 | 19,291 | 70,955 | 37,575 | 48,582 | 47,021 | 1,953 | 8,236 | 94,417 | 38,168 | 164,620 |
| 23 | 20,765 | 72,425 | 40,174 | 52,547 | 53,578 | 2,178 | 8,320 | 102,136 | 41,903 | 189,618 |
| 24 | 22,148 | 74,186 | 44,550 | 57,298 | 59,138 | 2,617 | 8,413 | 110,238 | 47,806 | 216,721 |
| 25 | 23,318 | 74,578 | 52,128 | 61,913 | 63,927 | 2,935 | 8,565 | 117,710 | 51,608 | 245,540 |
| 26 | 24,383 | 75,467 | 56,989 | 67,366 | 69,176 | 3,271 | 8,652 | 124,736 | 55,242 | 277,965 |
| 27 | 25,680 | 76,291 | 59,105 | 73,522 | 74,386 | 3,654 | 8,799 | 130,759 | 60,733 | 312,237 |
| 28 | 27,063 | 76,935 | 64,338 | 79,696 | 80,539 | 3,817 | 8,897 | 135,032 | 65,077 | 337,635 |
| 29 | 28,379 | 77,147 | 68,605 | 85,778 | 86,498 | 3,906 | 8,961 | 140,510 | 70,272 | 368,449 |
| 30 | 30,106 | 77,659 | 70,478 | 91,714 | 92,472 | 4,257 | 9,037 | 146,690 | 78,991 | 399,929 |
| 31 | 31,927 | 78,064 | 74,390 | 95,391 | 97,689 | 4,667 | 9,137 | 152,446 | 84,279 | 432,438 |
| 32 | 33,354 | 78,497 | 78,167 | 99,225 | 101,739 | 5,347 | 9,241 | 157,022 | 88,621 | 466,299 |
| 33 | 34,786 | 78,824 | 82,048 | 103,228 | 105,792 | 6,748 | 9,332 | 161,852 | 93,873 | 501,615 |
| 34 | 36,831 | 79,251 | 86,334 | 108,202 | 110,574 | 7,255 | 9,478 | 166,019 | 98,476 | 530,006 |
| 35 | 38,422 | 79,826 | 90,676 | 113,525 | 115,242 | 7,645 | 9,583 | 169,496 | 103,093 | 557,590 |
| 36 | 40,190 | 80,026 | 93,790 | 117,658 | 119,827 | 8,100 | 9,661 | 172,541 | 108,692 | 582,594 |
| 37 | 42,110 | 80,151 | 95,403 | 120,479 | 124,632 | 8,582 | 9,786 | 177,633 | 114,217 | 609,685 |
| 38 | 43,888 | 80,270 | 98,076 | 123,016 | 128,948 | 9,167 | 9,786 | 182,816 | 120,067 | 639,664 |
| 39 | 45,354 | 80,410 | 103,573 | 125,098 | 132,547 | 9,795 | 9,976 | 188,068 | 124,743 | 671,425 |
| 40 | 46,895 | 80,555 | 106,206 | 127,584 | 135,586 | 10,361 | 10,062 | 191,726 | 129,044 | 706,779 |
| 41 | 48,500 | 80,651 | 108,847 | 130,450 | 139,422 | 10,751 | 10,156 | 195,944 | 133,495 | 735,287 |
| 42 | n/a | 80,695 | 109,252 | 133,830 | 143,626 | 11,118 | 10,237 | 200,210 | 138,078 | 759,786 |
| 43 | n/a | 80,735 | 111,821 | 137,439 | 147,577 | 11,496 | 10,284 | 204,178 | 143,464 | 787,960 |
| 44 | n/a | 80,756 | 112,606 | 139,897 | 152,271 | 11,772 | 10,331 | 208,389 | 148,377 | 825,306 |
| 45 | n/a | 80,780 | 114,657 | 141,672 | 156,363 | 12,240 | 10,384 | 213,024 | 152,840 | 842,629 |
| 46 | n/a | 80,793 | 117,324 | 143,457 | 159,516 | 12,892 | 10,423 | 219,764 | 157,149 | 869,172 |
| 47 | n/a | 80,801 | 119,151 | 145,694 | 162,488 | 13,182 | 10,450 | 219,764 | n/a | 905,333 |
| 48 | n/a | 80,826 | 120,804 | 148,046 | 165,155 | 13,385 | 10,450 | 219,764 | n/a | 939,249 |
| 49 | n/a | 80,844 | 122,577 | 150,383 | 168,941 | 13,576 | 10,512 | 226,629 | n/a | 965,933 |
| 50 | n/a | 80,866 | 124,114 | 152,438 | 172,434 | n/a | 10,537 | 229,422 | n/a | 988,469 |
| 51 | n/a | 80,882 | 124,575 | 154,175 | 175,925 | n/a | 10,564 | n/a | n/a | n/a |
| 52 | n/a | 80,905 | 128,339 | 155,193 | 178,972 | n/a | 10,591 | n/a | n/a | n/a |
| 53 | n/a | 80,929 | n/a | 156,337 | 181,228 | n/a | 10,613 | n/a | n/a | n/a |
| 54 | n/a | 80,974 | n/a | n/a | 183,957 | n/a | 10,635 | n/a | n/a | n/a |
| 55 | n/a | 81,013 | n/a | n/a | 187,327 | n/a | 10,653 | n/a | n/a | n/a |
| 56 | n/a | 81,057 | n/a | n/a | 189,973 | n/a | 10,661 | n/a | n/a | n/a |
| 57 | n/a | 81,114 | n/a | n/a | 192,994 | n/a | 10,674 | n/a | n/a | n/a |
| 58 | n/a | 81,177 | n/a | n/a | 195,351 | n/a | 10,683 | n/a | n/a | n/a |
| 59 | n/a | 81,285 | n/a | n/a | 197,675 | n/a | 10,694 | n/a | n/a | n/a |
Comparable countries whose epidemics began earlier were chosen for this comparison.
Growth is declining across most comparison countries shown in the figure, likely due to strong public health and global measures.
Canada's epidemic growth is slowing. Although previously doubling every 3 days early in the epidemic, the number of cases in Canada is now doubling every 16 days.
Notes:
- Reported cases are impacted by the number of tests conducted, and changes in testing practices.
- These data are presented on a logarithm scale. Log scales show relative values instead of absolute ones
Looking forward: Modelling scenarios
Canada's approach to modelling
- Models cannot predict what will happen, but rather can help us understand what might happen to ensure we can plan for worst cases and drive public health action to achieve the best possible outcome
- Models can support decisions on public health measures and help the health care sector plan for the number of expected COVID-19 patients
- Reminder: Canada is using two modelling approaches:
- Forecasting models use data to estimate how many new cases we might expect to see in the coming week
- Dynamic models show how the epidemic might unfold over the coming months, using knowledge of how the virus behaves and of the potential impact of public health measures.
- Important to recognize that models have inherent limitations (e.g., simulate controlled scenarios, not real world)
Forecasting the short-term epidemic trajectory
Figure 7
Figure 7 - Long description
Extrapolation based on recent trends using a forecasting model (with ranges of uncertainty)
| Date | Cumulatively reported cases | Cumulative number of deaths |
|---|---|---|
| 2020-04-17 | 32,849 | 1,365 |
| 2020-04-18 | 34,380 | 1,527 |
| 2020-04-19 | 36,016 | 1,636 |
| 2020-04-20 | 37,860 | 1,757 |
| 2020-04-21 | 39,392 | 1,909 |
| 2020-04-22 | 41,363 | 2,072 |
| 2020-04-23 | 43,227 | 2 232 |
| 2020-04-24 | 44,856 | 2,390 |
| Predicted cases average (95% range) | Predicted deaths average (95% range) | |
|---|---|---|
| 2020-04-25 | 46,653 (46,236; 47,071) | 2,527 (2,472; 2,581) |
| 2020-04-26 | 48,360 (47,655; 49,065) | 2,667 (2,594; 2,740) |
| 2020-04-27 | 50,011 (48,903; 51,119) | 2,801 (2,706; 2,896) |
| 2020-04-28 | 51,592 (49,970; 53,215) | 2,928 (2,809; 3,047) |
| 2020-04-29 | 53,092 (50,857; 55,328) | 3,047 (2,903; 3,191) |
| 2020-04-30 | 54,501 (51,575; 57,428) | 3,157 (2,986; 3,327) |
| 2020-05-01 | 55,812 (52,139; 59,486) | 3,258 (3,061; 3,456) |
| 2020-05-02 | 57,020 (52,565; 61,475) | 3,351 (3,127; 3,576) |
| 2020-05-03 | 58,122 (52,872; 63,372) | 3,435 (3,184; 3,687) |
| 2020-05-04 | 59,120 (53,077; 65,162) | 3,511 (3,234; 3,789) |
| 2020-05-05 | 60,015 (53,196; 66,835) | 3,579 (3,277; 3,883) |
Two graphs showing an upward sloping curve representing actual cumulatively reported cases and deaths in Canada from March 1 to April 24, 2020. The line splits into 2 scenarios predicting data for May 5, 2020. Top line shows the upper 95% prediction limit. Lower line shows the lower 95% prediction limit.
- 53,196 to 66,835 cases by May 5, 2020
- 3,277 to 3,883 deaths by May 5, 2020
Modelled scenarios show impact of public health measures
Models help us identify which combinations of public health measures, applied with what intensity, are most likely to reinforce epidemic control.
Figure 8
Figure 8 - Long description
Graphic with 3 curves:
- Stronger epidemic control: Small shortest curve from Spring to Fall 2020, with a peak in Summer 2020
- No control effort: Tall short curve from Spring to Fall 2020, with a peak in Summer 2020
- Weaker controls (delays and reduce the peak): Medium long curve from Spring 2020 to Spring 2021, with a peak in Fall 2020
- Stronger epidemic control: high degree of physical distancing and high percentage of cases and their contacts traced and isolated or quarantined. 1% to 10% infected.
- No control effort: 70% to 80% infected.
- Weaker controls (delay and reduce the peak): low degree of physical distancing and low percentage of cases and their contacts traced and isolated or quarantined. 25% to 50% infected.
Our ambition: Early and rapid epidemic control
Figure 9
Figure 9 - Long description
On the left, a blue line describes a steep, high curve that begins in the spring and ends in the summer followed by a series of three low orange curves, representing smaller outbreaks in late summer, fall and winter. A final upward sloping orange line suggests a fourth small outbreak next year.
The four orange lines are labelled "Reduce importation and transmission."
With early epidemic control, responses to outbreaks will likely continue to be required over time.
Summary
- We continue to monitor the situation closely, and will evaluate, learn, and adapt as we go.
- Canada is making progress to slow the spread and bring the epidemic under control, thanks to the commitment of Canadians, who are following public health advice to protect themselves and others.
- It is critically important that we maintain our current public health measures, including physical distancing, until we have achieved epidemic control for the first wave.
- Relaxing controls too quickly could squander our collective efforts to date and put us at risk of future epidemic waves.
What we do together now to stop the spread of the virus will determine the overall impact of COVID-19 on the health of all Canadians
Annex
Dynamic models of scenarios
Model moves people through different states of infection. All start out as susceptible.
Individuals are then exposed. They either become infected, or remain susceptible.
Figure 10 – Disease stages

Figure 10 - Long description
- Latent period
- Asymptomatic infectious period
- Symptomatic infectious period
- Outcome
The duration of each stage has an impact on the speed of spread of the disease. The models are run with different values for these periods.
Mitigating factors
Model includes factors that reduce transmission, with different scenarios for different levels of public health measures possible. Hospitalization in the models is also assumed to include no further transmission.
Exacerbating factors
Model includes factors that increase transmission, i.e., the movement of infectious (symptomatic / asymptomatic) people, where contacts take place (e.g., school, work, etc.).
Modelled scenarios—varied public health measures
- A series of models were used to generate a number of scenarios including three key scenarios: ‘no control', ‘weaker controls (delay and reduce the peak)', and ‘stronger epidemic control'. This lets us estimate the range of the population infected and the potential duration of the epidemic.
- Other interventions, such as border controls and domestic travel restrictions, have also been explored in modelling studies
- We continue to use models on an ongoing basis to help us identify which combinations of public health measures, applied with what intensity, are most likely to reinforce epidemic control
Stronger epidemic control models include
- A high degree of physical distancing
- A high proportion of cases identified and isolated
- A high proportion of contacts traced and quarantined
Weaker control models include
- A low degree of physical distancing
- A low proportion of cases identified and isolated
- A low proportion of contacts traced and quarantined
Cumulative deaths under different scenarios over the course of pandemic
Figure 11

Figure 11 - Long description
Potential number of deaths in Canada given different scenarios and percentages of the population infected.
| Epidemic control | Percentage of the population affected | Number of deaths |
|---|---|---|
| Stronger epidemic control | 1% | 4,000 |
| 2.5% | 11,000 | |
| 5% | 22,000 | |
| 10% | 44,000 | |
| Weaker controls | 25% | 111,000 |
| 50% | 222,000 | |
| No controls | 70% | 311,000 |
| 80% | 355,000 |
Scenarios show a range of impact for Canada over the course of the pandemic
| Level of epidemic controls | Percentage | All cases | Hospitalized | ICU | Deaths |
|---|---|---|---|---|---|
| Stronger epidemic control | 1% | 376,000 | 29,000 | 9,000 | 4,000 |
| Stronger epidemic control | 2.5% | 940,000 | 73,000 | 23,000 | 11,000 |
| Stronger epidemic control | 5% | 1,879,000 | 146,000 | 46,000 | 22,000 |
| Stronger epidemic control | 10% | 3,759,000 | 292,000 | 92,000 | 44,000 |
| Weaker controls | 25% | 9,397,000 | 730,000 | 229,000 | 111,000 |
| Weaker controls | 50% | 18,795,000 | 1,461,000 | 459,000 | 222,000 |
| No controls | 70% | 26,312,000 | 459,000 | 642,000 | 311,000 |
| No controls | 80% | 30,071,000 | 222,000 | 724,000 | 355,000 |
- Estimates are based on different attack rates obtained in model simulations with different levels of public health measures
- Assumptions: 7.8% of all cases are hospitalised; 2.4% of cases require ICU care; and 1.2% of all cases die (based on Imperial College London estimates of age-related variations in severity)
- Deaths for 25% to 80% scenarios are underestimates because the case fatality rate (proportion of cases who will die) is likely to rise as health care capacity is exceeded
Footnotes
- Footnote 1
-
Age information available for 25,314 cases, 2,468 hospitalizations, 660 ICU admissions and 983 deaths.