
FluWatch report: October 28, 2018 to November 3, 2018 (Week 44)
Download the alternative format
(PDF format, 815 KB, 7 pages)
Organization: Public Health Agency of Canada
Date published: 2018-11-09
Related Topics
Overall Summary
- Influenza activity continued to increase in week 44. The influenza season has started earlier than in recent years.
- The number of regions in Canada reporting sporadic or localized influenza activity in week 44 was similar to the previous week.
- Influenza A is the most common influenza virus circulating in Canada, and the majority of these viruses are A(H1N1)pdm09. The A(H1N1)pdm09 viruses characterized this season are similar to the strain used in the vaccine.
- The number of influenza-associated hospitalizations among adults and children increased in week 44.
- The proportion of primary care visits for ILI and number of influenza outbreaks remain within expected levels.
On this page
- Influenza/ILI Activity (geographic spread)
- Laboratory Confirmed Influenza Detections
- Syndromic/Influenza-like Illness Surveillance
- Participatory Syndromic Surveillance
- Influenza Outbreak Surveillance
- Severe Outcomes Influenza Surveillance
- Antiviral Resistance
- Provincial and International Influenza Reports
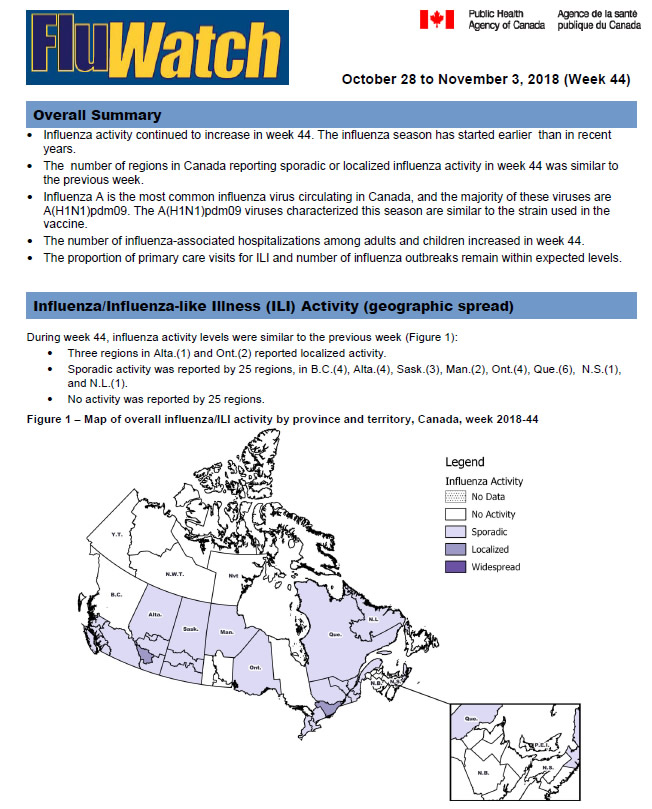
Influenza/Influenza-like Illness Activity (geographic spread)
During week 44, the following influenza activity levels were reported (Figure 1):
- Three regions in Alta.(1) and Ont.(2) reported localized activity.
- Sporadic activity was reported by 25 regions, in B.C.(4), Alta.(4), Sask.(3), Man.(2), Ont.(4), Que.(6), N.S.(1), and N.L.(1).
- No activity was reported by 25 regions.
Figure 1 – Map of overall influenza/ILI activity by province and territory, Canada, week 2018-44
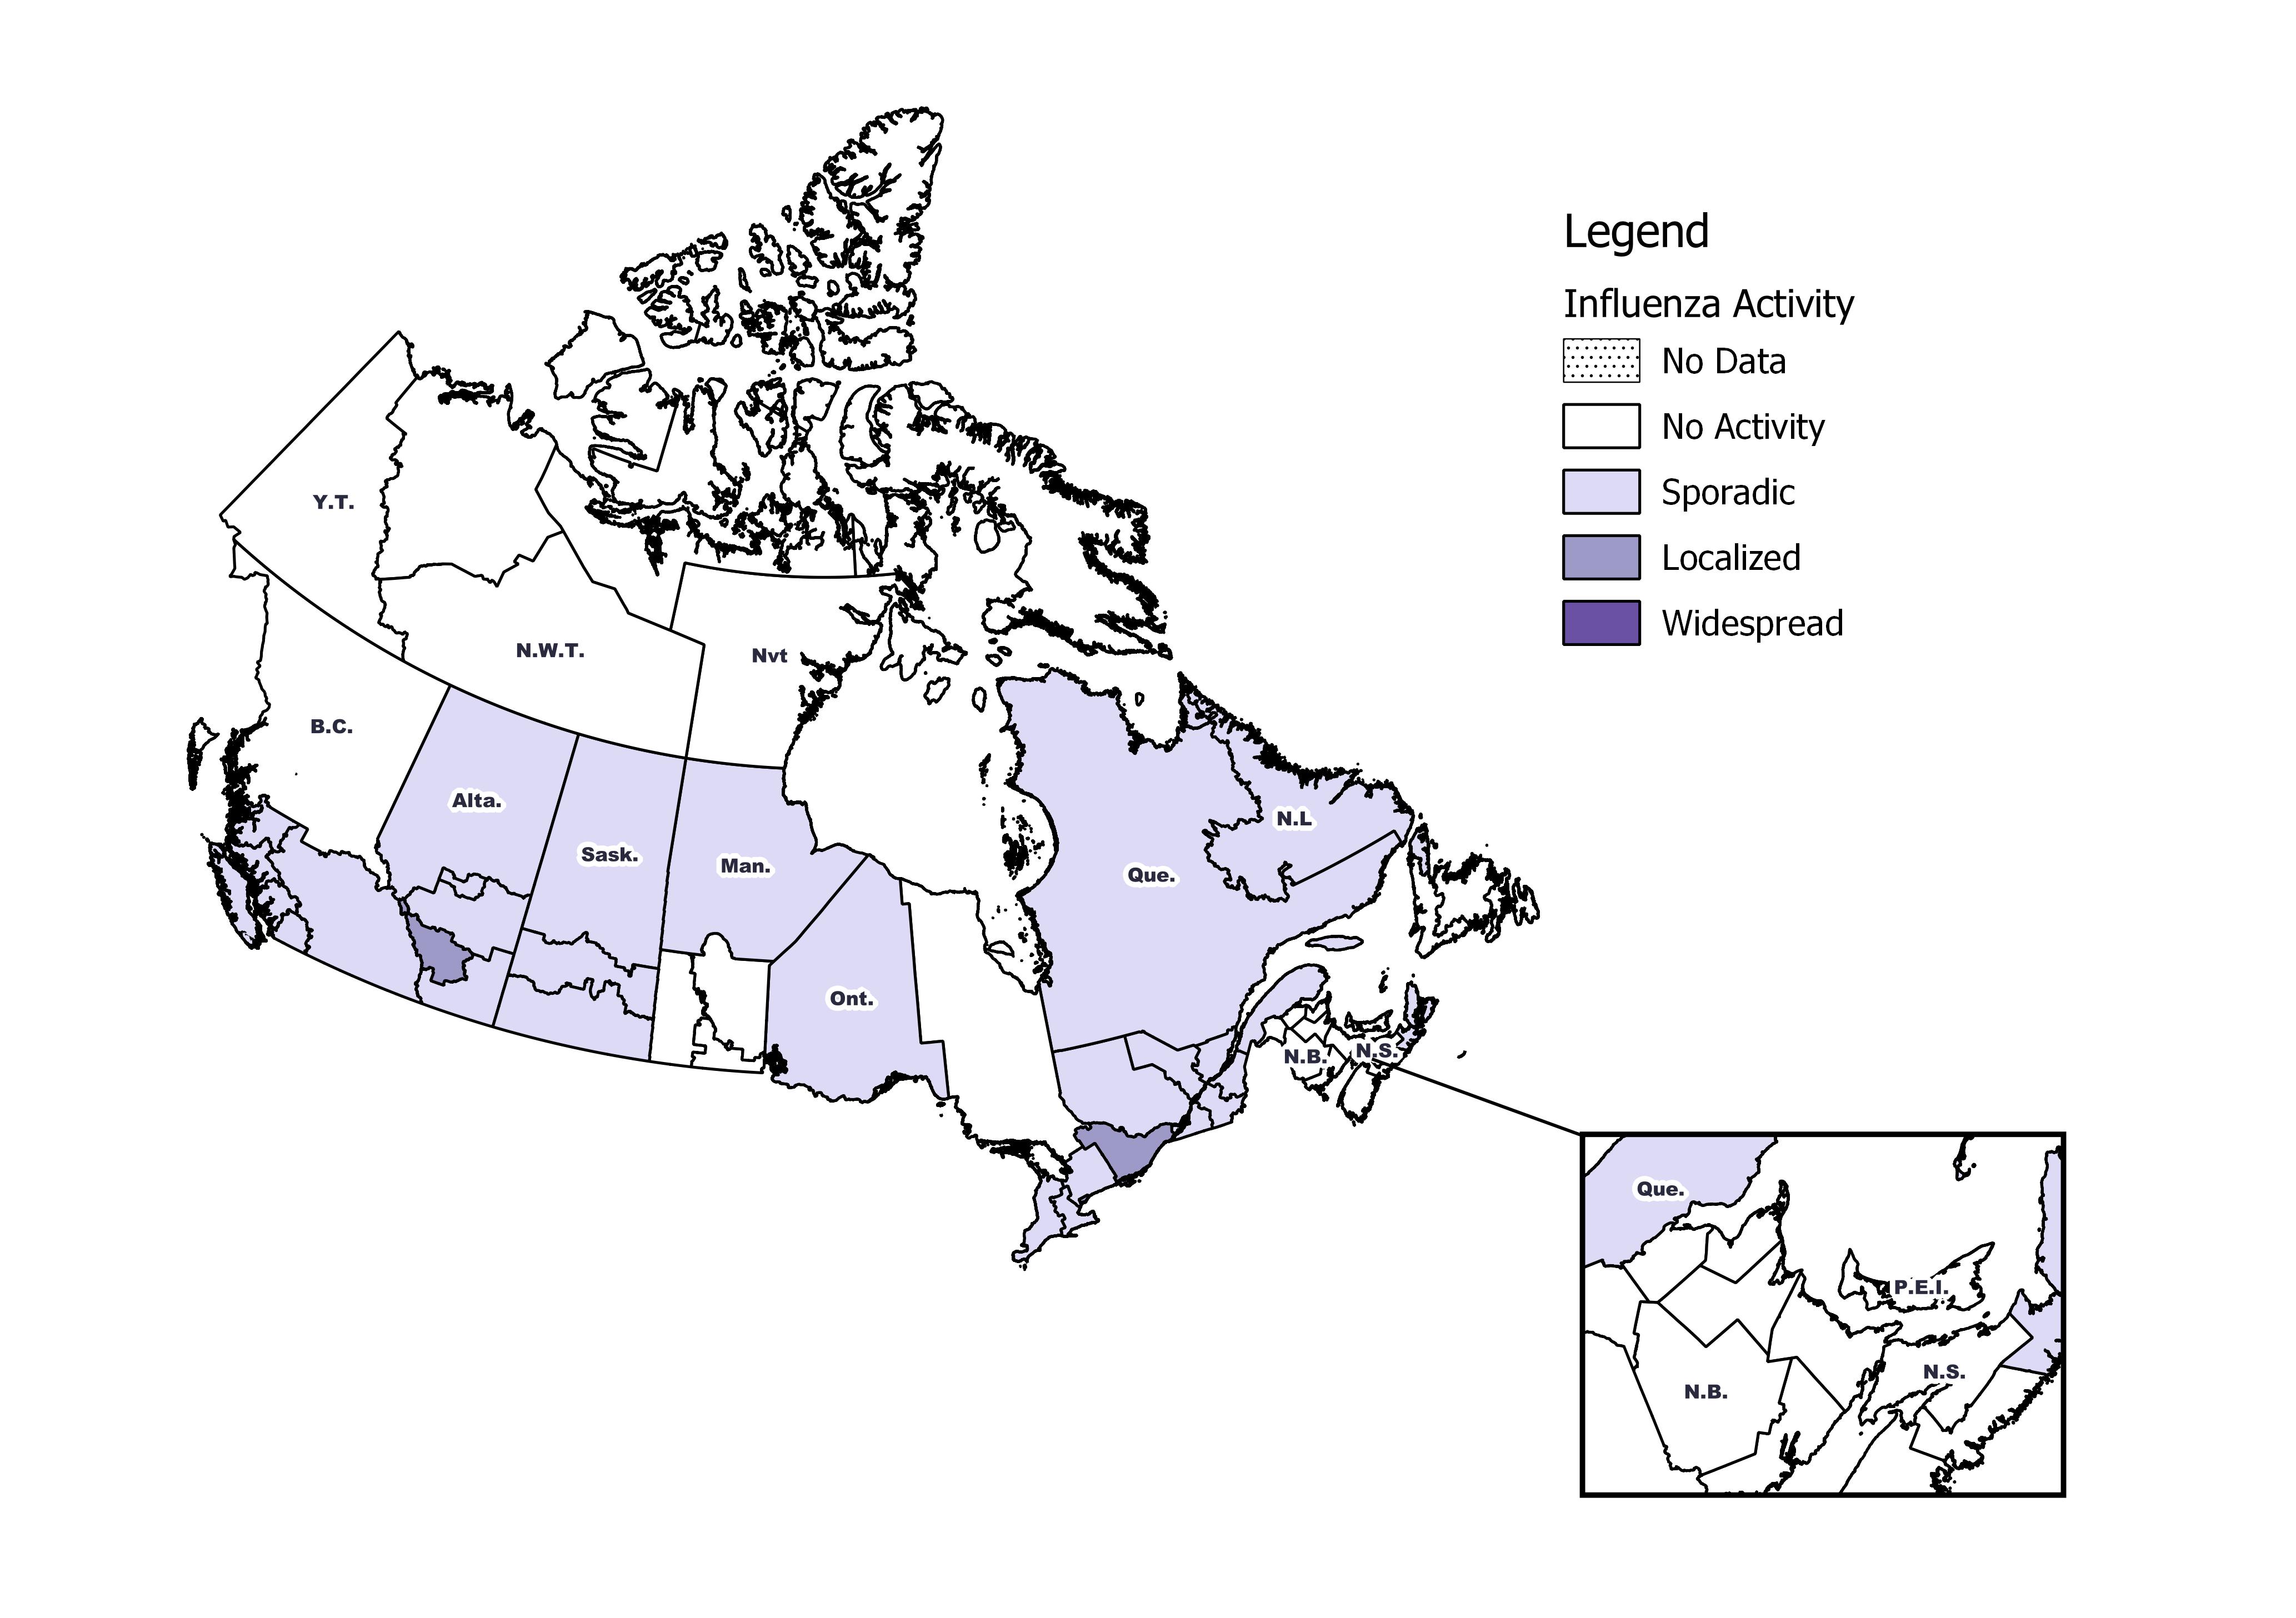
Figure 1 - Text description
| Province | Influenza Surveillance Region | Activity Level |
|---|---|---|
| N.L. | Eastern | No Activity |
| N.L. | Labrador-Grenfell | Sporadic |
| N.L. | Central | No Activity |
| N.L. | Western | No Activity |
| P.E.I. | Prince Edward Island | No Activity |
| N.S. | Zone 1 - Western | No Activity |
| N.S. | Zone 2 - Northern | No Activity |
| N.S. | Zone 3 - Eastern | Sporadic |
| N.S. | Zone 4 - Central | No Activity |
| N.B. | Region 1 | No Activity |
| N.B. | Region 2 | No Activity |
| N.B. | Region 3 | No Activity |
| N.B. | Region 4 | No Activity |
| N.B. | Region 5 | No Activity |
| N.B. | Region 6 | No Activity |
| N.B. | Region 7 | No Activity |
| Que. | Nord-est | Sporadic |
| Que. | Québec et Chaudieres-Appalaches | Sporadic |
| Que. | Centre-du-Québec | Sporadic |
| Que. | Montréal et Laval | Sporadic |
| Que. | Ouest-du-Québec | Sporadic |
| Que. | Montérégie | Sporadic |
| Ont. | Central East | Sporadic |
| Ont. | Central West | Sporadic |
| Ont. | Eastern | Localized |
| Ont. | North East | No Activity |
| Ont. | North West | Sporadic |
| Ont. | South West | Sporadic |
| Ont. | Toronto | Localized |
| Man. | Northern Regional | Sporadic |
| Man. | Prairie Mountain | No Activity |
| Man. | Interlake-Eastern | No Activity |
| Man. | Winnipeg | Sporadic |
| Man. | Southern Health | No Activity |
| Sask. | North | Sporadic |
| Sask. | Central | Sporadic |
| Sask. | South | Sporadic |
| Alta. | North Zone | Sporadic |
| Alta. | Edmonton | Sporadic |
| Alta. | Central Zone | Sporadic |
| Alta. | Calgary | Localized |
| Alta. | South Zone | Sporadic |
| B.C. | Interior | Sporadic |
| B.C. | Fraser | Sporadic |
| B.C. | Vancouver Coastal | Sporadic |
| B.C. | Vancouver Island | Sporadic |
| B.C. | Northern | No Activity |
| Y.T. | Yukon | No Activity |
| N.W.T. | North | No Activity |
| N.W.T. | South | No Activity |
| Nvt. | Qikiqtaaluk | No Activity |
| Nvt. | Kivalliq | No Activity |
| Nvt. | Kitimeot | No Activity |
Laboratory Confirmed Influenza Detections
In week 44, the following results were reported from sentinel laboratories across Canada (Figure 2):
- The percentage of tests positive for influenza remained above the seasonal threshold at 7.7% of tests positive.
- The percentage of tests positive for influenza A is higher for this time of year compared to the same period during the previous eight seasons. Laboratory detections of influenza have entered seasonal levels three weeks earlier than the median over the previous eight seasons.
- In week 44, 359 laboratory detections of influenza were reported, of which 98% were influenza A.
To date this season 883 laboratory-confirmed influenza detections have been reported (Figure 3):
- 94% have been influenza A
- Among the 531 influenza A viruses subtyped, 73% have been A(H1N1)pdm09
To date this season, detailed information on age and type/subtype has been received for 815 laboratory-confirmed influenza cases (Table 1):
- Adults 20-44 years of age represent the largest proportion of cases (27%), followed by adults 45-64 years of age (20%) and children 5-19 years of age (19%).
For more detailed weekly and cumulative influenza data, see the text descriptions for Figures 2 and 3 or the Respiratory Virus Detections in Canada Report.
Figure 2 – Number of positive influenza tests and percentage of tests positive, by type, subtype and report week, Canada, 2018-35 to 2018-44
The shaded area indicates weeks where the positivity rate was at least 5% and a minimum of 15 positive tests were observed, signalling the start and end of seasonal influenza activity.
Figure 2 - Text description
| Surveillance Week | A(Unsubtyped) | A(H3) | A(H1)pdm09 | Influenza B |
|---|---|---|---|---|
| 35 | 3 | 2 | 7 | 0 |
| 36 | 4 | 7 | 4 | 0 |
| 37 | 3 | 2 | 3 | 1 |
| 38 | 6 | 3 | 2 | 3 |
| 39 | 11 | 5 | 1 | 3 |
| 40 | 16 | 7 | 29 | 3 |
| 41 | 27 | 6 | 21 | 3 |
| 42 | 40 | 19 | 55 | 2 |
| 43 | 83 | 23 | 128 | 4 |
| 44 | 137 | 13 | 203 | 6 |
Figure 3 – Cumulative numbers of positive influenza specimens by type/subtype and province/territory, Canada, weeks 2018-35 to 2018-44
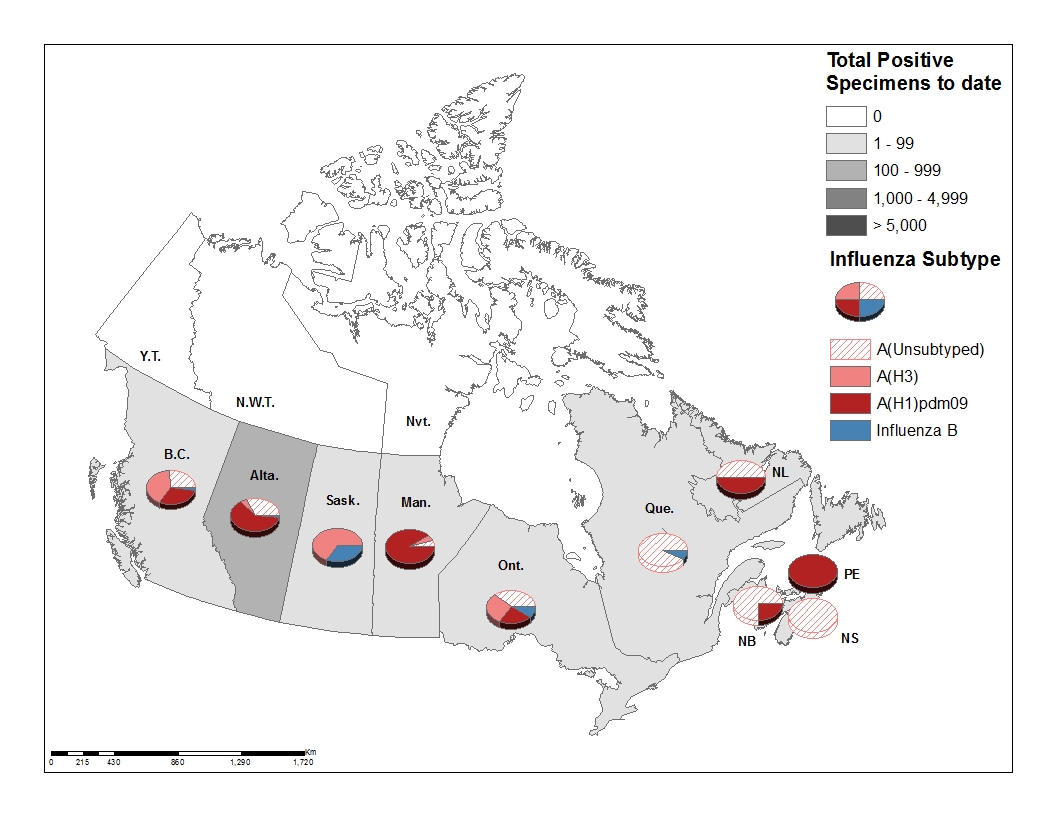
Figure 3 - Text description
| Reporting provincesTable Figure 3 - Footnote 1 |
Week (October 28, 2018 to November 3, 2018) | Cumulative (August 26, 2018 to November 3, 2018) | |||||||||
|---|---|---|---|---|---|---|---|---|---|---|---|
| Influenza A | B | Influenza A | B | A & B Total |
|||||||
| A Total |
A (H1N1)pdm09 |
A (H3N2) |
A(UnS)Table Figure 3 - Footnote 3 | B Total |
A Total |
A (H1N1)pdm09 |
A (H3N2) |
A(UnS)Table Figure 3 - Footnote 3 | B Total |
||
| BC | 18 | 8 | 5 | 5 | 0 | 83 | 27 | 34 | 22 | 2 | 85 |
| AB | 228 | 146 | 4 | 78 | 1 | 489 | 303 | 24 | 162 | 10 | 499 |
| SK | 13 | 0 | 13 | 0 | 6 | 60 | 0 | 60 | 0 | 31 | 91 |
| MB | 14 | 11 | 2 | 1 | 0 | 41 | 37 | 2 | 2 | 0 | 41 |
| ON | 16 | 5 | 2 | 9 | 2 | 71 | 20 | 21 | 30 | 7 | 78 |
| QC | 32 | 0 | 0 | 32 | 3 | 73 | 0 | 0 | 73 | 6 | 79 |
| NB | 1 | 1 | 0 | 0 | 0 | 4 | 1 | 0 | 3 | 0 | 4 |
| NS | 1 | 0 | 0 | 1 | 0 | 3 | 0 | 0 | 3 | 0 | 3 |
| PEI | 0 | 0 | 0 | 0 | 0 | 1 | 1 | 0 | 0 | 0 | 1 |
| NL | 1 | 1 | 0 | 0 | 0 | 2 | 1 | 0 | 1 | 0 | 2 |
| YT | 0 | 0 | 0 | 0 | 0 | 0 | 0 | 0 | 0 | 0 | 0 |
| N.W.T | 0 | 0 | 0 | 0 | 0 | 0 | 0 | 0 | 0 | 0 | 0 |
| NU | 0 | 0 | 0 | 0 | 0 | 0 | 0 | 0 | 0 | 0 | 0 |
| Canada | 324 | 172 | 26 | 126 | 12 | 827 | 390 | 141 | 296 | 56 | 883 |
| PercentageTable Figure 3 - Footnote 2 | 96% | 53% | 8% | 39% | 4% | 94% | 47% | 17% | 36% | 6% | 100% |
Discrepancies in values in Figures 2 and 3 may be attributable to differing data sources. Cumulative data includes updates to previous weeks. |
|||||||||||
| Age groups (years) | Cumulative (August 26, 2018 to November 3, 2018) | ||||||
|---|---|---|---|---|---|---|---|
| Influenza A | B | Influenza A and B | |||||
| A Total | A(H1) pdm09 | A(H3) | A (UnS)Footnote 1 | Total | # | % | |
| 0-4 | 132 | 82 | 3 | 47 | <5 | >132 | - |
| 5-19 | 151 | 88 | 2 | 61 | <5 | >151 | - |
| 20-44 | 213 | 113 | 9 | 91 | 5 | 218 | 27% |
| 45-64 | 160 | 89 | 16 | 55 | <5 | >160 | - |
| 65+ | 138 | 67 | 34 | 37 | 6 | 144 | 18% |
| Total | 794 | 439 | 64 | 291 | >11 | >794 | 100% |
|
|||||||
Syndromic/Influenza-like Illness Surveillance
Healthcare Professionals Sentinel Syndromic Surveillance
In week 44, 1.0% of visits to healthcare professionals were due to influenza-like illness (ILI) (Figure 4). The percentage of visits for ILI is within expected levels.
Figure 4 - Percentage of visits for ILI reported by sentinels by report week, Canada, weeks 2018-35 to 2018-44
Number of Sentinels Reporting in Week 44: 104
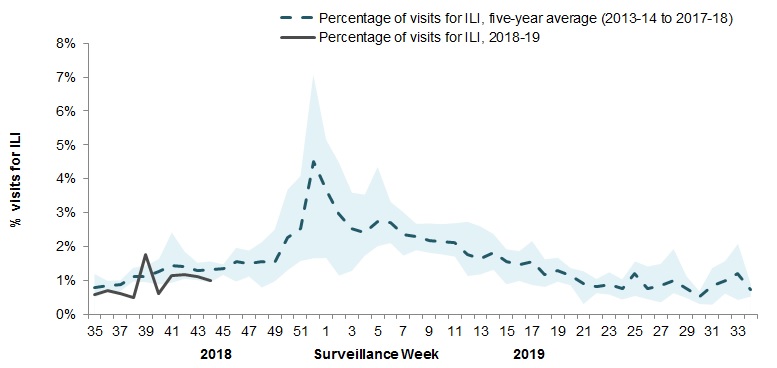
The shaded area represents the maximum and minimum percentage of visits for ILI reported by week from seasons 2013-14 to 2017-18
Figure 4 - Text description
| Report week | 2018-19 | Average | Min | Max |
|---|---|---|---|---|
| 35 | 0.6% | 0.6% | 0.4% | 0.9% |
| 36 | 0.7% | 0.8% | 0.5% | 1.0% |
| 37 | 0.6% | 0.9% | 0.7% | 1.1% |
| 38 | 0.5% | 1.0% | 0.7% | 1.4% |
| 39 | 1.8% | 1.1% | 0.8% | 1.5% |
| 40 | 0.6% | 1.6% | 0.9% | 3.4% |
| 41 | 1.1% | 1.6% | 1.1% | 2.1% |
| 42 | 1.2% | 1.4% | 0.8% | 1.8% |
| 43 | 1.1% | 1.4% | 0.7% | 1.8% |
| 44 | 1.0% | 1.4% | 1.1% | 1.6% |
Participatory Syndromic Surveillance
In week 44, 2,151 participants reported to FluWatchers, of which 27 (1.3%) reported symptoms of cough and fever (Figure 5).
Among the 27 participants who reported fever and cough:
- 15% consulted a healthcare professional
- 70% reported days missed from work or school, resulting in a combined total of 50 missed days of work or school.
Figure 5 – Percentage of participants reporting cough and fever, Canada, weeks 2018-40 to 2018-44
Number of Participants Reporting in Week 44: 2,151
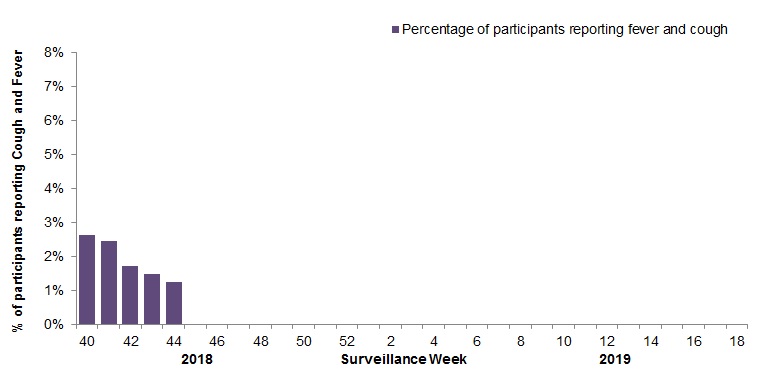
Figure 5 - Text description
| Surveillance week | % cough and fever |
|---|---|
| 40 | 2.6% |
| 41 | 2.5% |
| 42 | 1.7% |
| 43 | 1.5% |
| 44 | 1.3% |
Influenza Outbreak Surveillance
In week 44, one new laboratory-confirmed influenza outbreak associated with influenza A(H1N1)pdm09 was reported in another type of facility (i.e. not in the category of school/daycare, hospital, long-term care facility or remote/isolated community).
To date this season, 9 influenza outbreaks have been reported (Figure 6):
- Five outbreaks were in long-term care facilities, one was in a school, and three were in other settings.
- Among the outbreaks for which the influenza A subtype was available, three were associated with influenza A(H1N1)pdm09, two with A(H3N2) and one was associated with both A(H1N1)pdm09 and A(H3N2).
One new ILI outbreak in a long-term care facility was reported in week 44.
To date this season, 21 ILI outbreaks have been reported; 19 occurred in LTC facilities, one in a school, and one in a hospital.
Figure 6 – Number of new outbreaks of laboratory-confirmed influenza by report week, Canada, weeks 2018-35 to 2018-44
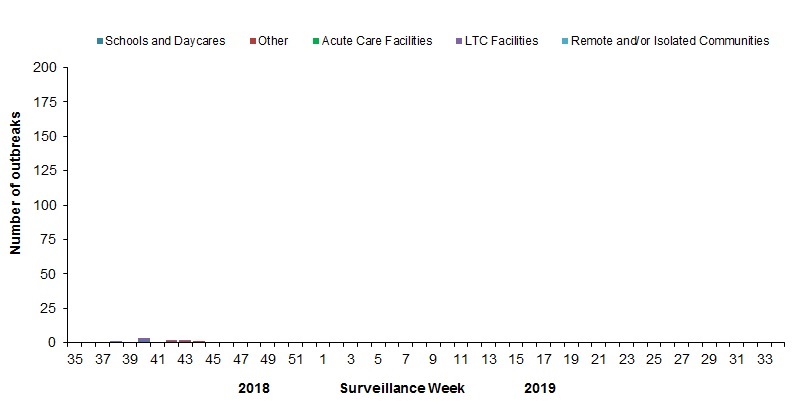
Figure 6 - Text description
| Surveillance Week | Acute Care Facilities | Long Term Care Facilities | Other | Schools and Daycares | Remote and/or Isolated Communities |
|---|---|---|---|---|---|
| 35 | 0 | 0 | 0 | 0 | 0 |
| 36 | 0 | 0 | 0 | 0 | 0 |
| 37 | 0 | 0 | 0 | 0 | 0 |
| 38 | 0 | 1 | 0 | 0 | 0 |
| 39 | 0 | 0 | 0 | 0 | 0 |
| 40 | 0 | 2 | 0 | 1 | 0 |
| 41 | 0 | 0 | 0 | 0 | 0 |
| 42 | 0 | 1 | 1 | 0 | 0 |
| 43 | 0 | 1 | 1 | 0 | 0 |
| 44 | 0 | 0 | 1 | 0 | 0 |
Severe Outcomes Influenza Surveillance
Provincial/Territorial Influenza Hospitalizations and Deaths
In week 44, 49 influenza-associated hospitalizations were reported, which is an increase compared to the previous week.
To date this season, 129 influenza-assocaited hospitalizations have been reported by participating provinces and territoriesFootnote 1.Hospitalizations (Table 2):
- 98% (127) were associated with influenza A
- Adults 65 years of age and older represent the largest proportion of hospitalizations (34%), followed by adults 45-64 years of age (23%).
Intensive Care Unit (ICU) cases and deaths:
- To date this season 16 ICU admissions and <5 deaths have been reported.
| Age Groups | Cumulative (August 26, 2018 to November 3, 2018) | |
|---|---|---|
| (years) | Total | % |
| 0-4 | 16 | 12% |
| 5-19 | 18 | 14% |
| 20-44 | 21 | 16% |
| 45-64 | 30 | 23% |
| 65+ | 44 | 34% |
| Total | 129 | 100% |
Pediatric Influenza Hospitalizations and Deaths
To date this season, 37 pediatric hospitalizations have been reported by the Immunization Monitoring Program Active (IMPACT) network.
- All 37 cases have been associated with influenza A.
- Among the 29 for which the influenza subtype was available, 28 were associated with A(H1N1)pdm09.
- 32 of the 37 cases were between 6 months and 9 years of age.
To date this season, 7 ICU admissions, and no deaths have been reported.
Figure 7 – Number of pediatric (≤16 years of age) hospitalizations reported by the IMPACT network, by week, Canada, weeks 2018-35 to 2018-44
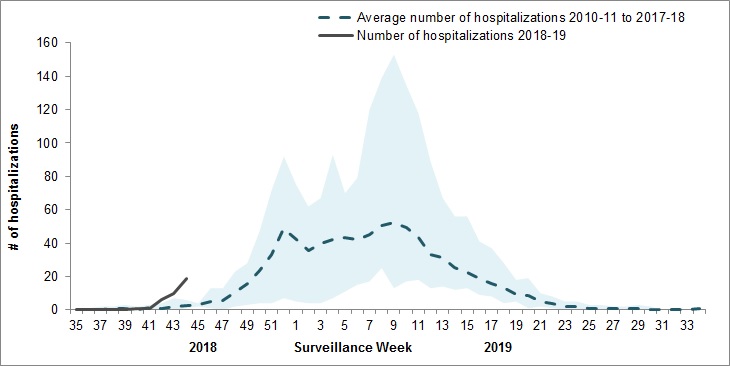
Figure 7 - Text description
| Surveillance week | 2018-19 | Average | Min | Max |
|---|---|---|---|---|
| 35 | 0 | 0 | 0 | 1 |
| 36 | 0 | 0 | 0 | 1 |
| 37 | 0 | 0 | 0 | 2 |
| 38 | 0 | 1 | 0 | 2 |
| 39 | 0 | 1 | 0 | 3 |
| 40 | 1 | 0 | 0 | 2 |
| 41 | 1 | 1 | 0 | 3 |
| 42 | 6 | 1 | 0 | 4 |
| 43 | 10 | 2 | 0 | 7 |
| 44 | 19 | 2 | 1 | 6 |
Adult Influenza Hospitalizations and Deaths
Surveillance of laboratory-confirmed influenza-associated adult (≥16 years of age) hospitalizations by the Canadian Immunization Research Network (CIRN) Serious Outcomes Surveillance (SOS) network began on November 1st for the 2018-19 season.
To date this season, fewer than 5 hospitalizations have been reported, all were associated with influenza A.
Influenza Strain Characterizations
Since September 1, 2018, the National Microbiology Laboratory (NML) has characterized 21 influenza viruses (4 A(H3N2) and 17 A(H1N1)) that were received from Canadian laboratories.
Genetic Characterization of Influenza A (H3N2):
Three influenza A(H3N2) viruses did not grow to sufficient hemagglutination titer for antigenic characterization by hemagglutination inhibition (HI) assay. Therefore, NML has performed genetic characterization to determine the genetic group identity of this virus.
Sequence analysis of the HA gene of the viruses showed that:
- One virus belonged to genetic group 3C.2a.
- Two viruses belonged to subclade 3C.2a1.
A/Singapore/INFIMH-16-0019/2016-like virus belongs to genetic group 3C.2a1 and is the influenza A(H3N2) component of the 2018-19 Northern Hemisphere influenza vaccine.
Antigenic Characterization:
Influenza A(H3N2):
- One influenza A(H3N2) virus was antigenically characterized as A/Singapore/INFIMH-16-0019/2016-like by HI testing using antiserum raised against egg-propagated A/Singapore/INFIMH-16-0019/2016.
- A/Singapore/INFIMH-16-0019/2016-like virus is the influenza A(H3N2) component of the 2018-19 Northern Hemisphere influenza vaccine.
- The influenza A (H3N2) virus characterized belonged to genetic group 3C.2a1.
Influenza A(H1N1):
- Seventeen A(H1N1) viruses characterized were antigenically similar to A/Michigan/45/2015, which is the influenza A(H1N1) component of the 2018-19 Northern Hemisphere influenza vaccine.
Antiviral Resistance
Antiviral Resistance – Amantadine:
Twenty influenza A (4 A(H3N2) and 16 A(H1N1)) viruses were tested for resistance to amantadine and it was found that:
- The four A(H3N2) viruses tested were resistant to amantadine.
- The 16 A(H1N1) viruses tested were resistant to amantadine.
Antiviral Resistance – Oseltamivir:
Nineteen influenza viruses (4 A(H3N2) and 15 A(H1N1)) were tested for resistance to oseltamivir and it was found that:
- The four A(H3N2) viruses tested were sensitive to oseltamivir
- The 15 A(H1N1) viruses tested were sensitive to oseltamivir
Antiviral Resistance – Zanamivir:
Nineteen influenza viruses (4 A(H3N2) and 15 H1N1) were tested for resistance to zanamivir and it was found that:
- The four A(H3N2) viruses were sensitive to zanamivir.
- The 15 A(H1N1) viruses were sensitive to zanamivir.
Provincial and International Surveillance Links
- Alberta – Influenza Surveillance
- British Columbia – Influenza Surveillance
- Manitoba - Seasonal Influenza Reports
- New Brunswick – Influenza Surveillance Reports
- Newfoundland and Labrador – Surveillance and Disease Reports
- Nova Scotia – Respiratory Watch Report
- Ontario – Ontario Respiratory Pathogen Bulletin
- Prince Edward Island – Influenza Summary
- Saskatchewan – Influenza Reports
- Québec – Sytème de surveillance de la grippe
- Australia – Influenza Surveillance Report and Activity Updates
- European Centre for Disease Prevention and Control - Surveillance reports and disease data on seasonal influenza
- New Zealand - Influenza Weekly Update
- United Kingdom - Weekly Influenza Activity Reports
- Pan-American Health Organization - Influenza Situation Report
- United States Centres for Disease Control and Prevention – Weekly Influenza Summary Update
- World Health Organization FluNet
Notes: To learn more about definitions, descriptions and the FluWatch program in general, see the Overview of influenza monitoring in Canada page. For more information on the flu, see our Flu(influenza) web page.
This report is available on the Government of Canada Influenza webpage.
Ce rapport est disponible dans les deux langues officielles.
We would like to thank all the Fluwatch surveillance partners who are participating in this year's influenza surveillance program.