
FluWatch report: June 20 to July 24, 2021 (weeks 25-29)
Download the alternative format
(PDF format, 1.01 mb, 7 pages)
Organization: Public Health Agency of Canada
Date published: 2021-07-30
Related Topics
Overall Summary
- Despite continued monitoring for influenza across Canada, there continues to be no evidence of community circulation of influenza. Given the time of year, influenza is expected to remain at interseasonal levels for the remainder of the 2020-2021 seasonal influenza surveillance period.
- Sign up to become a FluWatcher! FluWatchers provide valuable information on influenza and COVID-19 activity across Canada.
- The next and final FluWatch report of the 2020-2021 season will be published on September 3, 2021. Weekly reporting of laboratory detections of respiratory viruses will continue via our Respiratory Virus Detections Surveillance System.
On this page
- Influenza/ILI Activity (geographic spread)
- Laboratory Confirmed Influenza Detections
- Syndromic/Influenza-like Illness Surveillance
- FluWatchers
- Influenza Outbreak Surveillance
- Severe Outcomes Influenza Surveillance
- Influenza Strain Characterizations
- Antiviral Resistance
- Vaccine Monitoring
- Provincial and International Influenza Reports
Influenza/influenza-like illness (ILI) activity (geographic spread)
During week 29, two regions reported sporadic influenza/ILI activity (Figure 1).
Figure 1 - Map of influenza/ILI activity by province and territory, Canada, week 2021-29
Number of Regions Reporting in Week 29: 44 out of 53
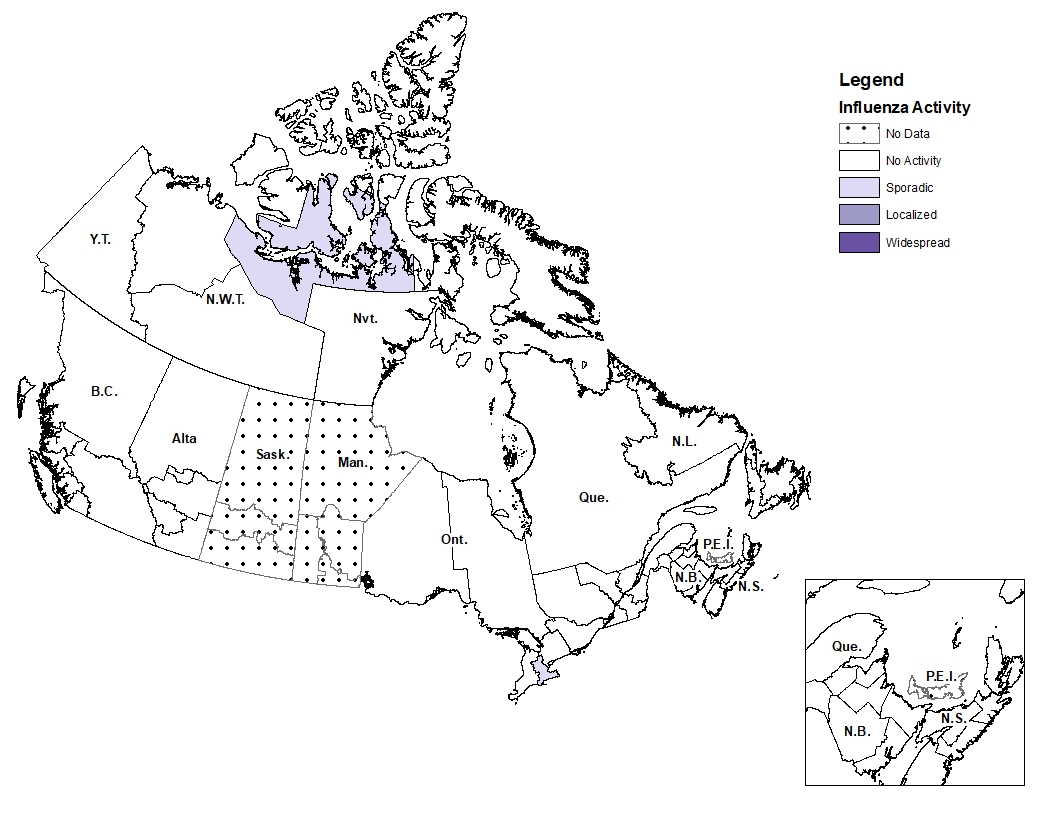
Figure 1 - Text equivalent
| Province | Influenza Surveillance Region | Activity Level |
|---|---|---|
| N.L. | Eastern | No Activity |
| N.L. | Labrador-Grenfell | No Activity |
| N.L. | Central | No Activity |
| N.L. | Western | No Activity |
| P.E.I. | Prince Edward Island | No Data |
| N.S. | Zone 1 - Western | No Activity |
| N.S. | Zone 2 - Northern | No Activity |
| N.S. | Zone 3 - Eastern | No Activity |
| N.S. | Zone 4 - Central | No Activity |
| N.B. | Region 1 | No Activity |
| N.B. | Region 2 | No Activity |
| N.B. | Region 3 | No Activity |
| N.B. | Region 4 | No Activity |
| N.B. | Region 5 | No Activity |
| N.B. | Region 6 | No Activity |
| N.B. | Region 7 | No Activity |
| Que. | Nord-est | No Activity |
| Que. | Québec et Chaudieres-Appalaches | No Activity |
| Que. | Centre-du-Québec | No Activity |
| Que. | Montréal et Laval | No Activity |
| Que. | Ouest-du-Québec | No Activity |
| Que. | Montérégie | No Activity |
| Ont. | Central East | No Activity |
| Ont. | Central West | Sporadic |
| Ont. | Eastern | No Activity |
| Ont. | North East | No Activity |
| Ont. | North West | No Activity |
| Ont. | South West | No Activity |
| Ont. | Toronto | No Activity |
| Man. | Northern Regional | No Data |
| Man. | Prairie Mountain | No Data |
| Man. | Interlake-Eastern | No Data |
| Man. | Winnipeg | No Data |
| Man. | Southern Health | No Data |
| Sask. | North | No Data |
| Sask. | Central | No Data |
| Sask. | South | No Data |
| Alta. | North Zone | No Activity |
| Alta. | Edmonton | No Activity |
| Alta. | Central Zone | No Activity |
| Alta. | Calgary | No Activity |
| Alta. | South Zone | No Activity |
| B.C. | Interior | No Activity |
| B.C. | Fraser | No Activity |
| B.C. | Vancouver Coastal | No Activity |
| B.C. | Vancouver Island | No Activity |
| B.C. | Northern | No Activity |
| Y.T. | Yukon | No Activity |
| N.W.T. | North | No Activity |
| N.W.T. | South | No Activity |
| Nvt. | Qikiqtaaluk | No Activity |
| Nvt. | Kivalliq | No Activity |
| Nvt. | Kitimeot | Sporadic |
Laboratory-confirmed influenza detections
In weeks 25 to 29, one laboratory detection of influenza was reported.
To date this season, 64 influenza detections have been reported (Figure 2), which is significantly lower than the past six seasons where an average of 52,089 influenza detections were reported for the season to date. All provinces and territories are closely monitoring indicators of influenza activity this season. Data in the FluWatch report represent surveillance data available at the time of writing, and may change as updates are received.
Thirty-one of the influenza detections reported to date this season are known to be associated with recent live attenuated influenza vaccine (LAIV) receipt and do not represent community circulation of seasonal influenza viruses. LAIV strains are attenuated but can be recovered by nasal swab in children and adults following vaccination with that product (i.e., "shedding"). For more information, please refer to the Canadian Immunization Guide Chapter on Influenza and Statement on Seasonal Influenza Vaccine for 2020–2021 (Section IV.2). Four of the influenza detections reported to date this season were sporadic detections of swine variant influenza A viruses: one influenza A(H1N1)v, two influenza A(H1N2)v and most recently in week 23, one influenza A(H3N2)v. These variant viruses differ from the influenza strains responsible for seasonal influenza epidemics. They are usually acquired through direct or indirect contact with swine and do not spread easily from person to person.
Overall, the percentage of laboratory tests positive for influenza remains at exceptionally low levels, despite the elevated levels of testing seen this month. In weeks 25 to 29, 26,093 tests for influenza were performed at reporting laboratories and the average percentage of tests positive was 0%. Compared to the past six seasons, the number of tests performed for this time period was higher than the average (9,622) and the percentage of tests positive for influenza remains well below average interseasonal levels (1.4%) (Figure 3a and 3b).
Testing for influenza and other respiratory viruses has been influenced by the current COVID-19 pandemic. Changes in laboratory testing practices may affect the comparability of data to previous weeks or previous seasons.
For more detailed weekly and cumulative influenza data, see the text descriptions for Figure 2 or the Respiratory Virus Detections in Canada Report.
Figure 2 - Number of positive influenza tests and percentage of tests positive, by type, subtype and report week, Canada, 2020-35 to 2021-29
Number of laboratories reporting in week 29: 31 out of 35
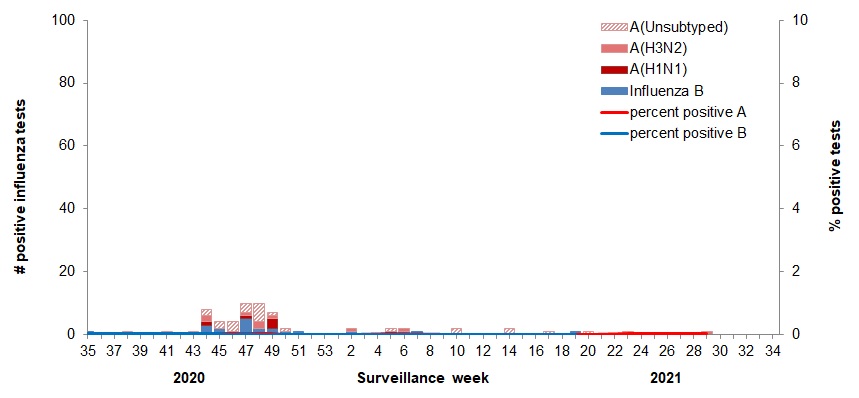
The shaded area indicates weeks where the positivity rate was at least 5% and a minimum of 15 positive tests were observed, signalling the period of seasonal influenza activity.
Figure 2 - Text equivalent
| Surveillance Week | A(Unsubtyped) | A(H3N2) | A(H1N1) | Influenza B | Percent Positive A | Percent Positive B |
|---|---|---|---|---|---|---|
| 35 | 0 | 0 | 0 | 1 | 0.0 | 0.0 |
| 36 | 0 | 0 | 0 | 0 | 0.0 | 0.0 |
| 37 | 0 | 0 | 0 | 0 | 0.0 | 0.0 |
| 38 | 1 | 0 | 0 | 0 | 0.0 | 0.0 |
| 39 | 0 | 0 | 0 | 0 | 0.0 | 0.0 |
| 40 | 0 | 0 | 0 | 0 | 0.0 | 0.0 |
| 41 | 1 | 0 | 0 | 0 | 0.0 | 0.0 |
| 42 | 0 | 0 | 0 | 0 | 0.0 | 0.0 |
| 43 | 1 | 0 | 0 | 0 | 0.0 | 0.0 |
| 44 | 2 | 2 | 1 | 3 | 0.0 | 0.0 |
| 45 | 2 | 0 | 0 | 2 | 0.0 | 0.0 |
| 46 | 3 | 0 | 0 | 1 | 0.0 | 0.0 |
| 47 | 3 | 1 | 1 | 5 | 0.0 | 0.0 |
| 48 | 6 | 2 | 0 | 2 | 0.0 | 0.0 |
| 49 | 2 | 1 | 3 | 2 | 0.0 | 0.0 |
| 50 | 1 | 0 | 0 | 1 | 0.0 | 0.0 |
| 51 | 1 | 0 | 0 | 1 | 0.0 | 0.0 |
| 52 | 0 | 0 | 0 | 0 | 0.0 | 0.0 |
| 53 | 0 | 0 | 2 | 0 | 0.0 | 0.0 |
| 1 | 0 | 0 | 0 | 0 | 0.0 | 0.0 |
| 2 | 1 | 1 | 2 | 1 | 0.0 | 0.0 |
| 3 | 0 | 0 | 0 | 0 | 0.0 | 0.0 |
| 4 | 0 | 0 | 0 | 0 | 0.0 | 0.0 |
| 5 | 1 | 0 | 1 | 0 | 0.0 | 0.0 |
| 6 | 2 | 1 | 0 | 1 | 0.0 | 0.0 |
| 7 | 1 | 0 | 0 | 1 | 0.0 | 0.0 |
| 8 | 0 | 0 | 0 | 0 | 0.0 | 0.0 |
| 9 | 0 | 0 | 0 | 0 | 0.0 | 0.0 |
| 10 | 2 | 0 | 0 | 0 | 0.0 | 0.0 |
| 11 | 0 | 0 | 0 | 0 | 0.0 | 0.0 |
| 12 | 0 | 0 | 0 | 0 | 0.0 | 0.0 |
| 13 | 0 | 0 | 0 | 0 | 0.0 | 0.0 |
| 14 | 2 | 0 | 0 | 0 | 0.0 | 0.0 |
| 15 | 0 | 0 | 0 | 0 | 0.0 | 0.0 |
| 16 | 0 | 0 | 0 | 0 | 0.0 | 0.0 |
| 17 | 1 | 0 | 0 | 0 | 0.0 | 0.0 |
| 18 | 0 | 0 | 0 | 0 | 0.0 | 0.0 |
| 19 | 0 | 0 | 1 | 1 | 0.0 | 0.0 |
| 20 | 1 | 0 | 0 | 0 | 0.0 | 0.0 |
| 21 | 0 | 0 | 0 | 0 | 0.0 | 0.0 |
| 22 | 0 | 0 | 0 | 0 | 0.0 | 0.0 |
| 23 | 0 | 1 | 0 | 0 | 0.0 | 0.0 |
| 24 | 0 | 0 | 0 | 0 | 0.0 | 0.0 |
| 25 | 0 | 0 | 0 | 0 | 0.0 | 0.0 |
| 26 | 0 | 0 | 0 | 0 | 0.0 | 0.0 |
| 27 | 0 | 0 | 0 | 0 | 0.0 | 0.0 |
| 28 | 0 | 0 | 0 | 0 | 0.0 | 0.0 |
| 29 | 0 | 1 | 0 | 0 | 0.0 | 0.0 |
Figure 3 - Number of influenza tests (a) and percentage of tests positive (b) in Canada by week, weeks 2020-35 to 2021-29 as compared to previous seasons
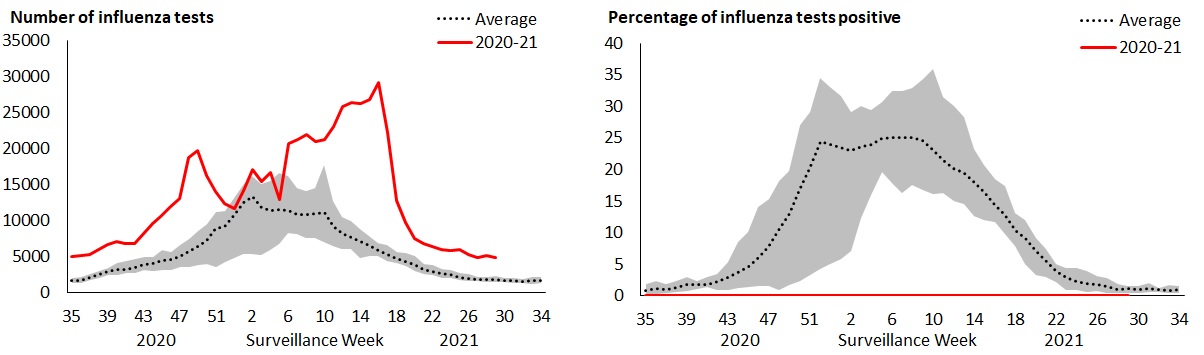
The shaded area represents the maximum and minimum number of influenza tests (a) or percentage of tests positive (b) reported by week from seasons 2014-2015 to 2019-2020.
Figure 3 - Text equivalent
| Surveillance Week | Number of Tests, 2020-21 | Maximum Number of Tests | Minimum Number of Tests | Average Number of Tests |
|---|---|---|---|---|
| 35 | 4996 | 1979 | 1311 | 1705 |
| 36 | 5192 | 2208 | 1323 | 1707 |
| 37 | 5335 | 2631 | 1778 | 2135 |
| 38 | 6024 | 3039 | 1987 | 2502 |
| 39 | 6707 | 3356 | 2365 | 2859 |
| 40 | 7127 | 4078 | 2443 | 3134 |
| 41 | 6817 | 4339 | 2673 | 3240 |
| 42 | 6755 | 4649 | 2648 | 3526 |
| 43 | 8227 | 4996 | 3084 | 3862 |
| 44 | 9615 | 4966 | 2994 | 4020 |
| 45 | 10748 | 5912 | 3117 | 4508 |
| 46 | 11955 | 5589 | 3176 | 4564 |
| 47 | 13103 | 6541 | 3587 | 5018 |
| 48 | 18762 | 7416 | 3569 | 5645 |
| 49 | 19649 | 8559 | 3836 | 6377 |
| 50 | 16189 | 9464 | 4017 | 7155 |
| 51 | 14059 | 11142 | 3487 | 8822 |
| 52 | 12290 | 11338 | 4272 | 9184 |
| 53 | 11681 | 13135 | 4821.5 | 10868 |
| 1 | 14097 | 14932 | 5371 | 12552 |
| 2 | 17002 | 16104 | 5315 | 13289 |
| 3 | 15391 | 15001 | 5270 | 11820 |
| 4 | 16607 | 15414 | 5873 | 11441 |
| 5 | 12914 | 16595 | 6739 | 11456 |
| 6 | 20715 | 16121 | 8324 | 11339 |
| 7 | 21255 | 14443 | 8074 | 10842 |
| 8 | 20971 | 14024 | 7606 | 10865 |
| 9 | 20896 | 14520 | 7507 | 10956 |
| 10 | 21220 | 17681 | 7005 | 11084 |
| 11 | 23087 | 12714 | 6435 | 9175 |
| 12 | 25811 | 10431 | 5976 | 8238 |
| 13 | 26286 | 9989 | 6063 | 7699 |
| 14 | 26279 | 8830 | 4773 | 7046 |
| 15 | 26789 | 7836 | 5090 | 6527 |
| 16 | 29154 | 6826 | 5000 | 5890 |
| 17 | 22152 | 6603 | 4440 | 5305 |
| 18 | 02725 | 5640 | 4143 | 4780 |
| 19 | 9738 | 5480 | 3680 | 4311 |
| 20 | 74420 | 5097 | 3046 | 3862 |
| 21 | 6765 | 4001 | 2577 | 3197 |
| 22 | 6318 | 3790 | 2424 | 2944 |
| 23 | 5906 | 3257 | 1969 | 2591 |
| 24 | 5774 | 3120 | 2034 | 2449 |
| 25 | 5972 | 2659 | 1731 | 2148 |
| 26 | 5212 | 2600 | 1573 | 1988 |
| 27 | 4900 | 2163 | 1554 | 1833 |
| 28 | 5121 | 2223 | 1451 | 1857 |
| 29 | 4888 | 2256 | 1436 | 1796 |
| 30 | #N/A | 1950 | 1463 | 1664 |
| 31 | #N/A | 2022 | 1386 | 1671 |
| 32 | #N/A | 1928 | 1269 | 1574 |
| 33 | #N/A | 2089 | 1251 | 1671 |
| 34 | #N/A | 2098 | 1374 | 1698 |
| Surveillance Week | Percentage of tests positive, 2020-21 | Maximum Percentage of Tests Positive | Minimum Percentage of Tests Positive | Average Percentage of Tests Positive |
|---|---|---|---|---|
| 35 | 0.02 | 1.87 | 0.11 | 0.82 |
| 36 | 0.00 | 2.28 | 0.30 | 1.13 |
| 37 | 0.00 | 1.78 | 0.40 | 0.99 |
| 38 | 0.02 | 2.35 | 0.55 | 1.30 |
| 39 | 0.00 | 2.95 | 0.67 | 1.71 |
| 40 | 0.00 | 2.33 | 1.08 | 1.70 |
| 41 | 0.01 | 3.02 | 1.32 | 1.72 |
| 42 | 0.00 | 3.40 | 0.87 | 2.18 |
| 43 | 0.01 | 5.32 | 0.84 | 2.83 |
| 44 | 0.07 | 8.55 | 1.20 | 3.70 |
| 45 | 0.04 | 10.10 | 1.39 | 4.63 |
| 46 | 0.03 | 14.11 | 1.51 | 6.05 |
| 47 | 0.07 | 15.36 | 1.44 | 7.71 |
| 48 | 0.05 | 18.20 | 0.84 | 10.61 |
| 49 | 0.04 | 19.71 | 1.64 | 13.01 |
| 50 | 0.01 | 27.02 | 2.36 | 16.82 |
| 51 | 0.01 | 29.09 | 3.30 | 20.11 |
| 52 | 0.00 | 34.54 | 4.28 | 24.48 |
| 53 | 0.02 | 33.10 | 5.06 | 23.95 |
| 1 | 0.00 | 31.66 | 5.85 | 23.41 |
| 2 | 0.03 | 29.10 | 7.06 | 23.01 |
| 3 | 0.00 | 30.07 | 12.24 | 23.63 |
| 4 | 0.00 | 29.45 | 15.89 | 23.96 |
| 5 | 0.02 | 30.62 | 19.60 | 24.90 |
| 6 | 0.02 | 32.39 | 17.89 | 25.00 |
| 7 | 0.01 | 32.51 | 16.28 | 25.05 |
| 8 | 0.00 | 32.87 | 17.45 | 25.14 |
| 9 | 0.00 | 34.28 | 16.80 | 24.59 |
| 10 | 0.01 | 35.99 | 16.05 | 23.22 |
| 11 | 0.00 | 31.41 | 16.19 | 24.41 |
| 12 | 0.00 | 30.03 | 15.03 | 20.10 |
| 13 | 0.00 | 28.25 | 14.50 | 19.56 |
| 14 | 0.01 | 23.16 | 12.66 | 17.86 |
| 15 | 0.00 | 20.73 | 11.95 | 16.27 |
| 16 | 0.00 | 18.52 | 11.64 | 14.48 |
| 17 | 0.00 | 17.30 | 9.76 | 12.83 |
| 18 | 0.00 | 13.02 | 7.88 | 10.26 |
| 19 | 0.02 | 11.95 | 4.96 | 8.98 |
| 20 | 0.01 | 9.13 | 3.19 | 7.22 |
| 21 | 0.00 | 7.45 | 2.97 | 5.60 |
| 22 | 0.00 | 4.96 | 2.19 | 3.86 |
| 23 | 0.02 | 4.39 | 0.87 | 2.86 |
| 24 | 0.00 | 4.36 | 0.81 | 2.25 |
| 25 | 0.00 | 3.95 | 0.63 | 1.88 |
| 26 | 0.00 | 3.08 | 0.69 | 1.81 |
| 27 | 0.00 | 2.83 | 0.42 | 1.48 |
| 28 | 0.00 | 1.84 | 0.41 | 0.91 |
| 29 | 0.02 | 1.55 | 0.47 | 1.09 |
| 30 | #N/A | 1.46 | 0.46 | 0.90 |
| 31 | #N/A | 1.93 | 0.58 | 1.11 |
| 32 | #N/A | 1.19 | 0.52 | 0.92 |
| 33 | #N/A | 1.69 | 0.40 | 0.85 |
| 34 | #N/A | 1.57 | 0.42 | 0.92 |
Syndromic / influenza-like illness surveillance
Healthcare practitioners sentinel syndromic surveillance
In week 29, 0.2% of visits to healthcare professionals were due to influenza-like illness (ILI), which remains lower than average compared to recent seasons (Figure 4).
This trend should be interpreted with caution as there have been changes in healthcare seeking behavior of individuals and a smaller number of sentinels reporting in recent weeks compared to previous seasons.
Figure 4 - Percentage of visits for ILI reported by sentinels by report week, Canada, weeks 2020-35 to 2021-29
Number of Sentinels Reporting in Week 29: 51
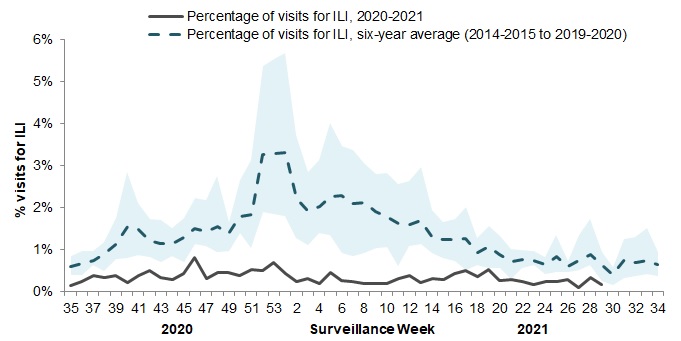
The shaded area represents the maximum and minimum percentage of visits for ILI reported by week from seasons 2014-2015 to 2019-2020
Figure 4 - Text equivalent
| Surveillance Week | 2020-2021 | Average | Min | Max |
|---|---|---|---|---|
| 35 | 0.1% | 0.6% | 0.4% | 0.9% |
| 36 | 0.2% | 0.7% | 0.4% | 1.0% |
| 37 | 0.4% | 0.7% | 0.6% | 1.0% |
| 38 | 0.3% | 0.9% | 0.5% | 1.2% |
| 39 | 0.4% | 1.1% | 0.8% | 1.7% |
| 40 | 0.2% | 1.6% | 0.8% | 2.8% |
| 41 | 0.4% | 1.5% | 0.9% | 2.1% |
| 42 | 0.5% | 1.2% | 0.8% | 1.7% |
| 43 | 0.3% | 1.1% | 0.7% | 1.7% |
| 44 | 0.3% | 1.1% | 0.9% | 1.5% |
| 45 | 0.4% | 1.3% | 0.7% | 1.8% |
| 46 | 0.8% | 1.5% | 1.1% | 2.2% |
| 47 | 0.3% | 1.4% | 1.1% | 2.2% |
| 48 | 0.5% | 1.5% | 0.9% | 2.8% |
| 49 | 0.5% | 1.4% | 1.0% | 1.7% |
| 50 | 0.4% | 1.8% | 1.4% | 2.7% |
| 51 | 0.5% | 1.8% | 1.0% | 3.1% |
| 52 | 0.5% | 3.3% | 1.9% | 5.4% |
| 53 | 0.7% | 3.3% | 1.9% | 5.5% |
| 1 | 0.4% | 3.3% | 1.8% | 5.7% |
| 2 | 0.2% | 2.2% | 1.3% | 3.7% |
| 3 | 0.3% | 1.9% | 1.1% | 2.9% |
| 4 | 0.2% | 2.0% | 1.4% | 3.1% |
| 5 | 0.5% | 2.3% | 1.4% | 4.0% |
| 6 | 0.3% | 2.3% | 0.9% | 3.5% |
| 7 | 0.2% | 2.1% | 0.8% | 3.4% |
| 8 | 0.2% | 2.1% | 0.9% | 3.1% |
| 9 | 0.2% | 1.9% | 1.0% | 2.8% |
| 10 | 0.2% | 1.8% | 1.1% | 2.8% |
| 11 | 0.3% | 1.6% | 0.6% | 2.6% |
| 12 | 0.4% | 1.6% | 1.1% | 2.6% |
| 13 | 0.2% | 1.7% | 1.1% | 3.0% |
| 14 | 0.3% | 1.3% | 0.9% | 1.9% |
| 15 | 0.3% | 1.2% | 0.8% | 1.7% |
| 16 | 0.4% | 1.2% | 0.7% | 1.7% |
| 17 | 0.5% | 1.3% | 0.5% | 2.0% |
| 18 | 0.3% | 0.9% | 0.6% | 1.3% |
| 19 | 0.5% | 1.1% | 0.6% | 1.5% |
| 20 | 0.3% | 0.9% | 0.5% | 1.3% |
| 21 | 0.3% | 0.7% | 0.3% | 1.0% |
| 22 | 0.2% | 0.8% | 0.6% | 1.0% |
| 23 | 0.2% | 0.7% | 0.6% | 1.0% |
| 24 | 0.2% | 0.6% | 0.4% | 0.8% |
| 25 | 0.2% | 0.8% | 0.5% | 1.4% |
| 26 | 0.3% | 0.6% | 0.5% | 0.7% |
| 27 | 0.1% | 0.7% | 0.5% | 1.3% |
| 28 | 0.3% | 0.9% | 0.6% | 1.7% |
| 29 | 0.2% | 0.6% | 0.2% | 0.9% |
| 30 | #N/A | 0.4% | 0.2% | 0.6% |
| 31 | #N/A | 0.8% | 0.3% | 1.2% |
| 32 | #N/A | 0.7% | 0.4% | 1.3% |
| 33 | #N/A | 0.7% | 0.4% | 1.5% |
| 34 | #N/A | 0.6% | 0.4% | 0.9% |
FluWatchers
In week 29, 11,369 participants reported to FluWatchers, and a total of 20 participants (0.18%) reported symptoms of cough and fever (Figure 5). The percentage of participants reporting cough and fever remains at very low levels and may be a direct effect of individual and public health measures enacted to reduce the spread of COVID-19. FluWatchers reporting is not impacted by changes in health services or health seeking behaviours.
If you are interested in becoming a FluWatcher, sign up today.
Figure 5 - Percentage of participants reporting fever and cough, Canada, weeks 2020-35 to 2021-29
Number of Participants Reporting in Week 29: 11,369
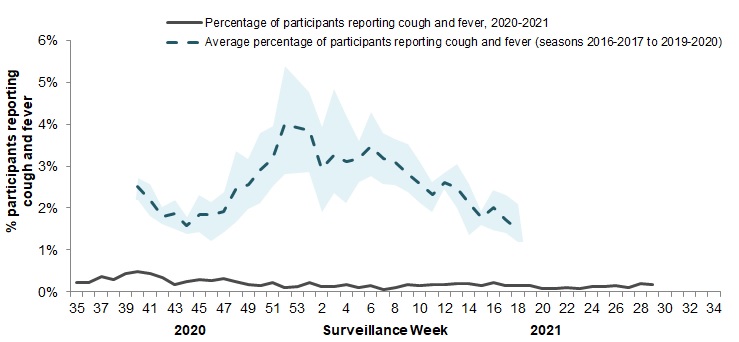
The shaded area represents the maximum and minimum percentage of percentage of participants reporting cough and fever by week, from seasons 2014-2015 to 2019-2020
Figure 5 - Text equivalent
| Surveillance Week | 2020-2021 | Average | Min | Max |
|---|---|---|---|---|
| 35 | 0.22% | N/A | N/A | N/A |
| 36 | 0.21% | N/A | N/A | N/A |
| 37 | 0.38% | N/A | N/A | N/A |
| 38 | 0.29% | N/A | N/A | N/A |
| 39 | 0.45% | N/A | N/A | N/A |
| 40 | 0.49% | 2.51% | 2.18% | 2.71% |
| 41 | 0.44% | 2.18% | 1.81% | 2.57% |
| 42 | 0.33% | 1.80% | 1.61% | 2.03% |
| 43 | 0.17% | 1.87% | 1.49% | 2.18% |
| 44 | 0.26% | 1.57% | 1.39% | 1.78% |
| 45 | 0.29% | 1.83% | 1.42% | 2.32% |
| 46 | 0.28% | 1.83% | 1.22% | 2.15% |
| 47 | 0.31% | 1.93% | 1.44% | 2.39% |
| 48 | 0.26% | 2.43% | 1.67% | 3.35% |
| 49 | 0.17% | 2.56% | 1.97% | 3.16% |
| 50 | 0.15% | 2.91% | 2.12% | 3.79% |
| 51 | 0.22% | 3.18% | 2.53% | 3.95% |
| 52 | 0.10% | 3.98% | 2.81% | 5.38% |
| 53 | 0.12% | 3.91% | 2.83% | 5.07% |
| 1 | 0.21% | 3.84% | 2.85% | 4.76% |
| 2 | 0.12% | 2.94% | 1.90% | 3.93% |
| 3 | 0.12% | 3.25% | 2.35% | 4.84% |
| 4 | 0.17% | 3.12% | 2.13% | 4.23% |
| 5 | 0.11% | 3.19% | 2.62% | 3.59% |
| 6 | 0.16% | 3.47% | 2.76% | 4.28% |
| 7 | 0.06% | 3.18% | 2.58% | 3.79% |
| 8 | 0.10% | 3.09% | 2.54% | 3.65% |
| 9 | 0.18% | 2.81% | 2.38% | 3.53% |
| 10 | 0.16% | 2.58% | 2.12% | 3.11% |
| 11 | 0.17% | 2.33% | 1.89% | 2.63% |
| 12 | 0.17% | 2.60% | 2.46% | 2.82% |
| 13 | 0.19% | 2.48% | 1.99% | 3.06% |
| 14 | 0.21% | 2.13% | 1.35% | 2.58% |
| 15 | 0.14% | 1.78% | 1.60% | 1.93% |
| 16 | 0.22% | 2.00% | 1.47% | 2.44% |
| 17 | 0.15% | 1.73% | 1.40% | 2.31% |
| 18 | 0.14% | 1.50% | 1.19% | 2.09% |
| 19 | 0.15% | N/A | N/A | N/A |
| 20 | 0.07% | N/A | N/A | N/A |
| 21 | 0.09% | N/A | N/A | N/A |
| 22 | 0.10% | N/A | N/A | N/A |
| 23 | 0.08% | N/A | N/A | N/A |
| 24 | 0.13% | N/A | N/A | N/A |
| 25 | 0.12% | N/A | N/A | N/A |
| 26 | 0.16% | N/A | N/A | N/A |
| 27 | 0.11% | N/A | N/A | N/A |
| 28 | 0.20% | N/A | N/A | N/A |
| 29 | 0.18% | N/A | N/A | N/A |
| 30 | N/A | N/A | N/A | |
| 31 | N/A | N/A | N/A | |
| 32 | N/A | N/A | N/A | |
| 33 | N/A | N/A | N/A | |
| 34 | N/A | N/A | N/A |
Click on the map to access the link
Influenza outbreak surveillance
In weeks 25 to 29, no outbreaks were reported.
To date this season, 139 influenza-like-illness (ILI) outbreaks in schools and/or daycares, and no other influenza or ILI outbreaks have been reported in any other settings.
Outbreaks of ILI in schools and daycares are identified when greater than 10% absenteeism due to ILI are reported in these settings. The number of ILI outbreaks in schools and daycares reported is higher compared to the same time period in the previous two seasons. This is not unexpected given changes to outbreak surveillance, specifically increased vigilance in schools to monitor and report absenteeism due to ILI, and the increased restrictions on attendance for children with symptoms of viral respiratory illness.
Outbreaks of ILI are not specific to any one respiratory pathogen and can be due influenza or other respiratory viruses, including rhinovirus and SARS-CoV-2, the virus that causes COVID-19. For more information on the respiratory viruses currently circulating in Canada, please refer to the Respiratory Virus Detections in Canada Report.
Number of provinces and territories reporting in weeks 25 to 29Footnote 1: 11 out of 13
- Footnote 1
-
All Provinces and Territories (PTs) participate in FluWatch's outbreak surveillance system. This outbreak system monitors influenza and ILI outbreaks in long-term care facilities, acute care facilities, schools and daycares, remote and/or isolated communities, and facilities categorized as 'other'. Not all reporting PTs report outbreaks in all these settings. All PTs report laboratory confirmed outbreaks in LTCF. Four PTs (NB, NL, NS and YK) report ILI outbreaks in schools and/or daycares.
Severe outcomes influenza surveillance
Provincial/territorial influenza hospitalizations and deaths
In weeks 25 to 29, no influenza-associated hospitalizations were reported by participating provinces and territoriesFootnote 2, nor have any been reported this season to date.
Number of provinces and territories reporting in weeks 25 to 29: 7 out of 9
- Footnote 2
-
Influenza-associated hospitalizations are reported by Alberta, Manitoba, New Brunswick, Newfoundland and Labrador, Northwest Territories, Nova Scotia, Prince Edward Island and Yukon. Only hospitalizations that require intensive medical care are reported by Saskatchewan.
Pediatric influenza hospitalization and deaths
In weeks 25 to 29 no influenza-associated hospitalizations were reported. To date this season, less than five pediatric (≤16 years of age) hospitalizations with influenza have been reported by the Immunization Monitoring Program Active (IMPACT) network.
Adult influenza hospitalization and deaths
In weeks 25 to 29, no influenza-associated hospitalizations were reported. To date this season, less than five adult (≥16 years of age) hospitalizations with influenza have been reported by the Canadian Immunization Research Network (CIRN) Serious Outcomes Surveillance (SOS) network.
Influenza strain characterizations
Due to the very low influenza circulation to date this season, the National Microbiology Laboratory has not reported strain characterization information on influenza viruses collected during the 2020-2021 season.
Antiviral resistance
Due to the very low influenza circulation to date this season, the National Microbiology Laboratory has not reported antiviral resistance testing results for influenza viruses collected during the 2020-2021 season.
Vaccine monitoring
Vaccine monitoring refers to activities related to the monitoring of influenza vaccine coverage and effectiveness.
Vaccine coverage
The Seasonal Influenza Immunization Coverage Survey is an annual telephone survey conducted between January and February that collects information from Canadians on whether they received the annual seasonal influenza vaccine that season. Vaccine coverage is measured as the percentage of people who reported receiving the influenza vaccine in a specific influenza season.
In the 2020-21 influenza season, coverage was similar to the 2019-20 season, at:
- 32% among adults aged 18 to 64 years.
- 29% among adults aged 18-64 without chronic medical conditions.
- 41% among adults aged 18 to 64 years with chronic medical conditions.
- 70% among seniors (aged 65 years and older).
| Age group (years) | All | Male | Female | |||
|---|---|---|---|---|---|---|
| N | Vaccine Coverage % (95% CI) | N | Vaccine Coverage % (95% CI) | N | Vaccine Coverage % (95% CI) | |
| All adults (≥18) | 3014 | 40.4 (38.4-42.4) | 1399 | 35.2 (32.5-38.0) | 1595 | 45.2 (42.4-48.1) |
| 18-64 | 2152 | 32.4 (30.1-34.6) | 1024 | 27.3 (24.3-30.3) | 1115 | 37.4 (34.1-40.7) |
| - with chronic medical conditions | 646 | 40.5 (36.2-44.8) | 286 | 36.9 (30.7-43.1) | 354 | 43.5 (37.5-49.4) |
| - without chronic medical conditions | 1498 | 29.2 (26.6-31.8) | 734 | 24.2 (20.8-27.6) | 757 | 34.6 (30.6-38.5) |
| ≥65 | 862 | 70.4 (67.1-73.8) | 375 | 68.0 (62.8-73.2) | 480 | 72.8 (68.4-77.1) |
|
||||||
Vaccine effectiveness
Influenza vaccine effectiveness (VE) estimates are typically available in February or March of each year. Given the low influenza circulation, VE estimates will not be available for the 2020-2021 season.
Notes
The data in the FluWatch report represent surveillance data available at the time of writing. All data are preliminary and may change as more reports are received.
To learn more about the FluWatch program, see the Overview of influenza monitoring in Canada page. For more information on the flu, see our Flu (influenza) web page.