
Seasonal influenza vaccination coverage in Canada, 2019-2020
Download the alternative format
(PDF format, 3.26 MB, 28 pages)
Organization: Public Health Agency of Canada
Published: November 2020
Table of contents
This report summarizes the results from the national 2019–2020 Seasonal Influenza Vaccination Coverage Survey. Respondents were questioned regarding their influenza vaccine uptake for the 2019–2020 season, reasons for vaccination or non-vaccination, knowledge, attitudes, and beliefs (KAB) regarding vaccination, sources of information on influenza vaccine, and select demographic information. Results are described for all adults and for two sub-groups at increased risk for complications from influenza: adults aged 18–64 years with a chronic medical condition (CMC) and seniors aged 65 years and older.
Key findings
- Overall, influenza vaccination coverage among adults (42%) was similar to the previous season (42%).
- More females (46%) than males (37%) received the vaccine.
- Among high-risk groups, vaccination coverage for seniors aged 65 years and older (70%) and adults aged 18–64 years with CMC (44%) remained below the national coverage goals of 80%.
- The majority of adults received their influenza vaccine in October or November (81%).
- The main vaccination places were pharmacies (40%) and doctor’s offices (28%).
- The most commonly reported reason for receiving the vaccine was to prevent infection or to avoid getting sick (47%), whereas the most common reason for non-vaccination was the perception that the vaccine was not needed or not necessary (22%).
- The most commonly reported sources of information on influenza vaccination were family physicians, Internet such as Google, health websites or blogs, and health professionals such as doctors, nurses or pharmacists.
- The most trusted sources of information about the influenza vaccine were health professionals (nurses, doctors, and pharmacists), family physicians and Health Canada or the Public Health Agency of Canada.
- Among the 25% of respondents who reported having seen or read information related to the influenza vaccine on the Internet or social media lately, the majority of them (78%) stated that their opinion about the influenza vaccine has not changed as a result.
Introduction
Influenza, also known as the flu, is an infection of the upper airway caused primarily by the influenza A and B viruses. Symptoms can include fever, cough, muscles aches and pains, headache, sore throat, etc.Footnote 1. It is ranked among the top 10 leading causes of death in Canada. Each year, it is estimated that influenza causes on average 12,200 hospitalizations and 3,500 deaths in CanadaFootnote 1. Though influenza viruses circulate in Canada year-round, most cases within the northern hemisphere occur between November and April.
The best way to prevent influenza and its potentially serious complications is to get vaccinated against it early in each flu season. Vaccination against influenza protects oneself and others by reducing the severity of the disease and likelihood of transmissionFootnote 2Footnote 3. It is important to get the influenza vaccine every year because the influenza virus is constantly changing, and a new vaccine is developed for each influenza season based on the circulating virus strain expected to be dominant during the flu seasonFootnote 4. It is best to receive the influenza vaccine earlier in the flu season before the virus begins spreading in the community, usually between October and December.
The National Advisory Committee on Immunization (NACI) recommends that all individuals aged six months and older receive the annual seasonal influenza vaccine, especially for populations at higher risk of influenza-related complications including:
- Children aged 6–59 months;
- People with certain chronic medical conditions (CMC);
- Seniors aged 65 years and older; and
- Pregnant womenFootnote 5.
Slightly higher than the World Health Organization (WHO) coverage goals of 75%, the Canadian national influenza vaccination coverage goals for seniors aged 65 and older and adults aged 18–64 years with CMC were set at 80% in 2017 to be reached by 2025Footnote 6Footnote 7. Measuring influenza vaccination coverage is necessary to track Canada’s progress towards its coverage goals as well as to identify under-vaccinated subpopulations and evaluate vaccination programs.
In addition to measuring influenza vaccination coverage, it is important to understand people’s KAB regarding influenza vaccination. Any element of KAB regarding influenza vaccination could serve as a barrier or facilitator to vaccinationFootnote 8. Understanding these elements can inform and improve vaccination promotion efforts in order to increase uptake within the Canadian population to achieve the coverage goals.
This year, new questions related to source of information on influenza vaccination were added to the survey in order to identify where and how Canadian adults obtained information about the influenza vaccine and which sources they trusted the most. While Internet use for information seeking is now ubiquitous, it is important to identify the actual information delivered on the Internet and social media regarding the influenza vaccine and how the information could influence their views about the vaccine.
This report summarizes results from the 2019–2020 Seasonal Influenza Vaccination Coverage Survey to estimate seasonal influenza vaccination coverage, describe KAB regarding the influenza vaccine, identify sources of information about influenza vaccine and determine factors associated with influenza vaccine uptake within the total Canadian population and risk groups.
Methodology
Survey sampling
The survey was conducted by Léger Marketing. A comprehensive description of the quantitative methodology is available elsewhereFootnote 9. Briefly, a stratified regional sampling approach was used, with survey respondents from every province and territory selected using random digit dialling of landlines and known cellphone-only household numbers.
In order to appropriately reflect the total Canadian population, sample weights were provided by Léger to adjust for region, sex, age, language (mother tongue), education, presence of minor children in the household, and whether the respondent lives in a cellphone-only household.
Data collection
Interviews were conducted between January 10 and February 18, 2020, using computer-assisted telephone interviewing (CATI) system. A total of 3,026 adults were interviewed regarding their influenza vaccine uptake for the 2019–2020 season, reasons for vaccination or non-vaccination, KAB regarding vaccination, sources of information about influenza vaccine and select demographic information. Respondents who were unsure about their influenza vaccination status (n=3) were excluded from subsequent analyses, resulting in a final analytical data set of 3,023 respondents.
Statistical analysis
Vaccination coverage was estimated as the number of survey respondents who reported they received the influenza vaccine in the 2019–2020 season, expressed as a weighted proportion of the survey respondents who provided a definitive response (i.e. reported did or did not receive the vaccine). Simple weighted proportions and 95% confidence intervals were calculated for categorical variables. Chi-squared tests with a p-value <0.05 were used to determine significant differences in vaccination coverage between genders within each age or risk group. Logistic regression was used to assess the associations between sources of information and influenza vaccine uptake. Unadjusted (OR) and adjusted (aOR) odds ratios with 95% confidence intervals were estimated.
The precision of the estimate was determined by the coefficient of variation. Estimates with a coefficient of variation from 16% to 33% indicated higher sampling error and are to be interpreted with caution. Estimates with a coefficient of variation greater than 33.3% or based on a count less than 10 were considered unreliable and therefore are not reported.
All estimates presented in this report are weighted.
Results
1. Vaccination coverage
A total of 3,026 eligible adult respondents completed the telephone interview in the 2019–2020 Seasonal Influenza Vaccination Coverage Survey. The overall response rate calculated using the Marketing Research Intelligence Association’s standard calculation method for the response rate regarding a telephone survey was 17%Footnote 9.
Overall, approximately four in ten (42%) adults aged 18 years and older reported receiving the 2019-2020 influenza vaccine. In general, influenza vaccine uptake was significantly higher in females (46%) than in males (37%, p<0.001). (Table 1.1)
Vaccination coverage was 44% among adults aged 18-64 years with CMC and 30% among adults 18-64 years of age without any CMC. The vaccination rate was highest among seniors 65 years of age and older (70%). (Table 1.1)
For adults aged 18-64 years with or without CMC, a significant difference in influenza vaccine uptake between females and males was also observed. However, this difference was not significant among seniors aged 65 years and older, which is consistent with previous studiesFootnote 10Footnote 11. (Table 1.1).
Although the national influenza vaccination coverage goal for those at high risk of influenza-related complications or hospitalization (80%) has not been achieved, vaccine uptake among seniors 65 years of age and older is approaching this goal (70%).
| Age group (years) | All | Male | Female | p | |||
|---|---|---|---|---|---|---|---|
| n | Vaccination Coverage, % (95% CI) |
n | Vaccination Coverage, % (95% CI) |
n | Vaccination Coverage, % (95% CI) |
||
| All adults ≥18 | 3023 | 41.8 (39.7-43.9) | 1320 | 37.2 (34.1-40.2) | 1691 | 46.1 (43.2-49.0) | <0.001Footnote * |
| 18-64 | 2234 | 34.1 (31.8-36.5) | 1005 | 29.8 (26.5-33.1) | 1218 | 38.4 (35.1-41.7) | <0.001Footnote * |
| 18-64 with CMC | 668 | 43.6 (39.0-48.1) | 268 | 38.3 (31.5-45.2) | 397 | 47.9 (41.7-54.0) | 0.043Footnote * |
| 18-64 without CMC | 1558 | 30.0 (27.3-32.7) | 732 | 26.7 (22.9-30.5) | 818 | 33.5 (29.6-37.3) | 0.015Footnote * |
| ≥65 | 789 | 70.3 (66.7-73.8) | 315 | 67.2 (61.5-72.9) | 473 | 72.7 (68.3-77.1) | 0.134 |
n = number of respondents (unweighted). CMC – Chronic medical condition(s). CI – Confidence interval.
|
|||||||
Overall, coverage among all adults aged 18 years of age and older for the 2019–2020 flu season has not changed significantly from previous cycles of the surveyFootnote 12Footnote 13. (Figure 1.1)
Figure 1.1. Seasonal influenza vaccination coverage, by risk group and influenza season, Seasonal Influenza Vaccination Coverage Survey, Canada, 2017-2018 to 2019-2020.
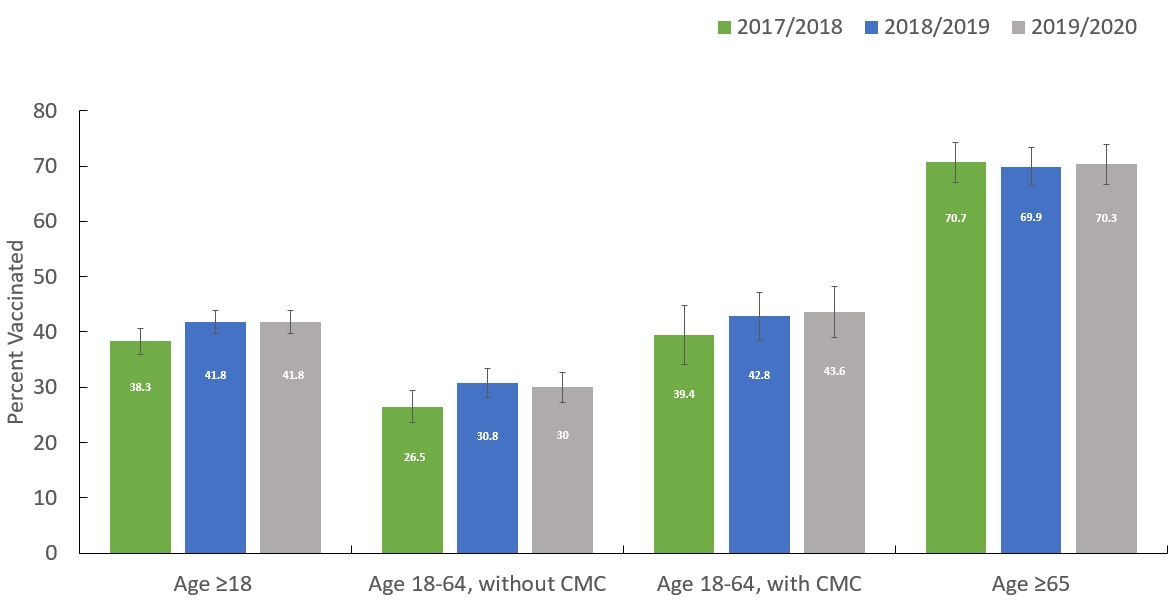
Figure 1.1: Text description
| Flu season | Percent vaccinated (%) |
|---|---|
| 2017-2018 | 38.3 |
| 2018-2019 | 41.8 |
| 2019-2020 | 41.8 |
| Flu season | Percent vaccinated (%) |
|---|---|
| 2017-2018 | 26.5 |
| 2018-2019 | 30.8 |
| 2019-2020 | 30 |
| Flu season | Percent vaccinated (%) |
|---|---|
| 2017-2018 | 39.4 |
| 2018-2019 | 42.8 |
| 2019-2020 | 43.6 |
| Flu season | Percent vaccinated (%) |
|---|---|
| 2017-2018 | 70.7 |
| 2018-2019 | 69.9 |
| 2019-2020 | 70.3 |
Consistent with the previous two seasons, the proportion of vaccinated respondents was highest among seniors aged 65 years and older (70%). In contrast, vaccine uptake was lower among those aged 18–64 years with CMC (44%) and lowest in those without CMC (30%).
2. Month and place of vaccination
Seasonal influenza activity in Canada is usually low in the late spring and summer, begins to increase over the fall, and peaks in the winter. Depending on the year, the peak can occur as early as fallFootnote 5. Vaccination early in the influenza season allows time for the development of antibodies against the influenza virus. During the 2019-2020 influenza campaign, among respondents who recalled the month they received their influenza vaccination (n=1310), the majority (81%) received the vaccine in October or November 2019. (Table 2.1)
| Month | Proportion vaccinated in this month, % (95% CI) |
|---|---|
| September 2019 | 4.3 (2.9-5.6) |
| October 2019 | 38.5 (35.4-41.6) |
| November 2019 | 42.4 (39.2-45.5) |
| December 2019 | 11.4(9.3-13.5) |
| January 2020 | 3.0 (1.9-4.1)Footnote ** |
| February 2020 | 0.5 (0.0-1.0)Footnote ** |
A total of 1310 respondents recalled the month of influenza vaccination. CI – Confidence interval.
|
|
Consistent with previous years, the most commonly reported places of vaccination among adults were pharmacies (40%) and doctor’s offices (28%) (Table 2.2). The proportion of respondents vaccinated in pharmacies in 2019-2020 was significantly higher than the 2016-2017 season (28%)Footnote 14. This may be due in part to the increasing number of jurisdictions allowing pharmacists to administer the influenza vaccine. It should be noted, however, that a proportion of the vaccines administered in pharmacies are given by nurses not pharmacists.
| Place of vaccination | Proportion vaccinated by place, % (95% CI) |
|---|---|
| Pharmacy | 40.0 (36.9-43.1) |
| Doctor’s office | 28.2 (25.3-31.1) |
| Workplace | 8.4 (6.5-10.2) |
| CLSC/Community Health Centre | 5.9 (4.5-7.3) |
| Hospital | 5.2 (3.6-6.9) |
| Temporary vaccine clinic (i.e. at the mall) | 4.2 (3.1-5.4) |
| Retirement residence | 1.2 (0.7-1.8)Footnote ** |
| Other | 6.8 (5.2-8.5) |
A total of 1,338 respondents recalled their place of influenza vaccination. CI – Confidence interval.
|
|
3. Reasons for vaccination
Among respondents who provided a reason for receiving the vaccine, the most commonly reported reason across all adults was that they wanted to prevent infection or avoid getting sick (47%). It was also the most common reason for having received the influenza vaccine among high-risk groups, including those aged 18–64 years with CMC (45%) and seniors (48%). (Table 3.1)
| Age group (years) | Reason | % (95%% CI) |
|---|---|---|
| All adults ≥18 (n=1338) |
1. To prevent infection/don't want to get sick | 46.9 (43.7-50.0) |
| 2. Receive it yearly (no specific reason) | 18.6 (16.2-20.9) | |
| 3. If I don’t, I can transmit to at-risk people (children, elderly or sick people/patients) | 10.6 (8.6-12.6) | |
| 18-64 without CMC (n=484) |
1. To prevent infection/don't want to get sick | 47.0 (41.6-52.3) |
| 2. If I don’t, I can transmit to at-risk people (children, elderly or sick people/patients) | 14.3 (10.5-18.1) | |
| 3. It is required in my workplace | 12.3 (9.0-15.7) | |
| 18-64 with CMC (n=312) |
1. To prevent infection/don't want to get sick | 44.7 (38.1-51.3) |
| 2. At risk because of health condition | 17.4 (12.5-22.3) | |
| 3. If I don’t, I can transmit to at-risk people (children, elderly or sick people/patients) | 12.7 (8.1-17.2) | |
| ≥65 (n=542) |
1. To prevent infection/don't want to get sick | 47.9 (43.2-52.6) |
| 2. Receive it yearly (no specific reason) | 31.6 (27.2-35.9) | |
| 3. At risk because of age | 11.1 (8.1-14.1) | |
n = number of respondents (unweighted). CMC – Chronic medical condition(s). CI – Confidence interval. Note: Respondents could provide more than one reason. |
||
Among adults aged 18-64 years with CMC, being at higher risk because of a chronic health condition was also a commonly reported reason for receiving the vaccine (17%), whereas for adults aged 18-64 years without CMC, avoid transmitting the disease to at-risk people (14%) and vaccination is required in workplace (12%) were frequently reported.
Additionally, the non-specific reason of receiving it yearly (32%) and being at risk because of age (11%) were also commonly stated for having received the influenza vaccine among seniors aged 65 years and older. This suggested that these vaccinated respondents have adopted yearly influenza vaccination as a preventive health practice, potentially recognizing their increased risk for influenza-related complicationsFootnote 15.
4. Reasons for non-vaccination
Among all survey respondents who provided a reason for not receiving the influenza vaccine this year, the most common answer among all adults was that they were healthy and/or never had the flu (21%). However, among those aged 18–64 years with CMC, not getting around to the vaccine was the most commonly provided response for not receiving the influenza vaccine (26%). Among seniors, concerns about vaccine safety was one of the common reasons for not receiving the influenza vaccine (13%). Some studies demonstrating lower effectiveness with increased safety concerns regarding influenza and other vaccines in the elderly, due to diminution in immune response, may have contributed towards this beliefFootnote 16Footnote 17. (Table 4.1)
| Age group (years) | Reason | % (95% CI) |
|---|---|---|
| All adults ≥18 (n=1672) |
1. I am healthy, and/or never get the flu | 21.3 (18.9-23.7) |
| 2. I did not get around to it | 15.0 (12.8-17.2) | |
| 3. No specific reason, just didn’t get it | 14.7 (12.6-16.7) | |
| 18-64 without CMC (n=1070) |
1. I am healthy, and/or never get the flu | 25.1 (21.9-28.3) |
| 2. No specific reason, just didn’t get it | 15.0 (12.4-17.6) | |
| 3. I did not get around to it | 11.9 (9.7-14.2) | |
| 18-64 with CMC (n=356) |
1. I did not get around to it | 25.5 (19.3-31.8) |
| 2. No specific reason, just didn’t get it | 13.6 (9.2-17.9) | |
| 3. I am healthy, and/or never get the flu | 13.3 (9.0-17.5) | |
| ≥65 (n=246) |
1. I am healthy, and/or never get the flu | 15.6 (10.7-20.6) |
| 2. No specific reason, just didn’t get it | 14.4 (9.5-19.3) | |
| 3. I have concerns about the flu vaccine, and/or its side effects | 13.2 (8.4-18.1)Footnote ** | |
n = number of respondents (unweighted). CMC – Chronic medical condition(s). CI – Confidence interval. Note: Respondents could provide more than one reason.
|
||
5. Knowledge, attitudes and beliefs (KAB) regarding vaccination
The 2019-2020 Seasonal Influenza Vaccination Coverage Survey included several questions collecting information about adults’ KAB regarding all vaccines in general and influenza vaccine only. The large majority of respondents (92%) strongly or somewhat agreed that vaccines are important for their health and about the same proportion thought that they know enough about vaccines to make a decision about getting vaccinated (91% strongly or somewhat agreed). (Table 5.1)
| Statements | n | Strongly agree % (95% CI) |
Somewhat agree % (95% CI) |
Somewhat disagree % (95% CI) |
Strongly disagree % (95% CI) |
|---|---|---|---|---|---|
| All vaccines in general: | |||||
| In general, I consider vaccines to be important for my health. | 3016 | 70.5 (68.6-72.5) | 21.2 (19.4-22.9) | 4.7 (3.8-5.7) | 3.5 (2.7-4.3) |
| I know enough about vaccines to make an informed decision about getting vaccinated. | 3005 | 61.5 (59.4-63.6) | 29.3 (27.4-31.3) | 6.2 (5.2-7.3) | 3.0 (2.2-3.7) |
| Influenza vaccine: | |||||
| The flu vaccine does not protect you against the flu. | 2938 | 16.4 (14.8-18.1) | 25.2 (23.3-27.1) | 26.9 (25.0-28.8) | 31.4 (29.4-33.5) |
| Sometimes you can get the flu from the flu vaccine. | 2885 | 17.5 (15.8-19.3) | 24.9 (23.0-26.8) | 21.4 (19.6-23.3) | 36.2 (34.1-38.2) |
| The flu vaccine is safe. | 2940 | 58.7 (56.6-60.9) | 29.8 (27.8-31.9) | 6.5 (5.5-7.6) | 4.9 (4.0-5.9) |
| I understand why the flu vaccine is recommended annually | 2984 | 67.3 (65.3-69.3) | 23.9 (22.0-25.8) | 5.4 (4.5-6.4) | 3.4 (2.6-4.1) |
| The opinion of my family doctor, general practitioner, or nurse practitioner is an important part of my decision when it comes to getting the flu vaccine. | 2951 | 42.1 (40.0-44.3) | 27.3 (25.3-29.3) | 15.3 (13.8-16.9) | 15.2 (13.7-16.8) |
n = number of respondents (unweighted). CI – Confidence interval. |
|||||
Regarding influenza vaccination only, a majority (89%) of respondents strongly or somewhat believed that the flu vaccine is safe; and 91% strongly or somewhat agreed that they understand why the flu vaccine is recommended annually. However, 16% of respondents strongly believed that the flu vaccine does not protect them against the flu. About the same proportion of respondents (18%) strongly believed that they might get the flu from the flu vaccine – which is not possible for any influenza vaccine licenced in Canada. (Table 5.1)
About seven in ten respondents (69%) strongly or somewhat agreed that the opinion of their family doctor, general practitioner or nurse practitioner is an important part of their decision for getting the flu vaccine. This outcome shows that there is public trust in health care professionals and suggests that the advice provided by a health care provider, and the frequency of interaction with the health care system, may play a large role in influencing influenza vaccine uptake.
6. Sources of information on influenza vaccination
The most common source of information that the respondents would consult to keep up to date about the influenza vaccine was their own family physician. About four in ten respondents aged 18-64 years with (38%) or without CMC (42%) would seek information on the Internet such as Google and health websites or blogs. Whereas for seniors aged 65 years and older, 25% of respondents would refer to a health professional such as doctor, nurse or pharmacist, and about one in five (21%) would seek vaccine information on the Internet. The least frequently reported source of information on the influenza vaccine was newspapers or magazines (2%). (Table 6.1)
| Response | 18-64 years without CMC | 18-64 years with CMC | 65 years and older | |||
|---|---|---|---|---|---|---|
| n | % (95% CI) | n | % (95% CI) | n | % (95% CI) | |
| Visiting your own family physician | 758 | 50.6 (47.6-53.5) | 350 | 53.0 (48.3-57.6) | 489 | 64.6 (61.0-68.3) |
| On the Internet - Google, websites or blogs about health | 675 | 42.2 (39.2-45.1) | 252 | 37.7 (33.1-42.2) | 175 | 20.7 (17.6-23.7) |
| Consult a health professional (doctor, nurse, pharmacist, etc.) | 362 | 22.8 (20.3-25.3) | 163 | 23.6 (19.6-27.5) | 214 | 25.4 (22.0-28.7) |
| Consulting brochures or pamphlets offered by Health Canada, Public Health Agency of Canada or the provincial/territorial ministry of health on the subject | 130 | 8.3 (6.6-10.1) | 48 | 6.1 (4.1-8.1)Footnote ** | 27 | 2.7 (1.6-3.9)Footnote ** |
| A CLSC/Community Health Centre | 95 | 6.4 (4.8-7.9) | 32 | 5.3 (3.0-7.6)Footnote ** | 36 | 3.8 (2.4-5.2)Footnote ** |
| A local pharmacy | 88 | 5.3 (3.9-6.6) | 46 | 6.3 (4.2-8.5)Footnote ** | 56 | 7.3 (5.2-9.3) |
| By consulting your family, friends or colleagues | 70 | 4.7 (3.4-6.0) | 22 | 3.3 (1.5-5.2)Footnote ** | 28 | 3.1 (1.8-4.3)Footnote ** |
| Through Info-Santé or Telehealth telephone lines, 811 | 74 | 4.2 (3.0-5.4) | 29 | 4.0 (2.2-5.8)Footnote ** | 11 | 1.0 (0.3-1.6)Footnote ** |
| The media (television, radio, etc.) | 64 | 4.2 (3.0-5.3) | 32 | 4.8 (2.8-6.8)Footnote ** | 61 | 7.1 (5.2-9.0) |
| Health Canada / Government websites | 70 | 4.1 (3.0-5.2) | 31 | 3.7 (2.0-5.3)Footnote ** | 6 | Footnote *** |
| On social media (Facebook, Twitter or other) | 49 | 3.3 (2.2-4.4)Footnote ** | 17 | 2.4 (1.0-3.9)Footnote ** | 18 | 2.2 (1.1-3.2)Footnote ** |
| Directly at the hospital - at the emergency | 33 | 2.3 (1.3-3.2)Footnote ** | 12 | 2.0 (0.4-3.5)Footnote ** | 4 | Footnote *** |
| Newspapers / magazines | 26 | 1.5 (0.8-2.2)Footnote ** | 12 | 1.9 (0.6-3.2)Footnote ** | 36 | 4.6 (3.0-6.2)Footnote ** |
| Another source | 174 | 11.4 (9.5-13.3) | 74 | 11.0 (7.9-14.1) | 59 | 6.4 (4.6-8.1) |
n = number of respondents (unweighted). CMC – Chronic medical condition(s). CI – Confidence interval. Note: Respondents could provide more than one source of information.
|
||||||
Whether adults get vaccinated against influenza due to consulting these sources of information is important for identifying potential effective communication strategies to promote influenza vaccination. Among adults who would consult their family physician (n=752) or other health professional (n=358), 45% of them received the influenza vaccine. After adjusting the age, gender and the level of education, seeking information on the influenza vaccine by visiting their family physician or other health professional was significantly associated with vaccine uptake. Moreover, respondents seeking information on government websites had twice the odds of reporting being vaccinated against influenza, compared with those that did not consult this source of information (aOR 2.0; 95% CI 1.3–3.0). However, the odds of receiving the influenza vaccine for respondents who would consult their friends or seek information through Telehealth were 0.5 times the odds of those who did not consult these sources of information (aOR 0.5; 95% Cl 0.3–0.8). (Table 6.2)
| Sources of information | n | Proportion of vaccinated adults % (95% CI) |
Unadjusted OR % (95% CI) |
AdjustedFootnote † OR % (95% CI) |
|---|---|---|---|---|
| Health Canada / Government websites. | 56 | 51.1 (39.3-62.8) | 1.6 (1.0-2.4) | 2.0 (1.3-3.0) |
| Visiting your own family physician. | 752 | 45.0 (42.1-47.9) | 1.4 (1.2-1.6) | 1.2 (1.1-1.5) |
| Consult a health professional (doctor, nurse, pharmacist, etc.). | 358 | 45.0 (40.7-49.3) | 1.3 (1.1-1.6) | 1.3 (1.1-1.5) |
| On the Internet - Google, websites or blogs about health. | 438 | 36.0 (32.6-39.4) | 0.8 (0.6-0.9) | 0.9 (0.8-1.1) |
| Newspapers / magazines. | 38 | 48.7 (35.6-61.8) | 1.3 (0.8-2.2) | 1.0 (0.6-1.6) |
| A local pharmacy. | 88 | 44.2 (35.8-52.6) | 1.5 (1.0-2.0) | 1.3 (0.9-1.8) |
| The media (television, radio, etc.). | 84 | 47.1 (38.0-56.3) | 1.3 (0.9-1.8) | 1.2 (0.8-1.7) |
| Consulting brochures or pamphlets offered by Health Canada, Public Health Agency of Canada or the provincial/territorial ministry of health on the subject. | 92 | 39.2 (31.1-47.2) | 1.1 (0.8-1.5) | 1.3 (1.0-1.8) |
| On social media (Facebook, Twitter or other). | 31 | 36.7 (24.3-49.1)Footnote ** | 1.1 (0.7-1.8) | 1.2 (0.8-2.0) |
| A CLSC/Community Health Centre. | 67 | 33.1 (24.5-41.6) | 0.9 (0.6-1.3) | 0.9 (0.6-1.3) |
| Directly at the hospital - at the emergency. | 17 | 32.9 (16.9-48.9)Footnote ** | 1.1 (0.6-2.0) | 1.3 (0.7-2.5) |
| By consulting your family, friends or colleagues. | 38 | 25.1 (16.3-33.9)Footnote ** | 0.5 (0.3-0.8) | 0.5 (0.3-0.8) |
| Through Info-Santé or Telehealth telephone lines, 811. | 29 | 22.2 (12.5-31.9)Footnote ** | 0.4 (0.2-0.7) | 0.5 (0.3-0.8) |
| Another source. | 140 | 41.0 (34.2-47.8) | 1.0 (0.8-1.2) | 1.1 (0.8-1.4) |
n = number of vaccinated respondents (unweighted) who would consult each source of information on influenza vaccine. CI – Confidence interval.
|
||||
The majority of respondents trusted the sources of information provided by health professionals such as nurses, doctors and pharmacists, their own family physician, and Health Canada or the Public Health Agency of Canada. Moreover, 73% of adults aged 18-64 years with or without CMC trusted vaccine information from telephone lines such as Telehealth, 811 and Info-santé; whereas 48% of senior respondents (aged 65 years and older) believed the information provided on these telephone lines. Less than half of the respondents believed the information read on the Internet (48% among adults 18-64 years without CMC, 44% among adults 18-64 years with CMC and 32% among seniors 65 years and older). Personal testimonies read on the web or social media was the least trusted source across all risk groups (16% among adults 18-64 years without CMC, 15% among adults 18-64 years with CMC and 11% among seniors 65 years and older). (Table 6.3)
| Response | 18-64 years without CMC | 18-64 years with CMC | 65 years and older | |||
|---|---|---|---|---|---|---|
| n | % (95% CI) | n | % (95% CI) | n | % (95% CI) | |
| Health professionals (nurses, doctors, pharmacists) | 1466 | 94.5 (93.1-95.9) | 638 | 94.7 (92.3-97.1) | 738 | 93.7 (91.7-95.7) |
| Your own family physician | 1438 | 94.1 (92.8-95.4) | 625 | 95.0 (92.9-97.1) | 744 | 96.7 (95.3-98.0) |
| Health Canada or Public Health Agency of Canada | 1412 | 91.2 (89.5-92.9) | 595 | 90.2 (87.3-93.0) | 623 | 80.1 (76.8-83.3) |
| Info-Santé telephone lines, Telehealth, 811 | 1067 | 72.8 (69.9-75.6) | 461 | 72.7 (68.2-77.2) | 337 | 47.6 (43.4-51.9) |
| Your family, friends or colleagues | 807 | 54.5 (51.5-57.4) | 302 | 48.7 (44.0-53.5) | 306 | 41.2 (37.2-45.1) |
| Internet (Google, websites or blogs about health) | 702 | 47.9 (44.9-51.0) | 286 | 44.3 (39.5-49.0) | 240 | 31.8 (28.0-35.5) |
| Alternative health practitioners such as chiropractors, naturopath and homeopath | 664 | 46.6 (43.6-49.7) | 243 | 40.0 (35.2-44.7) | 191 | 26.4 (22.8-29.9) |
| Personal testimonies read on the web or social media | 225 | 15.7 (13.4-17.9) | 87 | 14.5 (11.1-17.9) | 81 | 11.0 (8.5-13.5) |
n = number of respondents (unweighted). CMC – Chronic medical condition(s). CI – Confidence interval. Note: Respondents could provide more than one source of information. |
||||||
In total, about one quarter of respondents (25%) reported that they had seen or read something regarding the influenza vaccine on the Internet or social media lately. Furthermore, 19% of them stated that they had encountered the information on the reason to get vaccinated against influenza. 17% of respondents had seen or read about the benefits of getting vaccinated as well as the risks associated with vaccination. About 14% of respondents had read about the reasons for not getting vaccinated against influenza. About the same proportion of respondents had read information related to vaccination advertising campaigns (13%) and only 5% had seen information related to places to get vaccination. (Table 6.4)
| Response | % (95% CI) |
|---|---|
| Reasons to get vaccinated | 19.2 (16.1-22.4) |
| The benefits of getting vaccinated | 16.7 (13.6-19.8) |
| Risks associated with vaccination | 16.6 (13.2-20.0) |
| Reasons for not getting vaccinated | 13.6 (10.6-16.5) |
| Advertising campaigns on vaccination | 13.1 (10.1-16.1) |
| Places to get vaccinated | 5.4 (3.3-7.5)Footnote ** |
| Other | 45.7 (41.4-50.1) |
A total of 730 respondents reported having seen or read information about the influenza vaccine on the Internet or social media lately. CI – Confidence interval. Note: Respondents could provide more than one type of information read on the Internet or social media.
|
|
The majority of respondents (78%) stated that their opinion about the influenza vaccine has not changed after reading the information on the Internet or on social media. Only about 12% of respondents trusted the vaccine much more or somewhat more than before, and 9% were more or much more concerned about getting the flu vaccine. (Table 6.5)
| Response | % (95% CI) |
|---|---|
| You trust the flu vaccine much more than before | 6.7 (4.2-9.2)Footnote ** |
| You trust the flu vaccine somewhat more than before. | 5.5 (3.6-7.5)Footnote ** |
| Your opinion of the flu vaccine has not changed | 78.4 (74.7-82.2) |
| You are more concerned about the flu vaccine than before | 4.0 (2.3-5.7)Footnote ** |
| You are much more concerned about the flu vaccine than before | 5.3 (3.2-7.4)Footnote ** |
A total of 730 respondents reported having seen or read information about the influenza vaccine on the Internet or social media lately. CI – Confidence interval.
|
|
According to the results shown in table 6.5, it seems that the influenza vaccine related messages on social media has slight impact on respondents’ views about the influenza vaccine. This finding is consistent with a recent survey conducted in the United States where they found that only consulting social media may not influence individual vaccination behavioursFootnote 18. Another study has also shown that the general population might chose sites that generally agree with their views. As a result, attitudes and beliefs towards influenza vaccination were not greatly influenced by social mediaFootnote 19.
Strengths and limitations
The major strength of this survey was the timely reporting of seasonal influenza vaccination coverage across Canada. The timeliness of this survey allows Canada to meet its international reporting obligations and help identify priorities for future vaccination program planning and promotion campaigns.
Additionally, the Seasonal Influenza Vaccination Coverage Survey is flexible in allowing question modules to be added or removed on an annual basis in light of changing priorities.
Though consistent with previous iterations of the surveyFootnote 12Footnote 13, limitations of the present survey included the relatively low response rate of 17%, below the 45% achieved by similar surveys in the USAFootnote 20. This response rate can potentially increase the risk of non-response bias and limits the representativeness of the sample, as respondents included in the survey may differ from those who chose not to complete the survey.
Furthermore, participants were interviewed within six months of the beginning of the seasonal influenza vaccination campaign, which limits the potential for recall bias and may lead to an under or over-estimation of vaccine uptake. However, some studies have shown that self-reported influenza vaccination status is a valid measure of vaccine exposure when medical records or registry data are not availableFootnote 21Footnote 22.
It is also important to consider that respondents could interpret the provided choices of sources of information on influenza vaccine differently. For instance, of two respondents browsing the Twitter feed of one organization, one may list Twitter as a source of information whereas the other one may list the name of the organization. Moreover, for those who consulted information on the Internet and social media, the information could had been shared from other sources such as government websites, electronic brochures, etc.
Conclusion
Adult influenza vaccination coverage estimated from the 2019-2020 Seasonal Influenza Vaccination Coverage Survey has remained similar to previous influenza seasons. Moreover, the national vaccination coverage goals (80%) for those who are at increased risk for influenza-related complications, namely seniors and adults 18–64 years of age with CMC, remain unmet. According to the results of this survey, vaccine uptake was well below the national goal among adults 18–64 years with CMC (44%). However, vaccine uptake among seniors 65 years of age and older (70%) is approaching the coverage goal of 80%. The most common reported reasons for vaccination was to prevent infection or to avoid getting sick, whereas the most common reason for non-vaccination was the perception that they were healthy or never had flu.
According to the findings of the survey, the most commonly reported sources of information about influenza vaccine were family physicians and health professionals such as doctors, nurses or pharmacists. Previous studies have found that receiving a recommendation from a health care provider to get the influenza vaccine to be a significant factor associated with vaccine uptake in adultsFootnote 23Footnote 24. Thus, primary health care providers play a key role in driving vaccine acceptance, dispelling the vaccine-related myths and encouraging vaccination uptake.
Overall, this report highlighted the need for increasing influenza vaccine uptake in Canada as a whole, and among its high-risk populations. Promotional messaging on the Internet or social media for the influenza vaccine remains an important strategy in increasing knowledge regarding the benefits of influenza vaccination in addition to encouraging greater vaccination uptake.
References
- Footnote 1
-
Public Health Agency of Canada. Flu (influenza): For health professionals. 2019; Available at: https://www.canada.ca/en/public-health/services/diseases/flu-influenza/health-professionals.html#a8.
- Footnote 2
-
Arriola C, Garg S, Anderson EJ, Ryan PA, George A, Zansky SM, Bennett N, Reingold A, Bargsten M, Miller L, Yousey-Hindes K. Influenza vaccination modifies disease severity among community-dwelling adults hospitalized with influenza. Clinical Infectious Diseases. 2017.15;65(8):1289-97.
- Footnote 3
-
Castilla J, Godoy P, Domínguez Á, Martínez-Baz I, Astray J, Martín V, Delgado-Rodríguez M, Baricot M, Soldevila N, Mayoral JM, Quintana JM. Influenza vaccine effectiveness in preventing outpatient, inpatient, and severe cases of laboratory-confirmed influenza. Clinical infectious diseases. 2013. 15;57(2):167-75.
- Footnote 4
-
Petrova VN RC. The evolution of seasonal influenza viruses. Nature Reviews Microbiology 2017.16:47.
- Footnote 5
-
National Advisory Committee on Immunization (NACI). Canadian Immunization Guide Chapter on Influenza and Statement on Seasonal Influenza Vaccine for 2019–2020. An Advisory Committee Statement (ACS) National Advisory Committee on Immunization (NACI). 2019; Available at: https://www.canada.ca/en/public-health/services/publications/vaccines-immunization/canadian-immunization-guide-statement-seasonal-influenza-vaccine-2019-2020.html.
- Footnote 6
-
World Health Organization. WHA56.19: Prevention and control of influenza pandemics and annual epidemics. 2003; Available at: https://www.who.int/immunization/sage/1_WHA56_19_Prevention_and_control_of_influenza_pandemics.pdf.
- Footnote 7
-
Public Health Agency of Canada. Vaccination Coverage Goals and Vaccine Preventable Disease Reduction Targets by 2025. 2019; Available at: https://www.canada.ca/en/public-health/services/immunization-vaccine-priorities/national-immunization-strategy/vaccination-coverage-goals-vaccine-preventable-diseases-reduction-targets-2025.html.
- Footnote 8
-
Nowak GJ, Sheedy K, Bursey K, Smith TM, Basket M. Promoting influenza vaccination: Insights from a qualitative meta-analysis of 14 years of influenza-related communications research by U.S. Centers for Disease Control and Prevention (CDC). Vaccine. 2015. 33(24):2741–2756.
- Footnote 9
-
Léger. Seasonal Influenza Vaccination Coverage Survey, 2019–2020. 2020.
- Footnote 10
-
Roy M, Sherrard L, Dubé È, Gilbert NL. Determinants of non-vaccination against seasonal influenza. Health Reports. 2018;29:13–23.
- Footnote 11
-
Farmanara N, Sherrard L, Dubé È, Gilbert NL. Determinants of non-vaccination against seasonal influenza in Canadian adults: findings from the 2015–2016 Influenza Immunization Coverage Survey. Canadian Journal of Public Health. 2018;109(3):369-78.
- Footnote 12
-
Public Health Agency of Canada. Vaccine uptake in Canadian Adults 2019. 2019; Available at: https://www.canada.ca/en/public-health/services/publications/healthy-living/2018-2019-influenza-flu-vaccine-coverage-survey-results.html.
- Footnote 13
-
Public Health Agency of Canada. 2017/18 Seasonal Influenza Vaccine Coverage in Canada. 2019; Available at: http://publications.gc.ca/collections/collection_2019/aspc-phac/HP40-198-2018-eng.pdf.
- Footnote 14
-
Public Health Agency of Canada. 2016/17 Seasonal Influenza Vaccine Coverage in Canada. 2018; Available at: http://publications.gc.ca/collections/collection_2018/aspc-phac/HP40-198-2017-eng.pdf.
- Footnote 15
-
World Health Organization. Barriers of influenza vaccination intention and behavior—A systematic review of influenza vaccine hesitancy 2005–2016. 2016:10.
- Footnote 16
-
Schmid P, Rauber D, Betsch C, Lidolt G, Denker M. Barriers of influenza vaccination intention and behavior—A systematic review of influenza vaccine hesitancy, 2005–2016. PloS one 2017; 12(1):e0170550.
- Footnote 17
-
Amanna IJ. Balancing the Efficacy and Safety of Vaccines in the Elderly. Open Longevity Science. 2012;6(2012):64.
- Footnote 18
-
Ahmed N, Quinn SC, Hancock GR, Freimuth VS, Jamison A. Social media use and influenza vaccine uptake among White and African American adults. Vaccine. 2018 Nov 26;36(49):7556-61.
- Footnote 19
-
Giese H, Neth H, Moussaïd M, Betsch C, Gaissmaier W. The echo in flu-vaccination echo chambers: Selective attention trumps social influence. Vaccine. 2020;38(8):2070-6.
- Footnote 20
-
Centers for Disease Control and Prevention. The Behavioral Risk Factor Surveillance System 2017: Summary Data Quality Report. 2018; Available at: https://www.cdc.gov/brfss/annual_data/2017/pdf/2017-sdqr-508.pdf.
- Footnote 21
-
King JP, McLean HQ, Belongia EA. Validation of self-reported influenza vaccination in the current and prior season. Influenza Other Respi Viruses 2018 07/20; 2018/08;0(0).
- Footnote 22
-
Laurence A, Lewis P, Gately C, Dixon A. Influenza and pneumococcal vaccination: do older people know if they have been vaccinated?. Aust N Z J Public Health 2016;40(3):279-280.
- Footnote 23
-
Jasek JP. Having a primary care provider and receipt of recommended preventive care among men in New York City. American journal of men’s health, 2011; 5(3), 225-235.
- Footnote 24
-
Nichol, K. L., Mac Donald, R., & Hauge, M. Factors associated with influenza and pneumococcal vaccination behavior among high-risk adults. Journal of General Internal Medicine, 1996;11(11), 673-677.