
FluWatch report: November 7 to November 13, 2021 (week 45)
Download in PDF format
(1.8 MB, 8 pages)
Organization: Public Health Agency of Canada
Published: 2021-11-19
Related Topics
Weekly Highlights
- In week 45, influenza activity across Canada was low with 85% of regions reporting no influenza activity. In the past week, all influenza indicators were at low interseasonal levels.
Virologic
- In week 45, a total of 22 influenza detections (12 influenza A and 10 influenza B) were reported.
- Among the 12 detections with detailed age information, all were individuals under the age of 44 years.
Syndromic
- The percentage visits for influenza-like illness (ILI) was 2.15% in week 45.
- The percentage of FluWatchers reporting fever and cough was 0.55% in week 45; it remains below expected levels and is stable.
Outbreaks
- In week 45, no outbreaks were reported.
- From August 29 to November 13, 2021 (weeks 35 to 45), 11 ILI outbreaks and no laboratory-confirmed influenza outbreaks have been reported.
Severe Outcomes
- From August 29 to November 13, 2021 (weeks 35 to 45), no influenza-associated hospitalizations have been reported from participating provinces and territories.
On this page
- Influenza/Influenza-like Illness Activity - Geographic Spread
- Laboratory-Confirmed Influenza Detections
- Syndromic / Influenza-like Illness Surveillance
- Influenza Outbreak Surveillance
- Influenza Severe Outcomes Surveillance
- Influenza Strain Characterization
- Antiviral Resistance
- Influenza Vaccine Monitoring
- Provincial and International Influenza Reports
Influenza/Influenza-like Illness Activity - Geographic Spread
In week 45, eight regions in four provinces (B.C., Alta., Ont., and Que.) reported sporadic influenza/ILI activity. All other surveillance regions reported no influenza/ILI activity (Figure 1).
Number of Regions Reporting in Week 45: 53 out of 53
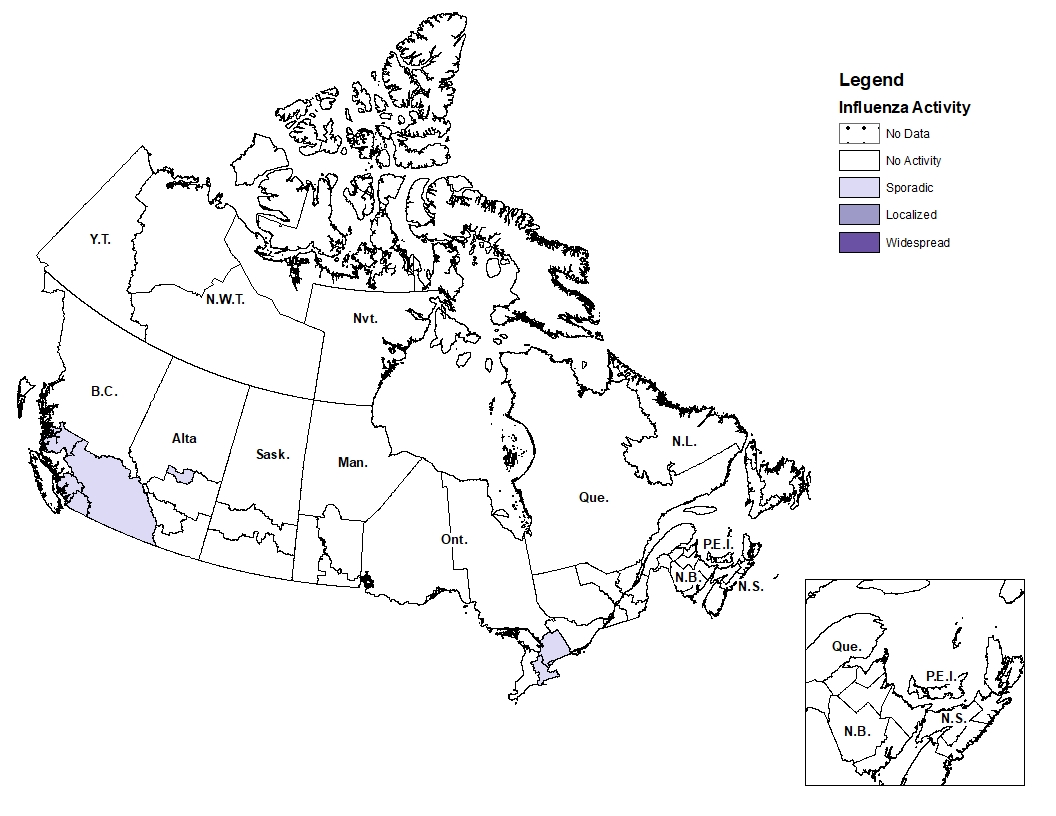
Figure 1 - Text description
| Province | Influenza Surveillance Region | Activity Level |
|---|---|---|
| N.L. | Eastern | No Activity |
| N.L. | Labrador-Grenfell | No Activity |
| N.L. | Central | No Activity |
| N.L. | Western | No Activity |
| P.E.I. | Prince Edward Island | No Activity |
| N.S. | Zone 1 - Western | No Activity |
| N.S. | Zone 2 - Northern | No Activity |
| N.S. | Zone 3 - Eastern | No Activity |
| N.S. | Zone 4 - Central | No Activity |
| N.B. | Region 1 | No Activity |
| N.B. | Region 2 | No Activity |
| N.B. | Region 3 | No Activity |
| N.B. | Region 4 | No Activity |
| N.B. | Region 5 | No Activity |
| N.B. | Region 6 | No Activity |
| N.B. | Region 7 | No Activity |
| Que. | Nord-est | No Activity |
| Que. | Québec et Chaudieres-Appalaches | No Activity |
| Que. | Centre-du-Québec | No Activity |
| Que. | Montréal et Laval | Sporadic |
| Que. | Ouest-du-Québec | No Activity |
| Que. | Montérégie | No Activity |
| Ont. | Central East | Sporadic |
| Ont. | Central West | Sporadic |
| Ont. | Eastern | No Activity |
| Ont. | North East | No Activity |
| Ont. | North West | No Activity |
| Ont. | South West | No Activity |
| Ont. | Toronto | Sporadic |
| Man. | Northern Regional | No Activity |
| Man. | Prairie Mountain | No Activity |
| Man. | Interlake-Eastern | No Activity |
| Man. | Winnipeg | No Activity |
| Man. | Southern Health | No Activity |
| Sask. | North | No Activity |
| Sask. | Central | No Activity |
| Sask. | South | No Activity |
| Alta. | North Zone | No Activity |
| Alta. | Edmonton | Sporadic |
| Alta. | Central Zone | No Activity |
| Alta. | Calgary | No Activity |
| Alta. | South Zone | No Activity |
| B.C. | Interior | Sporadic |
| B.C. | Fraser | Sporadic |
| B.C. | Vancouver Coastal | Sporadic |
| B.C. | Vancouver Island | No Activity |
| B.C. | Northern | No Activity |
| Y.T. | Yukon | No Activity |
| N.W.T. | North | No Activity |
| N.W.T. | South | No Activity |
| Nvt. | Qikiqtaaluk | No Activity |
| Nvt. | Kivalliq | No Activity |
| Nvt. | Kitimeot | No Activity |
Laboratory-Confirmed Influenza Detections
In week 45, 22 laboratory detections of influenza were reported (12 influenza A and 10 influenza B). An additional 14 influenza detections were known to be associated with recent live attenuated influenza vaccine (LAIV) receipt and were excluded from the data as they do not represent community transmission of seasonal influenza viruses. LAIV strains are attenuated but can be recovered by nasal swab in children and adults following vaccination with that product (i.e., "shedding"). For more information, refer to the Canadian Immunization Guide Chapter on Influenza and Statement on Seasonal Influenza Vaccine for 2021–2022 (Section IV.2).
Overall, the percentage of laboratory tests positive for influenza remains at exceptionally low levels, despite the elevated levels of testing. In week 45, 16,630 tests for influenza were performed at reporting laboratories and the percentage of tests positive for influenza was 0.13%. Compared to the past six pre-pandemic seasons (2014-2015 to 2019-2020), an average of 4,508 tests were performed for this time period, with an average of 4.6% of tests positive for influenza (Figure 3).
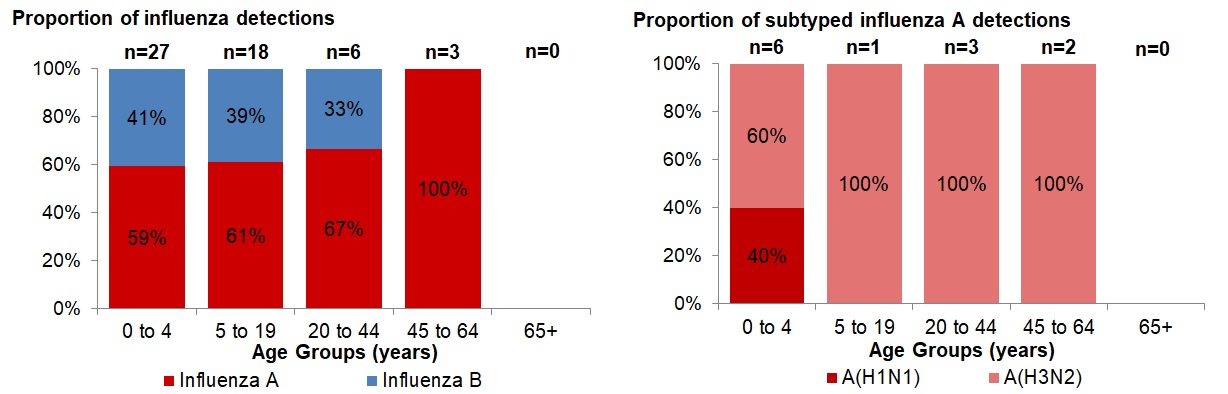
To date this season (August 28 to November 13, 2021), 89 influenza detections (50 influenza A and 39 influenza B) have been reported, which is lower than what we have seen historically in the past six pre-pandemic seasons, where an average of 818 influenza detections were reported at this point in the season. Excluded from these 89 influenza detections were 16 detections known to be associated LAIV receipt as they do not represent community transmission of seasonal influenza viruses, and 22 were suspected to be associated with recent LAIV receipt but were retained pending confirmation. Among subtyped influenza A detections (12), influenza A(H3N2) accounted for 83% of detections.
Detailed information on age and type/subtype has been received for 54 laboratory-confirmed influenza detections. Among the 54 detections, all were in individuals under the age of 65 (Figure 4).
Testing for influenza and other respiratory viruses has been influenced by the current COVID-19 pandemic. Changes in laboratory testing practices may affect the comparability of data to previous weeks or previous seasons.
For more detailed weekly and cumulative influenza data, see the text descriptions for Figures 2 and 3 or the Respiratory Virus Detections in Canada Report.
Number of Laboratories Reporting in Week 45: 31 out of 34
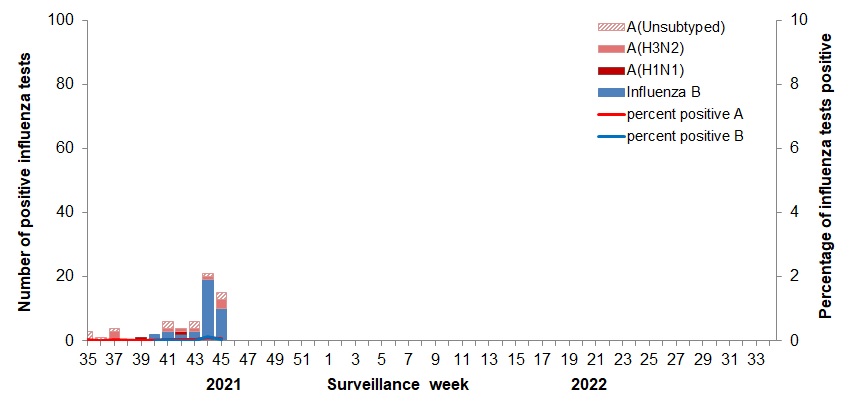
For one province, only data from subtyped influenza A specimens are included in the weekly number of positive influenza tests in Figure 2. The number of positive tests reported in Figure 2 may not equal the total number of positive tests in the report body text.
Influenza detections known to be associated with recent LAIV receipt (N=16) are excluded from Figure 2 as they do not represent community transmission of seasonal influenza viruses.
Figure 2 - Text description
| Surveillance Week | A(Unsubtyped) | A(H3N2) | A(H1N1) | Influenza B | Percent Positive A | Percent Positive B |
|---|---|---|---|---|---|---|
| 35 | 3 | 0 | 0 | 0 | 0.0 | 0.0 |
| 36 | 1 | 0 | 0 | 0 | 0.0 | 0.0 |
| 37 | 1 | 3 | 0 | 0 | 0.0 | 0.0 |
| 38 | 0 | 0 | 0 | 0 | 0.0 | 0.0 |
| 39 | 0 | 0 | 1 | 0 | 0.0 | 0.0 |
| 40 | 0 | 0 | 0 | 2 | 0.0 | 0.0 |
| 41 | 2 | 1 | 0 | 3 | 0.0 | 0.0 |
| 42 | 1 | 1 | 1 | 2 | 0.0 | 0.0 |
| 43 | 2 | 1 | 0 | 3 | 0.0 | 0.0 |
| 44 | 1 | 1 | 0 | 19 | 0.1 | 0.1 |
| 45 | 0 | 0 | 0 | 0 | 0.0 | 0.0 |
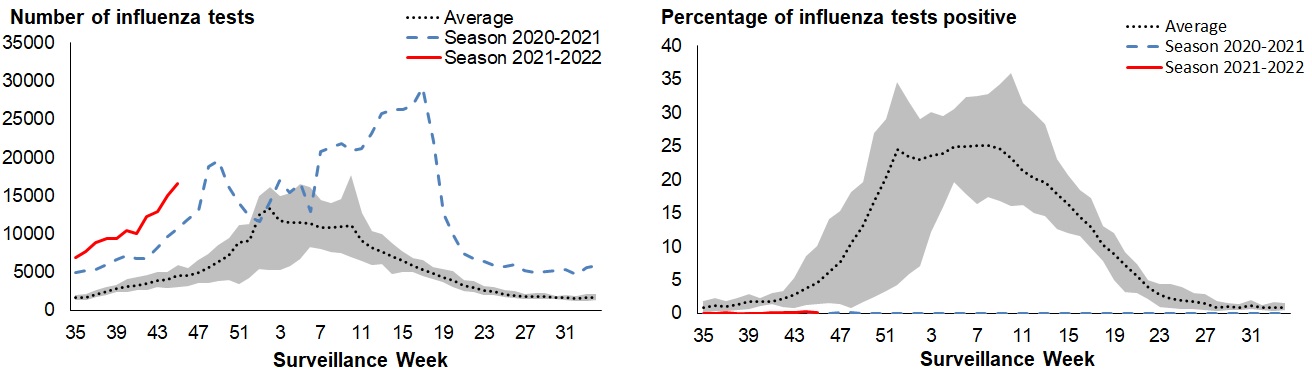
The shaded area represents the maximum and minimum number of influenza tests or percentage of tests positive reported by week from seasons 2014-2015 to 2019-2020. Data from week 11 of the 2019-2020 season onwards are excluded from the historical comparison due to the COVID-19 pandemic.
Figure 3 - Text description
| Surveillance Week | Number of Tests, 2021-2022 | Number of Tests, 2020-2021 | Maximum Number of Tests | Minimum Number of Tests | Average Number of Tests |
|---|---|---|---|---|---|
| 35 | 6896 | 4996 | 1979 | 1311 | 1705 |
| 36 | 7686 | 5192 | 2208 | 1323 | 1707 |
| 37 | 8903 | 5335 | 2631 | 1778 | 2135 |
| 38 | 9353 | 6024 | 3039 | 1987 | 2502 |
| 39 | 9370 | 6707 | 3356 | 2365 | 2859 |
| 40 | 10493 | 7127 | 4078 | 2443 | 3134 |
| 41 | 10079 | 6817 | 4339 | 2673 | 3240 |
| 42 | 12275 | 6755 | 4649 | 2648 | 3526 |
| 43 | 12908 | 8227 | 4996 | 3084 | 3862 |
| 44 | 14810 | 9615 | 4966 | 2994 | 4020 |
| 45 | 16630 | 10748 | 5912 | 3117 | 4508 |
| 46 | N/A | 11955 | 5589 | 3176 | 4564 |
| 47 | N/A | 13103 | 6541 | 3587 | 5018 |
| 48 | N/A | 18762 | 7416 | 3569 | 5645 |
| 49 | N/A | 19649 | 8559 | 3836 | 6377 |
| 50 | N/A | 16189 | 9464 | 4017 | 7155 |
| 51 | N/A | 14059 | 11142 | 3487 | 8822 |
| 52 | N/A | 12290 | 11338 | 4272 | 9184 |
| 1 | N/A | 11681 | 14932 | 5371 | 12552 |
| 2 | N/A | 14097 | 16104 | 5315 | 13289 |
| 3 | N/A | 17002 | 15001 | 5270 | 11820 |
| 4 | N/A | 15391 | 15414 | 5873 | 11441 |
| 5 | N/A | 16607 | 16595 | 6739 | 11456 |
| 6 | N/A | 12949 | 16121 | 8324 | 11339 |
| 7 | N/A | 20727 | 14443 | 8074 | 10842 |
| 8 | N/A | 21290 | 14024 | 7606 | 10865 |
| 9 | N/A | 21891 | 14520 | 7507 | 10956 |
| 10 | N/A | 20896 | 17681 | 7005 | 11084 |
| 11 | N/A | 21220 | 12714 | 6435 | 9175 |
| 12 | N/A | 23087 | 10431 | 5976 | 8238 |
| 13 | N/A | 25811 | 9989 | 6063 | 7699 |
| 14 | N/A | 26303 | 8830 | 4773 | 7046 |
| 15 | N/A | 26284 | 7836 | 5090 | 6527 |
| 16 | N/A | 26792 | 6826 | 5000 | 5890 |
| 17 | N/A | 29154 | 6603 | 4440 | 5305 |
| 18 | N/A | 22152 | 5640 | 4143 | 4780 |
| 19 | N/A | 12725 | 5480 | 3680 | 4311 |
| 20 | N/A | 9738 | 5097 | 3046 | 3862 |
| 21 | N/A | 7442 | 4001 | 2577 | 3197 |
| 22 | N/A | 6765 | 3790 | 2424 | 2944 |
| 23 | N/A | 6341 | 3257 | 1969 | 2591 |
| 24 | N/A | 5942 | 3120 | 2034 | 2449 |
| 25 | N/A | 5774 | 2659 | 1731 | 2148 |
| 26 | N/A | 5972 | 2600 | 1573 | 1988 |
| 27 | N/A | 5213 | 2163 | 1554 | 1833 |
| 28 | N/A | 4900 | 2223 | 1451 | 1857 |
| 29 | N/A | 5122 | 2256 | 1436 | 1796 |
| 30 | N/A | 5275 | 1950 | 1463 | 1664 |
| 31 | N/A | 5398 | 2022 | 1386 | 1671 |
| 32 | N/A | 4692 | 1928 | 1269 | 1574 |
| 33 | N/A | 5616 | 2089 | 1251 | 1671 |
| 34 | N/A | 5851 | 2098 | 1374 | 1698 |
| Surveillance Week | Percentage of tests positive, 2021-2022 | Percentage of tests positive, 2020-2021 | Maximum Percentage of Tests Positive | Minimum Percentage of Tests Positive | Average Percentage of Tests Positive |
|---|---|---|---|---|---|
| 35 | 0.04 | 0.02 | 1.87 | 0.11 | 0.82 |
| 36 | 0.01 | 0.00 | 2.28 | 0.30 | 1.13 |
| 37 | 0.04 | 0.00 | 1.78 | 0.40 | 0.99 |
| 38 | 0.00 | 0.02 | 2.35 | 0.55 | 1.30 |
| 39 | 0.01 | 0.00 | 2.95 | 0.67 | 1.71 |
| 40 | 0.02 | 0.00 | 2.33 | 1.08 | 1.70 |
| 41 | 0.06 | 0.01 | 3.02 | 1.32 | 1.72 |
| 42 | 0.05 | 0.00 | 3.40 | 0.87 | 2.18 |
| 43 | 0.05 | 0.01 | 5.32 | 0.84 | 2.83 |
| 44 | 0.25 | 0.07 | 8.55 | 1.20 | 3.70 |
| 45 | 0.13 | 0.04 | 10.10 | 1.39 | 4.63 |
| 46 | N/A | 0.03 | 14.11 | 1.51 | 6.05 |
| 47 | N/A | 0.07 | 15.36 | 1.44 | 7.71 |
| 48 | N/A | 0.05 | 18.20 | 0.84 | 10.61 |
| 49 | N/A | 0.04 | 19.71 | 1.64 | 13.01 |
| 50 | N/A | 0.01 | 27.02 | 2.36 | 16.82 |
| 51 | N/A | 0.01 | 29.09 | 3.30 | 20.11 |
| 52 | N/A | 0.00 | 34.54 | 4.28 | 24.48 |
| 1 | N/A | 0.00 | 31.66 | 5.85 | 23.41 |
| 2 | N/A | 0.00 | 29.10 | 7.06 | 23.01 |
| 3 | N/A | 0.01 | 30.07 | 12.24 | 23.63 |
| 4 | N/A | 0.00 | 29.45 | 15.89 | 23.96 |
| 5 | N/A | 0.00 | 30.62 | 19.60 | 24.90 |
| 6 | N/A | 0.02 | 32.39 | 17.89 | 25.00 |
| 7 | N/A | 0.01 | 32.51 | 16.28 | 25.05 |
| 8 | N/A | 0.00 | 32.87 | 17.45 | 25.14 |
| 9 | N/A | 0.00 | 34.28 | 16.80 | 24.59 |
| 10 | N/A | 0.00 | 35.99 | 16.05 | 23.22 |
| 11 | N/A | 0.01 | 31.41 | 16.19 | 21.41 |
| 12 | N/A | 0.00 | 30.03 | 15.03 | 20.10 |
| 13 | N/A | 0.00 | 28.25 | 14.50 | 19.56 |
| 14 | N/A | 0.00 | 23.16 | 12.66 | 17.86 |
| 15 | N/A | 0.01 | 20.73 | 11.95 | 16.27 |
| 16 | N/A | 0.00 | 18.52 | 11.64 | 14.48 |
| 17 | N/A | 0.00 | 17.30 | 9.76 | 12.83 |
| 18 | N/A | 0.00 | 13.02 | 7.88 | 10.26 |
| 19 | N/A | 0.00 | 11.95 | 4.96 | 8.98 |
| 20 | N/A | 0.01 | 9.13 | 3.19 | 7.22 |
| 21 | N/A | 0.01 | 7.45 | 2.97 | 5.60 |
| 22 | N/A | 0.00 | 4.96 | 2.19 | 3.86 |
| 23 | N/A | 0.00 | 4.39 | 0.87 | 2.86 |
| 24 | N/A | 0.02 | 4.36 | 0.81 | 2.25 |
| 25 | N/A | 0.00 | 3.95 | 0.63 | 1.88 |
| 26 | N/A | 0.00 | 3.08 | 0.69 | 1.81 |
| 27 | N/A | 0.00 | 2.83 | 0.42 | 1.48 |
| 28 | N/A | 0.00 | 1.84 | 0.41 | 0.91 |
| 29 | N/A | 0.00 | 1.55 | 0.47 | 1.09 |
| 30 | N/A | 0.04 | 1.46 | 0.46 | 0.90 |
| 31 | N/A | 0.00 | 1.93 | 0.58 | 1.11 |
| 32 | N/A | 0.00 | 1.19 | 0.52 | 0.92 |
| 33 | N/A | 0.00 | 1.69 | 0.40 | 0.85 |
| 34 | N/A | 0.02 | 1.57 | 0.42 | 0.92 |
The shaded area represents the maximum and minimum percentage of visits for ILI reported by week from seasons 2014-2015 to 2019-2020. Data from week 11 of the 2019-2020 season onwards are excluded from the historical comparison due to the COVID-19 pandemic.
Figure 4 - Text description
| Age Group | Proportion of Influenza A | Proportion of Influenza B | Total Number Influenza Detections |
|---|---|---|---|
| 0 to 4 | 59,3% | 40,7% | 16 |
| 5 to 19 | 61,1% | 38,9% | 11 |
| 20 to 44 | 66,7% | 33,3% | 4 |
| 45 to 64 | 100,0% | 0,0% | 3 |
| 65+ | 0,0% | 0,0% | 0 |
| Age Group | Proportion of A(H1N1) | Proportion of A(H3N2) | Total Number of Subtyped Influenza Detections |
|---|---|---|---|
| 0 to 4 | 40,0% | 60,0% | 6 |
| 5 to 19 | 0,0% | 100,0% | 1 |
| 20 to 44 | 0,0% | 100,0% | 3 |
| 45 to 64 | 0,0% | 100,0% | 2 |
| 65+ | 0,0% | 0,0% | 0 |
Syndromic / Influenza-like Illness Surveillance
Healthcare Practitioners Sentinel Surveillance
In week 45, 2.15% of visits to healthcare professionals were due to influenza-like illness (ILI). The sharp increase this week may be due to low number of sentinels reporting.
This indicator should be interpreted with caution as there have been changes in healthcare seeking behavior of individuals and a smaller number of sentinels reporting compared to previous seasons.
Number of Sentinels Reporting in Week 45: 21
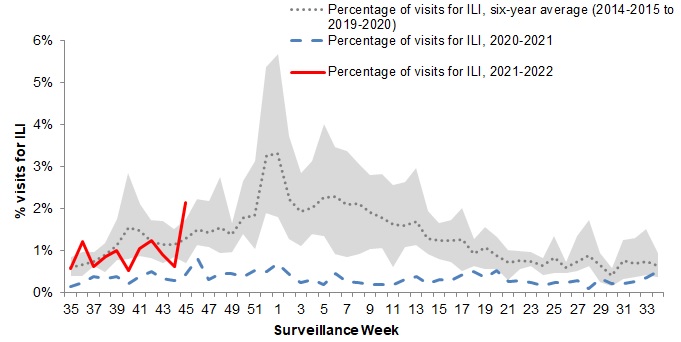
The shaded area represents the maximum and minimum percentage of percentage of participants reporting cough and fever by week, from seasons 2014-2015 to 2019-2020. Data from week 11 of the 2019-2020 season onwards are excluded from the historical comparison due to the COVID-19 pandemic
Figure 5 - Text description
| Surveillance Week | 2021-2022 | 2020-2021 | Average | Min | Max |
|---|---|---|---|---|---|
| 35 | 0.6% | 0.1% | 0.6% | 0.4% | 0.9% |
| 36 | 1.2% | 0.2% | 0.6% | 0.4% | 0.9% |
| 37 | 0.6% | 0.4% | 0.7% | 0.5% | 1.0% |
| 38 | 0.9% | 0.3% | 0.7% | 0.6% | 1.0% |
| 39 | 1.0% | 0.4% | 0.9% | 0.5% | 1.2% |
| 40 | 0.5% | 0.2% | 1.2% | 0.8% | 1.7% |
| 41 | 1.1% | 0.4% | 1.7% | 0.8% | 2.8% |
| 42 | 1.2% | 0.5% | 1.6% | 1.2% | 2.1% |
| 43 | 0.9% | 0.3% | 1.2% | 0.8% | 1.7% |
| 44 | 0.6% | 0.3% | 1.2% | 0.7% | 1.7% |
| 45 | 2.2% | 0.4% | 1.2% | 0.9% | 1.5% |
| 46 | N/A | 0.8% | 1.4% | 1.2% | 1.8% |
| 47 | N/A | 0.3% | 1.6% | 1.1% | 2.2% |
| 48 | N/A | 0.5% | 1.5% | 1.1% | 2.2% |
| 49 | N/A | 0.5% | 1.7% | 1.0% | 2.8% |
| 50 | N/A | 0.4% | 1.5% | 1.1% | 1.7% |
| 51 | N/A | 0.5% | 1.9% | 1.4% | 2.7% |
| 52 | N/A | 0.5% | 2.0% | 1.0% | 3.1% |
| 1 | N/A | 0.7% | 3.4% | 1.9% | 5.4% |
| 2 | N/A | 0.4% | 3.4% | 1.8% | 5.7% |
| 3 | N/A | 0.2% | 2.3% | 1.3% | 3.7% |
| 4 | N/A | 0.3% | 2.0% | 1.1% | 2.9% |
| 5 | N/A | 0.2% | 2.1% | 1.4% | 3.1% |
| 6 | N/A | 0.5% | 2.4% | 1.4% | 4.0% |
| 7 | N/A | 0.3% | 2.4% | 0.9% | 3.5% |
| 8 | N/A | 0.2% | 2.3% | 0.8% | 3.4% |
| 9 | N/A | 0.2% | 2.3% | 0.9% | 3.1% |
| 10 | N/A | 0.2% | 2.0% | 1.0% | 2.8% |
| 11 | N/A | 0.2% | 1.9% | 1.1% | 2.8% |
| 12 | N/A | 0.3% | 1.6% | 0.6% | 2.6% |
| 13 | N/A | 0.4% | 1.6% | 1.1% | 2.6% |
| 14 | N/A | 0.2% | 1.7% | 1.1% | 3.0% |
| 15 | N/A | 0.3% | 1.3% | 0.9% | 1.9% |
| 16 | N/A | 0.3% | 1.2% | 0.8% | 1.7% |
| 17 | N/A | 0.4% | 1.2% | 0.7% | 1.7% |
| 18 | N/A | 0.5% | 1.3% | 0.5% | 2.0% |
| 19 | N/A | 0.3% | 0.9% | 0.6% | 1.3% |
| 20 | N/A | 0.5% | 1.1% | 0.6% | 1.5% |
| 21 | N/A | 0.3% | 0.9% | 0.5% | 1.3% |
| 22 | N/A | 0.3% | 0.7% | 0.3% | 1.0% |
| 23 | N/A | 0.2% | 0.8% | 0.6% | 1.0% |
| 24 | N/A | 0.2% | 0.7% | 0.6% | 1.0% |
| 25 | N/A | 0.2% | 0.6% | 0.4% | 0.8% |
| 26 | N/A | 0.2% | 0.8% | 0.5% | 1.4% |
| 27 | N/A | 0.3% | 0.6% | 0.5% | 0.7% |
| 28 | N/A | 0.1% | 0.7% | 0.5% | 1.3% |
| 29 | N/A | 0.3% | 0.9% | 0.6% | 1.7% |
| 30 | N/A | 0.2% | 0.6% | 0.2% | 0.9% |
| 31 | N/A | 0.2% | 0.4% | 0.2% | 0.6% |
| 32 | N/A | 0.2% | 0.8% | 0.3% | 1.2% |
| 33 | N/A | 0.3% | 0.7% | 0.4% | 1.3% |
| 34 | N/A | 0.5% | 0.7% | 0.4% | 1.5% |
FluWatchers
In week 45, 12,590 participants reported to FluWatchers, of which 0.6% reported symptoms of cough and fever (Figure 6). The reports of cough and fever are not specific to any one respiratory pathogen and can be due to influenza, or other respiratory viruses, including respiratory syncytial virus, rhinovirus, and even COVID-19.
The percentage of participants reporting cough and fever has been stable since week 37, and remains at lower than expected levels. This may be a direct effect of individual and public health measures enacted to reduce the spread of COVID-19. FluWatchers reporting is not impacted by changes in health services or health seeking behaviours.
Among the 69 participants who reported cough and fever:
- 67% consulted a healthcare professional;
- 72% reported days missed from work or school, resulting in a combined total of 180 missed days of work or school (average of 2.5 days).
Nova Scotia had the highest participation rate this week (46 participants per 100,000 population) and the neighbourhood of K0A had the highest number of participants (140). See what is happening in your neighbourhood! Downloadable datasets are also available on Open Maps.
If you are interested in becoming a FluWatcher, sign up today.
Number of Participants Reporting in Week 45: 12,590
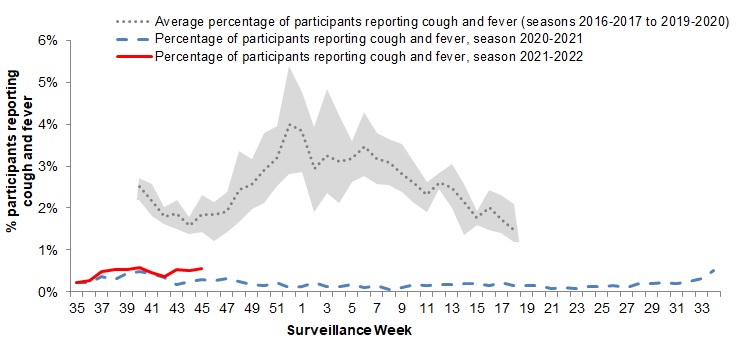
The shaded area represents the maximum and minimum percentage of percentage of participants reporting cough and fever by week, from seasons 2014-2015 to 2019-2020. Data from week 11 of the 2019-2020 season onwards are excluded from the historical comparison due to the COVID-19 pandemic
Figure 6 - Text description
| Surveillance Week | 2021-2022 | 2020-2021 | Average | Min | Max |
|---|---|---|---|---|---|
| 35 | 0.23% | 0.22% | N/A | N/A | N/A |
| 36 | 0.28% | 0.21% | N/A | N/A | N/A |
| 37 | 0.49% | 0.38% | N/A | N/A | N/A |
| 38 | 0.54% | 0.29% | N/A | N/A | N/A |
| 39 | 0.54% | 0.45% | N/A | N/A | N/A |
| 40 | 0.58% | 0.49% | 2.51% | 2.18% | 2.71% |
| 41 | 0.46% | 0.44% | 2.18% | 1.81% | 2.57% |
| 42 | 0.38% | 0.33% | 1.80% | 1.61% | 2.03% |
| 43 | 0.53% | 0.17% | 1.87% | 1.49% | 2.18% |
| 44 | 0.51% | 0.26% | 1.57% | 1.39% | 1.78% |
| 45 | 0.55% | 0.29% | 1.83% | 1.42% | 2.32% |
| 46 | 0.00% | 0.28% | 1.83% | 1.22% | 2.15% |
| 47 | 0.00% | 0.31% | 1.93% | 1.44% | 2.39% |
| 48 | 0.00% | 0.26% | 2.43% | 1.67% | 3.35% |
| 49 | 0.00% | 0.17% | 2.56% | 1.97% | 3.16% |
| 50 | 0.00% | 0.15% | 2.91% | 2.12% | 3.79% |
| 51 | 0.00% | 0.22% | 3.18% | 2.53% | 3.95% |
| 52 | 0.00% | 0.10% | 3.98% | 2.81% | 5.38% |
| 1 | 0.00% | 0.12% | 3.84% | 2.85% | 4.76% |
| 2 | 0.00% | 0.21% | 2.94% | 1.90% | 3.93% |
| 3 | 0.00% | 0.12% | 3.25% | 2.35% | 4.84% |
| 4 | 0.00% | 0.12% | 3.12% | 2.13% | 4.23% |
| 5 | 0.00% | 0.17% | 3.19% | 2.62% | 3.59% |
| 6 | 0.00% | 0.11% | 3.47% | 2.76% | 4.28% |
| 7 | 0.00% | 0.16% | 3.18% | 2.58% | 3.79% |
| 8 | 0.00% | 0.06% | 3.09% | 2.54% | 3.65% |
| 9 | 0.00% | 0.10% | 2.81% | 2.38% | 3.53% |
| 10 | 0.00% | 0.18% | 2.58% | 2.12% | 3.11% |
| 11 | 0.00% | 0.16% | 2.33% | 1.89% | 2.63% |
| 12 | 0.00% | 0.17% | 2.60% | 2.46% | 2.82% |
| 13 | 0.00% | 0.17% | 2.48% | 1.99% | 3.06% |
| 14 | 0.00% | 0.19% | 2.13% | 1.35% | 2.58% |
| 15 | 0.00% | 0.21% | 1.78% | 1.60% | 1.93% |
| 16 | 0.00% | 0.14% | 2.00% | 1.47% | 2.44% |
| 17 | 0.00% | 0.22% | 1.73% | 1.40% | 2.31% |
| 18 | 0.00% | 0.15% | 1.50% | 1.19% | 2.09% |
| 19 | 0.00% | 0.14% | N/A | N/A | N/A |
| 20 | 0.00% | 0.15% | N/A | N/A | N/A |
| 21 | 0.00% | 0.09% | N/A | N/A | N/A |
| 22 | 0.00% | 0.10% | N/A | N/A | N/A |
| 23 | 0.00% | 0.08% | N/A | N/A | N/A |
| 24 | 0.00% | 0.13% | N/A | N/A | N/A |
| 25 | 0.00% | 0.12% | N/A | N/A | N/A |
| 26 | 0.00% | 0.16% | N/A | N/A | N/A |
| 27 | 0.00% | 0.11% | N/A | N/A | N/A |
| 28 | 0.00% | 0.20% | N/A | N/A | N/A |
| 29 | 0.00% | 0.20% | N/A | N/A | N/A |
| 30 | 0.00% | 0.22% | N/A | N/A | N/A |
| 31 | 0.00% | 0.21% | N/A | N/A | N/A |
| 32 | 0.00% | 0.25% | N/A | N/A | N/A |
| 33 | 0.00% | 0.31% | N/A | N/A | N/A |
| 34 | 0.00% | 0.50% | N/A | N/A | N/A |
Influenza Outbreak Surveillance
In week 45, no outbreaks were reported.
To date this season (August 28 to November 13, 2021), 11 ILI outbreaks and no laboratory-confirmed influenza outbreaks have been reported. The most recent laboratory-confirmed influenza outbreak occurred in week 24 (week ending June 13, 2020) of the 2019-2020 season.
All ILI outbreaks have been reported in schools and/or daycares. The number of ILI outbreaks reported to date this season is lower than the 2020-2021 season but higher than in pre-pandemic seasons. This is not unexpected given changes to outbreak surveillance, specifically increased vigilance in schools to monitor and report absenteeism due to ILI, and the increased restrictions on attendance for children with symptoms of viral respiratory illness.
Outbreaks of ILI are not specific to any one respiratory pathogen and can be due influenza, or other respiratory viruses, including respiratory syncytial virus, rhinovirus, and even COVID-19. Many respiratory viruses in addition to the flu commonly circulate during the fall, and can cause clusters of cases with respiratory illness which could be captured as ILI. For more information on the respiratory viruses currently circulating in Canada, please refer to the Respiratory Virus Detections in Canada.
Number of provinces and territoriesFootnote 1 reporting in week 45: 13 out of 13
Influenza Severe Outcomes Surveillance
Provincial/Territorial Influenza Hospitalizations and Deaths
In week 45, no influenza-associated hospitalizations were reported by participating provinces and territoriesFootnote 2.
To date this season (August 28 to November 13, 2021), no influenza-associated hospitalizations were reported by participating provinces and territories.
The last influenza-associated hospitalization reported by participating provinces and territories was reported in week 25 (week ending June 20, 2020) of the 2019-2020 season.
Number of provinces and territories reporting in week 45: 9 out of 9
Pediatric Influenza Hospitalizations and Deaths
In week 45, no pediatric (≤16 years of age) influenza-associated hospitalizations were reported by the Immunization Monitoring Program Active (IMPACT) network.
To date this season (August 28 to November 13, 2021), no pediatric influenza-associated hospitalizations were reported by the IMPACT network.
The last pediatric influenza-associated hospitalization was reported by the IMPACT network in week 29 (week ending July 18, 2020) of the 2019-2020 season.
Adult Influenza Hospitalizations and Deaths
In week 45, less than five influenza-associated adult (≥16 years of age) hospitalizations have been reported by the Canadian Immunization Research Network (CIRN) Serious Outcomes Surveillance (SOS) network. This is the first report of hospitalization(s) from the network since in week 19 (week ending May 9, 2020) of the 2019-2020 season.
To date this season (August 28 to November 13, 2021), less than five influenza-associated adult (≥16 years of age) hospitalizations have been reported by the CIRN SOS network.
Influenza Strain Characterization
The National Microbiology Laboratory has not yet reported influenza strain characterization results for influenza viruses collected during the 2021-2022 season.
Antiviral Resistance
The National Microbiology Laboratory has not yet reported antiviral resistance results for influenza viruses collected during the 2021-2022 season.
Influenza Vaccine Monitoring
Vaccine monitoring refers to activities related to the monitoring of influenza vaccine coverage and effectiveness.
Vaccine Coverage
Influenza vaccine coverage estimates for the 2021-2022 season are anticipated to be available in February or March 2022.
Vaccine Effectiveness
Influenza vaccine effectiveness estimates for the 2021-2022 season are anticipated to be available in February or March 2022, pending the resumption of community transmission of seasonal influenza.
Provincial and International Surveillance Links
See Influenza surveillance resources
Notes
The data in the FluWatch report represent surveillance data available at the time of writing. All data are preliminary and may change as updates are received.
To learn more about the FluWatch program, see the Overview of influenza monitoring in Canada page.
For more information on the flu, see our Flu (influenza) web page.
We would like to thank all the FluWatch surveillance partners participating in this year's influenza surveillance program.
This report is available on the Government of Canada Influenza webpage.
Ce rapport est disponible dans les deux langues officielles.
- Footnote 1
-
All Provinces and Territories (PTs) participate in FluWatch's outbreak surveillance system. This outbreak system monitors influenza and ILI outbreaks in long-term care facilities, acute care facilities, schools and daycares, remote and/or isolated communities, and facilities categorized as 'other'. Not all reporting PTs report outbreaks in all these settings. All PTs report laboratory confirmed outbreaks in LTCF. Four PTs (NB, NL, NS and YK) report ILI outbreaks in schools and/or daycares and other facilities.
- Footnote 2
-
Influenza-associated hospitalizations are reported by Alberta, Manitoba, New Brunswick, Newfoundland and Labrador, Northwest Territories, Nova Scotia, Prince Edward Island and Yukon. Only hospitalizations that require intensive medical care are reported by Saskatchewan.