
FluWatch report: January 14 to January 20, 2024 (week 3)
Download in PDF format
(1.8 MB, 12 pages)
Organization: Public Health Agency of Canada
Published: 2024-01-12
Related topics
Weekly highlights
At the national level, most indicators of influenza activity remained similar, or decreased slightly, compared to the previous week. All surveillance indicators are within or below expected levels typical of this time of year.
Virologic
- In week 3, the percentage of tests positive for influenza was 11.1% and a total of 3,859 laboratory detections (3,590 influenza A and 269 influenza B) were reported.
Syndromic
- The percentage of visits for influenza-like illness (ILI) was 1.4% in week 3. The percentage of visits for ILI is within levels typical of this time of year.
- The percentage of FluWatchers reporting cough and fever was 1.3% in week 3. The percentage of FluWatchers reporting cough and fever remains below expected for this time of year.
Outbreaks
- From August 27, 2023 to January 20, 2024 (weeks 35 to 3), 573 laboratory-confirmed influenza outbreaks have been reported (52 laboratory-confirmed influenza outbreaks were reported in week 3).
Severe Outcomes
- From August 27, 2023 to January 20, 2024 (weeks 35 to 3), 3,300 influenza-associated hospitalizations were reported by participating provinces and territories. Adults aged 65 years of age and older accounted for 48% of reported hospitalizations. The highest cumulative hospitalization rates were among adults 65 years of age and older (108/100,000) and children under 5 years of age (66/100,000).
- From October 1, 2023 to January 20, 2024 (weeks 40 to 3), 452 influenza-associated pediatric hospitalizations were reported from a total of 1,884 positive influenza tests across eight sentinel hospital sites.
Other Notes
- Weekly reporting of laboratory detections of influenza, SARS-CoV-2, and other seasonal respiratory viruses will continue via our Respiratory Virus Detections Surveillance System.
On this page
- Influenza/influenza-like illness activity - Geographic spread
- Laboratory-confirmed influenza detections
- Syndromic / influenza-like illness surveillance
- Influenza outbreak surveillance
- Influenza severe outcomes surveillance
- Influenza strain characterization
- Antiviral resistance
- Influenza vaccine monitoring
- Provincial and international surveillance links
Influenza/influenza-like illness activity - Geographic spread
In week 3, 25 regions across Canada reported sporadic influenza activity, 17 regions in seven provinces and territories reported localized influenza activity (N.L., P.E.I., N.S., N.B., Ont., Alta., and B.C.), and two regions reported widespread activity (Ont. and B.C.) (Figure 1). The proportion of regions reporting influenza activity and the intensity of reported activity are similar to the previous week. One region in Canada reported no activity this week.
Number of Regions Reporting in week 3: 45 out of 53
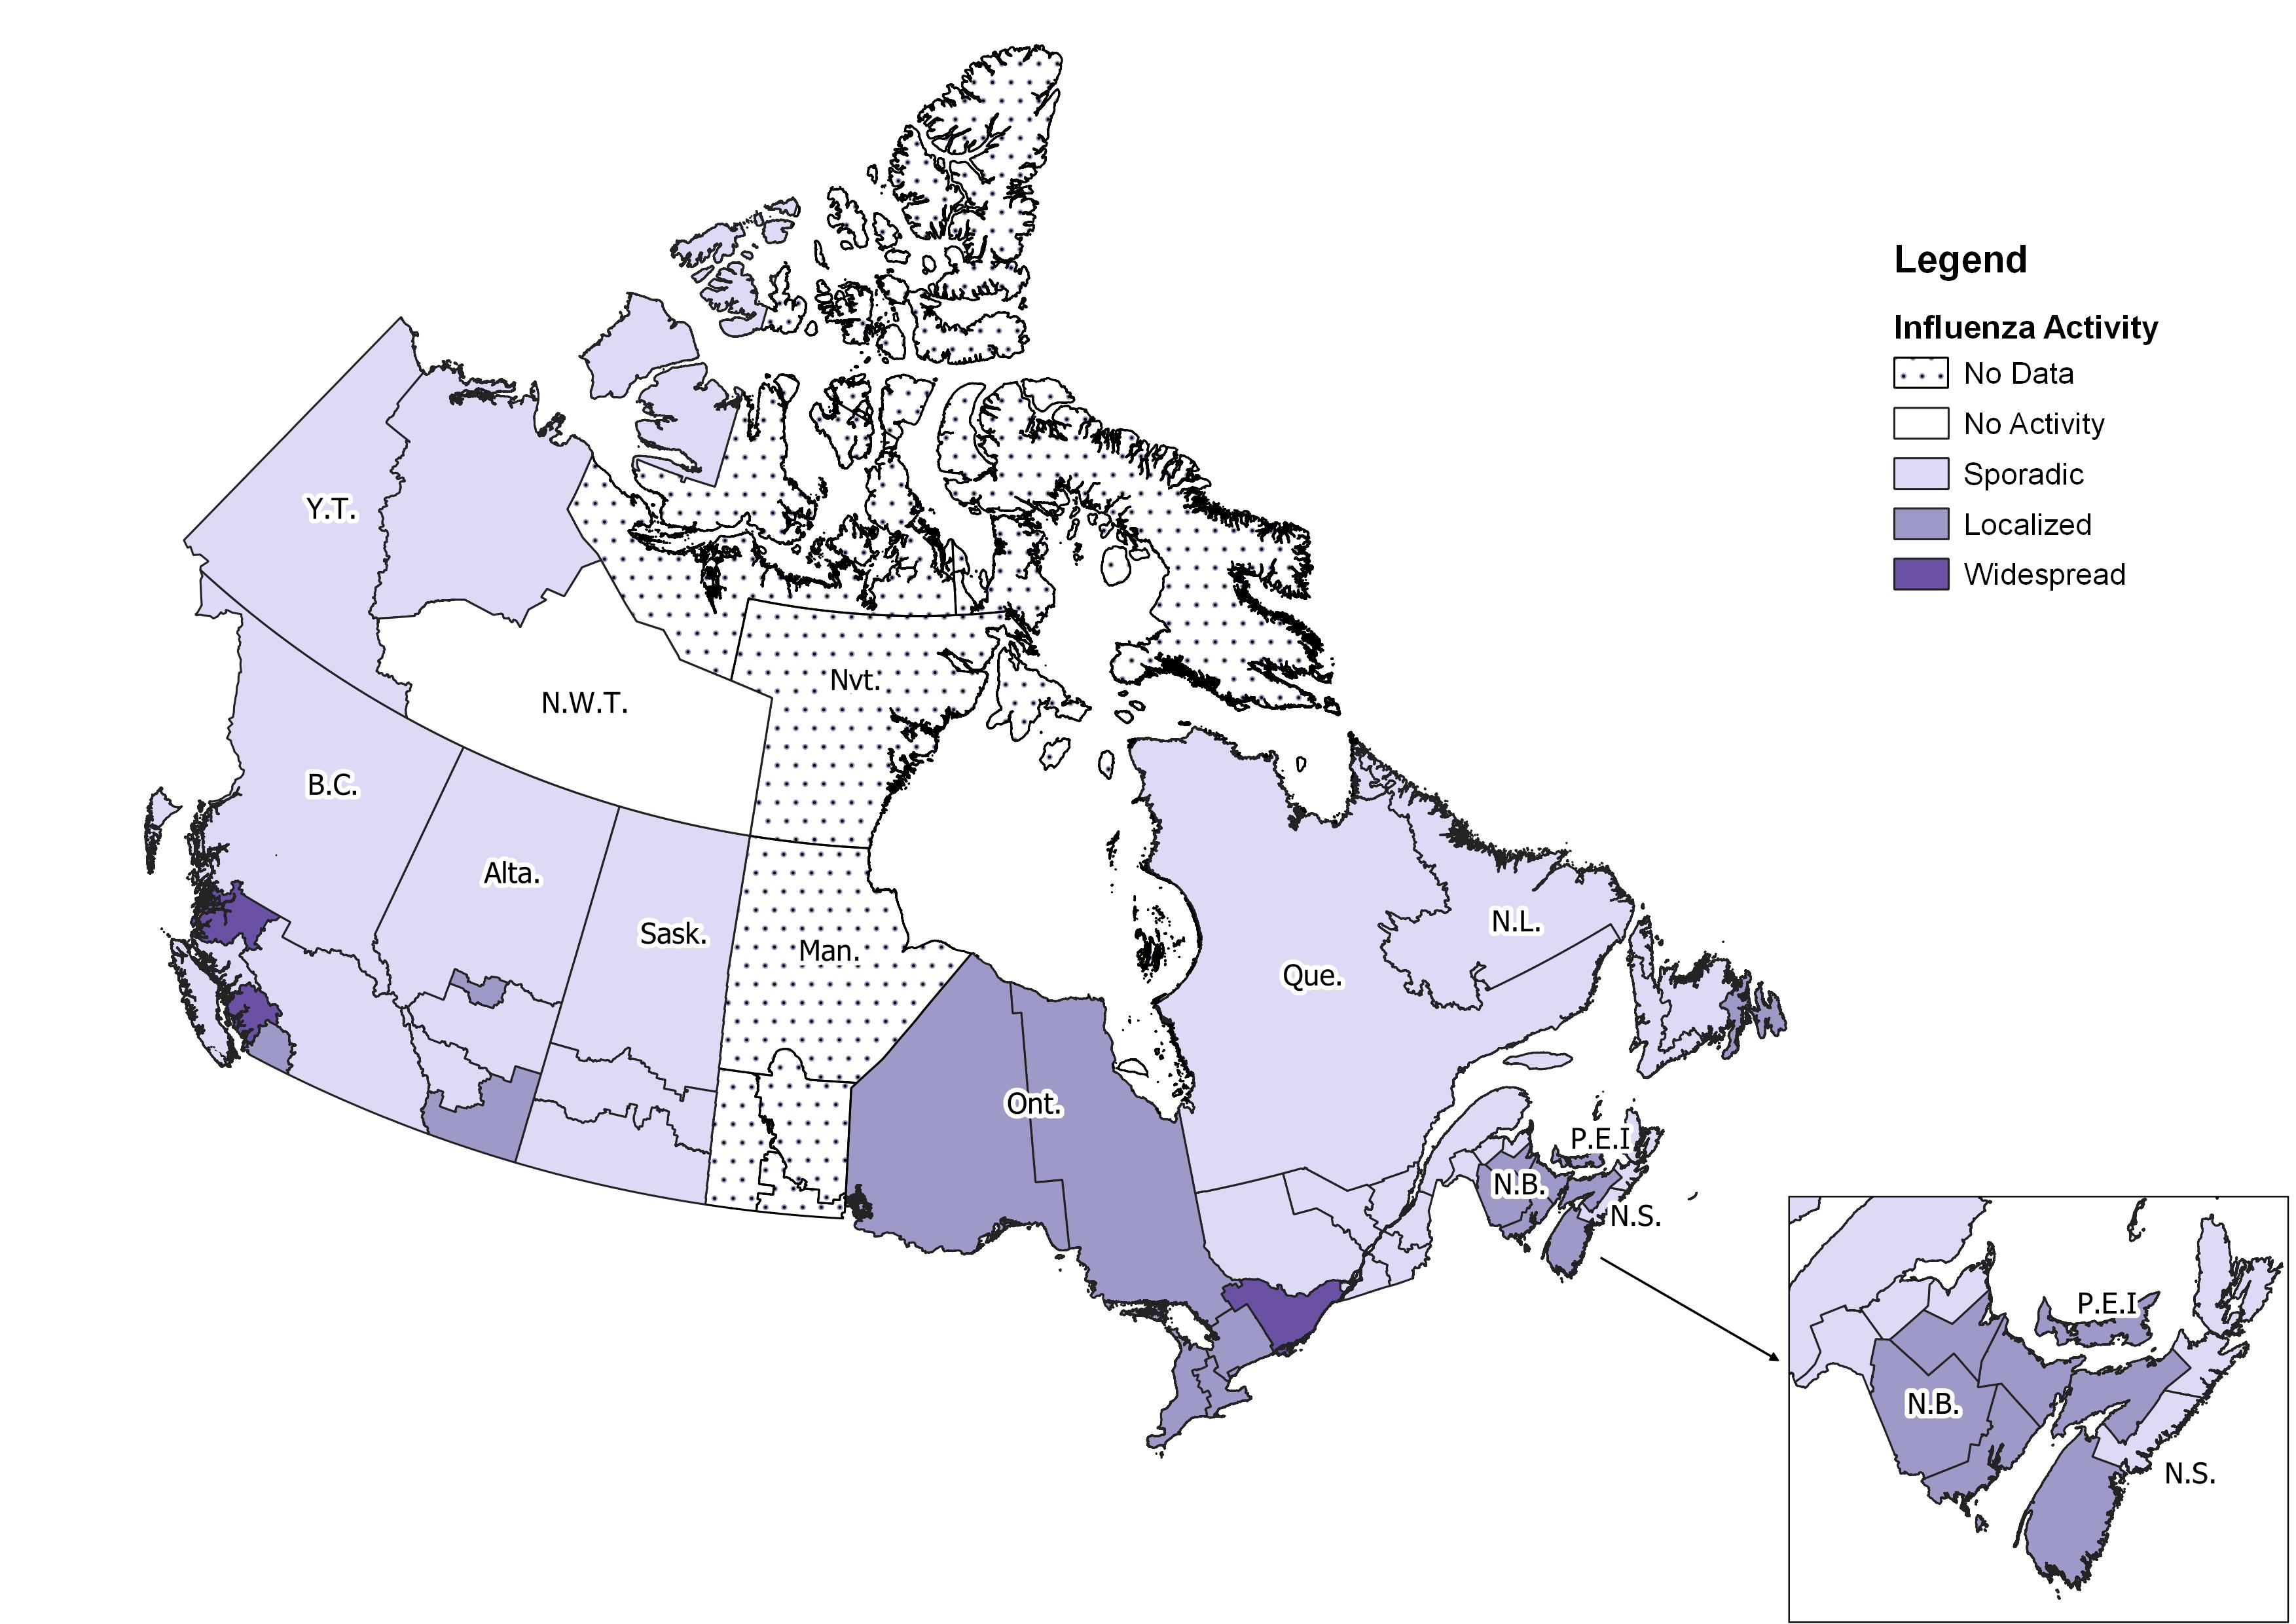
Figure 1 - Text description
| Province | Influenza Surveillance Region | Activity Level |
|---|---|---|
| N.L. | Eastern | Localized |
| N.L. | Labrador-Grenfell | Sporadic |
| N.L. | Central | Sporadic |
| N.L. | Western | Sporadic |
| P.E.I. | Prince Edward Island | Localized |
| N.S. | Zone 1 - Western | Localized |
| N.S. | Zone 2 - Northern | Localized |
| N.S. | Zone 3 - Eastern | Sporadic |
| N.S. | Zone 4 - Central | Sporadic |
| N.B. | Region 1 | Localized |
| N.B. | Region 2 | Localized |
| N.B. | Region 3 | Localized |
| N.B. | Region 4 | Sporadic |
| N.B. | Region 5 | Sporadic |
| N.B. | Region 6 | Sporadic |
| N.B. | Region 7 | Localized |
| Que. | Nord-est | Sporadic |
| Que. | Québec et Chaudieres-Appalaches | Sporadic |
| Que. | Centre-du-Québec | Sporadic |
| Que. | Montréal et Laval | Sporadic |
| Que. | Ouest-du-Québec | Sporadic |
| Que. | Montérégie | Sporadic |
| Ont. | Central East | Localized |
| Ont. | Central West | Localized |
| Ont. | Eastern | Widespread |
| Ont. | North East | Localized |
| Ont. | North West | Localized |
| Ont. | South West | Localized |
| Ont. | Toronto | Localized |
| Man. | Northern Regional | No Data |
| Man. | Prairie Mountain | No Data |
| Man. | Interlake-Eastern | No Data |
| Man. | Winnipeg | No Data |
| Man. | Southern Health | No Data |
| Sask. | North | Sporadic |
| Sask. | Central | Sporadic |
| Sask. | South | Sporadic |
| Alta. | North Zone | Sporadic |
| Alta. | Edmonton | Localized |
| Alta. | Central Zone | Sporadic |
| Alta. | Calgary | Sporadic |
| Alta. | South Zone | Localized |
| B.C. | Interior | Sporadic |
| B.C. | Fraser | Localized |
| B.C. | Vancouver Coastal | Widespread |
| B.C. | Vancouver Island | Sporadic |
| B.C. | Northern | Sporadic |
| Y.T. | Yukon | Sporadic |
| N.W.T. | North | Sporadic |
| N.W.T. | South | No Activity |
| Nvt. | Qikiqtaaluk | No Data |
| Nvt. | Kivalliq | No Data |
| Nvt. | Kitimeot | No Data |
Laboratory-confirmed influenza detections
The weekly percentage of tests positive for influenza (11.1% in week 3) is similar to the previous week and is slightly below historical averages for this time of year.
The following results were reported from sentinel laboratories across Canada in week 3 (Figures 2 and 3):
- A total of 3,859 laboratory detections (3,590 influenza A and 269 influenza B) were reported.
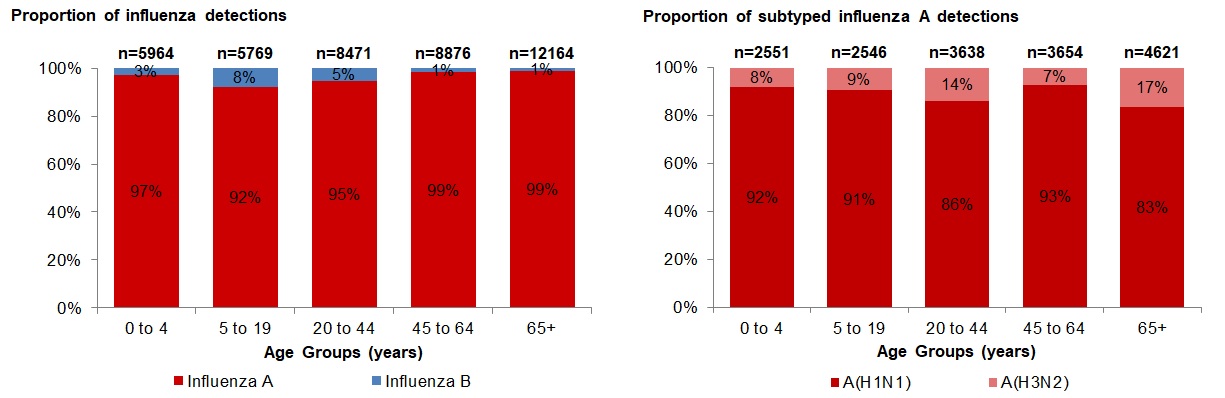
- Among subtyped influenza A detections (662), 68% (447) were influenza A(H1N1).
- Age information was reported for 2,842 detections. Adults over 65 years reported the highest proportion of detections, 39%. Detections in individuals aged 0-19 years old have slightly increased over the previous two weeks. Detections in the remaining age groups have continued to decrease.
To date this season (August 27, 2023 to January 20, 2024):
- 53,427 influenza detections were reported, of which 97% (51,694) were influenza A and among subtyped influenza A detections (21,333), influenza A(H1N1) accounted for 86% of detections.
- 41,244 laboratory-confirmed influenza detections with age information were reported, of which 11,733 (28%) were in individuals aged 0-19 years old. Across adult age groups, adults over 65 years reported the highest detections, 29%, while similar proportions are being observed in adults 20-44 years old, 21% and adults 45-64 years, 22% (Figure 4).
For more detailed weekly and cumulative influenza data, see the text descriptions for Figures 2 and 3 or the Respiratory Virus Detections in Canada Report.
Number of Laboratories Reporting in Week 3: 35 out of 35
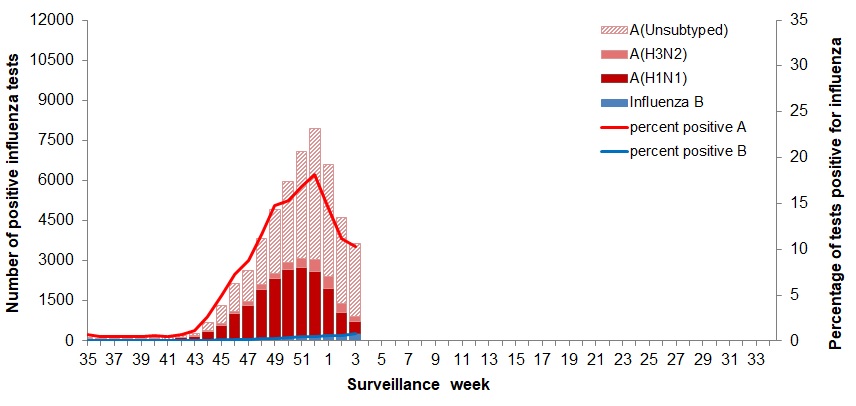
Figure 2 - Text description
| Surveillance Week | A(Unsubtyped) | A(H3N2) | A(H1N1) | Influenza B | Percent Positive A | Percent Positive B |
|---|---|---|---|---|---|---|
| 35 | 19 | 27 | 51 | 9 | 0.7 | 0.1 |
| 36 | 12 | 11 | 50 | 9 | 0.4 | 0.1 |
| 37 | 28 | 14 | 46 | 6 | 0.5 | 0.0 |
| 38 | 28 | 15 | 57 | 4 | 0.5 | 0.0 |
| 39 | 18 | 10 | 74 | 20 | 0.5 | 0.1 |
| 40 | 39 | 20 | 80 | 13 | 0.6 | 0.1 |
| 41 | 43 | 10 | 50 | 7 | 0.5 | 0.0 |
| 42 | 59 | 15 | 96 | 19 | 0.7 | 0.1 |
| 43 | 99 | 29 | 136 | 23 | 1.2 | 0.1 |
| 44 | 291 | 53 | 315 | 25 | 2.6 | 0.1 |
| 45 | 685 | 62 | 539 | 37 | 4.9 | 0.1 |
| 46 | 1032 | 103 | 961 | 47 | 7.2 | 0.2 |
| 47 | 1162 | 134 | 1306 | 35 | 8.8 | 0.1 |
| 48 | 1712 | 165 | 1856 | 85 | 11.6 | 0.3 |
| 49 | 2383 | 208 | 2220 | 99 | 14.8 | 0.3 |
| 50 | 3025 | 262 | 2535 | 139 | 15.3 | 0.4 |
| 51 | 3987 | 351 | 2533 | 184 | 16.8 | 0.5 |
| 52 | 4925 | 416 | 2361 | 219 | 18.1 | 0.5 |
| 1 | 4161 | 450 | 1693 | 257 | 14.4 | 0.6 |
| 2 | 3215 | 325 | 729 | 219 | 11.3 | 0.6 |
| 3 | 2719 | 215 | 447 | 269 | 10.3 | 0.8 |
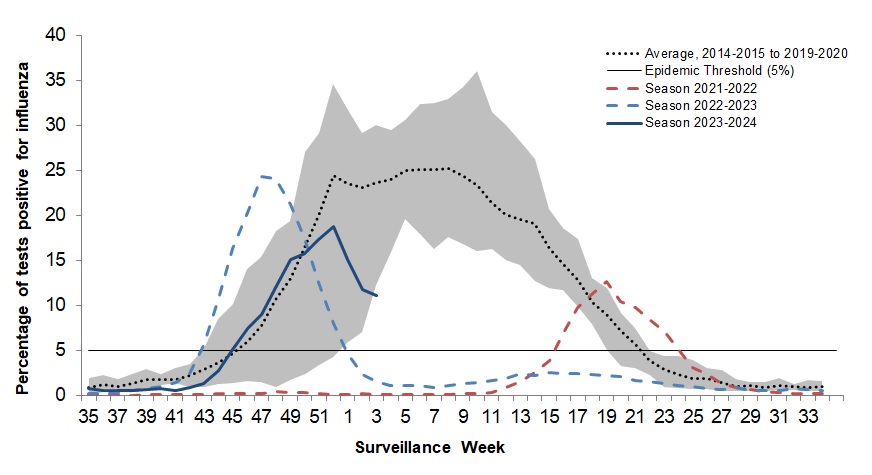
The shaded area represents the maximum and minimum number of influenza tests or percentage of tests positive reported by week from seasons 2014-2015 to 2019-2020. Data from week 11 of the 2019-2020 season onwards are excluded from the historical comparison due to the COVID-19 pandemic.
The epidemic threshold is 5% tests positive for influenza. When it is exceeded, and a minimum of 15 weekly influenza detections are reported, a seasonal influenza epidemic is declared.
Figure 3 - Text description
| Surveillance Week | Percentage of tests positive, 2023-2024 | Percentage of tests positive, 2022-2023 | Percentage of tests positive, 2021-2022 | Maximum Percentage of Tests Positive | Minimum Percentage of Tests Positive | Average Percentage of Tests Positive |
|---|---|---|---|---|---|---|
| 35 | 0.8 | 0.2 | 0.0 | 1.9 | 0.1 | 0.8 |
| 36 | 0.5 | 0.2 | 0.0 | 2.3 | 0.3 | 1.1 |
| 37 | 0.5 | 0.3 | 0.0 | 1.8 | 0.4 | 1.0 |
| 38 | 0.5 | 0.5 | 0.0 | 2.4 | 0.6 | 1.3 |
| 39 | 0.6 | 0.7 | 0.0 | 3.0 | 0.6 | 1.7 |
| 40 | 0.7 | 1.0 | 0.0 | 2.3 | 1.1 | 1.7 |
| 41 | 0.5 | 1.4 | 0.1 | 3.0 | 1.3 | 1.7 |
| 42 | 0.8 | 2.4 | 0.1 | 3.4 | 0.9 | 2.2 |
| 43 | 1.3 | 5.5 | 0.1 | 5.3 | 0.8 | 2.8 |
| 44 | 2.7 | 10.8 | 0.2 | 8.4 | 1.2 | 3.7 |
| 45 | 5.1 | 16.2 | 0.1 | 10.1 | 1.4 | 4.6 |
| 46 | 7.4 | 20.3 | 0.2 | 14.1 | 1.5 | 6.0 |
| 47 | 8.9 | 24.3 | 0.2 | 15.4 | 1.4 | 7.7 |
| 48 | 11.9 | 24.1 | 0.3 | 18.2 | 0.8 | 10.6 |
| 49 | 15.0 | 21.2 | 0.3 | 19.3 | 1.6 | 12.9 |
| 50 | 15.7 | 17.4 | 0.3 | 27.0 | 2.4 | 16.4 |
| 51 | 17.2 | 12.5 | 0.2 | 29.1 | 3.3 | 20.0 |
| 52 | 18.6 | 8.0 | 0.1 | 34.5 | 4.3 | 24.4 |
| 1 | 15.0 | 4.6 | 0.1 | 31.7 | 5.9 | 23.5 |
| 2 | 11.9 | 2.3 | 0.1 | 29.1 | 7.1 | 23.0 |
| 3 | 11.1 | 1.5 | 0.1 | 30.1 | 12.2 | 23.7 |
| 4 | N/A | 1.1 | 0.1 | 29.5 | 15.9 | 24.0 |
| 5 | N/A | 1.0 | 0.0 | 30.6 | 19.6 | 24.9 |
| 6 | N/A | 1.0 | 0.0 | 32.4 | 17.9 | 25.0 |
| 7 | N/A | 0.9 | 0.0 | 32.5 | 16.3 | 25.1 |
| 8 | N/A | 1.1 | 0.1 | 32.9 | 17.6 | 25.2 |
| 9 | N/A | 1.3 | 0.1 | 34.3 | 16.8 | 24.4 |
| 10 | N/A | 1.4 | 0.2 | 36.0 | 16.1 | 23.3 |
| 11 | N/A | 1.7 | 0.3 | 31.4 | 16.2 | 21.4 |
| 12 | N/A | 1.9 | 0.9 | 30.0 | 15.0 | 20.1 |
| 13 | N/A | 2.4 | 1.5 | 28.3 | 14.5 | 19.6 |
| 14 | N/A | 2.2 | 2.5 | 26.2 | 12.7 | 19.1 |
| 15 | N/A | 2.5 | 3.9 | 20.7 | 12.0 | 16.3 |
| 16 | N/A | 2.4 | 7.0 | 18.5 | 11.6 | 14.5 |
| 17 | N/A | 2.4 | 9.7 | 17.3 | 9.8 | 12.8 |
| 18 | N/A | 2.3 | 11.3 | 13.0 | 7.9 | 10.3 |
| 19 | N/A | 2.1 | 12.6 | 12.0 | 5.0 | 9.0 |
| 20 | N/A | 2.1 | 10.4 | 9.1 | 3.2 | 7.2 |
| 21 | N/A | 1.6 | 9.8 | 7.5 | 3.0 | 5.6 |
| 22 | N/A | 1.6 | 8.4 | 4.9 | 2.2 | 3.9 |
| 23 | N/A | 1.3 | 7.0 | 4.4 | 0.9 | 2.9 |
| 24 | N/A | 1.1 | 5.0 | 4.4 | 0.8 | 2.3 |
| 25 | N/A | 1.0 | 3.0 | 4.0 | 0.6 | 1.9 |
| 26 | N/A | 0.7 | 2.3 | 3.0 | 0.7 | 1.8 |
| 27 | N/A | 0.6 | 1.2 | 2.8 | 0.4 | 1.4 |
| 28 | N/A | 0.8 | 0.8 | 1.8 | 0.4 | 0.9 |
| 29 | N/A | 0.5 | 0.7 | 1.5 | 0.5 | 1.1 |
| 30 | N/A | 0.5 | 0.4 | 1.5 | 0.5 | 0.9 |
| 31 | N/A | 0.5 | 0.3 | 1.9 | 0.6 | 1.1 |
| 32 | N/A | 0.7 | 0.2 | 1.2 | 0.5 | 0.9 |
| 33 | N/A | 0.7 | 0.2 | 1.7 | 0.4 | 0.9 |
| 34 | N/A | 0.6 | 0.2 | 1.6 | 0.4 | 0.9 |
Laboratory data notes:
Testing for influenza and other respiratory viruses has been influenced by the COVID-19 pandemic. Changes in laboratory testing practices may affect the comparability of data to previous seasons.
Due to different testing protocols of laboratories across Canada, some influenza A subtype detection counts may not be included in total influenza A detection counts and percent positivity calculations.
Figure 4 - Text description
| Age Group | Proportion of Influenza A | Proportion of Influenza B | Total Number Influenza Detections |
|---|---|---|---|
| 0 to 4 | 97.2% | 2.8% | 5964 |
| 5 to 19 | 92.2% | 7.8% | 5769 |
| 20 to 44 | 94.7% | 5.3% | 8471 |
| 45 to 64 | 98.5% | 1.5% | 8876 |
| 65+ | 99.0% | 1.0% | 12164 |
| Age Group | Proportion of A(H1N1) | Proportion of A(H3N2) | Total Number of Subtyped Influenza Detections |
|---|---|---|---|
| 0 to 4 | 92.0% | 8.0% | 2551 |
| 5 to 19 | 90.7% | 9.3% | 2546 |
| 20 to 44 | 85.9% | 14.1% | 3638 |
| 45 to 64 | 92.7% | 7.3% | 3654 |
| 65+ | 83.4% | 16.6% | 4621 |
Syndromic / influenza-like illness surveillance
Healthcare practitioners sentinel surveillance
In week 3, 1.4% of visits to healthcare professionals were due to influenza-like illness (ILI) (Figure 5). The percentage of visits for ILI has decreased in the previous week and is within expected levels for this time of year.
ILI symptoms are not specific to any one respiratory pathogen and can be due to influenza, or other respiratory viruses, including respiratory syncytial virus and SARS-CoV-2, the virus that causes COVID-19. This makes the percentage of visits for ILI an important indicator of overall respiratory illness morbidity in the community in the presence of co-circulating viruses.
This indicator should be interpreted with caution as there have been a smaller number of sentinels reporting compared to previous seasons.
Number of Sentinels Reporting in Week 3: 36
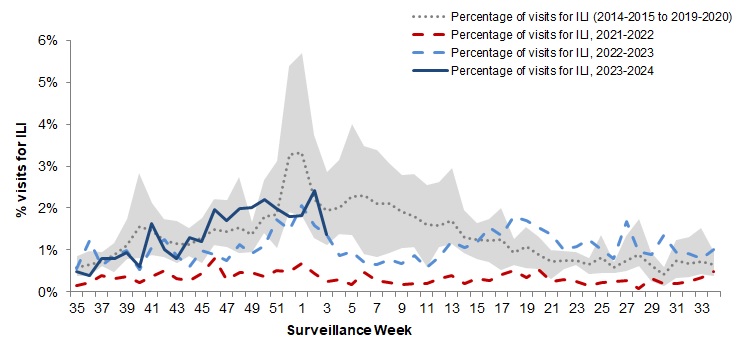
The shaded area represents the maximum and minimum percentage of visits for ILI reported by week from seasons 2014-2015 to 2019-2020. Data from week 11 of the 2019-2020 season onwards are excluded from the historical comparison due to the COVID-19 pandemic.
Figure 5 - Text description
| Surveillance Week | 2023-2024 | 2022-2023 | 2021-2022 | Average | Min | Max |
|---|---|---|---|---|---|---|
| 35 | 0.5% | 0.6% | 0.1% | 0.6% | 0.4% | 0.9% |
| 36 | 0.4% | 1.2% | 0.2% | 0.6% | 0.4% | 0.9% |
| 37 | 0.8% | 0.6% | 0.4% | 0.7% | 0.5% | 1.0% |
| 38 | 0.8% | 0.9% | 0.3% | 0.7% | 0.6% | 1.0% |
| 39 | 0.9% | 1.0% | 0.4% | 0.9% | 0.5% | 1.2% |
| 40 | 0.6% | 0.5% | 0.2% | 1.2% | 0.8% | 1.7% |
| 41 | 1.6% | 1.1% | 0.4% | 1.7% | 0.8% | 2.8% |
| 42 | 1.0% | 1.2% | 0.5% | 1.6% | 1.2% | 2.1% |
| 43 | 0.8% | 0.9% | 0.3% | 1.2% | 0.8% | 1.7% |
| 44 | 1.3% | 0.6% | 0.3% | 1.2% | 0.7% | 1.7% |
| 45 | 1.2% | 1.0% | 0.4% | 1.2% | 0.9% | 1.5% |
| 46 | 2.0% | 0.9% | 0.8% | 1.4% | 1.2% | 1.8% |
| 47 | 1.7% | 0.7% | 0.3% | 1.6% | 1.1% | 2.2% |
| 48 | 2.0% | 1.1% | 0.5% | 1.5% | 1.1% | 2.2% |
| 49 | 2.0% | 0.9% | 0.5% | 1.7% | 1.0% | 2.8% |
| 50 | 2.2% | 1.1% | 0.4% | 1.5% | 1.1% | 1.7% |
| 51 | 2.0% | 1.7% | 0.5% | 1.9% | 1.4% | 2.7% |
| 52 | 2.1% | 1.5% | 0.5% | 2.0% | 1.0% | 3.1% |
| 1 | 1.8% | 2.1% | 0.7% | 3.4% | 1.9% | 5.4% |
| 2 | 2.8% | 1.6% | 0.4% | 3.4% | 1.8% | 5.7% |
| 3 | 1.4% | 1.4% | 0.2% | 2.3% | 1.3% | 3.7% |
| 4 | N/A | 0.9% | 0.3% | 2.0% | 1.1% | 2.9% |
| 5 | N/A | 1.0% | 0.2% | 2.1% | 1.4% | 3.1% |
| 6 | N/A | 0.7% | 0.5% | 2.4% | 1.4% | 4.0% |
| 7 | N/A | 0.7% | 0.3% | 2.4% | 0.9% | 3.5% |
| 8 | N/A | 0.8% | 0.2% | 2.3% | 0.8% | 3.4% |
| 9 | N/A | 0.7% | 0.2% | 2.3% | 0.9% | 3.1% |
| 10 | N/A | 0.9% | 0.2% | 2.0% | 1.0% | 2.8% |
| 11 | N/A | 0.6% | 0.2% | 1.9% | 1.1% | 2.8% |
| 12 | N/A | 0.8% | 0.3% | 1.6% | 0.6% | 2.6% |
| 13 | N/A | 1.2% | 0.4% | 1.6% | 1.1% | 2.6% |
| 14 | N/A | 1.1% | 0.2% | 1.7% | 1.1% | 3.0% |
| 15 | N/A | 1.2% | 0.3% | 1.3% | 0.9% | 1.9% |
| 16 | N/A | 1.5% | 0.3% | 1.2% | 0.8% | 1.7% |
| 17 | N/A | 1.3% | 0.4% | 1.2% | 0.7% | 1.7% |
| 18 | N/A | 1.8% | 0.5% | 1.3% | 0.5% | 2.0% |
| 19 | N/A | 1.7% | 0.3% | 0.9% | 0.6% | 1.3% |
| 20 | N/A | 1.5% | 0.5% | 1.1% | 0.6% | 1.5% |
| 21 | N/A | 1.4% | 0.3% | 0.9% | 0.5% | 1.3% |
| 22 | N/A | 1.0% | 0.3% | 0.7% | 0.3% | 1.0% |
| 23 | N/A | 1.1% | 0.2% | 0.8% | 0.6% | 1.0% |
| 24 | N/A | 1.3% | 0.2% | 0.7% | 0.6% | 1.0% |
| 25 | N/A | 1.0% | 0.2% | 0.6% | 0.4% | 0.8% |
| 26 | N/A | 0.8% | 0.2% | 0.8% | 0.5% | 1.4% |
| 27 | N/A | 1.7% | 0.3% | 0.6% | 0.5% | 0.7% |
| 28 | N/A | 1.0% | 0.1% | 0.7% | 0.5% | 1.3% |
| 29 | N/A | 0.9% | 0.3% | 0.9% | 0.6% | 1.7% |
| 30 | N/A | 1.3% | 0.2% | 0.6% | 0.2% | 0.9% |
| 31 | N/A | 0.9% | 0.2% | 0.4% | 0.2% | 0.6% |
| 32 | N/A | 0.9% | 0.2% | 0.8% | 0.3% | 1.2% |
| 33 | N/A | 0.8% | 0.3% | 0.7% | 0.4% | 1.3% |
| 34 | N/A | 1.0% | 0.5% | 0.7% | 0.4% | 1.5% |
FluWatchers
In week 3, 9,319 participants reported to FluWatchers, of which 1.3% reported symptoms of cough and fever (Figure 6). The percentage of FluWatchers reporting cough and fever is similar to the previous week and remains below expected levels for this time of year.
The reports of cough and fever are not specific to any one respiratory pathogen and can be due to influenza, or other respiratory viruses, including respiratory syncytial virus, rhinovirus, and SARS-CoV-2, the virus that causes COVID-19. This makes the proportion of individuals reporting cough and fever an important indicator of overall respiratory illness activity in the community in the presence of co-circulating viruses.
FluWatchers reporting is not impacted by changes in health services or health seeking behaviours.
Among the 125 participants who reported cough and fever:
- 17% consulted a healthcare professional.
- 75% reported days missed from work or school, resulting in an average of 2.6 missed days from work or school among those 94 participants.
Yukon had the highest participation rate this week (55 participants per 100,000 population) and the neighbourhood with postal code K0A had the highest number of participants (120). See what is happening in your neighbourhood! Downloadable datasets are also available on Open Maps.
If you are interested in becoming a FluWatcher, sign up today.
Number of Participants Reporting in Week 3: 9,319
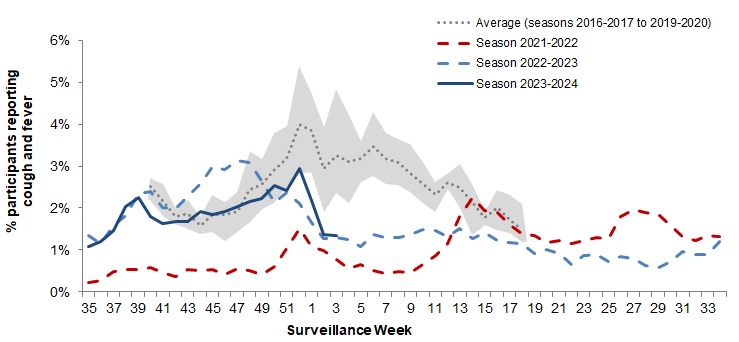
The shaded area represents the maximum and minimum percentage of percentage of participants reporting cough and fever by week, from seasons 2014-2015 to 2019-2020. Data from week 11 of the 2019-2020 season onwards are excluded from the historical comparison due to the COVID-19 pandemic
Figure 6 - Text description
| Surveillance Week | 2023-2024 | 2022-2023 | 2021-2022 | Average | Min | Max |
|---|---|---|---|---|---|---|
| 35 | 1.1% | 1.3% | 0.2% | N/A | N/A | N/A |
| 36 | 1.2% | 1.2% | 0.3% | N/A | N/A | N/A |
| 37 | 1.5% | 1.6% | 0.5% | N/A | N/A | N/A |
| 38 | 2.0% | 1.8% | 0.5% | N/A | N/A | N/A |
| 39 | 2.3% | 2.3% | 0.5% | N/A | N/A | N/A |
| 40 | 1.8% | 2.4% | 0.6% | 2.5% | 2.2% | 2.7% |
| 41 | 1.6% | 2.0% | 0.5% | 2.2% | 1.8% | 2.6% |
| 42 | 1.7% | 2.0% | 0.4% | 1.8% | 1.6% | 2.0% |
| 43 | 1.7% | 2.3% | 0.5% | 1.9% | 1.5% | 2.2% |
| 44 | 1.9% | 2.6% | 0.5% | 1.6% | 1.4% | 1.8% |
| 45 | 1.9% | 3.0% | 0.5% | 1.8% | 1.4% | 2.3% |
| 46 | 1.9% | 2.9% | 0.4% | 1.8% | 1.2% | 2.2% |
| 47 | 2.0% | 3.1% | 0.6% | 1.9% | 1.4% | 2.4% |
| 48 | 2.2% | 3.1% | 0.5% | 2.4% | 1.7% | 3.4% |
| 49 | 2.2% | 2.7% | 0.4% | 2.6% | 2.0% | 3.2% |
| 50 | 2.5% | 2.1% | 0.6% | 2.9% | 2.1% | 3.8% |
| 51 | 2.4% | 2.4% | 1.0% | 3.2% | 2.5% | 3.9% |
| 52 | 3.0% | 2.1% | 1.5% | 4.0% | 2.8% | 5.4% |
| 1 | 2.2% | 1.7% | 1.1% | 3.8% | 2.9% | 4.8% |
| 2 | 1.3% | 1.3% | 1.0% | 2.9% | 1.9% | 3.9% |
| 3 | 1.3% | 1.3% | 0.8% | 3.3% | 2.3% | 4.8% |
| 4 | N/A | 1.2% | 0.6% | 3.1% | 2.1% | 4.2% |
| 5 | N/A | 1.1% | 0.6% | 3.2% | 2.6% | 3.6% |
| 6 | N/A | 1.4% | 0.5% | 3.5% | 2.8% | 4.3% |
| 7 | N/A | 1.3% | 0.4% | 3.2% | 2.6% | 3.8% |
| 8 | N/A | 1.3% | 0.5% | 3.1% | 2.5% | 3.6% |
| 9 | N/A | 1.4% | 0.5% | 2.8% | 2.4% | 3.5% |
| 10 | N/A | 1.5% | 0.6% | 2.6% | 2.1% | 3.1% |
| 11 | N/A | 1.5% | 0.9% | 2.3% | 1.9% | 2.6% |
| 12 | N/A | 1.3% | 1.2% | 2.6% | 2.5% | 2.8% |
| 13 | N/A | 1.5% | 1.8% | 2.5% | 2.0% | 3.1% |
| 14 | N/A | 1.3% | 2.3% | 2.1% | 1.3% | 2.6% |
| 15 | N/A | 1.4% | 1.9% | 1.8% | 1.6% | 1.9% |
| 16 | N/A | 1.2% | 1.9% | 2.0% | 1.5% | 2.4% |
| 17 | N/A | 1.2% | 1.6% | 1.7% | 1.4% | 2.3% |
| 18 | N/A | 1.1% | 1.4% | 1.5% | 1.2% | 2.1% |
| 19 | N/A | 0.9% | 1.3% | N/A | N/A | N/A |
| 20 | N/A | 1.0% | 1.2% | N/A | N/A | N/A |
| 21 | N/A | 0.9% | 1.2% | N/A | N/A | N/A |
| 22 | N/A | 0.7% | 1.2% | N/A | N/A | N/A |
| 23 | N/A | 0.9% | 1.2% | N/A | N/A | N/A |
| 24 | N/A | 0.9% | 1.3% | N/A | N/A | N/A |
| 25 | N/A | 0.7% | 1.3% | N/A | N/A | N/A |
| 26 | N/A | 0.9% | 1.8% | N/A | N/A | N/A |
| 27 | N/A | 0.8% | 2.0% | N/A | N/A | N/A |
| 28 | N/A | 0.6% | 1.9% | N/A | N/A | N/A |
| 29 | N/A | 0.6% | 1.8% | N/A | N/A | N/A |
| 30 | N/A | 0.7% | 1.6% | N/A | N/A | N/A |
| 31 | N/A | 1.0% | 1.3% | N/A | N/A | N/A |
| 32 | N/A | 0.9% | 1.2% | N/A | N/A | N/A |
| 33 | N/A | 0.9% | 1.4% | N/A | N/A | N/A |
| 34 | N/A | 1.2% | 1.3% | N/A | N/A | N/A |
Influenza outbreak surveillance
In week 3, 52 laboratory-confirmed influenza outbreaks were reported.
To date this season (August 27, 2023 to January 20, 2024):
- 573 laboratory-confirmed influenza outbreaks have been reported
- 295 were in LTC facilities (52%)
- 144 were in acute care facilities (25%)
- 134 were in a facility categorized as ‘other’ (23%)
- 555 outbreaks were due to influenza A and four outbreaks were due to influenza B; an additional 14 outbreaks were due to a mix of influenza A and influenza B.
- Among outbreaks with subtyping information (162), influenza A(H1N1) was detected in 91% of the outbreaks
- 54 ILI outbreaks have been reported
- All ILI outbreaks have been reported in schools and/or daycares
Outbreaks of ILI are not specific to any one respiratory pathogen and can be due influenza, or other respiratory viruses, including respiratory syncytial virus, rhinovirus, COVID-19, or a mixture of viruses.
Number of provinces and territoriesFootnote 1 reporting in week 3: 11 out of 13
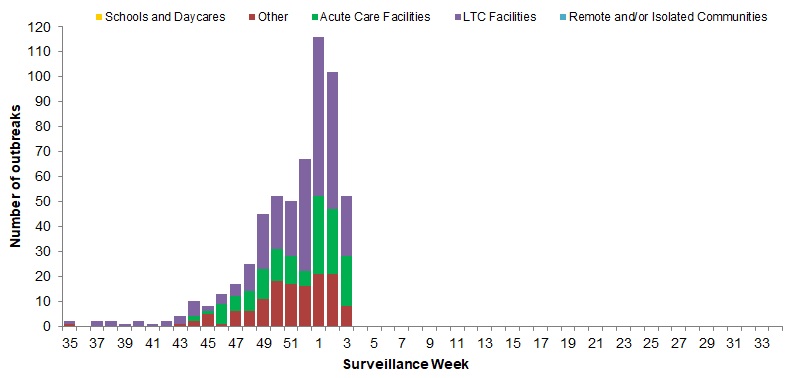
Figure 7 - Text description
| Surveillance Week | Acute Care Facilities | Long Term Care Facilities | Other | Schools and Daycares | Remote and/or Isolated Communities |
|---|---|---|---|---|---|
| 35 | 0 | 1 | 1 | 0 | 0 |
| 36 | 0 | 0 | 0 | 0 | 0 |
| 37 | 0 | 2 | 0 | 0 | 0 |
| 38 | 0 | 2 | 0 | 0 | 0 |
| 39 | 0 | 1 | 0 | 0 | 0 |
| 40 | 0 | 2 | 0 | 0 | 0 |
| 41 | 0 | 1 | 0 | 0 | 0 |
| 42 | 0 | 2 | 0 | 0 | 0 |
| 43 | 0 | 3 | 1 | 0 | 0 |
| 44 | 2 | 6 | 2 | 0 | 0 |
| 45 | 1 | 2 | 5 | 0 | 0 |
| 46 | 8 | 4 | 1 | 0 | 0 |
| 47 | 6 | 5 | 6 | 0 | 0 |
| 48 | 8 | 11 | 6 | 0 | 0 |
| 49 | 12 | 22 | 11 | 0 | 0 |
| 50 | 13 | 19 | 17 | 0 | 0 |
| 51 | 11 | 21 | 16 | 0 | 0 |
| 52 | 5 | 45 | 16 | 0 | 0 |
| 1 | 30 | 62 | 19 | 0 | 0 |
| 2 | 25 | 48 | 14 | 0 | 0 |
| 3 | 20 | 24 | 8 | 0 | 0 |
| 4 | 0 | 0 | 0 | 0 | 0 |
| 5 | 0 | 0 | 0 | 0 | 0 |
| 6 | 0 | 0 | 0 | 0 | 0 |
| 7 | 0 | 0 | 0 | 0 | 0 |
| 8 | 0 | 0 | 0 | 0 | 0 |
| 9 | 0 | 0 | 0 | 0 | 0 |
| 10 | 0 | 0 | 0 | 0 | 0 |
| 11 | 0 | 0 | 0 | 0 | 0 |
| 12 | 0 | 0 | 0 | 0 | 0 |
| 13 | 0 | 0 | 0 | 0 | 0 |
| 14 | 0 | 0 | 0 | 0 | 0 |
| 15 | 0 | 0 | 0 | 0 | 0 |
| 16 | 0 | 0 | 0 | 0 | 0 |
| 17 | 0 | 0 | 0 | 0 | 0 |
| 18 | 0 | 0 | 0 | 0 | 0 |
| 19 | 0 | 0 | 0 | 0 | 0 |
| 20 | 0 | 0 | 0 | 0 | 0 |
| 21 | 0 | 0 | 0 | 0 | 0 |
| 22 | 0 | 0 | 0 | 0 | 0 |
| 23 | 0 | 0 | 0 | 0 | 0 |
| 24 | 0 | 0 | 0 | 0 | 0 |
| 25 | 0 | 0 | 0 | 0 | 0 |
| 26 | 0 | 0 | 0 | 0 | 0 |
| 27 | 0 | 0 | 0 | 0 | 0 |
| 28 | 0 | 0 | 0 | 0 | 0 |
| 29 | 0 | 0 | 0 | 0 | 0 |
| 30 | 0 | 0 | 0 | 0 | 0 |
| 31 | 0 | 0 | 0 | 0 | 0 |
| 32 | 0 | 0 | 0 | 0 | 0 |
| 33 | 0 | 0 | 0 | 0 | 0 |
| 34 | 0 | 0 | 0 | 0 | 0 |
Influenza severe outcomes surveillance
Provincial/territorial influenza hospitalizations and deaths
In week 3, 82 influenza-associated hospitalizations, 10 ICU admissions, and less than five influenza-associated deaths were reported by participating provinces and territoriesFootnote 2.
To date this season (August 27, 2023 to January 20, 2024), 3,300 influenza-associated hospitalizations were reported by participating provinces and territories:
- 98% of the hospitalizations were associated with influenza A.
- Of the cases with subtype information (2,394), 96% were associated with influenza A(H1N1).
- Adults aged 65 years of age and older accounted for 48% of reported hospitalizations. The highest cumulative hospitalization rates were among adults 65 years of age and older (108/100,000) and children under 5 years of age (66/100,000).
To date this season (August 27, 2023 to January 20, 2024), 378 ICU admissions and 155 influenza-associated deaths were reported.
- Adults aged 45-64 years of age and 65 years of age and older accounted for 39% and 31% of reported ICU admissions respectively.
- Adults aged 65 years of age and older accounted for 69% of reported deaths.
Number of provinces and territories reporting in week 3: 8 out of 9
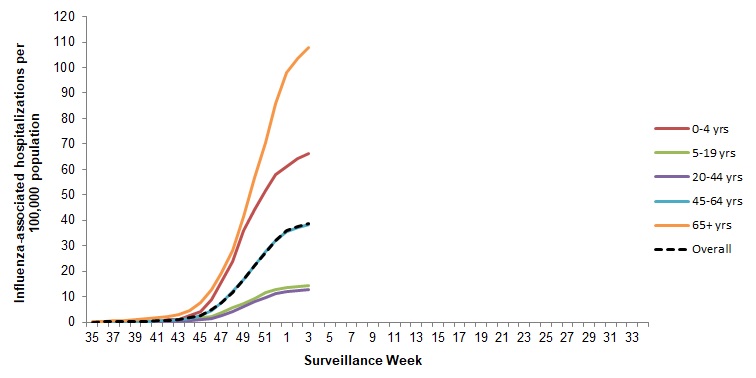
Figure 8 - Text description
| Surveillance Week | 0-4 yrs | 5-19 yrs | 20-44 yrs | 45-64 yrs | 65+ yrs | Overall |
|---|---|---|---|---|---|---|
| 35 | N/A | 0.1 | N/A | 0.0 | 0.2 | 0.0 |
| 36 | N/A | 0.1 | N/A | 0.0 | 0.4 | 0.1 |
| 37 | N/A | 0.1 | N/A | 0.2 | 0.7 | 0.2 |
| 38 | N/A | 0.1 | 0.0 | 0.2 | 0.8 | 0.2 |
| 39 | 0.4 | 0.1 | 0.1 | 0.3 | 1.0 | 0.3 |
| 40 | 0.4 | 0.1 | 0.1 | 0.4 | 1.6 | 0.4 |
| 41 | 0.4 | 0.3 | 0.2 | 0.5 | 1.8 | 0.6 |
| 42 | 0.9 | 0.4 | 0.2 | 0.6 | 2.0 | 0.7 |
| 43 | 0.9 | 0.7 | 0.3 | 0.9 | 2.8 | 1.0 |
| 44 | 2.7 | 1.1 | 0.5 | 1.4 | 4.7 | 1.7 |
| 45 | 4.0 | 1.7 | 0.9 | 2.5 | 7.8 | 2.8 |
| 46 | 9.0 | 2.4 | 1.6 | 4.5 | 13.0 | 4.9 |
| 47 | 16.1 | 3.7 | 2.6 | 7.6 | 19.4 | 7.7 |
| 48 | 24.0 | 5.6 | 4.2 | 12.0 | 28.0 | 11.6 |
| 49 | 35.9 | 7.3 | 6.3 | 16.9 | 41.5 | 16.8 |
| 50 | 44.2 | 9.2 | 8.1 | 22.3 | 56.8 | 22.2 |
| 51 | 51.6 | 11.4 | 9.6 | 27.6 | 70.7 | 27.3 |
| 52 | 58.1 | 12.8 | 11.1 | 32.2 | 85.9 | 32.2 |
| 1 | 61.2 | 13.4 | 12.0 | 35.7 | 98.1 | 35.8 |
| 2 | 64.5 | 13.8 | 12.4 | 37.5 | 102.8 | 37.4 |
| 3 | 66.1 | 14.2 | 12.7 | 38.4 | 108.0 | 38.8 |
| 4 | N/A | N/A | N/A | N/A | N/A | N/A |
| 5 | N/A | N/A | N/A | N/A | N/A | N/A |
| 6 | N/A | N/A | N/A | N/A | N/A | N/A |
| 7 | N/A | N/A | N/A | N/A | N/A | N/A |
| 8 | N/A | N/A | N/A | N/A | N/A | N/A |
| 9 | N/A | N/A | N/A | N/A | N/A | N/A |
| 10 | N/A | N/A | N/A | N/A | N/A | N/A |
| 11 | N/A | N/A | N/A | N/A | N/A | N/A |
| 12 | N/A | N/A | N/A | N/A | N/A | N/A |
| 13 | N/A | N/A | N/A | N/A | N/A | N/A |
| 14 | N/A | N/A | N/A | N/A | N/A | N/A |
| 15 | N/A | N/A | N/A | N/A | N/A | N/A |
| 16 | N/A | N/A | N/A | N/A | N/A | N/A |
| 17 | N/A | N/A | N/A | N/A | N/A | N/A |
| 18 | N/A | N/A | N/A | N/A | N/A | N/A |
| 19 | N/A | N/A | N/A | N/A | N/A | N/A |
| 20 | N/A | N/A | N/A | N/A | N/A | N/A |
| 21 | N/A | N/A | N/A | N/A | N/A | N/A |
| 22 | N/A | N/A | N/A | N/A | N/A | N/A |
| 23 | N/A | N/A | N/A | N/A | N/A | N/A |
| 24 | N/A | N/A | N/A | N/A | N/A | N/A |
| 25 | N/A | N/A | N/A | N/A | N/A | N/A |
| 26 | N/A | N/A | N/A | N/A | N/A | N/A |
| 27 | N/A | N/A | N/A | N/A | N/A | N/A |
| 28 | N/A | N/A | N/A | N/A | N/A | N/A |
| 29 | N/A | N/A | N/A | N/A | N/A | N/A |
| 30 | N/A | N/A | N/A | N/A | N/A | N/A |
| 31 | N/A | N/A | N/A | N/A | N/A | N/A |
| 32 | N/A | N/A | N/A | N/A | N/A | N/A |
| 33 | N/A | N/A | N/A | N/A | N/A | N/A |
| 34 | N/A | N/A | N/A | N/A | N/A | N/A |
Sentinel Pediatric Influenza Severe Outcomes
For the 2023-2024 season, data on pediatric influenza associated severe outcomes are provided by the Surveillance Program for Rapid Identification and Tracking of Infectious Diseases in kids (SPRINT-KIDS) NetworkFootnote 3. The SPRINT-KIDS sentinel pediatric (≤18 years) hospital network provides severe outcome monitoring in both the emergency department and inpatient facilities and consists of 15 pediatric hospitals across 8 provinces in Canada (all provinces with the exception of New Brunswick and Prince Edward Island).
Emergency and Inpatient Influenza Testing
In week 3, 937 tests were conducted for influenza in emergency departments and inpatient wards from 8/15 sites:
- 135 tests (14.4%) were positive for influenza.
- The majority were influenza A (n=131, 97%).
To date this season (October 1, 2023 to January 20, 2024):
- 15,454 tests have been conducted for influenza across 12 sitesFootnote 4.
- 1,954 tests were positive for influenza.
- The majority were influenza A (n=1,903, 97%).
Hospitalizations
In week 3, 31 influenza-associated pediatric hospitalizations were reported from a total of 128 positive influenza tests from 6/15 sites:
- All but one of the hospitalizations were due to influenza A.
To date this season (October 1, 2023 to January 20, 2024):
- 452 influenza-associated pediatric hospitalizations were reported from a total of 1,884 positive influenza tests across 8 sitesFootnote 4.
- The majority were influenza A (n=442, 98%).
Influenza strain characterization
Since September 1, 2023, the National Microbiology Laboratory Branch (NMLB) has characterized 612 influenza viruses (98 A(H3N2), 458 A(H1N1), and 56 influenza B) received from Canadian laboratories.
Antigenic Characterization
Changes in circulating influenza viruses are monitored by antigenic characterization. Antigenic characterization results show how similar the circulating viruses are to reference viruses. Reference viruses represent strains included in the current seasonal influenza vaccine.
Influenza A(H1N1)
A/Wisconsin/67/2022 is the influenza A(H1N1) component of the 2023-2024 Northern Hemisphere influenza vaccine.
- 448 H1N1 viruses were characterized as antigenically similar to A/Wisconsin/67/2022-like with antisera produced against cell-grown A/Wisconsin/67/2022.
- 10 influenza A(H1N1) showed reduced titer with antisera raised against cell-grown A/Wisconsin/67/2022.
Influenza A(H3N2)
A/Darwin/6/2021 (H3N2)-like virus is the influenza A(H3N2) component of the 2023-2024 Northern Hemisphere influenza vaccine.
- 96 influenza A(H3N2) were antigenically similar to A/Darwin/6/2021 (H3N2)-like virus using antisera raised against cell-grown A/Darwin/6/2021 (H3N2)-like virus.
- 2 influenza A(H3N2) showed reduced titer with antisera raised against cell-grown A/Darwin/6/2021 (H3N2)-like virus.
Influenza B
Influenza B viruses can be divided into two antigenically distinct lineages represented by B/Yamagata/16/88 and B/Victoria/2/87 viruses. The recommended influenza B components for the 2023-2024 Northern Hemisphere influenza vaccine are B/Austria/1359417/2021 (Victoria lineage) and B/Phuket/3073/2013 (Yamagata lineage)
- 56 viruses characterized were antigenically similar to B/Austria/1359417/2021.
Genetic Characterization
Genetic characterization is used to determine how similar gene sequences of circulating influenza viruses are to the sequences of the vaccine components used in the current seasonal influenza vaccine.
Since September 1, 2023, NML has genetically characterized 546 influenza viruses.
| Virus Subtype or Lineage | HA Clade | Number of Viruses Characterized | HA Subclade | Number of viruses Characterized | HA genetic clades and subclades of the 2023-2024 Northern Hemisphere influenza vaccine components |
|---|---|---|---|---|---|
| A(H1N1) | 6B.1A.5a | 314 | 2a | 175 | The A(H1N1) component belongs to genetic clade 6B.1A.5a.2a.1 |
| 2a.1 | 244 | ||||
| A(H3N2) | 3C.2a1b.2a | 60 | 2a.1b | 3 | The A(H3N2) component belongs to genetic clade 3C.2a1b.2a.2a |
| 2a.3a | 1 | ||||
| 2a.3a.1 | 77 | ||||
| B/Victoria | V1A | 27 | 3a.2 | 46 | The B/Victoria component belongs to genetic clade V1A.3 |
| B/Yamagata | Y3 | 0 | Y3 | 0 | The B/Yamagata component belongs to genetic clade Y3 |
Antiviral resistance
The National Microbiology Laboratory has not yet reported antiviral resistance results for influenza viruses collected during the 2023-2024 season.
Oseltamivir
509 influenza viruses (81 H3N2, 389 H1N1 and 39 influenza B) were tested for resistance to oseltamivir.
- One of the 389 influenza A (H1N1) viruses was resistant to oseltamivir.
- All influenza A(H3N2) viruses and B viruses were sensitive to oseltamivir.
Zanamivir
509 influenza viruses (81 H3N2, 389 H1N1 and 39 influenza B) were tested for resistance to zanamivir.
- All influenza viruses were sensitive to zanamivir.
Influenza vaccine monitoring
Vaccine monitoring refers to activities related to the monitoring of influenza vaccination coverage and vaccine effectiveness.
Vaccination coverage
Influenza vaccine coverage estimates for the 2023-2024 season are anticipated to be available in February or March 2024.
Vaccine effectiveness
Influenza vaccine effectiveness estimates for the 2023-2024 season are anticipated to be available in February or March 2024.
Provincial and international surveillance links
See Influenza surveillance resources
Notes
The data in the FluWatch report represent surveillance data available at the time of writing. All data are preliminary and may change as updates are received.
To learn more about the FluWatch program, see the Overview of influenza monitoring in Canada page.
For more information on the flu, see our Flu (influenza) web page.
We would like to thank all the FluWatch surveillance partners participating in this year's influenza surveillance program.
This report is available on the Government of Canada Influenza webpage.
Ce rapport est disponible dans les deux langues officielles.
- Footnote 1
-
All Provinces and Territories (PTs) participate in the FluWatch outbreak surveillance system. This outbreak system monitors influenza and ILI outbreaks in long-term care facilities (LTCF), acute care facilities, schools and daycares, remote and/or isolated communities, and facilities categorized as 'other'. Not all reporting PTs report outbreaks in all these settings. All PTs report laboratory confirmed outbreaks in LTCF. Six PTs (AB, SK, NB, NS, PEI, and NL) report ILI outbreaks in schools and/or daycares and other facilities.
- Footnote 2
-
Influenza-associated hospitalizations are reported by Alberta, Manitoba, New Brunswick, Newfoundland and Labrador, Northwest Territories, Nova Scotia, Prince Edward Island and Yukon. Only hospitalizations that require intensive medical care are reported by Saskatchewan.
- Footnote 3
-
Sentinel pediatric severe outcome surveillance data was previously provided by the Immunization Monitoring Program ACTive (IMPACT) network. The change in the sentinel network will affect the comparability of pediatric hospitalization data from the 2023-2024 season to previous seasons as the number of hospitalizations (weekly and cumulative) may appear higher due to a greater number of sentinel sites.
- Footnote 4
-
Represents total number of sites reporting this data to date this season; some sites may not have reported data every week.