Page 8: HIV and AIDS in Canada: Surveillance Report to December 31, 2014 - Results: At a glance
Results: At a glance
HIV surveillance
Time trends
(See Table 1)
A cumulative total of 80,469 HIV cases have been reported to PHAC since HIV reporting began in Canada in 1985. In 2014, 2,044 HIV cases were reported, which represents a 1.5% decrease from the 2,076 cases reported in 2013 and is the lowest number of annual HIV cases since reporting began in 1985.
Figure 1 illustrates the annual trends for reported HIV cases from 1996 to 2014. A steady decrease of reported HIV cases was observed up until the year 2000. From 2002 to 2008, the annual number of HIV cases remained stable, fluctuating between 2,439 and 2,620. Since 2008, the number of reported HIV cases each year has gradually declined.
Figure 1: Number of reported HIV cases by year of test - Canada, 1996-2014

Figure 1: Number of reported HIV cases by year of test - Canada, 1996-2014 - Text Description
| Year of test | Number of cases reported to PHAC |
|---|---|
| 1996 | 2,729 |
| 1997 | 2,460 |
| 1998 | 2,290 |
| 1999 | 2,184 |
| 2000 | 2,092 |
| 2001 | 2,216 |
| 2002 | 2,460 |
| 2003 | 2,468 |
| 2004 | 2,520 |
| 2005 | 2,476 |
| 2006 | 2,537 |
| 2007 | 2,439 |
| 2008 | 2,620 |
| 2009 | 2,391 |
| 2010 | 2,330 |
| 2011 | 2,290 |
| 2012 | 2,081 |
| 2013 | 2,076 |
| 2014 | 2,044 |
Age group
(See Table 4A)
In 2014, the largest proportion of HIV cases were diagnosed among people aged 30-39 years (31.6%), followed by the 40-49 year age group (22.8%). The proportion of HIV cases among those aged 50 or older increased from 15.0% in 2009 to 21.9% in 2014, surpassing the 20-29 year age group (21.4%) as the third-highest proportion of cases in 2014 (Figure 2).
Figure 2: Number of reported HIV cases by age group and year of test - Canada, 2009-2014
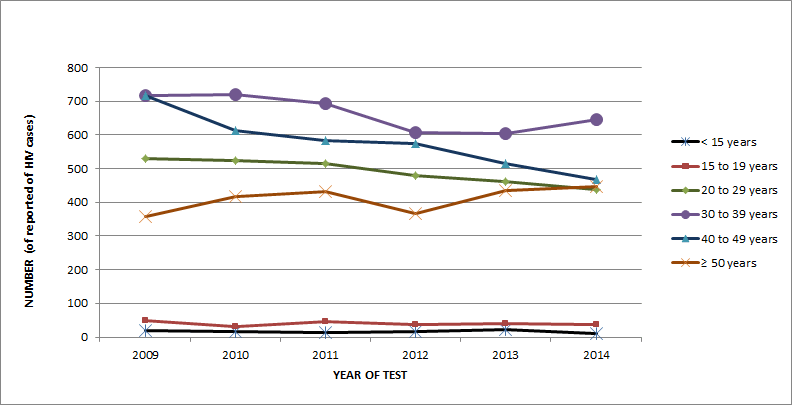
Figure 2: Number of reported HIV cases by age group and year of test - Canada, 2009-2014 - Text Description
| Age group | 2009 | 2010 | 2011 | 2012 | 2013 | 2014 |
|---|---|---|---|---|---|---|
| Children < 15 years | 20 | 16 | 12 | 16 | 21 | 9 |
| 15 to 19 years | 48 | 31 | 45 | 36 | 39 | 37 |
| 20 to 29 years | 530 | 523 | 516 | 478 | 460 | 437 |
| 30 to 39 years | 715 | 718 | 694 | 608 | 604 | 645 |
| 40 to 49 years | 716 | 612 | 582 | 575 | 514 | 466 |
| ≥ 50 years | 357 | 418 | 431 | 366 | 434 | 448 |
Age group and sex
(See Tables 2-4C)
In 2014, sex was reported for 99.6% of HIV cases, of which 24.6% were female. Over the past decade, the annual proportion of reported HIV cases among adults (≥15 years) that were female remained stable at approximately one quarter (range: 23.0% - 27.6%). However, the cumulative age distribution from 1985 to 2014 differed between females and males. HIV was diagnosed generally at younger age groups (≤15, 15-19, and 20-29 years old) among females compared to males, where a greater proportion of HIV cases were diagnosed at older age groups (30-39, 40-49, and 50+ years old) (Figure 3).
Figure 3: Age group distribution of reported HIV cases by sex - Canada, 1985-2014

Figure 3: Age group distribution of reported HIV cases by sex - Canada, 1985-2014 - Text Description
| Age group | Males | Females |
|---|---|---|
| < 15 years | 0.6 | 1.9 |
| 15 to 19 years | 1.1 | 3.8 |
| 20 to 29 years | 23.4 | 30.4 |
| 30 to 39 years | 38 | 36.5 |
| 40 to 49 years | 24 | 17.9 |
| ≥ 50 years | 11.6 | 9 |
| Adult, age unknown | 1.3 | 0.6 |
Exposure category
(See Tables 5A-5E)
Trends in exposure category have shifted since HIV reporting began in 1985. In the early stages of the epidemic, more than 80% of all reported HIV cases with known exposure category were attributed to the "men who have sex with men" (MSM) exposure category. Although this exposure category is still predominant in Canada, the proportion has decreased over the years.
In 2014, among cases where exposure category was known (65.7%), 48.8% of all reported HIV cases in adults (≥ 15 years old) were attributed to the MSM exposure category (Figure 4). The second-most reported exposure category among adults was heterosexual contact (29.2%), with a near-even distribution of HIV cases attributed to heterosexual contact among people born in a country where HIV is endemic (See Appendix 4) (Het-Endemic, 10.0%), heterosexual contact with a person at risk (Het-Risk, 9.2%) and heterosexual contact with no identified risk (NIR-Het, 10.0%). The third-most frequently reported exposure category among adults in 2014 was injection drug use (IDU), accounting for 13.1% of reported HIV cases.
Figure 4: Proportion of reported HIV cases among adults (≥ 15 years old) by exposure category - Canada, 2014

Figure 4: Proportion of reported HIV cases among adults (≥ 15 years old) by exposure category - Canada, 2014 - Text Description
| Exposure category | Percentage |
|---|---|
| MSM | 48.8 |
| MSM/IDU | 2.8 |
| IDU | 13.1 |
| Blood/Blood products | 0.1 |
| Het-Endemic | 10 |
| Het-risk | 9.2 |
| NIR-Het | 10 |
| Other | 6 |
Exposure category and sex
(See Tables 5A-5E)
The distribution of HIV cases among adult males and females (≥ 15 years old) differs with respect to exposure category. In 2014, the MSM exposure category accounted for the greatest proportion (63.3%) of reported HIV cases among adult males, whereas heterosexual contact (including the Het-Endemic, Het-Risk and Het-NIR groups) accounted for 63.9% of cases among adult females (Figures 5-6). With respect to heterosexual contact, there was a substantial difference between males and females in the Het-Endemic exposure category, which accounted for 25.5% of heterosexual contact cases among females compared to 5.4% among males.
The IDU exposure category accounted for approximately one-quarter of adult female HIV cases (24.5%), compared to up to 13.2% of adult male HIV cases (9.6% via IDU exposure and up to 3.6% in the MSM/IDU category).
Figure 5: Proportion of reported HIV cases among adult males (≥ 15 years old) by exposure category - Canada, 2014

Figure 5: Proportion of reported HIV cases among adult males (≥ 15 years old) by exposure category - Canada, 2014 - Text Description
| Exposure category | Percentage |
|---|---|
| MSM | 63.3 |
| MSM/IDU | 3.6 |
| IDU | 9.6 |
| Blood/Blood products | 0.2 |
| Het-Endemic | 5.4 |
| Het-risk | 5.9 |
| NIR-Het | 7.6 |
| Other | 4.4 |
Figure 6: Proportion of reported HIV cases among adult females (≥ 15 years old) by exposure category - Canada, 2014

Figure 6: Proportion of reported HIV cases among adult females (≥ 15 years old) by exposure category - Canada, 2014 - Text Description
| Exposure category | Percentage |
|---|---|
| IDU | 24.5 |
| Blood/Blood products | 0 |
| Het-Endemic | 25.5 |
| Het-risk | 20.2 |
| NIR-Het | 18.2 |
| Other | 11.6 |
Race/ethnicity distribution
(See Tables 6A-6C)
In 2014, information on race/ethnicity was available for nearly two-thirds (58.3%) of reported HIV cases. While this is an improvement from the years prior to 2009, national trends presented in this report must be interpreted with caution given that a substantial number of HIV cases are not included in the race/ethnicity analysis. These data may not be fully representative of the national picture because race/ethnicity data for HIV cases from jurisdictions with more diverse populations are not included.
In 2014, nearly one half of reported HIV cases were identified as White (45.0%), followed by Black (19.7%) and Aboriginal (16.2%) (Figure 7). The breakdown of the Aboriginal group is as follows: 12.3% First Nations, 1.9% Métis, 1.8% Aboriginal-unspecified and 0.1% Inuit. The breakdown among the Aboriginal subgroups from 2009 to 2014 is shown in Figure 8.
Figure 7: Proportion of reported HIV cases (all ages) by race/ethnicity and by year of test- Canada, 2009-2014
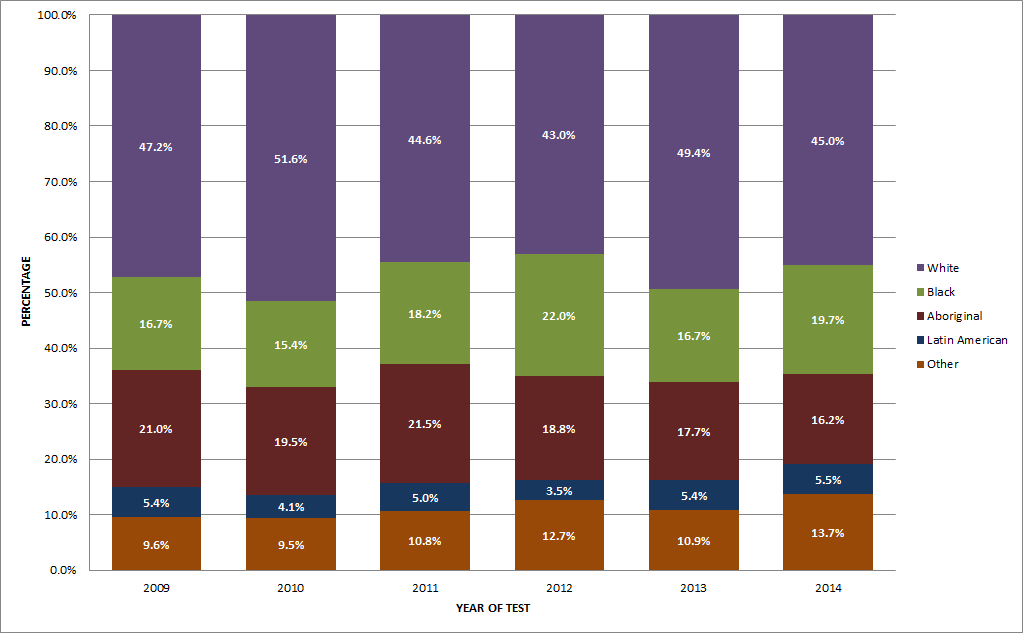
"Other" includes Asian, South Asian, West Asian, Arab and other race/ethnicity
Figure 7: Proportion of reported HIV cases (all ages) by race/ethnicity and by year of test- Canada, 2009-2014 - Text Description
| Race/ethnicity | 2009 | 2010 | 2011 | 2012 | 2013 | 2014 |
|---|---|---|---|---|---|---|
| White | 47% | 52% | 45% | 43% | 49% | 45% |
| Black | 17% | 15% | 18% | 22% | 17% | 20% |
| Aboriginal | 21% | 20% | 21% | 19% | 18% | 16% |
| Latin American | 5% | 4% | 5% | 4% | 5% | 5% |
| South Asian/West Asian/Arab/Asian/Other | 10% | 9% | 11% | 13% | 11% | 14% |
Figure 8: Proportion of reported HIV cases among Aboriginal subgroups (all ages) by year of test - Canada, 2009-2014
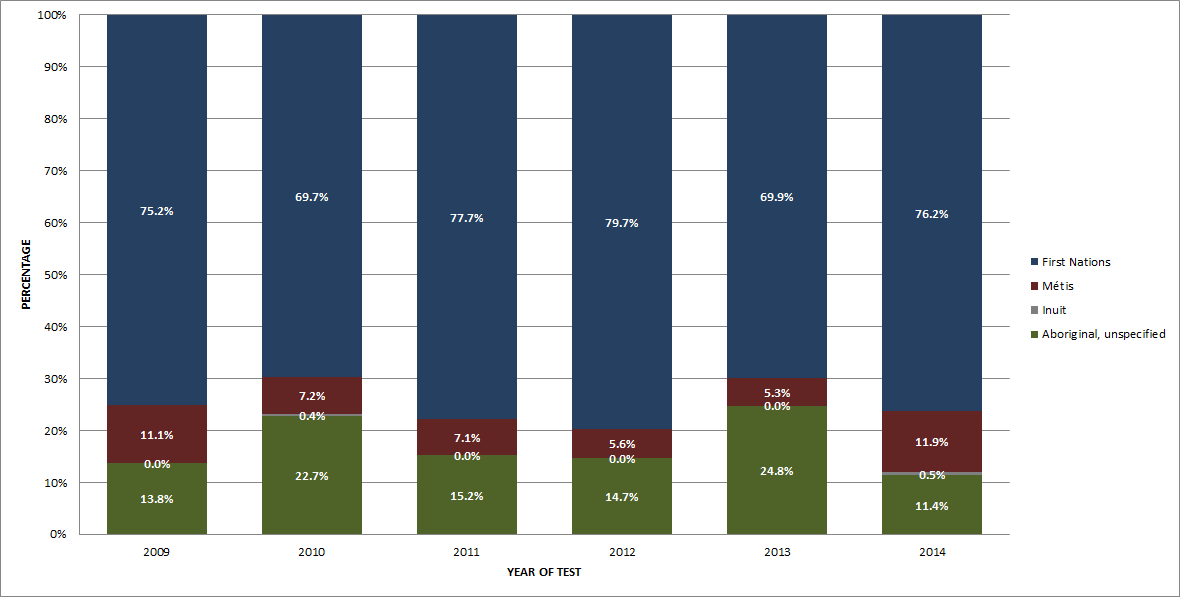
Figure 8: Proportion of reported HIV cases among Aboriginal subgroups (all ages) by year of test - Canada, 2009-2014 - Text Description
| Aboriginal | 2009 | 2010 | 2011 | 2012 | 2013 | 2014 |
|---|---|---|---|---|---|---|
| First Nations | 75.20% | 69.70% | 77.70% | 79.70% | 69.90% | 76.20% |
| Métis | 11.10% | 7.20% | 7.10% | 5.60% | 5.30% | 11.90% |
| Inuit | 0.00% | 0.40% | 0.00% | 0.00% | 0.00% | 0.50% |
| Aboriginal, unspecified | 13.80% | 22.70% | 15.20% | 14.70% | 24.80% | 11.40% |
The race/ethnicity distribution varied by sex in 2014: among males, the majority of cases were White (51.2%), followed by Black (14.9%) and Aboriginal (11.8%) (Figure 9). By comparison, among females, just over one-third were Black (35.6%), followed by Aboriginal (30.6%) and White (24.2%) (Figure 9).
Figure 9: Proportion of reported HIV cases (all ages) by sex and race/ethnicity - Canada, 2014
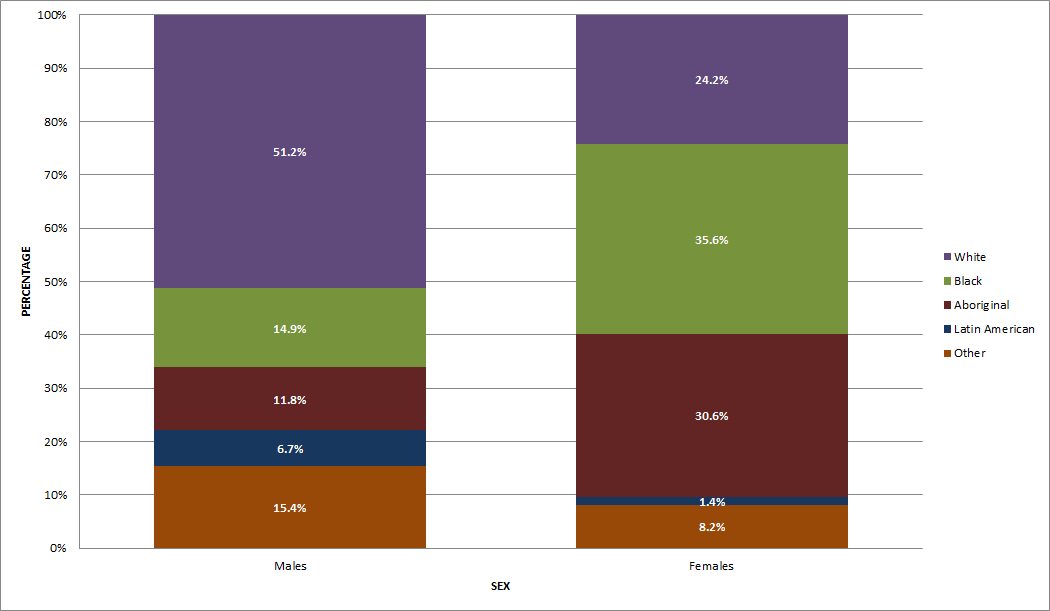
"Other" includes Asian, South Asian, West Asian, Arab and other race/ethnicity
Figure 9: Proportion of reported HIV cases (all ages) by sex and race/ethnicity - Canada, 2014 - Text Description
| Race/ethnicity | Males | Females |
|---|---|---|
| White | 51% | 24% |
| Black | 15% | 36% |
| Aboriginal | 12% | 31% |
| Latin American | 7% | 1% |
| Other | 15% | 8% |
Race/ethnicity and exposure category
(See Tables 6D and 6E)
Information on both race/ethnicity and exposure category was available for 41.0% of reported cases from 1998 to 2014. Given that a substantial number of HIV cases were not reported with both of these data elements, this section is likely not representative of the overall distribution by exposure category and race/ethnicity in Canada.
Among HIV cases attributed to the MSM exposure category, the majority (72.0%) were identified as White (Figure 10). Almost all HIV cases attributed to IDU exposure were either Aboriginal (50.6%) or White (45.4%). Among cases attributed to the Het-Endemic category (one of the exposure categories falling under heterosexual contact), 93.8% were identified as Black.
Figure 10: Proportion of reported HIV cases (all ages) by exposure category and race/ethnicity - Canada, 1998-2014
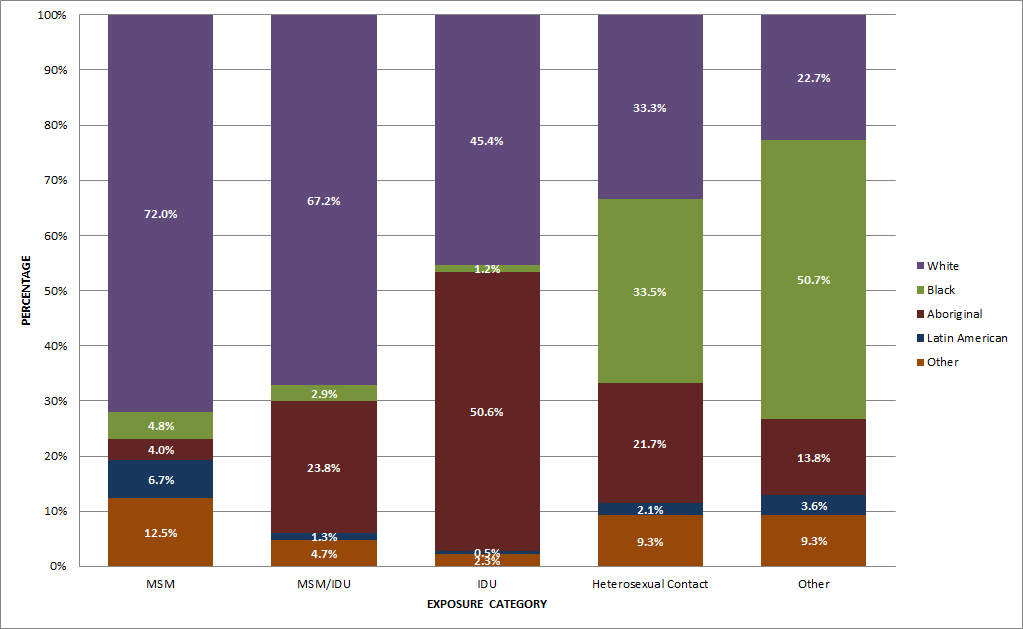
"Other" includes Asian, South Asian, West Asian, Arab and other race/ethnicity
Figure 10: Proportion of reported HIV cases (all ages) by exposure category and race/ethnicity - Canada, 1998-2014 - Text Description
| Race/ethnicity | MSM | MSM/IDU | IDU | Heterosexual Contact | Other |
|---|---|---|---|---|---|
| White | 72.00% | 67.20% | 45.40% | 33.30% | 22.70% |
| Black | 4.80% | 2.90% | 1.20% | 33.50% | 50.70% |
| Aboriginal | 4.00% | 23.80% | 50.60% | 21.70% | 13.80% |
| Latin American | 6.70% | 1.30% | 0.50% | 2.10% | 3.60% |
| South Asian/West Asian/Latin American/Other | 12.50% | 4.70% | 2.30% | 9.30% | 9.30% |
Geographic distribution
(See Tables 7A-7H)
In 2014, Ontario accounted for the highest number and proportion of reported HIV cases in Canada (n=837, 40.9%), followed by Quebec (n=435, 21.3%), Alberta (n=276, 13.5%), British Columbia (n=262, 12.8%) and Saskatchewan (n=121, 5.9%).
HIV diagnosis rates across Canada are shown in Figure 11. The national rate (all ages) of HIV diagnosis in Canada in 2014 was 5.8 per 100,000 population. The highest rate (per 100,000 population) was in Saskatchewan (10.8) followed by Yukon (8.2), Alberta (6.7), Manitoba (6.6) and Ontario (6.1). In all provinces except Saskatchewan, the all-age HIV diagnosis rate remained relatively similar in 2014 compared to recent years. In Saskatchewan, the all-age HIV diagnosis rate reached a high of 19.2 per 100,000 population in 2009, with annual decreases thereafter to a rate of 10.8 per 100,000 population in 2014.
Figure 11: All-age HIV diagnosis rate (per 100,000 population) by province/territory - Canada, 2014
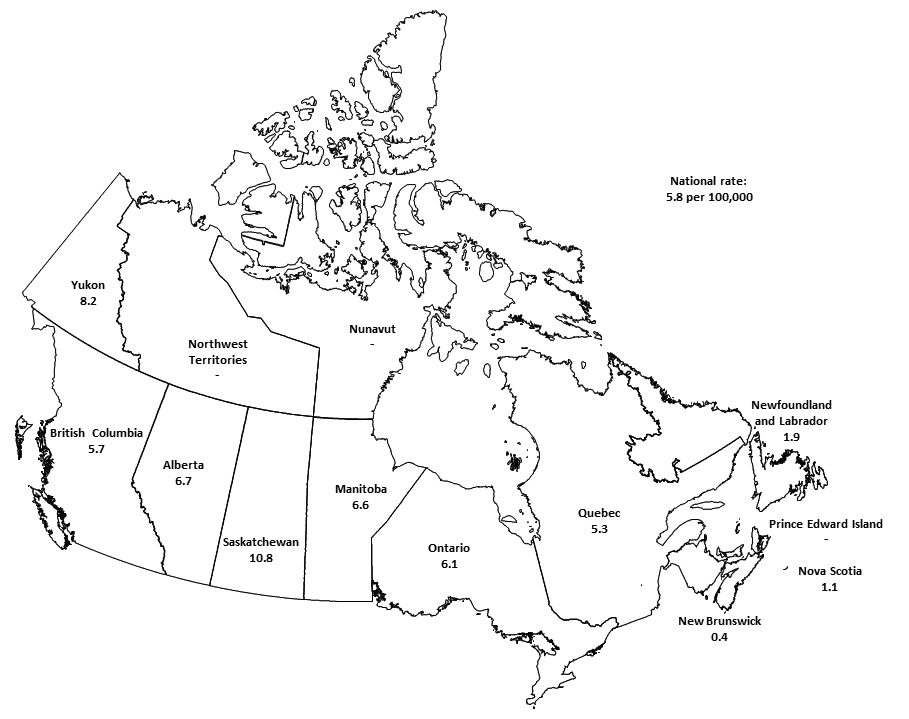
Figure 11: All-age HIV diagnosis rate (per 100,000 population) by province/territory - Canada, 2014 - Text Description
| Province/territory | 2014 | |||||||||||||||
|---|---|---|---|---|---|---|---|---|---|---|---|---|---|---|---|---|
| British Columbia | 5.7 | |||||||||||||||
| Yukon | 8.2 | |||||||||||||||
| Alberta | 6.7 | |||||||||||||||
| Northwest Territories | - | |||||||||||||||
| Nunavut | - | |||||||||||||||
| Saskatchewan | 10.8 | |||||||||||||||
| Manitoba | 6.6 | |||||||||||||||
| Ontario | 6.1 | |||||||||||||||
| Quebec | 5.3 | |||||||||||||||
| New Brunswick | 0.4 | |||||||||||||||
| Nova Scotia | 1.1 | |||||||||||||||
| Prince Edward Island | - | |||||||||||||||
| Newfoundland and Labrador | 1.9 | |||||||||||||||
| Total | 5.8 | |||||||||||||||
Immigration medical screening for HIV
(See Table 8)
In 2012, a total of 1,091,876 foreign nationals obtained temporary residence status in Canada and 257,887 foreign nationals obtained permanent residence statusFootnote 10. From January 15, 2002 to December 31, 2012 there were 5,777 applicants screened in Canada or overseas who tested positive for HIVFootnote 11. In 2012, there were 534 applicants, of which 231 were screened in Canada and 303 were screened overseas who tested positive for HIV. However, not all applicants with HIV diagnoses were admissible for residency, nor did all applicants screened and diagnosed with HIV overseas land in Canada.
The following analysis focuses on applicants who underwent an IME in Canada between January 15, 2002 and December 31, 2011 and applicants who landed in Canada between January 1, 2005 and December 31, 2012 (and underwent an IME overseas).
Of applicants screened in Canada from 2002 to 2011, a total of 3,004 were diagnosed with HIV infection, at an average of 300 per year (ranging from 210 in 2011 to 373 in 2006)Footnote 12. These included applicants who were admissible for residency as well as those who were not. More than half of the HIV-positive applicants were male (56.7%) and the majority of all applicants tested in Canada were 30 to 39 years old (42.5%) or 20 to 29 years old (24.5%) (Figure 12). The greatest proportion of the HIV-positive applicants resided in Ontario (54.4%), followed by Quebec (26.9%), British Columbia (8.4%), Alberta (5.8%), and Manitoba (2.8%), with less than 1% of the remaining HIV-positive applicants residing in the other provinces or territories. The three most frequently reported countries of birth were Zimbabwe (13.6%), Mexico (8.2%), and Haiti (6.4%). Among all HIV cases, 67.2% were born in HIV-endemic countries.
Of applicants screened overseas from 2005 to 2012 who landed in Canada, 1,058 were diagnosed with HIV infection, at an average of 132 per year (ranging from 84 in 2009 to 183 in 2008)Footnote 13. Just over half (52.4%) were females. The majority (41.9%) were 30 to 39 years old, followed by those 20 to 29 years old (26.6%) (Figure 12). Ontario was the most common intended province of residence (33.5%), followed by Quebec (24.4%), Alberta (15.1%), British Columbia (12.9%), Manitoba (9.1%), Saskatchewan (2.9%) and the Atlantic provinces (2.1%). Among HIV-positive applicants, 69.5% were born in HIV-endemic countries, with Ethiopia (19.6%), Democratic Republic of Congo (9.7%) and Burundi (5.6%) being the most frequently reported countries of birth.
Figure 12: Age group distribution of HIV-positive immigration applicants tested overseas and immigration applicants tested in Canada

Figure 12: Age group distribution of HIV-positive immigration applicants tested overseas and immigration applicants tested in Canada - Text Description
| Age group | Tested in Canada | Tested overseas |
|---|---|---|
| <15 | 0.5 | 5.2 |
| 15-19 | 1.5 | 4.3 |
| 20-29 | 24.5 | 26.6 |
| 30-39 | 42.5 | 41.9 |
| 40-49 | 23.7 | 18.4 |
| 50+ | 7.2 | 3.7 |
Canadian Perinatal HIV Surveillance Program
(See Tables 9-13)
From 1984 to 2014, 4,279 infants in Canada were identified as being perinatally exposed to HIV. The number of HIV-exposed infants reported per birth year between 2005 and 2014 fluctuated from a low of 200 in 2009 to a high of 249 in 2010. In 2014, 233 infants were reported as being perinatally exposed to HIV, up from 207 in 2013.
Although the number of infants perinatally exposed to HIV has increased over time, the proportion of infants born in Canada and confirmed to be HIV-infected has decreased from over 25% before the advent of antiretroviral treatment during pregnancy [Zidovudine (AZT) monotherapy after 1994, highly active antiretroviral therapy (HAART) after 1996] to less than 1% in 2014 (data not shown). Two HIV transmissions were confirmed in the 233 perinatally exposed infants born in 2014. Correspondingly, the proportion of HIV-positive mothers receiving antiretroviral therapy (ART) increased over time to 97.4% in 2014 (Figure 13).
Figure 13: Number of perinatally HIV-exposed infants and proportion of perinatally HIV-exposed infants receiving perinatal ART by year of birth - Canada, 2007-2014
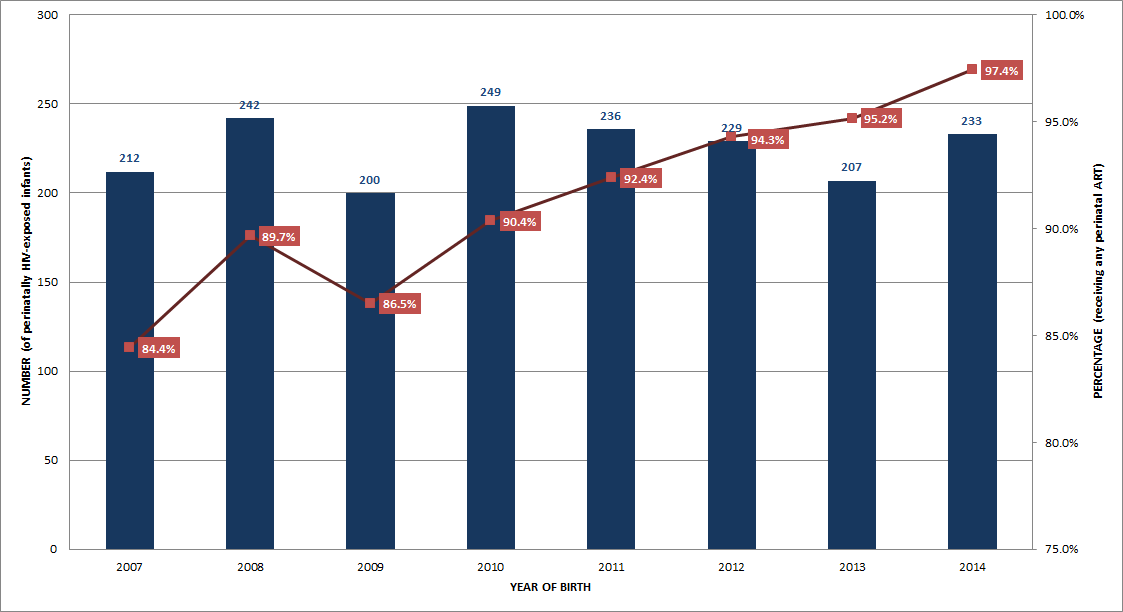
Figure 13: Number of perinatally HIV-exposed infants and proportion of perinatally HIV-exposed infants receiving perinatal ART by year of birth - Canada, 2007-2014 - Text Description
| Year of test | Total Perinatally HIV-exposed Infants | Percentage Receiving Perinatal ART |
|---|---|---|
| 2007 | 212 | 84.40% |
| 2008 | 242 | 89.70% |
| 2009 | 200 | 86.50% |
| 2010 | 249 | 90.40% |
| 2011 | 236 | 92.40% |
| 2012 | 229 | 94.30% |
| 2013 | 207 | 95.20% |
| 2014 | 233 | 97.40% |
A review of all perinatally exposed infants from 1984 to 2014 shows that the majority (74.2%) were born to mothers who acquired HIV infection through heterosexual contact, whereas just over one-fifth (22.8%) were attributed to IDU exposure. With respect to race/ethnicity distribution of the infants, almost half (49.8%) were reported as Black, one-quarter (25.0%) as White, and almost one-fifth (17.0%) as Aboriginal. Maternal region of birth for the majority of infants was North America (42.7%), Africa (37.5%), or the Caribbean (10.5%).
AIDS surveillance
Number of cases
(See Table 14)
From 1979 to December 31, 2014, a cumulative total of 23,535 AIDS cases have been reported to PHAC. The annual number of reported AIDS cases in Canada has decreased steadily since the mid-1990s, largely as a result of the introduction of HAART in 1996. In more recent years, this decrease was partly due to the fact that some provinces no longer report AIDS cases.
In 2014, there were 188 AIDS cases reported to PHAC, down from 226 in 2013 and an 89.8% decrease relative to 1993, when the highest number of AIDS cases were reported (n=1,838) (Figure 14).
Figure 14: Number of reported AIDS cases by year of diagnosis - Canada, 1979-2014

Figure 14: Number of reported AIDS cases by year of diagnosis - Canada, 1979-2014 - Text Description
| Year of test | Total Perinatally HIV-exposed Infants |
|---|---|
| 1979 | 2 |
| 1980 | 3 |
| 1981 | 10 |
| 1982 | 26 |
| 1983 | 64 |
| 1984 | 162 |
| 1985 | 403 |
| 1986 | 690 |
| 1987 | 1,014 |
| 1988 | 1,179 |
| 1989 | 1,411 |
| 1990 | 1,473 |
| 1991 | 1,533 |
| 1992 | 1,758 |
| 1993 | 1,838 |
| 1994 | 1,805 |
| 1995 | 1,676 |
| 1996 | 1,216 |
| 1997 | 753 |
| 1998 | 674 |
| 1999 | 585 |
| 2000 | 545 |
| 2001 | 457 |
| 2002 | 459 |
| 2003 | 429 |
| 2004 | 357 |
| 2005 | 434 |
| 2006 | 398 |
| 2007 | 371 |
| 2008 | 367 |
| 2009 | 296 |
| 2010 | 276 |
| 2011 | 234 |
| 2012 | 223 |
| 2013 | 226 |
| 2014 | 188 |
Age and sex distribution
(See Tables 15-17C)
Data on age and sex were available for 90.4% of reported AIDS cases for 2014. In 2014, the greatest proportion of cases were 40 to 49 years old (33.0%), followed by cases aged 30-39 years old (25.0%) and 50 years and older (21.3%).
In 2014, one AIDS case was reported in a child aged 10-14. Among adults (≥15 years old) where sex was known, the majority of reported AIDS cases were male (75.4%). Similar to HIV trends, the age distribution of AIDS cases differed by sex (Figure 15). Among females, a greater proportion of cases were observed in younger age groups (≤15, 15-19 and 20-29 years old) compared to males, where a greater proportion of cases were observed in older age groups (30-39, 40-49 and 50+ years old).
Figure 15: Age group distribution of reported AIDS cases by sex - Canada, 1979-2014

Figure 15: Age group distribution of reported AIDS cases by sex - Canada, 1979-2014 - Text Description
| Age group | Males | Females |
|---|---|---|
| <15 | 0.60% | 4.90% |
| 15-19 | 0.30% | 1.20% |
| 20-29 | 14.10% | 22.10% |
| 30-39 | 42.00% | 37.10% |
| 40-49 | 29.40% | 21.90% |
| > 50 | 13.60% | 12.90% |
Exposure category
(See Tables 18A-18E) In 2014, nearly half (48.7%) of reported AIDS cases had missing information on exposure category; therefore, no further analysis is presented.
Race/ethnicity
(See Table 19)
Similar to exposure category, half of AIDS cases in 2014 (50.0%) were missing race/ethnicity information compared to 2012 (61.6%); therefore, no further analysis is presented.
Geographic distribution
(See Tables 20A-20E)
In 2014, the largest number and proportion of AIDS cases were reported in Ontario (n=69, 36.7%), followed by British Columbia (n=55, 29.2%) and Alberta (n=32, 17.0%).
AIDS mortality
(See Tables 21-24)
The Vital Statistics - Death database shows that the numbers of annual deaths attributed to HIV infection have been declining since 1996. The lowest recorded number of deaths attributed to HIV infection (n=303) was reported in 2011 (the most recent year for which data are available).
Data limitations
The National HIV/AIDS surveillance system data have several limitations that should be considered in the interpretation of possible trends. Some limitations apply to surveillance data in general, such as variation in reporting practices across jurisdictions, reporting delays, under-reporting, duplicate reports, missing or incomplete data and limitations related to AIDS surveillance and associated mortality data. It is also important to consider the possible effect of individual or societal behaviour changes over time that contribute to changes in observed disease trends, such as changes in HIV testing patterns (e.g., who comes forward for testing and when). Appendix 5 contains more comprehensive descriptions of the data limitations.
Footnotes
Page details
- Date modified: