
Report on Hepatitis B and C in Canada: 2018
Download the alternative format
(PDF format, 1.82 MB, 25 pages)
Public Health Agency of Canada
Date published: 2021-06-29
Cat.: HP37-22E-PDF
ISBN: 2369-3843
Pub.: 200215
Table of contents
- Acknowledgments
- Executive summary
- References
- List of appendices and supplementary tables and figures
Acknowledgments
The publication of this report would not have been possible without the collaboration of epidemiological units in all provinces and territories, whose continuous contribution to national hepatitis B virus infection and hepatitis C virus infection surveillance is gratefully appreciated.
This report was prepared by the Centre for Communicable Diseases and Infection Control, Infectious Diseases Programs Branch, Public Health Agency of Canada. Any comments and suggestions that would improve the usefulness of future publications are appreciated and should be sent to the attention of the Centre for Communicable Diseases and Infection Control, Public Health Agency of Canada at phac.sti-hep-its.aspc@canada.ca.
Executive summary
Hepatitis B
In 2018, a total of 4,783 cases of hepatitis B virus (HBV) infection were reported in Canada, similar to the total number of cases reported in 2017 (4,905).
Acute HBV
In 2018, a total of 189 cases of acute HBV infection were reported in Canada, corresponding to a national rate of 0.52 per 100,000 population. Rates of acute HBV infection have plateaued in the past five years.
Rates of acute HBV were consistently higher among males compared to females between 2009 and 2018, except for younger age groups (<30 years of age). However, the gap between rates of reported acute HBV infection among females vs. males appears to be narrowing. The rate increased by 41% among females between 2009 and 2018, from 0.26 to 0.36 per 100,000 females, while among males, it decreased by nearly 21% over this same period, from 0.83 to 0.66 per 100,000 males. In 2018, the highest rate of acute HBV infection was found in the 40 to 59 year age group among males, and in the 25 to 29 year age group among females.
Chronic HBV
In 2018, there were 3,843 cases of chronic HBV infection reported in Canada, corresponding to a national rate of 10.6 per 100,000 population. The overall rate of reported chronic HBV infection in Canada declined by 21% between 2009 and 2018, from 13.4 to 10.6 per 100,000 population.
A consistently higher rate of chronic HBV infection was reported among males than among females between 2009 and 2018. Male and female rates both decreased by a roughly similar percentage (a decrease of 19% and 22%, respectively) over this period.
Rates of chronic HBV infection decreased across all age groups over the past ten years. The largest declines were reported among those younger than 15 years of age (80% decrease) and between the ages of 20 and 24 (43% decrease). In 2018, the highest rate of chronic HBV infection was reported in the 30 to 39 year age group, in both males and females.
Hepatitis C
In 2018, 12,477 cases of hepatitis C virus (HCV) infection were reported in Canada, corresponding to an overall national rate of 33.6 per 100,000 population. The reported HCV diagnosis rate decreased slightly between 2009 and 2011, remained relatively stable between 2011 and 2013, and then began increasing steadily starting in 2014. Between 2014 and 2018, the overall rate of reported HCV infection increased by 13%, from 29.6 to 33.6 per 100,000 population. The increases have been particularly notable among females and those between the ages of 25 and 39.
Notably, rates of reported HCV infection increased twice as fast among females compared to males between 2014 and 2018. The rate of HCV infection grew fastest in the 30 to 39 year age group, among both males and females (30% and 42% increase, respectively). In 2018, the highest rate of HCV infection was found in the 30 to 39 year age group among males, and in the 25 to 29 year age group among females.
1.0 Introduction
Hepatitis B
HBV infection is a vaccine-preventable viral infection that mainly affects the liver. It can cause both acute and chronic illness. There is no cure for HBV, though it can be successfully treated with a lifelong course of antiviral medications, which can help to slow disease progression and improve long-term survival. If left untreated, HBV infection can lead to permanent liver damage and liver cancerFootnote 1.
Despite the introduction of a universal childhood vaccination program in the 1990s, HBV continues to be a major cause of morbidity and mortality in Canada. The Canadian Liver Foundation estimated that there were between 250,000 and 460,000 Canadians living with chronic HBV infection in Canada in 2012Footnote 2. The 2010 Ontario Burden of Infectious Diseases Study ranked HBV the fifth most burdensome infectious disease in the province based on disability-adjusted life yearsFootnote 3.
HBV infection is spread through contact with infected blood or other bodily fluids such as semen and vaginal fluid. In developed countries, such as Canada, this occurs mainly through sexual contact, and the sharing of used injection drug use equipmentFootnote 4. Though HBV diagnosis rates are low among the general population in Canada, certain key populations are more likely to have an HBV infection. In no particular order, these include new immigrants and refugees from HBV-endemic countries, gay, bisexual and other men who have sex with men (gbMSM), people who inject drugs (PWID), Indigenous peoples, people who have experienced homelessness, people who have experienced incarceration, and people engaged in sex workFootnote 5Footnote 6Footnote 7Footnote 8Footnote 9.
Hepatitis C
HCV infection is a preventable and curable viral infection that if left untreated can lead to cirrhosis, chronic liver failure, liver cancer, and in some cases death. Like HBV, HCV can cause both acute and chronic illness. Although there is no vaccine to prevent HCV, the introduction of safer, better-tolerated oral medications, called direct-acting antiretroviral agent drugs (DAAs), first made widely available for use in Canada in 2015, represents a major advance in the treatment of HCV infection.
It was estimated that in 2017, up to 317,000 people living in Canada ever had HCV, and 61% of those individuals (an estimated 194,500 Canadians) were living with chronic HCVFootnote 10. According to the 2010 Ontario Burden of Infectious Diseases Study, HCV was associated with the highest burden of any infectious disease in OntarioFootnote 3. Moreover, HCV infection was the second most common primary diagnosis, after cancer, for liver transplant recipients in Canada (not including Quebec) from 2009 to 2018Footnote 11.
HCV is spread primarily through contact with infected blood. The majority of HCV infections in Canada occur through the sharing of used injection drug equipmentFootnote 12. Before 1990, most HCV cases in Canada were acquired through transfusions of contaminated blood. However, the introduction of improved blood screening protocols in 1990 has made this type of transmission extremely rare todayFootnote 13.
Certain key populations are disproportionately impacted by HCV in Canada, including PWID, baby boomers, immigrants from HCV-endemic countries, Indigenous peoples, people with experiences of incarceration, and gbMSMFootnote 14Footnote 15.
2.0 Methods
Provincial and territorial health authorities provide non-nominal data on laboratory-confirmed cases to the Public Health Agency of Canada (PHAC) through the Canadian Notifiable Disease Surveillance System (CNDSS). HBV infection has been notifiable in Canada since 1969, and the current national case definition specifies acute, chronic, and unspecified infection status (Appendix A)Footnote 16. HCV infection has been nationally notifiable since 1991, and new case definitions of acute and unspecified (including chronic, resolved and indeterminate) were published in 2011 (Appendix B)Footnote 17. Variables submitted by all reporting jurisdictions include age at diagnosis, year of diagnosis, province/territory (P/T) of diagnosis, and sex, and may also include infection status. The received data are validated by CNDSS staff in collaboration with the corresponding P/T. The current report is based on data from January 1st, 2009 to December 31st, 2018, which were extracted from CNDSS in May 2020.
For HBV, reporting on disease status was phased in over time by P/Ts (Appendix C). Only P/Ts that reported acute or chronic HBV cases for a given year were included in annual acute and chronic rate computations for that year, respectively. Population estimates from jurisdictions not included in a particular analysis (acute or chronic) were removed from the overall denominator used to calculate corresponding national rates. Unlike the reporting of acute HBV infection, which was relatively consistent over the 2009 to 2018 timeframe, reporting of chronic HBV across jurisdictions varied over this period. Furthermore, diagnosis of acute HCV infection is difficult and includes both clinical and laboratory criteria. In 2018, only six P/Ts representing a little over half (52%) of the Canadian population reported cases differentiated into acute and chronic HCV to PHAC, an increase of two P/Ts compared with the preceding year (Appendix D). Therefore, HCV cases in this report are presented as unspecified infections, and include acute, chronic, resolved, and indeterminate HCV infections.
Descriptive analysis was performed using SAS and Microsoft Excel. National annual rates of reported cases of acute HBV, chronic HBV and unspecified HCV were computed using the number of cases from CNDSS as numerators, and Statistics Canada July 2019 yearly population estimates as denominators. Age group, sex and P/T-specific rates were also calculated. Rates were given per 100,000 population, and rates, percentages, and percent change in rates were calculated using unrounded numbers. Rates of overall HBV and HCV by age group and sex over time can be retrieved from the Notifiable Disease Online websiteFootnote 18.
Previous reports may present different rates for some years due to reporting delays, data updates from P/Ts, or improvements in data cleaning and validation. Once the data used for this report have been submitted by P/Ts, adjustments made to provincial/territorial data post-validation may not be reflected in that year's national data, but will be updated in subsequent reports. Therefore, small discrepancies between the PHAC and P/T numbers are expected. The P/T report should be considered the most accurate. Larger discrepancies may be noted where P/Ts employ an analytic strategy that is different from what is used in this report.
Some P/Ts distinguish between acute vs. chronic infections which provide further insight into observed trends. Infection rates were calculated using the total population denominator of the reporting P/Ts for that year. The rates presented are likely an underestimation of the true burden of infection in Canada, as HBV and HCV infections can often be asymptomatic or not show symptoms until later on.
3.0 Hepatitis B
In 2018, a total of 4,783 cases of HBV were reported in Canada: 189 cases of acute HBV infection (0.52 per 100,000 population), 3,483 cases of chronic HBV infection (10.6 per 100,000 population), and 751 cases of unspecified HBV infection.
3.1 National trends for acute hepatitis B
The trends in reported cases of acute HBV infection between 2009 and 2018 are presented below. Ten out of 13 P/Ts reported on acute HBV infection in 2018.
3.1.1 Overall trends over time
In 2018, 189 cases of acute HBV were reported in Canada, corresponding to a national rate of 0.52 per 100,000 population. While there was some fluctuation in rates between 2009 and 2013, the overall rate of reported acute HBV infection has remained relatively stable over the past ten years (Figure 1 and Appendix E).
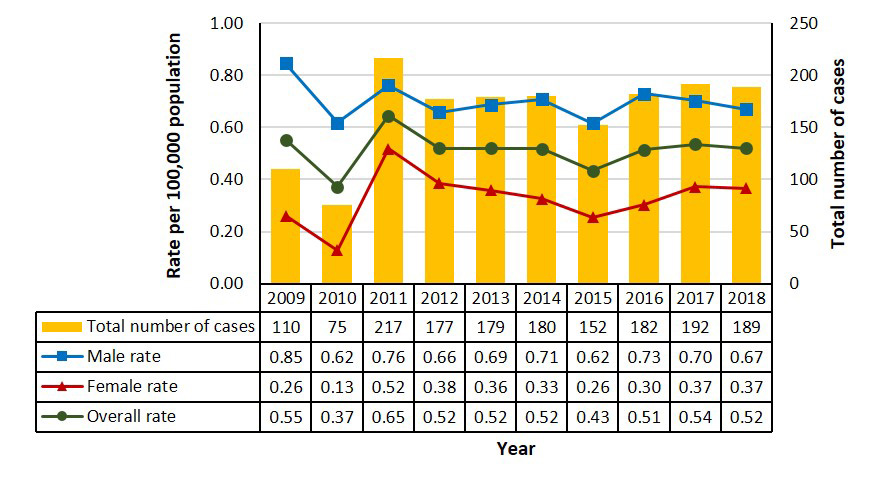
Figure 1. Number of reported cases and rates of acute HBV infection by sex in Canada, CNDSS, 2009 to 2018 - Text description
This graph displays the overall number of reported cases, as well as the overall and sex-specific rates of reported acute hepatitis B cases, between 2009 and 2018 in Canada. The horizontal axis shows the calendar years from 2009 to 2018. The vertical axis shows the rate of reported acute hepatitis B cases per 100,000 population for male, female, and overall, as well as the total number of reported cases of acute hepatitis B.
| Year | Total number of cases | Rate per 100,000 population | ||
|---|---|---|---|---|
| Male | Female | Overall | ||
| 2009 | 110 | 0.85 | 0.26 | 0.55 |
| 2010 | 75 | 0.62 | 0.13 | 0.37 |
| 2011 | 217 | 0.76 | 0.52 | 0.65 |
| 2012 | 177 | 0.66 | 0.38 | 0.52 |
| 2013 | 179 | 0.69 | 0.36 | 0.52 |
| 2014 | 180 | 0.71 | 0.33 | 0.52 |
| 2015 | 152 | 0.62 | 0.26 | 0.43 |
| 2016 | 182 | 0.73 | 0.30 | 0.51 |
| 2017 | 192 | 0.70 | 0.37 | 0.54 |
| 2018 | 189 | 0.67 | 0.37 | 0.52 |
Figurenotes
- Figurenote *
-
Includes data from BC, AB, SK, MB, QC, NB, NS, YK, NT for 2009 to 2018;
data from ON for 2011 to 2018.
In 2018, 121 cases of acute HBV infection were reported in males while 67 cases were observed in females (Appendix E). Over a third of all reported cases (65/189 or 34%) were observed in males between the ages of 40 and 59. Among females, 24 cases (36%) were reported in those between the ages of 40 to 59 and 17 cases (25%) were reported in females between the ages of 30 to 39. While rates decreased 21% among males (from 0.85 to 0.67 per 100,000 males) over the past ten years, they increased 41% among females over this same period (from 0.26 to 0.37 per 100,000 females) (Appendix E).
3.1.2 Rates of acute hepatitis B infection by province/territory
In 2018, four P/Ts reported rates of acute HBV higher than the national rate of 0.52 per 100,000 population. These included Manitoba (2.14 per 100,000 population), New Brunswick (2.08 per 100,000 population), Ontario (0.63 per 100,000 population) and Nova Scotia (0.63 per 100,000 population) (Figure 2).
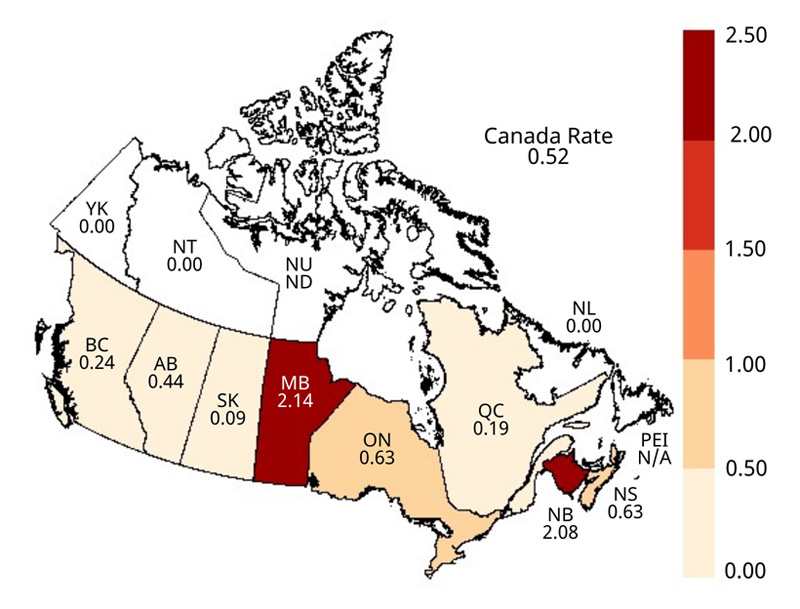
Figure 2. Geographical distribution of rates of reported cases of acute HBV infection across provinces and territories in Canada, CNDSS, 2018 - Text description
This map displays the rate of reported acute hepatitis B cases per 100,000 population by province and territory, in 2018 in Canada.
| Jurisdiction | Rate per 100,000 population |
|---|---|
| CA | 0.52 |
| BC | 0.24 |
| AB | 0.44 |
| SK | 0.09 |
| MB | 2.14 |
| ON | 0.63 |
| QC | 0.19 |
| NB | 2.08 |
| NS | 0.63 |
| NL | 0.00 |
| PEI | N/A |
| YK | 0.00 |
| NT | 0.00 |
| NU | N/A |
Figurenotes
- Figurenote 2 *
-
N/A: Data not available
The rate of reported acute HBV infection declined in four out of seven P/Ts that reported on acute HBV status over the past ten years (British Columbia, Alberta, Saskatchewan and Quebec) and increased in three P/Ts (Manitoba, New Brunswick and Nova Scotia).
Manitoba reported the largest increase over this period (from 0.31 to 2.14 per 100,000 population; an increase from 4 to 29 cases). The rise was more pronounced among males compared to females and was concentrated in the 30 to 59 year age groups. New Brunswick also reported a notably increased number of cases over this period (from 1.19 to 2.08 per 100,000 population; an increase from 9 to 16 cases) (Appendix E).
3.2 National trends for chronic hepatitis B
The trends in reported cases of chronic HBV infection between 2009 and 2018 are presented below. Ten out of 13 P/Ts reported on chronic HBV infection in 2018.
3.2.1 Overall trends over time
In 2018, a total of 3,483 cases of chronic HBV were reported in Canada, corresponding to a national rate of 10.6 per 100,000 population. The overall rate of reported chronic HBV decreased by 21% since 2009 (from 13.4 to 10.6 per 100,000 population). This trend was seen among both males (20% decrease, from 14.7 to 11.8 per 100,000 males) and females (23% decrease, from 12.0 to 9.3 per 100,000 females). Rates of reported chronic HBV infection have been consistently higher among males than females between 2009 and 2018 (Figure 3; Appendix F).
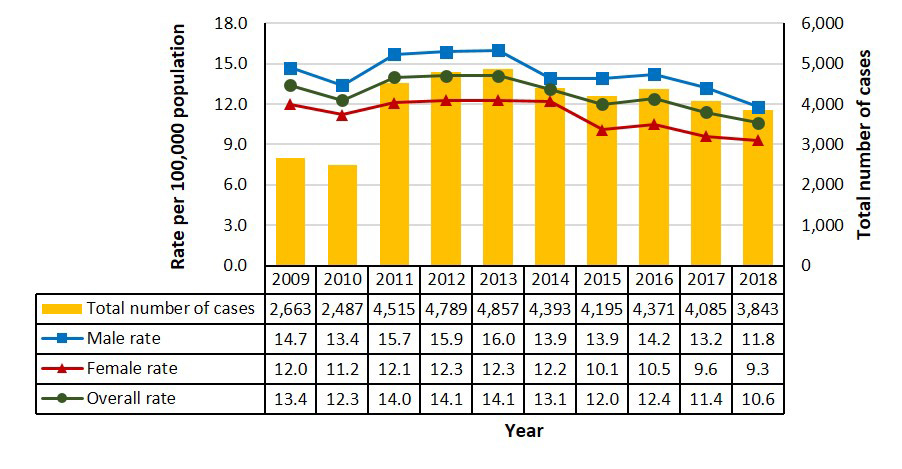
Figure 3. Number of reported cases and rates of chronic HBV infection by sex in Canada, CNDSS, 2009 to 2018 - Text description
This graph displays the overall number of reported cases, as well as the overall and sex-specific rates of reported chronic hepatitis B cases, between 2009 and 2018 in Canada. The horizontal axis shows the calendar years from 2009 to 2018. The vertical axis shows the rate of reported chronic hepatitis B cases per 100,000 population for males, females, and overall, as well as the total number of reported cases of chronic hepatitis B.
| Year | Total number of cases | Rate per 100,000 population | ||
|---|---|---|---|---|
| Male | Female | Overall | ||
| 2009 | 2,663 | 14.7 | 12.0 | 13.4 |
| 2010 | 2,487 | 13.4 | 11.2 | 12.3 |
| 2011 | 4,515 | 15.7 | 12.1 | 14.0 |
| 2012 | 4,789 | 15.9 | 12.3 | 14.1 |
| 2013 | 4,857 | 16.0 | 12.3 | 14.1 |
| 2014 | 4,393 | 13.9 | 12.2 | 13.1 |
| 2015 | 4,195 | 13.9 | 10.1 | 12.0 |
| 2016 | 4,371 | 14.2 | 10.5 | 12.4 |
| 2017 | 4,085 | 13.2 | 9.6 | 11.4 |
| 2018 | 3,843 | 11.8 | 9.3 | 10.6 |
Figurenotes
- Figurenote 3 *
-
Includes data from BC, AB, QC, NB, NS for 2009 to 2018;
data from SK for 2009 to 2013 and 2015 to 2018;
data from MB for 2009 to 2010 and 2012 to 2018;
data from NT for 2009 to 2011;
data from YK for 2010 and 2012 to 2018;
data from ON for 2011 and 2014 to 2018;
data from NU for 2018.
3.2.2 Rates of chronic hepatitis B infection by age group and sex
In 2018, for both males and females, the highest rates of reported cases of chronic hepatitis B occurred in the 30 to 39 year age group (25.2 per 100,000 males and 22.2 per 100,000 females) (Figure 4).
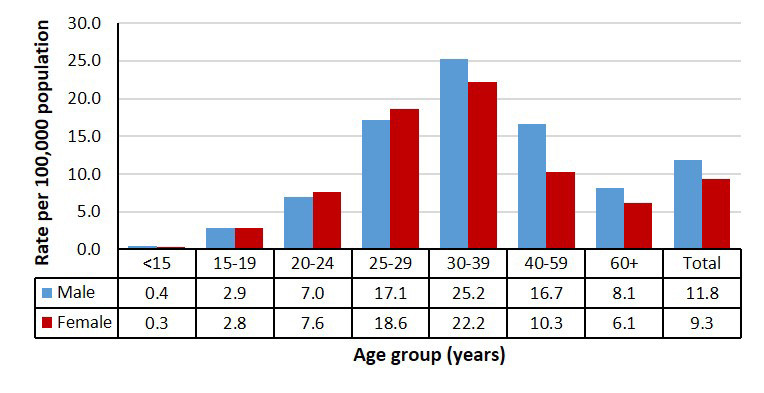
Figure 4. Rates of reported cases of chronic HBV infection by sex and age group in Canada, CNDSS, 2018 - Text description
This graph displays the rate of reported chronic hepatitis B cases by age group, overall and by sex, in 2018 in Canada. The horizontal axis shows the age groups ranging from under 15 years of age to over 60 years of age. The vertical axis shows the rate of reported chronic hepatitis B cases per 100,000 population for males, females and overall.
| Age group (years) | Rate per 100,000 population | |
|---|---|---|
| Male | Female | |
| <15 | 0.4 | 0.3 |
| 15-19 | 2.9 | 2.8 |
| 20-24 | 7.0 | 7.6 |
| 25-29 | 17.1 | 18.6 |
| 30-39 | 25.2 | 22.2 |
| 40-59 | 16.7 | 10.3 |
| 60+ | 8.1 | 6.1 |
| Total | 11.8 | 9.3 |
Figurenotes
- Figurenote 4 *
-
Includes data from BC, AB, SK, MB, ON, QC, NB, NS, YK, NU for 2018
Between 2009 and 2018, rates decreased or remained stable across all age groups, except for females 60+ years of age. The largest decrease occurred in younger age groups (<30 years of age) (Figure 5; Appendix G).
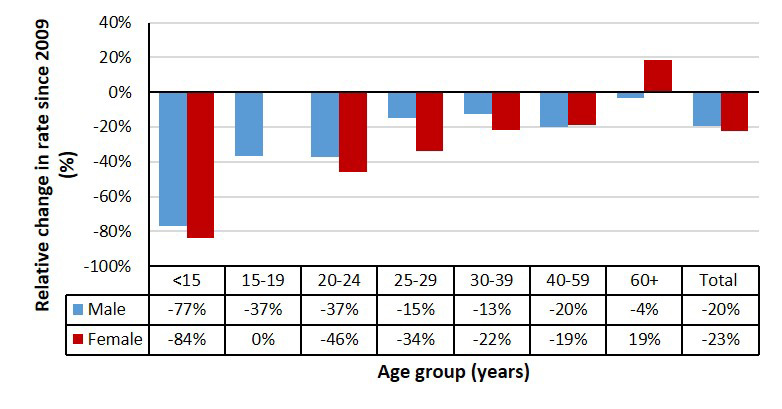
Figure 5. Relative change in rates of reported cases of chronic HBV infection by sex and age group in Canada, CNDSS, 2009 to 2018 - Text description
This graph displays the relative change in rate of reported chronic hepatitis B cases by age group, overall and by sex, between 2009 and 2018 in Canada. The horizontal axis shows the age groups ranging from below 15 years of age to over 60 years of age, as well as a total category. The vertical axis shows the relative change in rate of reported chronic hepatitis B cases per 100,000 population, since 2009, for males, females and overall (as a percentage).
| Age group (years) | Relative change in rate (%) since 2009 | |
|---|---|---|
| Male | Female | |
| <15 | -77% | -84% |
| 15-19 | -37% | 0% |
| 20-24 | -37% | -46% |
| 25-29 | -15% | -34% |
| 30-39 | -13% | -22% |
| 40-59 | -20% | -19% |
| 60+ | -4% | 19% |
| Total | -20% | -23% |
Figurenotes
- Figurenote 5 *
-
Includes data from BC, AB, MB, ON, QC, NB, NS, YK for 2014 to 2018;
data from SK for 2015 to 2018;
data from NU for 2018.
3.2.3 Number of cases and rates of chronic hepatitis B infection province/territory
In 2018, two provinces reported rates of chronic HBV higher than the national rate of 10.6 per 100,000 population: British Columbia and Ontario (18.2 and 12.0 per 100,000 population, respectively) (Figure 6).
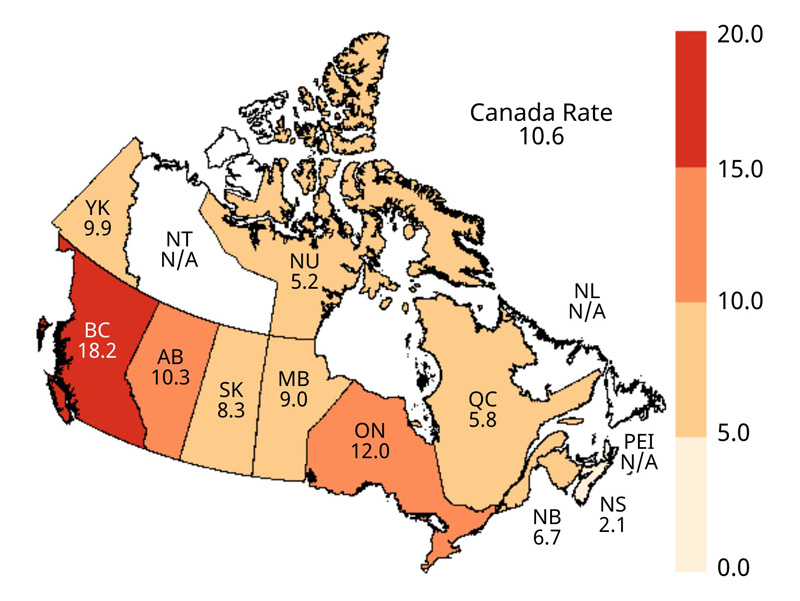
Figure 6. Geographical distribution of rates of reported cases of chronic HBV infection across provinces and territories in Canada, CNDSS, 2018 - Text description
This map displays the rate of reported chronic hepatitis B cases per 100,000 population by province and territory, in 2018 in Canada.
| Jurisdiction | Rate per 100,000 population |
|---|---|
| CA | 10.6 |
| BC | 18.2 |
| AB | 10.3 |
| SK | 8.3 |
| MB | 9.0 |
| ON | 12.0 |
| QC | 5.8 |
| NB | 6.7 |
| NS | 2.1 |
| NL | N/A |
| PEI | N/A |
| YK | 9.9 |
| NT | N/A |
| NU | 5.2 |
Figurenotes
- Figurenote 6 *
-
N/A: Data not available
4.0 Hepatitis C
4.1 National trends for hepatitis C
The trends in reported cases of HCV infection between 2009 and 2018 are presented below. All cases are reported as unspecified HCV infection.
4.1.1 Overall trends over time
In 2018, a total of 12,447 cases of HCV were reported in Canada, corresponding to a national rate of 33.6 per 100,000 population. The rate of reported HCV infection has fluctuated, but remained relatively stable overall since 2009. The HCV rates decreased steadily between 2009 and 2012 (11%) and have been increasing slightly since 2014 (13%). Between 2009 and 2018, male rates decreased by 3%, while female rates increased by 10% over this same period. Specifically, over the past five years, both male and female rates have been increasing. Female rates have risen at double the rate (20% vs. 10%). However, rates of reported cases of HCV have been consistently higher among males than females over the past ten years. In 2018, the male-to-female ratio of reported HCV cases was 1.8. (Figure 7).
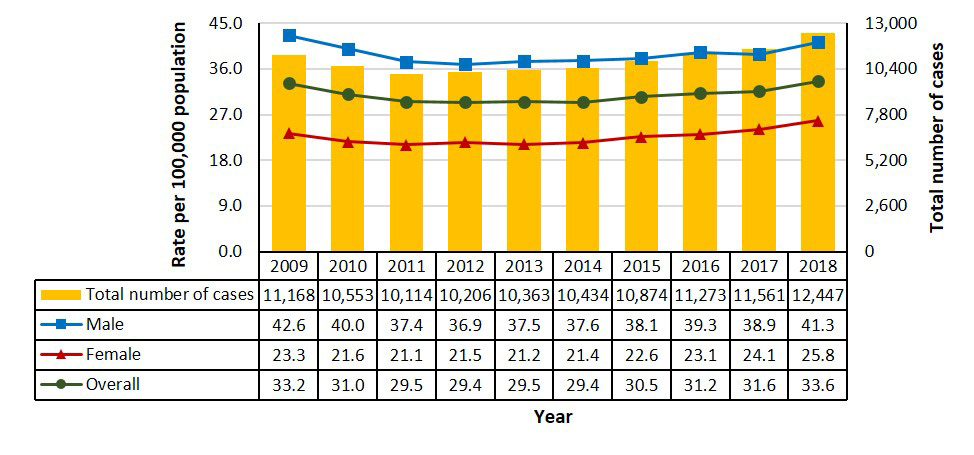
Figure 7. Number of reported cases and rates of HCV infection by sex in Canada, CNDSS, 2009 to 2018 - Text description
This graph displays the overall number of reported cases, as well as the overall and sex-specific rates of reported hepatitis C cases, between 2009 and 2018 in Canada. The horizontal axis shows the calendar years from 2009 to 2018. The vertical axis shows the rate of reported hepatitis C cases per 100,000 population for male, female, and overall, as well as the total reported number of cases of hepatitis C.
| Year | Total number of cases | Rate per 100,000 population | ||
|---|---|---|---|---|
| Male | Female | Overall | ||
| 2009 | 11,168 | 42.6 | 23.3 | 33.2 |
| 2010 | 10,553 | 40.0 | 21.6 | 31.0 |
| 2011 | 10,114 | 37.4 | 21.1 | 29.5 |
| 2012 | 10,206 | 36.9 | 21.5 | 29.4 |
| 2013 | 10,363 | 37.5 | 21.2 | 29.5 |
| 2014 | 10,434 | 37.6 | 21.4 | 29.4 |
| 2015 | 10,874 | 38.1 | 22.6 | 30.5 |
| 2016 | 11,273 | 39.3 | 23.1 | 31.2 |
| 2017 | 11,561 | 38.9 | 24.1 | 31.6 |
| 2018 | 12,447 | 41.3 | 25.8 | 33.6 |
Figurenotes
- Figurenote 7 *
-
Includes data from BC, AB, SK, MB, ON, QC, NB, NS, PEI, NL, YK, NT, and NU for 2009 to 2018
4.1.2 Rates of hepatitis C infection by age group and sex
In 2018, female rates of reported HCV were lower than male rates across all age groups except among those <25 years of age. Among males, the highest rates were reported in the 30 to 39 (67.7 per 100,000 males) and 25 to 29 year (65.6 per 100,000 males) age groups. Among females, rates of reported cases of HCV infection were highest in the 25 to 29 year age group (60.8 per 100,000 females) (Figure 8; Notifiable Diseases OnlineFootnote 18).
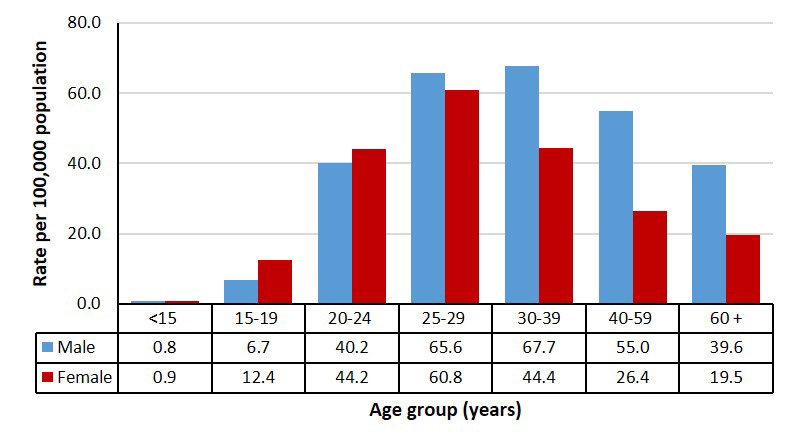
Figure 8. Rates of reported cases of HCV infection by age group and sex in Canada, CNDSS, 2018 - Text description
This graph displays the rate of reported hepatitis C cases by age group, overall and by sex, in 2018 in Canada. The horizontal axis shows the age groups ranging from under 15 years of age to over 60 years of age. The vertical axis shows the rate of reported hepatitis C cases per 100,000 population for males, females and overall.
| Age group (years) | Rate per 100,000 population | |
|---|---|---|
| Male | Female | |
| <15 | 0.8 | 0.9 |
| 15-19 | 6.7 | 12.4 |
| 20-24 | 40.2 | 44.2 |
| 25-29 | 65.6 | 60.8 |
| 30-39 | 67.7 | 44.4 |
| 40-59 | 55.0 | 26.4 |
| 60+ | 39.6 | 19.5 |
Figurenotes
- Figurenote 8 *
-
Includes data from BC, AB, SK, MB, ON, QC, NB, NS, NL, PEI, YK, NT, and NU for 2018
Figure 9 displays the relative change in rates of reported HCV since 2014. A five year time-frame has been chosen to highlight recent changing trends. The overall rate increased by 13% (from 29.6 to 33.6 per 100,000 population) between 2014 and 2018. The rate of reported cases among females rose twice as fast over this period (from 21.4 to 25.8 per 100,000 females, a 20% increase), compared to males (from 37.6 to 41.3 per 100,000 males, a 10% increase).
Apart from the rates in the <15 year age group for which absolute numbers were low, the highest relative increase in rates occurred in the 30 to 39 year age group among both males and females (from 51.9 to 67.7 per 100,000 males and from 31.3 to 44.4 per 100,000 females, corresponding to a 42% and 30% increase, respectively) (Figure 9; Notifiable Diseases OnlineFootnote 18).
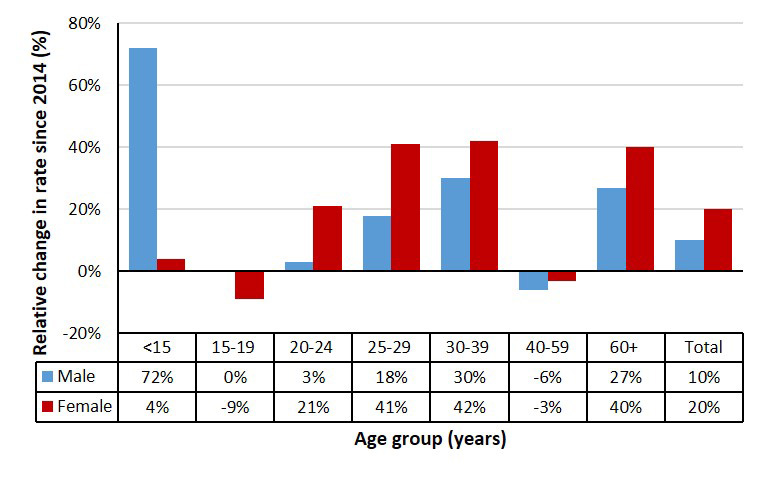
Figure 9. Relative change in rates of reported cases of HCV infection by sex and age group in Canada, CNDSS, 2014 to 2018 - Text description
This graph displays the relative change in rate of reported hepatitis C cases by age group, overall and by sex, between 2009 and 2018 in Canada. The horizontal axis shows the age groups ranging from below 15 years of age to over 60 years of age, as well as a total category. The vertical axis shows the relative change in rate of reported hepatitis C cases per 100,000 population, since 2009, for males, females and overall (as a percentage).
| Age group (years) | Relative change in rate (%) since 2009 | |
|---|---|---|
| Male | Female | |
| <15 | 72% | -4% |
| 15-19 | 0% | -9% |
| 20-24 | 3% | 21% |
| 25-29 | 18% | 41% |
| 30-39 | 30% | 42% |
| 40-59 | -6% | -3% |
| 60+ | 27% | 40% |
| Total | 10% | 20% |
Figurenotes
- Figurenote 9 *
-
Includes data from BC, AB, SK, MB, ON, QC, NB, NS, NL, PEI, YK, NT and NU for 2014 to 2018
4.1.3 Number of cases and rates of hepatitis C infection by province/territory and sex
The P/Ts with the highest rates of reported HCV infection in 2018 were Saskatchewan (60.0 per 100,000 population), Manitoba (57.6 per 100,000 population), Yukon (56.6 per 100,000 population), Newfoundland and Labrador (49.8 per 100,000 population) and British Columbia (39.2 per 100,000 population) (Figure 10).
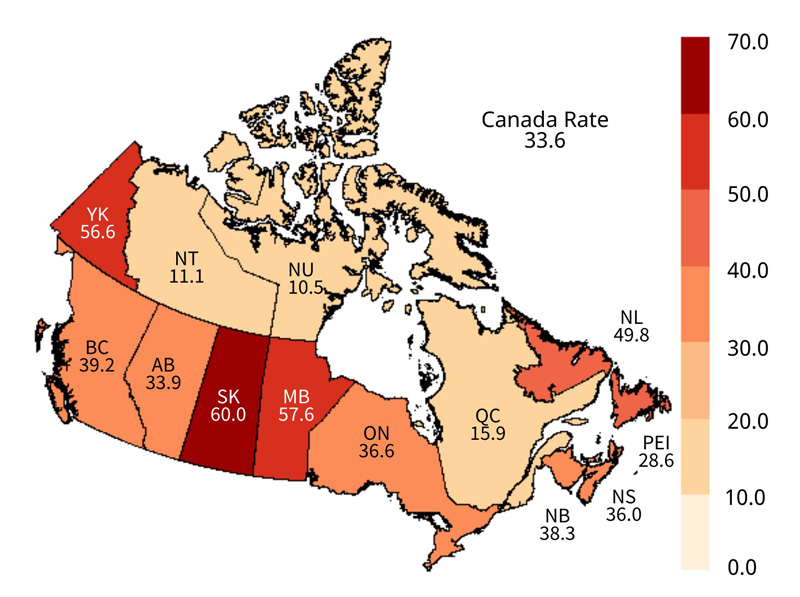
Figure 10. Geographical distribution of rates of reported cases of HCV infection across provinces and territories in Canada, CNDSS, 2018 - Text description
This map displays the rate of reported hepatitis C cases per 100,000 population by province and territory, in 2018 in Canada.
| Jurisdiction | Rate per 100,000 population |
|---|---|
| CA | 33.6 |
| BC | 39.2 |
| AB | 33.9 |
| SK | 60.0 |
| MB | 57.6 |
| ON | 36.6 |
| QC | 15.9 |
| NB | 38.3 |
| NS | 36.0 |
| NL | 49.8 |
| PEI | 28.6 |
| YK | 56.6 |
| NT | 11.1 |
| NU | 10.5 |
The highest increases in rates of reported cases of HCV infection between 2014 and 2018 were observed in Manitoba (from 27.5 to 57.6 per 100,000 population, corresponding to a 109% increase) and Newfoundland and Labrador (from 24.2 to 49.8 per 100,000 population, corresponding to a 106% increase) New Brunswick reported an increase in rate of 62%, from 23.7 to 38.3 per 100,000 population, over this period, while Ontario and Quebec both reported a 17% increase (from 31.3 to 36.6 per 100,000 population and from 13.6 to 15.9 per 100,000 population, respectively). Rates decreased or remained relatively stable in British Columbia, Alberta, Saskatchewan, Nova Scotia, Prince Edward Island, Yukon and Northwest Territories (Appendix H).
Rates in females rose faster than rates in males in five P/Ts, including Manitoba (133% vs 93% increase), Ontario (26% vs 11%), Quebec (27% vs. 18%), New Brunswick (111% vs. 38%) and Yukon (31% vs. -9%).
5.0 Discussion
Trends in rates of reported cases: rates of acute HBV plateau over the past decade, chronic HBV rates are decreasing and HCV on the rise since 2014
In Canada, rates of reported cases of acute HBV infection appear to have plateaued over the past decade, despite the fact that universal HBV immunization programs have been in place across all P/Ts since the early 1990s. Chronic HBV rates have decreased by 21% over the past decade. Meanwhile, there was a slight (13%), but persistent increase in the rate of reported HCV infection in Canada over the past five years. This mirrors trends observed in the United States over the past decade with respect to the stabilization of reported rates of acute HBV and increasing rates of reported HCVFootnote 19Footnote 20.
There is some evidence that increased injection drug use, in particular increased opioid use, may be influencing these trendsFootnote 21Footnote 22. Several studies have linked the opioid crisis to increased rates of HBV and HCV infection in the United States in recent years, particularly among younger adults (<30 years of age)Footnote 23Footnote 24Footnote 25Footnote 26. Another potential contributing factor might be the increasing prevalence of injection methamphetamine use in Canada, as documented in PHAC's recent Tracks surveyFootnote 27. Methamphetamine use has also been linked to increasing rates of syphilis and HIV reported in Canada recently, particularly in Western and Central CanadaFootnote 28Footnote 29. Increased HCV screening and testing may also be contributing to some of the observed increaseFootnote 30Footnote 31Footnote 32.
Increasing rates of reported cases of acute HBV and HCV infection among females
The gap between male and female rates of acute HBV and HCV is narrowing. Rates of acute HBV infection increased by 41% among females between 2009 and 2018, while male rates decreased by 21% over this same period.
Female rates of HCV increased at double the rate of males over the past five years (20% vs. 10%).The observed upturn in rates of acute HBV and HCV in females coincides with an increased incidence of HIV and syphilis reported among Canadian females over the past decade, approximatelyFootnote 27Footnote 28Footnote 29. These overall trends of increasing sexually transmitted and blood borne infections (STBBI) rates seem to be linked to increases in substance use and injection drug use in some networks of womenFootnote 40. These trends provide additional support for an integrated national approach to address STBBI in Canada, with a focus on reducing their health impact in key populations affected by overlapping epidemics (i.e. syndemics), as articulated by the Government of Canada's Pan-Canadian STBBI frameworkFootnote 29Footnote 33.
Regional patterns in rates of reported cases of acute HBV and HCV infection
It is important to note that trends vary by P/T, and therefore not all jurisdictions reported a plateau in rates of acute HBV. In Manitoba, there was a substantial increase in the overall reported rate of acute HBV infection over the past five years. A major increase in rates of HCV was also reported over this period. These trends may be attributable to outbreaks of STBBIs declared in the Winnipeg region in 2018, linked to the sharing of used methamphetamine syringesFootnote 34Footnote 35. The rate of reported cases of acute HBV infection also rose notably in New Brunswick over this period, likely reflecting an HBV outbreak declared in the Moncton region in 2016, which primarily affected gbMSM. In response, New Brunswick public health authorities launched an awareness campaign and a vaccination program targeting gbMSMFootnote 36Footnote 37.
The highest reported rates of chronic HBV were found in British Columbia, followed by Ontario. This may be related to trends and patterns with respect to international immigration in Canada, as a high proportion of immigrants from HBV-endemic regions settle in these two provincesFootnote 38.
6.0 Conclusion
HBV and HCV are preventable, and in almost all cases, treatable conditions. Yet, they are responsible for a considerable burden of morbidity and mortality in Canada. As noted, certain key populations are disproportionately impacted by HBV and HCV-related harms, including PWID, Indigenous peoples, immigrants from countries where HBV and HCV are endemic, people who have experienced incarceration and gbMSM.
The trends observed in this report substantiate the need for continued monitoring, prevention and control efforts aimed at reducing the incidence and health impact of HBV and HCV in Canada. As laid out in the Government of Canada's Pan-Canadian STBBI framework, this requires ongoing, coordinated efforts to equitably scale up evidence-based prevention, improve access to testing, promote early linkage to care and treatment, and provide ongoing comprehensive care and support for people living with chronic hepatitis. Eliminating barriers and inequities in access to care, through tailoring services to the needs and strengths of key populations, will also be important, as well as addressing the underlying social determinants of health, stigma, and discrimination, which contribute to STBBI vulnerability.
The plateau in acute HBV diagnosis rates observed over the past decade and the slight, but persistent increase in HCV diagnosis rates in the past five years may reflect a potential increase in behavioural risk factors, possibly including an increased prevalence of injection drug use linked to the opioid crisis, and increased methamphetamine use. If this is the case, a comprehensive harm reduction approach could play an important role in Canada's prevention and control efforts.
STBBI do not affect all people equally. An effective response to preventing the transmission of STBBI in Canada must consider and address the social determinants of health. Vulnerability to, and resilience against, STBBI are both directly and indirectly influenced by social determinants, including education, income, employment, gender and gender norms, culture, unstable housing or homelessness, access to health services, and social environments.
The upward trend in acute HBV and HCV diagnosis rates among females observed in this report coincides with an increased incidence of HIV and syphilis reported among Canadian females over the past decade, which may be evidence of STBBI syndemics affecting certain key populations. This finding underscores the importance of an integrated, syndemic-informed approach to STBBI surveillance, prevention and control, with a focus on key populations who are at increased risk of STBBIs, because of multiple, intertwined social and health-related challenges.
Robust STBBI surveillance data provide key information about the epidemiology of STBBI in Canada and are essential to help inform, monitor and evaluate public health responses to HBV and HCV. Increased national capacity to differentiate between acute and chronic cases, combined with the collection of additional sociodemographic variables and risk factor data, would provide more insight into transmission dynamics, and the behavioural and social factors that increase risk. Going forward, the development of STBBI targets and indicators for Canada will assist in monitoring progress towards the goals outlined in the STBBI Action PlanFootnote 39 and in identifying inequities and gaps across the continuum of STBBI care.
References
- Footnote 1
-
Chu CM. Natural history of chronic hepatitis B virus infection in adults with emphasis on the occurrence of cirrhosis and hepatocellular carcinoma. In: Journal of Gastroenterology and Hepatology (Australia). Vol 15. Blackwell Publishing; 2000. doi:10.1046/j.1440-1746.2000.02097.x
- Footnote 2
-
Morris S. Liver Disease in Canada--A Crisis in the Making. An Assessment of Liver Disease in Canada Based on Available Data.; 2013.
- Footnote 3
-
Kwong JC, Ratnasingham S, Campitelli MA, et al. The Impact of Infection on population Health: Results of the Ontario Burden of Infectious Diseases Study. PLoS One. 2012;7(9). doi:10.1371/journal.pone.0044103
- Footnote 4
-
Trépo C, Chan HLY, Lok A. Hepatitis B virus infection. Lancet. 2014;384(9959):2053-2063. doi:10.1016/S0140-6736(14)60220-8
- Footnote 5
-
Beech BM, Myers L, Beech DJ, Kernick NS. Human immunodeficiency syndrome and hepatitis B and C infections among homeless adolescents. Semin Pediatr Infect Dis. 2003;14(1):12-19. doi:10.1053/spid.2003.127212
- Footnote 6
-
Binka M, Butt ZA, Wong S, et al. Differing profiles of people diagnosed with acute and chronic hepatitis B virus infection in British Columbia, Canada. World J Gastroenterol. 2018;24(11):1216-1227. doi:10.3748/wjg.v24.i11.1216
- Footnote 7
-
Ranjan A, Shannon K, Chettiar J, Braschel M, Ti L, Goldenberg S. Barriers and facilitators to hepatitis B vaccination among sex workers in Vancouver, Canada: Implications for integrated HIV, STI, and viral hepatitis services. Int J Infect Dis. 2019;87:170-176. doi:10.1016/j.ijid.2019.07.032
- Footnote 8
-
Jongbloed K, Pearce ME, Pooyak S, et al. The Cedar Project: Mortality among young Indigenous people who use drugs in British Columbia. Can Med Assoc J. 2017;189(44):E1352-E1359. doi:10.1503/cmaj.160778
- Footnote 9
-
Remis RS, Liu J, Loutfy MR, et al. Prevalence of sexually transmitted viral and bacterial infections in HIV-positive and hivnegative men who have sex with men in Toronto. PLoS One. 2016;11(7). doi:10.1371/journal.pone.0158090
- Footnote 10
-
Public Health Agency of Canada. People Living with Hepatitis C (HCV)—Canada, 2017 Infographic.; 2020.
- Footnote 11
-
Canadian Institute for Health Information (CIHI). Treatment of End-Stage Organ Failure in Canada, Canadian Organ Replacement Register, 2009 to 2018: Extra-Renal Transplants — Data Tables.; 2019. Accessed October 26, 2020. https://www.cihi.ca/en/corr-annual-statistics-extra-renal-transplants-2007-to-2016.
- Footnote 12
-
Public Health Agency of Canada. Hepatitis C in Canada: 2005-2010 Surveillance Report.; 2011. Accessed October 27, 2020. http://www.phac-aspc.
- Footnote 13
-
O'Brien SF, Yi Q-L, Fan W, Scalia V, Fearon MA, Allain J-P. Current incidence and residual risk of HIV, HBV and HCV at Canadian Blood Services. Vox Sang. 2012;103(1):83-86. doi:10.1111/j.1423-0410.2012.01584.x
- Footnote 14
-
The Canadian Network on Hepatitis C Blueprint Writing Committee and Working Groups. Blueprint to Inform Hepatitis C Elimination Efforts in Canada.; 2019. Accessed October 26, 2020. www.canhepc.ca/en/blueprint/publication.
- Footnote 15
-
Krajden M, Cook D, Janjua NZ. Contextualizing Canada's hepatitis C virus epidemic. Can Liver J. 2018;1(4):218-230. doi:10.3138/canlivj.2018-0011
- Footnote 16
-
Public Health Agency of Canada. Case Definitions for Communicable Diseases under National Surveillance: Results of Provincial/Territorial (P/T) Consultation Process.; 2009. Accessed October 27, 2020. https://www.canada.ca/en/public-health/services/reports-publications/canada-communicable-disease-report-ccdr/monthly-issue/2009-35/definitions-communicable-diseases-national-surveillance.html
- Footnote 17
-
Public Health Agency of Canada. National case definition: Hepatitis C. Published August 2018. Accessed October 27, 2020. https://www.canada.ca/en/public-health/services/diseases/hepatitis-c/health-professionals-hepatitis-c/national-case-definition.html
- Footnote 18
-
Public Health Agency of Canada. Notifiable disease charts. Notifiable Diseases Online. Published 2020. Accessed December 14, 2020. https://diseases.canada.ca/notifiable/charts-list
- Footnote 19
-
United States Centers for Disease Control and Prevention (CDC). Viral Hepatitis Surveillance United States — 2018.; 2020. Accessed October 27, 2020. https://www.cdc.gov/hepatitis/statistics/SurveillanceRpts.htm.https://www.cdc.gov/hepatitis/statistics/SurveillanceRpts.htm
- Footnote 20
-
United States Centers for Disease Control and Prevention (CDC). Surveillance for Viral Hepatitis – United States, 2017.; 2019. Accessed October 27, 2020. https://www.cdc.gov/hepatitis/outbreaks/2017March-HepatitisA.htm
- Footnote 21
-
Bruneau J, Roy É, Arruda N, Zang G, Jutras-Aswad D. The rising prevalence of prescription opioid injection and its association with hepatitis C incidence among street-drug users. Addiction. 2012;107(7):1318-1327. doi:10.1111/j.1360-0443.2012.03803.x
- Footnote 22
-
Roy É, Arruda N, Leclerc P, et al. Drug use practices among people who inject drugs in a context of drug market changes: Challenges for optimal coverage of harm reduction programs. Int J Drug Policy. 2017;45:18-24. doi:10.1016/j.drugpo.2017.05.012
- Footnote 23
-
Harris AM, Iqbal K, Schillie S, et al. Increases in Acute Hepatitis B Virus Infections — Kentucky, Tennessee, and West Virginia, 2006–2013. MMWR Morb Mortal Wkly Rep. 2016;65(3):47-50. doi:10.15585/mmwr.mm6503a2
- Footnote 24
-
Suryaprasad AG, White JZ, Xu F, et al. Emerging epidemic of hepatitis C virus infections among young nonurban persons who inject drugs in the United States, 2006-2012. Clin Infect Dis. 2014;59(10):1411-1419. doi:10.1093/cid/ciu643
- Footnote 25
-
Patrick SW, Bauer AM, Warren MD, Jones TF, Wester C. Hepatitis C Virus Infection Among Women Giving Birth — Tennessee and United States, 2009–2014. MMWR Morb Mortal Wkly Rep. 2017;66(18):470-473. doi:10.15585/mmwr.mm6618a3
- Footnote 26
-
Zibbell JE, Asher AK, Patel RC, et al. Increases in Acute Hepatitis C Virus Infection Related to a Growing Opioid Epidemic and Associated Injection Drug Use, United States, 2004 to 2014. Am J Public Health. 2018;108(2):175-181. doi:10.2105/AJPH.2017.304132
- Footnote 27
-
Tarasuk J, Zhang J, Lemyre A, Cholette F, Bryson M, Paquette D. National findings from the Tracks survey of people who inject drugs in Canada, Phase 4, 2017–2019. Canada Commun Dis Rep. 2020;46(5):138-148. doi:10.14745/ccdr.v46i05a07
- Footnote 28
-
Public Health Agency of Canada. Syphilis in Canada: Technical report on epidemiological trends, determinants and interventions - Canada.ca. Published 2020. Accessed April 20, 2021. https://www.canada.ca/en/services/health/publications/diseases-conditions/syphilis-epidemiological-report.html
- Footnote 29
-
Haddad N, Weeks A, Robert A, Totten S. HIV in Canada—surveillance report, 2019. Canada Commun Dis Rep. 2021;47(1):77-86. doi:10.14745/ccdr.v47i01a11
- Footnote 30
-
British Columbia Centre for Disease Control. Hepatitis C testing doubles in B.C. since 2011 in effort to eliminate the disease. Published 2019. Accessed November 17, 2020. http://www.bccdc.ca/about/news-stories/news-releases/2019/hepatitis-c-testing-doubles-in-b-c-since-2011-in-effort-to-eliminate-the-disease
- Footnote 31
-
Francheville JW, Rankin R, Beck J, et al. Early successes in an open access, provincially funded hepatitis C treatment program in Prince Edward Island. Ann Hepatol. 2017;16(5):749-758. doi:10.5604/01.3001.0010.2757
- Footnote 32
-
Manitoba HIV Program. 2018 Manitoba HIV Program Update..; 2019.
- Footnote 33
-
Public Health Agency of Canada. Reducing the health impact of sexually transmitted and blood-borne infections in Canada by 2030: A pan-Canadian STBBI framework for action. Published 2018. Accessed April 20, 2021. https://www.canada.ca/en/public-health/services/infectious-diseases/sexual-health-sexually-transmitted-infections/reports-publications/sexually-transmitted-blood-borne-infections-action-framework.html
- Footnote 34
-
Froese I. Meth use in Winnipeg causing outbreak of blood-borne illnesses, new documents say. CBC News. https://www.cbc.ca/news/canada/manitoba/prairie-police-meth-health-disease-1.4941110. Published December 11, 2018. Accessed October 26, 2020.
- Footnote 35
-
Kusch L, Botelho-Urbanski J. Shared meth syringes drive hepatitis outbreak - Winnipeg Free Press. Winnipeg Free Press. https://www.winnipegfreepress.com/local/lack-of-provincial-leadership-has-exacerbated-citys-meth-crisis-wrha-charges-in-document-502482181.html. Published December 11, 2018. Accessed February 15, 2021.
- Footnote 36
-
Lapointe S. Hepatitis B outbreak in Moncton leads to free vaccine offer | CBC News. CBC News. https://www.cbc.ca/news/canada/new-brunswick/hepatitis-b-outbreak-moncton-1.3782305. Published 2016. Accessed October 26, 2020.
- Footnote 37
-
Vitalité Health Network. Hepatitis B outbreak in Moncton region | Vitalité. Published September 28, 2016. Accessed October 27, 2020. https://www.vitalitenb.ca/en/news/hepatitis-b-outbreak-moncton-region
- Footnote 38
-
Edmonston B. Canada's immigration trends and patterns. Can Stud Popul. 2016;43(1-2):78-116. doi:10.25336/P64609
- Footnote 39
-
Public Health Agency of Canada. Accelerating Our Response: Government of Canada Five-Year Action Plan on Sexually Transmitted and Blood-Borne Infections.; 2019. Accessed October 27, 2020. https://www.canada.ca/en/public-health/services/reports-publications/accelerating-our-response-five-year-action-plan-sexually-transmitted-blood-borne-infections.html
- Footnote 40
-
Neufeld J. Plains Speak on STBBIs, 2019: An Emergent Challenge.; 2019. Accessed May 3, 2021. https://nccid.ca/wp-content/uploads/sites/2/2019/11/Final_Plains-Speak-on-STBBIs-2019-Meeting-Proceedings.pdf
List of appendices and supplementary tables and figures
Copies of the appendices and supplementary tables are available upon request. Please email the staff of the STI and Hepatitis Surveillance Section, Public Health Agency of Canada at phac.sti-hep-its.aspc@canada.ca.
Any comments and suggestions that would improve the usefulness of future publications are
appreciated and can likewise be sent to the above email address.
Appendices
Appendix A: Case definitions for HBV
Appendix B: Case definitions for HCV
Appendix C: Reporting Patterns, Rates of acute and chronic HBV infections in Canada, by province and territory, 2009 to 2018
Appendix D: Reporting Patterns, Rates of acute, chronic and unspecified HCV infections in Canada, by province and territory, 2009 to 2018
Appendix E: Reported cases and rates of acute HBV infection in Canada, by sex, 2009 to 2018
Appendix F: Reported cases and rates of chronic HBV infection in Canada, by sex, 2009 to 2018
Appendix G: Reported cases and rates of chronic HBV infection in Canada, by sex and age group, 2018
Appendix H: Reported rates of HCV infection in Canada, by province and territory, 2009 to 2018
Supplementary tables and figures
Number of reported cases and rates of chronic HBV infection by sex and province/territory in Canada, CNDSS, 2018
Relative change in rates of reported cases of chronic HBV infection by province/territory in Canada, CNDSS, 2009 to 2018
Rates of reported cases of HCV infection by age group and year among Canadian males, CNDSS, 2009 to 2018
Rates of reported cases of HCV infection by age group and year among Canadian females, CNDSS, 2009 to 2018
Number of reported cases and rates of HCV infection by sex and province/territory in Canada, CNDSS, 2018
Relative change in rates of reported cases of HCV infection by province/territory in Canada, CNDSS, 2014 to 2018
Proportion of reported cases and rates of HCV infection by age group in Canada (>20 years of age) and province/territory, CNDSS, 2018