
Survey on the impact of COVID-19 on access to STBBI-related services, including harm reduction services, for people who use drugs or alcohol in Canada

Download the alternative format
(746 KB, 24 pages)
Organization: Public Health Agency of Canada
Published: 2023-02-16
Cat.: HP40-327/2023E-PDF
ISBN: 978-0-660-46611-8
Pub.: 220629
Table of contents
- Acknowledgement
- Introduction
- Methods
- Analysis
- Results
- Discussion
- Strengths and limitations
- Conclusion
- References
Acknowledgement
The success of this survey and the development of this report was possible because of the collaboration with the Canadian Association of People who Use Drugs (CAPUD). CAPUD established and led a national Expert Working Group comprised of people with lived and/or living experience of drug use; individuals from the African, Caribbean and Black, Indigenous and 2SLGBTQIA+ communities; representatives from community-based organizations offering sexually transmitted and blood-borne infections (STBBI)-related services, academic institutions and advocacy groups; and community-engaged researchers. The authors gratefully acknowledge the contribution of the participants who completed the survey.
Introduction
Since the start of the COVID-19 pandemic, unprecedented challenges in delivering primary healthcare, including STBBI prevention, testing and treatment services as well as harm reduction services, have been reported across the country. These disruptions may have had a greater impact on populations more at risk for human immunodeficiency virus (HIV), hepatitis C, and other STBBIFootnote 1. In Canada, these key populations include African, Caribbean and Black (ACB) people, First Nations, Inuit and Métis peoples, and people who use drugs or alcohol (PWUD).
The Public Health Agency of Canada (PHAC) identified the need for priority data to measure the impact of COVID-19 on the health and well-being of Canadians and the delivery of healthcare. To address this priority, in collaboration with community partners, PHAC conducted four national online surveys to gain a better understanding of the impact of COVID-19 on the delivery of and access to STBBI-related services.
The first survey, the Survey on the Impact of COVID-19 on the delivery of STBBI prevention, testing and treatment, including harm reduction services, in Canada, was conducted from November to December 2020 to gather information from service providers about the impact of COVID-19 on their ability to provide STBBI-related servicesFootnote 2. Three separate surveys of key populations were subsequently conducted for ACB people, First Nations, Inuit and Métis peoples, and PWUD. The aim of these population-specific surveys was to explore the impact of COVID-19 on social determinants of health (i.e., mental health and wellness, employment and financial security, food security, domestic violence, and discrimination), substance use, and access to STBBI-related services.
This report presents the descriptive findings of the national Survey on the Impact of COVID-19 on access to STBBI-related services, including harm reduction services, for people who use drugs or alcohol in Canada, conducted from January 5, 2021 to February 5, 2021.
Methods
Survey design
The Survey on the Impact of COVID-19 on access to STBBI-related services, including harm reduction services, for people who use drugs or alcohol in Canada was a cross-sectional, self-administered, online survey. The survey design was based on the rapid assessment trendspotter methodology developed by the European Monitoring Centre for Drugs and Drug Addiction (EMCDDA)Footnote 3. Conducting the survey online avoided the COVID-19 risk associated with close physical contact that could occur with face-to-face interviews. As well, the online survey method supported data collection from a potentially large number of participants over the planned four-week data collection period.
Community engagement
PHAC collaborated with the Canadian Association of People who Use Drugs (CAPUD) to ensure community engagement in the planning, promotion and recruitment of the survey. CAPUD established and led a national Expert Working Group (EWG) comprised of people with lived and/or living experience of drug use; individuals from the African, Caribbean and Black, Indigenous and 2SLGBTQIA+ communities; representatives from community-based organizations offering STBBI-related services, academic institutions and advocacy groups; and community-engaged researchers.
CAPUD provided input in the development of the questionnaire, developed and implemented a survey as well as a promotional and recruitment strategy, and reviewed survey findings for a PHAC published Data BlogFootnote 4.
Questionnaire
Survey questions were developed from questionnaires used in prior surveys by the National Tracks Surveillance SystemFootnote 5 and existing online surveys measuring the impact of COVID-19Footnote 6 Footnote 7 Footnote 8 Footnote 9 Footnote 10 Footnote 11. Community partners provided input in drafting of the questionnaire to ensure survey questions were relevant, appropriate and population-specific.
In addition to sociodemographic characteristics, the questionnaire collected information on social determinants of health (i.e., mental health and wellness, employment and financial security, food security, domestic violence, and discrimination); substance use; and ability to access STBBI prevention, testing and treatment services, harm reduction services, and substance use and treatment services. With the exception of a few open-ended questions (i.e., participant's age, first three characters of participant's postal code, number of years lived in Canada, and participant comments about their experience during the pandemic), all other questions were closed-ended (i.e., checkboxes).
The questionnaire was available in English and French, and took approximately 10 to 20 minutes to complete. No directly identifying information was captured on the questionnaire.
Eligibility criteria
Participant eligibility criteria included living in Canada at the time of the survey, aged 18 years or older, ability to read English or French, and self-identifying as a person who used drugs including alcohol or cannabis in the 6 months prior to the questionnaire.
Before starting the survey, the participant was provided with information in a question-answer format about the survey, including who can participate, privacy of personal information, how findings will be made available, and an email address if more information about the survey is desired. A web link to mental health support and resources was provided if the participant found any questions upsetting.
After reading through the information, the participant was presented with the following statement: "By clicking the 'Start Survey' button, you have read and understood the information on this page and consent to participation."
Recruitment
Several steps were taken to promote the survey and recruit participants. PHAC collaborated with CAPUD to promote and distribute the online survey link. With input from EWG members, CAPUD developed a promotional strategy to recruit participants, especially from different age groups and socioeconomic statuses.
Originally, EWG members were planning to conduct on-foot outreach to recruit participants who used drugs, especially youth (aged < 25 years), older adults (aged > 50 years), and unhoused or precariously housed individuals. To protect the health and safety of EWG members during the COVID-19 pandemic, all on-foot outreach was cancelled. Instead, outreach was done through emails and paid social media advertisements.
The survey was widely promoted through paid social media platforms. CAPUD created text and infographics with the survey link for posting to Facebook, Instagram, Twitter, and LinkedIn. Throughout the data collection period, CAPUD routinely posted (i.e., three times a week) to social media. CAPUD also distributed the survey link via weekly emails to their existing contacts and the networks of EWG members.
PHAC contacted just over 800 stakeholders, including provincial and territorial contacts, local public health, and community-based organizations, to distribute the survey link and participate as appropriate. National and regional STBBI organizations, and other government departments were encouraged to promote the survey link to their networks of service providers. Service providers were also encouraged to share the survey link with other known community-based organizations that provide STBBI services and to share with their clients as deemed appropriate. Combined, over 5,000 different organizations and individuals from the general population were emailed through existing government stakeholder contact lists. The survey link was also distributed via PHAC social media channels (i.e., over 175,000 Facebook followers, 500,000 Twitter followers, and 275,000 LinkedIn followers) throughout the data collection period, and social media posts were re-posted by key national stakeholders.
The survey protocol and questionnaire were approved by the Health Canada/PHAC Research Ethics Board. Due to the anonymous nature of this survey and an anticipated low participant burden, financial compensation was not offered for participation in this survey.
Measures
All indicators were measured from the questions asked in the survey. While most indicators can be interpreted directly from the survey questions, some required additional coding for better interpretation. In some cases, categories were collapsed to account for small cell counts or when similar concepts needed to be grouped. Described below are measures that required additional coding.
Substance use
The list of substances used in the questionnaire was derived from a list used by the National Tracks Surveillance System, specifically the Tracks people who inject drugs Phase 4 (2017-2019) questionnaireFootnote 5.
From a list of substances, including alcohol and cannabis (the Government of Canada legalized its recreational use in October 2018), participants were asked how their consumption for each substance changed since the start of the COVID-19 pandemic. Answer options were "increase", "decrease", "no change", "I do not use this", and "prefer not to answer."
A "drugs used" variable was derived separating participants who reported use of only alcohol and/or cannabis from those who reported use of any illegal substances (with or without alcohol and/or cannabis). This measure was used to compare the two groups across some indicators. Illegal substances used by participants included the following:
- Cocaine or crack
- Speed, methamphetamine or crystal meth
- Hallucinogens
- Ecstasy
- Heroin, fentanyl or other non-medical opioids
- Other substances
Food security
From a list of statements related to food access and food security, participants were asked how true each statement was since the start of the COVID-19 pandemic using a scale of "often true", "sometimes true", and "never true." Participants were classified as experiencing food insecurity if they indicated "often true" or "sometimes true" to any of the following statements:
- The food that you or other household members bought just didn't last, and there wasn't any money to get more
- You or other household members couldn't afford to eat balanced meals
- You personally ever ate less than you felt you should because there wasn't enough money to buy food
- Others in your household ate less than you felt they should because there wasn't enough money to buy food
- You or other household members accessed food or meals, at no cost to you, from a community organization
Domestic violence
From a list describing specific acts of domestic violence, participants were asked how their experiences with each of these acts, in the place where they lived, changed since the start of the COVID-19 pandemic. Answer options were "less often", "more often", "no change", "did not experience", "does not apply to me", and "prefer not to answer."
For each act of domestic violence, a variable was derived separating participants who reported experiencing the specific act from those who did not. Participants were classified as experiencing domestic violence if they indicated "less often", "more often" or "no change" to any of the following acts:
- Someone yelled at you or said things to you that made you feel bad about yourself, embarrassed you in front of others, or frightened you
- Someone did things like push, grab, hit, slap, kick, or throw things at you during an argument or because they were angry with you
- Someone was more sexually aggressive towards you
- Someone yelled at someone you live with
- Someone did things like push, grab, hit, slap, kick, or throw things at someone you live with
- Someone controlled how money was spent in your household including limiting your access or withholding funds from you
Discrimination
From a list of attributes possibly related to discrimination, participants were asked for their self-perception of change in their experiences of discrimination when accessing healthcare services since the start of the COVID-19 pandemic. Answer options were "increase", "decrease", "no change", and "did not experience."
For each attribute, a variable was derived separating participants who reported experiencing discrimination based on the particular attribute from those who did not. Participants were classified as experiencing discrimination if they indicated "increase", "decrease" or "no change" to any of the following attributes:
- Race or ethnicity or skin colour, including anti-Black racism or anti-Indigenous racism
- Gender
- Sexual orientation
- Use of substances
- Economic status
- Disability
- Age
Access to STBBI-related services
Participants were asked about their access to the following three STBBI-related services:
- STBBI prevention, testing and treatment services (e.g., STBBI testing and treatment, oral HIV pre-exposure prophylaxis (PrEP) or post-exposure prophylaxis (PEP), condom and/or dental dam provision, etc.)
- harm reduction services (e.g., needle or syringe distribution, on-site consumption, drug checking, naloxone training and provision, etc.)
- substance use and treatment services (e.g., counselling, opioid substitution treatment (OST), inpatient services, community-based programs and services, etc.)
From a list of specific services for each of the above three STBBI-related services, participants were asked to describe their access to these services since the start of the COVID-19 pandemic. Answer options were "always able to access", "sometimes able to access", "wanted or tried to, but was not able to access", and "did not try to access." Participants were classified as having difficulty accessing a particular service if they reported "sometimes able to access" or "wanted or tried to, but was not able to access."
Analysis
The purpose of this report and the analyses undertaken were exploratory and descriptive in nature. Small cell counts were assessed to determine the risk of identifying individual participants, and were left in when it was determined that there was no risk of re-identification, as per PHAC's Directive for the Collection, Use and Dissemination of Information Relating to Public Health (PHAC, 2013, unpublished document). Where data in the table contain small cell counts, the results should be interpreted with caution. All descriptive statistics were computed with SAS Enterprise Guide 7.1.
For each survey question, participants who responded with answer options "prefer not to answer", "don't know", "refused" (i.e., did not answer a question and proceeded to next question), or "not stated" (i.e., question not answered because session timed out or exited survey before completion) were excluded from analyses of the question except where otherwise indicated.
Results
Sociodemographic characteristics
A total of 1,034 eligible individuals participated in the survey from January 5 to February 5, 2021. More than one-third (39.7%) of participants were living in Ontario with smaller proportions living in British Columbia (14.2%), Quebec (12.2%), Nova Scotia (9.4%), Alberta (7.3%), Manitoba (4.5%), New Brunswick (4.0%), Saskatchewan (3.8%), Newfoundland and Labrador (3.0%), Prince Edward Island (0.7%), and the Territories (1.4%) (Table 1).
Among all participants, the average age was 40.5 years, ranging from 18 to 84 years. The largest proportion were between the ages of 25 to 39 years (43.4%), followed by those aged 40 to 54 years (28.8%) then those aged 55 years or older (17.6%) and younger than 25 years (10.2%).
Nearly two-thirds (61.2%) identified their gender as cisgender female, 32.6% as cisgender male, 4.2% as transmasculine (i.e., those assigned female at birth who identified with either male or a non-binary gender), and 2.0% as transfeminine (i.e., those assigned male at birth who identified with either female or a non-binary gender). Almost three-quarters (70.2%) reported their sexual orientation as heterosexual or straight and smaller proportions identified as bisexual (13.7%), gay or lesbian (7.8%), Two-spirit (1.1%), other (5.0%), or don't know (2.1%).
A large proportion identified as White (85.0%) and smaller proportions identified as Indigenous (8.5%), Black (2.9%) or South Asian (2.3%). Among participants who self-identified as Indigenous, 59.8% identified as First Nations, 32.2% as Métis, and 11.5% as another unspecified Indigenous subgroup.
Most (89.4%) were Canadian citizens born in Canada with a small proportion (8.2%) born outside of Canada. Of those born outside of Canada, the median (with interquartile ranges or IQR) number of years lived in Canada was 26 (30 to 50) years.
Among all participants, most (86.2%) had more than a high school education, 7.9% completed high school, and 6.0% had less than a high school education.
Since the start of the pandemic, most (91.5%) were living in stable housing (i.e., living in their own apartment or house, or in a family or friend's place). A small proportion (8.5%) reported living in precarious or inadequate housing (i.e., living in multiple residences or couch surfing, a hotel or motel room, rooming or boarding house, shelter or hostel, transition or halfway house, psychiatric institution or drug treatment facility, public place, or correctional facility).
As noted, participants were separated into one of two groups based on the substances they used: those who used only alcohol and/or cannabis (i.e., "legal" drugs) and those who used illegal drugs (with or without alcohol and/or cannabis). Some sociodemographic characteristics varied between these two groups. Compared to participants who used only alcohol and/or cannabis, there appears to be higher proportions of participants who used illegal drugs who: were between the ages of 25 to 39 years (51.0% vs. 34.6%); were cisgender male (36.3% vs. 29.4%); identified as bisexual (18.5% vs. 10.2%); and reported living in precarious or inadequate housing (14.2% vs. 4.2%).
| Characteristic | All participants | Used only alcohol and/or cannabis | Used illegal drugs | ||||||
|---|---|---|---|---|---|---|---|---|---|
| n | TotalFootnote a | % | n | Total | % | n | Total | % | |
| Province or territory where participant lives | |||||||||
| British Columbia | 146 | 1,032 | 14.2 | 56 | 451 | 12.4 | 66 | 393 | 16.8 |
| Alberta | 75 | 1,032 | 7.3 | 39 | 451 | 8.7 | 27 | 393 | 6.9 |
| Saskatchewan | 39 | 1,032 | 3.8 | 20 | 451 | 4.4 | 12 | 393 | 3.1 |
| Manitoba | 46 | 1,032 | 4.5 | 14 | 451 | 3.1 | 19 | 393 | 4.8 |
| Ontario | 410 | 1,032 | 39.7 | 184 | 451 | 40.8 | 159 | 393 | 40.5 |
| Quebec | 126 | 1,032 | 12.2 | 54 | 451 | 12.0 | 45 | 393 | 11.5 |
| New Brunswick | 41 | 1,032 | 4.0 | 18 | 451 | 4.0 | 15 | 393 | 3.8 |
| Nova Scotia | 97 | 1,032 | 9.4 | 44 | 451 | 9.8 | 34 | 393 | 8.7 |
| Prince Edward Island | 7 | 1,032 | 0.7 | 3 | 451 | 0.7 | 3 | 393 | 0.8 |
| Newfoundland and Labrador | 31 | 1,032 | 3.0 | 16 | 451 | 3.6 | 9 | 393 | 2.3 |
| TerritoriesFootnote b | 14 | 1,032 | 1.4 | 3 | 451 | 0.7 | 4 | 393 | 1.0 |
| Age group | |||||||||
| Younger than 25 years | 105 | 1,034 | 10.2 | 35 | 451 | 7.8 | 40 | 394 | 10.2 |
| 25 to 39 years | 449 | 1,034 | 43.4 | 156 | 451 | 34.6 | 201 | 394 | 51.0 |
| 40 to 54 years | 298 | 1,034 | 28.8 | 151 | 451 | 33.5 | 105 | 394 | 26.7 |
| 55 years or older | 182 | 1,034 | 17.6 | 109 | 451 | 24.2 | 48 | 394 | 12.2 |
| Gender identityFootnote c Footnote d | |||||||||
| Cisgender female | 622 | 1,016 | 61.2 | 305 | 449 | 67.9 | 201 | 383 | 52.5 |
| Cisgender male | 331 | 1,016 | 32.6 | 132 | 449 | 29.4 | 139 | 383 | 36.3 |
| TransfeminineFootnote e | 20 | 1,016 | 2.0 | 3 | 449 | 0.7 | 16 | 383 | 4.2 |
| TransmasculineFootnote f | 43 | 1,016 | 4.2 | 9 | 449 | 2.0 | 27 | 383 | 7.1 |
| Sexual orientationFootnote g | |||||||||
| Heterosexual or straight | 726 | 1,034 | 70.2 | 367 | 451 | 81.4 | 222 | 394 | 56.4 |
| Bisexual | 142 | 1,034 | 13.7 | 46 | 451 | 10.2 | 73 | 394 | 18.5 |
| Gay or lesbian | 81 | 1,034 | 7.8 | 23 | 451 | 5.1 | 43 | 394 | 10.9 |
| Two-spirit | 11 | 1,034 | 1.1 | 0 | 451 | 0.0 | 11 | 394 | 2.8 |
| Other | 52 | 1,034 | 5.0 | 10 | 451 | 2.2 | 35 | 394 | 8.9 |
| Don't know | 22 | 1,034 | 2.1 | 5 | 451 | 1.1 | 10 | 394 | 2.5 |
| Race or racial backgroundFootnote h | |||||||||
| White | 879 | 1,034 | 85.0 | 395 | 451 | 87.6 | 327 | 394 | 83.0 |
| Indigenous | 88 | 1,034 | 8.5 | 28 | 451 | 6.2 | 44 | 394 | 11.2 |
| Black | 30 | 1,034 | 2.9 | 8 | 451 | 1.8 | 14 | 394 | 3.6 |
| South Asian | 24 | 1,034 | 2.3 | 16 | 451 | 3.6 | <5 | 394 | - |
| Middle Eastern | 15 | 1,034 | 1.5 | 7 | 451 | 1.6 | 5 | 394 | 1.3 |
| Latino | 13 | 1,034 | 1.3 | 6 | 451 | 1.3 | 5 | 394 | 1.3 |
| East Asian | 10 | 1,034 | 1.0 | <5 | 451 | - | <5 | 394 | - |
| Southeast Asian | 9 | 1,034 | 0.9 | <5 | 451 | - | <5 | 394 | - |
| Other race unspecified | 31 | 1,034 | 3.0 | 8 | 451 | 1.8 | 18 | 394 | 4.6 |
| Indigenous subgroupFootnote i | |||||||||
| First Nations | 52 | 87 | 59.8 | 20 | 28 | 71.4 | 23 | 43 | 53.5 |
| Métis | 28 | 87 | 32.2 | 8 | 28 | 28.6 | 15 | 43 | 34.9 |
| Inuit | <5 | 87 | - | 0 | 28 | 0.0 | 0 | 43 | 0.0 |
| Other Indigenous subgroupFootnote j | 10 | 87 | 11.5 | 0 | 28 | 0.0 | 8 | 43 | 18.6 |
| Citizenship status | |||||||||
| Canadian citizen, born in Canada | 923 | 1,032 | 89.4 | 396 | 451 | 87.8 | 359 | 393 | 91.4 |
| Canadian citizen, not born in Canada | 85 | 1,032 | 8.2 | 43 | 451 | 9.5 | 26 | 393 | 6.6 |
| Landed immigrant or permanent resident | 17 | 1,032 | 1.7 | 8 | 451 | 1.8 | 6 | 393 | 1.5 |
| Convention refugee or temporary residentFootnote k Footnote l | 7 | 1,032 | 0.7 | 4 | 451 | 0.9 | 2 | 393 | 0.5 |
| Education, highest level | |||||||||
| Less than high school | 61 | 1,019 | 6.0 | 17 | 445 | 3.8 | 34 | 389 | 8.7 |
| Completed high school | 80 | 1,019 | 7.9 | 28 | 445 | 6.3 | 36 | 389 | 9.3 |
| More than high school | 878 | 1,019 | 86.2 | 400 | 445 | 89.9 | 319 | 389 | 82.0 |
| Housing statusFootnote m | |||||||||
| Stable housingFootnote n | 946 | 1,034 | 91.5 | 432 | 451 | 95.8 | 338 | 394 | 85.8 |
| Precarious or inadequate housingFootnote o | 88 | 1,034 | 8.5 | 19 | 451 | 4.2 | 56 | 394 | 14.2 |
Abbreviations: STBBI: sexually transmitted and blood-borne infection; -: indicates data was suppressed due to small cell counts. Note: The sum of the percentages may not equal 100% due to rounding, unless stated otherwise.
|
|||||||||
Social determinants of health
For indicators measuring social determinants of health, a comparison between the groups of participants who reported use of only alcohol and/or cannabis and those who reported use of illegal drugs yielded similar results, thus only the overall results (i.e., among all participants) are presented.
Mental health and wellness
At the time of the survey, nearly one-quarter (23.7%) of participants reported their mental health was excellent or very good, 29.8% reported good, 30.3% reported fair, and 16.3% reported poor mental health (Table 2). When asked how their mental health had changed since the start of the pandemic, 59.8% reported their mental health was worse.
Since the start of the pandemic, among participants who accessed, considered accessing or wanted to access mental health and wellness services, 65.6% indicated they were "not always able" (i.e., not able or sometimes not able) to access such services.
| Indicator | n | TotalFootnote a | % | ||||||
|---|---|---|---|---|---|---|---|---|---|
| Mental health at the time of the survey | |||||||||
| Excellent or very good | 245 | 1,034 | 23.7 | ||||||
| Good | 308 | 1,034 | 29.8 | ||||||
| Fair | 313 | 1,034 | 30.3 | ||||||
| Poor | 168 | 1,034 | 16.3 | ||||||
| Change in mental health since the start of the COVID-19 pandemic | |||||||||
| Better | 94 | 1,033 | 9.1 | ||||||
| About the same | 321 | 1,033 | 31.1 | ||||||
| Worse | 618 | 1,033 | 59.8 | ||||||
| Accessed, considered accessing or wanted to access mental health and wellness servicesFootnote b since the start of the COVID-19 pandemic | |||||||||
| Yes | 600 | 1,029 | 58.3 | ||||||
| No | 429 | 1,029 | 41.7 | ||||||
| Not always able to access mental health and wellness servicesFootnote c | 392 | 598 | 65.6 | ||||||
Abbreviations: STBBI: sexually transmitted and blood-borne infection. Note: The sum of the percentages may not equal 100% due to rounding, unless stated otherwise.
|
|||||||||
A pattern of worsening mental health was observed among participants who reported poor mental health at the time of the survey (Figure 1). Among participants who reported their mental health was excellent or very good at the time of the survey, 32.2% felt their mental health was worse since the start of the pandemic and more notably, among those who reported poor mental health at the time of the survey, 84.5% felt their mental health had worsened since the start of the pandemic.

Figure 1: Text description
The graph presents 4 stacked bars displaying the changes in mental health since the start of the COVID-19 pandemic by mental health in general at the time of the survey.
| Change category for mental health | Excellent or very good |
Good |
Fair |
Poor |
|---|---|---|---|---|
| Better | 11.4% | 10.1% | 9.3% | 3.6% |
| About the same | 56.3% | 32.3% | 20.5% | 11.9% |
| Worse | 32.2% | 57.7% | 70.3% | 84.5% |
Employment and financial security
Before the COVID-19 pandemic, over one-half (58.9%) of participants were working full time, 17.4% were working part time, and 11.4% were either a full or part time student (Table 3). Smaller proportions were not working due to a disability (7.0%), volunteering (6.4%), unemployed (6.2%), retired (6.0%), looking after children or other family members (3.5%), or had other unspecified work (3.7%). Participants could report more than one work situation.
Since the start of the pandemic, while 51.7% of participants indicated there was little to no change to their work situation, 18.2% had stopped working and 14.1% had their hours and/or pay reduced. Main reasons for these changes were related to the COVID-19 pandemic and included business closures or layoffs (46.9%) and personal circumstances (25.8%) (e.g., personal safety, own or household member's exposure, self-isolation after recent travel, or taking care of children due to school and/or daycare closures).
Regarding the impact of the pandemic on the ability to pay bills for essential needs (e.g., rent, mortgage payments, utilities, or groceries), 44.3% of participants reported there was no impact or it was too soon to tell, 20.7% indicated a moderate impact, and 15.1% reported a major impact.
Since the start of the pandemic, nearly one-third (31.8%) of participants applied to and received employment or emergency response benefits. The Canada Emergency Response Benefit (64.9%) and regular employment insurance benefits (30.4%) were the most commonly received benefits. Participants could report more than one benefit received.
| Indicator | n | TotalFootnote a | % |
|---|---|---|---|
| Work situation before the COVID-19 pandemicFootnote b | |||
| Employed or self-employed full time | 594 | 1,009 | 58.9 |
| Employed or self-employed part time | 176 | 1,009 | 17.4 |
| Full or part time student | 115 | 1,009 | 11.4 |
| Not working due to a disability | 71 | 1,009 | 7.0 |
| Volunteering | 65 | 1,009 | 6.4 |
| Unemployed | 63 | 1,009 | 6.2 |
| Retired | 60 | 1,009 | 6.0 |
| Looking after children or other family members | 35 | 1,009 | 3.5 |
| Other | 37 | 1,009 | 3.7 |
| Change in work situation since the start of the COVID-19 pandemic | |||
| Little to no change | 518 | 1,002 | 51.7 |
| Had to stop working | 182 | 1,002 | 18.2 |
| Increased hours and/or pay | 161 | 1,002 | 16.1 |
| Reduced hours and/or pay | 141 | 1,002 | 14.1 |
| Main reason for limited or stopped workFootnote c during the COVID-19 pandemic | |||
| Business closure or layoff related to the COVID-19 pandemic | 151 | 322 | 46.9 |
| Personal circumstances related to the COVID-19 pandemicFootnote d | 83 | 322 | 25.8 |
| Unplanned absence not related to the COVID-19 pandemicFootnote e | 41 | 322 | 12.7 |
| Planned absence not related to the COVID-19 pandemicFootnote f | 7 | 322 | 2.2 |
| Other unspecified reason | 40 | 322 | 12.4 |
| Impact of the COVID-19 pandemic on ability to pay billsFootnote g | |||
| Major impact | 150 | 997 | 15.1 |
| Moderate impact | 206 | 997 | 20.7 |
| Minor impact | 199 | 997 | 20.0 |
| No impact or too soon to tell | 442 | 997 | 44.3 |
| Employment or emergency response benefits received since the start of the COVID-19 pandemic | |||
| Applied and received benefits | 313 | 985 | 31.8 |
| Did not apply for any benefits | 365 | 985 | 37.1 |
| Did not qualify for any benefits | 307 | 985 | 31.2 |
| Type of employment or emergency response benefits received since the start of the COVID-19 pandemicFootnote h | |||
| Canada Emergency Response Benefit (CERB)Footnote i | 203 | 313 | 64.9 |
| Regular Employment Insurance benefits | 95 | 313 | 30.4 |
| Canada Emergency Student Benefit (CESB)Footnote j | 40 | 313 | 12.8 |
| Sickness | 31 | 313 | 9.9 |
| Other Employment Insurance benefit | 14 | 313 | 4.5 |
| OtherFootnote k | 12 | 313 | 3.8 |
Abbreviations: STBBI: sexually transmitted and blood-borne infection. Note: The sum of the percentages may not equal 100% due to rounding, unless stated otherwise.
|
|||
Food security
Since the start of the COVID-19 pandemic, under one-half (42.1%) of participants reported they experienced food insecurity (Table 4). Participants' experiences of food insecurity included: couldn't afford balanced meals (34.4%), food didn't last in the household and participants didn't have money to get more (31.4%), participants (28.2%) or other household members (20.7%) ate less because there was not enough money to buy food, and participants accessed food from a community organization (17.6%).
| Indicator | n | TotalFootnote a | % |
|---|---|---|---|
| Experienced food insecurityFootnote b | |||
| Yes | 399 | 947 | 42.1 |
| No | 548 | 947 | 57.9 |
| Experiences of food insecurityFootnote b | |||
| Couldn't afford balanced meals | 326 | 948 | 34.4 |
| Food didn't last and no money to get more | 297 | 948 | 31.4 |
| Personally ate less because not enough money to buy food | 267 | 946 | 28.2 |
| Other household members ate less because not enough money to buy food | 196 | 948 | 20.7 |
| Accessed food (at no cost) from a community organization | 167 | 948 | 17.6 |
Abbreviations: STBBI: sexually transmitted and blood-borne infection. Note: The sum of the percentages may not equal 100% due to rounding, unless stated otherwise.
|
|||
Food insecurity was highest among participants not working due to a disability (78.3%), those looking after children or other family members (71.0%), and those who were unemployed (67.9%) (Figure 2).
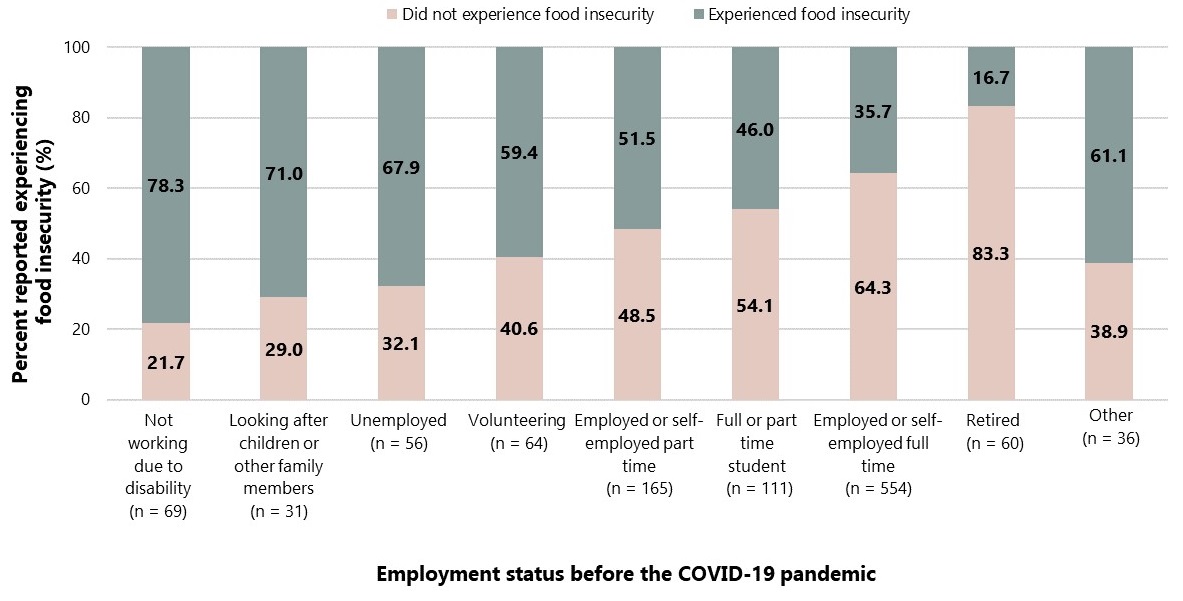
Figure 2: Text description
The graph presents 9 stacked bars displaying the experiences in food insecurity since the start of the COVID-19 pandemic by employment status before the COVID-19 pandemic.
| Experience of food insecurity | Not working due to disabilities | Unemployed | Volunteering | Employed or self-employed part time | Full or part time student | Looking after children or other family members | Retired | Employed or self-employed full time | Other |
|---|---|---|---|---|---|---|---|---|---|
| Did not experience food insecurity | 21.7% | 29.0% | 32.1% | 40.6% | 48.5% | 54.1% | 64.3% | 83.3% | 38.9% |
| Experienced food insecurity | 78.3% | 71.0% | 67.9% | 59.4% | 51.5% | 46.0% | 35.7% | 16.7% | 61.1% |
A pattern of greater food insecurity was observed among participants who reported changes to their work situation since the start of the pandemic. Food insecurity was highest among those who reported reduced hours and/or pay (66.4%) and those who had to stop working (63.4%) (Figure 3).

Figure 3: Text description
The graph presents 4 stacked bars displaying the experiences in food insecurity by changes in work situation since the start of the COVID-19 pandemic.
| Experience of food insecurity by changes in work situation | Reduced hours and/or pay |
Had to stop working |
Little to no change |
Increased hours and/or pay |
|---|---|---|---|---|
| Did not experience food insecurity | 33.6% | 36.6% | 67.8% | 70.9% |
| Experienced food insecurity | 66.4% | 63.4% | 32.2% | 29.1% |
Domestic violence
More than two-thirds (69.9%) of participants were living with family since the start of the pandemic (Table 5). One-fifth (19.8%) were living alone while 9.2% were living with a roommate(s) or friend(s), and 1.1% were living in a shelter or were homeless.
In the year before the pandemic, most (67.8%) participants reported feeling very safe where they lived, 26.8% reported feeling somewhat safe, and 5.4% reported feeling not safe.
| Indicator | n | TotalFootnote a | % |
|---|---|---|---|
| Living arrangement since the start of the COVID-19 pandemic | |||
| Living with family | 653 | 934 | 69.9 |
| Living alone | 185 | 934 | 19.8 |
| Living with roommate(s) or friend(s) | 86 | 934 | 9.2 |
| Living in a shelter or homeless | 10 | 934 | 1.1 |
| Feelings of safety where participant lived in the year before the COVID-19 pandemic | |||
| Felt very safe | 632 | 932 | 67.8 |
| Felt somewhat safe | 250 | 932 | 26.8 |
| Did not feel safe | 50 | 932 | 5.4 |
Abbreviations: STBBI: sexually transmitted and blood-borne infection. Note: The sum of the percentages may not equal 100% due to rounding, unless stated otherwise.
|
|||
Feeling safe where they lived since the start of the pandemic varied depending on the level of safety participants felt before the pandemic (Figure 4). Among participants who felt very safe in their home before the pandemic, 19.3% felt less safe since the start of the pandemic while 76.4% felt no change in their safety. Among participants who felt somewhat safe before the pandemic, over one-third (35.6%) felt less safe and 55.2% felt the same since the start of the pandemic. Among participants who did not feel safe before the pandemic, one-half (50.0%) felt less safe, 22.0% felt the same, and 28.0% felt safer since the start of the pandemic.

Figure 4: Text description
The graph presents 3 stacked bars displaying the changes in feelings of safety since the start of the COVID-19 pandemic by feelings of safety in the home in the year before the pandemic.
| Changes in feelings of safety | Felt very safe | Felt somewhat safe | Did not feel safe |
|---|---|---|---|
| Felt more safe | 4.3% | 9.2% | 28.0% |
| The same | 76.4% | 55.2% | 22.0% |
| Felt less safe | 19.3% | 35.6% | 50.0% |
Among those who experienced any act of domestic violence (Table 6), participants were asked how their experiences had changed since the start of the pandemic (Figure 5). Since the start of the pandemic, participants reported the largest increase in verbal abuse directed towards them (62.7%), followed by verbal abuse directed at someone else in the household (56.5%), physical abuse directed at them (39.3%), physical abuse directed at someone else in the household (35.0%), financial abuse (34.3%), and sexual aggression (32.5%).
| Indicator: Since the start of the COVID-19 pandemic | n | Total Footnote a | % |
|---|---|---|---|
| Experienced verbal abuseFootnote b Footnote c | |||
| Yes | 475 | 804 | 59.1 |
| No | 329 | 804 | 40.9 |
| Experienced verbal abuse directed at someone else in householdFootnote b Footnote d | |||
| Yes | 455 | 753 | 60.4 |
| No | 298 | 753 | 39.6 |
| Experienced physical abuseFootnote b Footnote e | |||
| Yes | 219 | 751 | 29.2 |
| No | 532 | 751 | 70.8 |
| Experienced physical abuse directed at someone else in householdFootnote b Footnote f | |||
| Yes | 177 | 695 | 25.5 |
| No | 518 | 695 | 74.5 |
| Experienced financial abuseFootnote b Footnote g | |||
| Yes | 242 | 709 | 34.1 |
| No | 467 | 709 | 65.9 |
| Experienced sexual aggressionFootnote b Footnote h | |||
| Yes | 228 | 721 | 31.6 |
| No | 493 | 721 | 68.4 |
Abbreviations: STBBI: sexually transmitted and blood-borne infection. Note: The sum of the percentages may not equal 100% due to rounding, unless stated otherwise.
|
|||

Figure 5: Text description
The graph presents 6 stacked bars displaying the changes in frequency of experienced domestic violence by specific acts of domestic violence experienced since the start COVID-19 pandemic.
| Changes in frequency of experienced domestic violence | Verbal abuse | Verbal abuse towards others | Financial abuse | Physical abuse | Physical abuse towards others | Sexual aggression |
| Less often | 4.0% | 3.7% | 2.3% | 2.3% | 3.3% | 5.3% |
| No change | 33.3% | 39.8% | 58.5% | 62.7% | 62.4% | 62.3% |
| More often | 62.7% | 56.5% | 39.3% | 35.0% | 34.3% | 32.5% |
Discrimination
In the year before the pandemic, one-third (33.3%) of participants reported experiencing discrimination when accessing healthcare services while two-thirds (66.7%) reported "never" experiencing such discrimination (Table 7).
| Indicator: In the year before the start of the COVID-19 pandemic | n | TotalFootnote a | % |
|---|---|---|---|
| Experienced discriminationFootnote b Footnote c | |||
| None | 520 | 780 | 66.7 |
| Any | 260 | 780 | 33.3 |
| Frequency of experienced discriminationFootnote b Footnote c | |||
| Often | 61 | 780 | 7.8 |
| Sometimes | 127 | 780 | 16.3 |
| Rarely | 72 | 780 | 9.2 |
| Never | 520 | 780 | 66.7 |
Abbreviations: STBBI: sexually transmitted and blood-borne infection. Note: The sum of the percentages may not equal 100% due to rounding, unless stated otherwise.
|
|||
Experiences of discrimination when accessing healthcare services during the pandemic varied depending on these experiences before the pandemic (Figure 6). Participants who often experienced discrimination before the pandemic reported the largest increase (59.7%) in these experiences since the start of pandemic. Increased experiences of discrimination during the pandemic was reported by 36.0% of participants who sometimes experienced discrimination, 18.8% of those who rarely experienced discrimination, and 4.4% of those who never experienced discrimination in the year before the pandemic.

Figure 6: Text description
The graph presents 4 stacked bars displaying the changes in frequency of discrimination since the start of the COVID-19 pandemic by frequency of experienced discrimination in the year before the pandemic.
| Changes in frequency of experienced discrimination | Often | Sometimes | Rarely | Never |
| Decrease | 14.0% | 12.6% | 7.8% | 1.6% |
| No change | 26.3% | 51.4% | 73.4% | 94.0% |
| Increase | 59.7% | 36.0% | 18.8% | 4.4% |
Among participants who experienced discrimination since the start of the pandemic, most reported no change in their experiences of discrimination based on substance use, disability, age, economic status, race, gender, or sexual orientation (Figure 7). Many reported experiencing an increase in discrimination related to their substance use (40.7%), disability (31.5%), age (26.2%), economic status (22.6%), race/ethnicity/skin colour (15.5%), gender (13.9%), and sexual orientation (8.8%) when accessing healthcare services since the start of the pandemic. Participants could report more than one attribute related to their experienced discrimination.

Figure 7: Text description
The graph presents 7 stacked bars displaying the changes in experienced discrimination by attributes related to the discrimination experienced since the start of the COVID-19 pandemic.
| Changes in experienced discrimination by attribute | Use of substances | Disability | Age | Economic status | Race or ethnicity or skin colour | Gender | Sexual orientation |
| Decrease | 7.9% | 3.8% | 2.2% | 11.9% | 3.2% | 1.6% | 2.4% |
| No change | 51.4% | 64.7% | 71.6% | 65.5% | 81.3% | 84.5% | 88.8% |
| Increase | 40.7% | 31.5% | 26.2% | 22.6% | 15.5% | 13.9% | 8.8% |
Substance use
Since the start of the pandemic, most (88.6%) participants consumed alcohol and two-thirds (67.5%) used cannabis (Table 8).
As noted, participants were separated into two groups based on the substances they used. Just over one-half (53.4%) reported the use of only alcohol and/or cannabis (i.e., "legal" drugs) and 46.6% reported the use of "illegal" drugs (with or without alcohol and/or cannabis).
Among participants who used only alcohol and/or cannabis, 43.7% used only alcohol, 6.7% used only cannabis, and 49.7% used both alcohol and cannabis.
Of the participants who used illegal drugs, most used alcohol (83.8%) and cannabis (80.6%) in addition to their use of hallucinogens (51.9%); cocaine or crack (39.8%); speed, methamphetamine or crystal meth (32.3%); ecstasy (31.2%); and heroin, fentanyl or other non-medical opioids (27.9%). Almost two-thirds (62.5%) of those who used illegal drugs reported the use of other substances.
| Indicator: Since the start of the COVID-19 pandemic | All participants | Used only alcohol and/or cannabis | Used illegal drugs | ||||||
|---|---|---|---|---|---|---|---|---|---|
| n | TotalFootnote a | % | n | Total | % | n | Total | % | |
| Substances usedFootnote b | |||||||||
| Alcohol | 751 | 848 | 88.6 | 421 | 450 | 93.6 | 330 | 394 | 83.8 |
| Cannabis | 570 | 844 | 67.5 | 254 | 449 | 56.6 | 316 | 392 | 80.6 |
| Used only alcohol and/or cannabisFootnote b Footnote c | 451 | 845 | 53.4 | - | - | - | - | - | - |
| Alcohol only | - | - | - | 197 | 451 | 43.7 | - | - | - |
| Cannabis only | - | - | - | 30 | 451 | 6.7 | - | - | - |
| Both alcohol and cannabis | - | - | - | 224 | 451 | 49.7 | - | - | - |
| Used illegal substancesFootnote b Footnote c Footnote d | 394 | 845 | 46.6 | - | - | - | - | - | - |
| Hallucinogens | 203 | 834 | 24.3 | - | - | - | 203 | 391 | 51.9 |
| Cocaine or crack | 156 | 840 | 18.6 | - | - | - | 156 | 392 | 39.8 |
| Speed, methamphetamine or crystal meth | 126 | 838 | 15.0 | - | - | - | 126 | 390 | 32.3 |
| Ecstasy | 122 | 840 | 14.5 | - | - | - | 122 | 391 | 31.2 |
| Heroin, fentanyl or other non-medical opioids | 109 | 840 | 13.0 | - | - | - | 109 | 391 | 27.9 |
| Other substances | 242 | 833 | 29.1 | - | - | - | 242 | 387 | 62.5 |
Abbreviations: STBBI: sexually transmitted and blood-borne infection. Note: The sum of the percentages may not equal 100% due to rounding, unless stated otherwise.
|
|||||||||
Changes in substance use
Participants reported increased use of all substances since the start of the pandemic.
Among participants who used only alcohol and/or cannabis, 56.3% reported increased use of alcohol and 57.1% reported increased use of cannabis since the start of the pandemic (Table 9).
| Indicator: Since the start of the COVID-19 pandemic | n | TotalFootnote a | % |
|---|---|---|---|
| Participants who used only alcohol and/or cannabis | 451 | 845 | 53.4 |
| Change in frequency of alcohol use | |||
| Decrease | 57 | 421 | 13.5 |
| No change | 127 | 421 | 30.2 |
| Increase | 237 | 421 | 56.3 |
| Change in frequency of cannabis use | |||
| Decrease | 18 | 254 | 7.1 |
| No change | 91 | 254 | 35.8 |
| Increase | 145 | 254 | 57.1 |
Abbreviations: STBBI: sexually transmitted and blood-borne infection. Note: The sum of the percentages may not equal 100% due to rounding, unless stated otherwise.
|
|||
Among participants who used illegal drugs, almost two-thirds (64.9%) reported increased use of cannabis since the start of the pandemic, followed by increased use of heroin, fentanyl or other non-medical opioids (56.9%); alcohol (56.7%); speed, methamphetamine or crystal meth (52.4%); cocaine or crack (44.9%); hallucinogens (42.9%); and ecstasy (27.1%) (Figure 8). Almost one-half (48.4%) of those who used illegal drugs reported increased use of other substances since the start of the pandemic.

Figure 8: Text description
The graph presents 8 stacked bars displaying the changes in frequency of substances used since the start of the COVID-19 pandemic among participants who used illegal drugs.
| Changes in frequency of substance use | Cannabis | Heroin, fentanyl, or other non-medical opioids | Alcohol | Speed, methamphetamine, or crystal meth | Cocaine or crack | Hallucinogens | Ecstasy | Other substances |
| Decrease | 9.2% | 11.9% | 18.8% | 22.2% | 23.7% | 15.8% | 23.0% | 6.2% |
| No change | 26.0% | 31.2% | 24.6% | 25.4% | 31.4% | 41.4% | 50.0% | 45.5% |
| Increase | 64.9% | 56.9% | 56.7% | 52.4% | 44.9% | 42.9% | 27.1% | 48.4% |
A pattern of increased substance use was observed among participants who reported worsening mental health since the start of the pandemic (Figure 9). More than two-thirds of participants with worsening mental reported increased use of cannabis (71.9%) and alcohol (67.9%), followed by increased use of heroin, fentanyl or other non-medical opioids (63.6%); speed, methamphetamine or crystal meth (61.5%); cocaine or crack (50.0%); hallucinogens (48.3%); and ecstasy (34.9%). Over one-half (58.6%) of those with worsening mental health reported increased use of other substances since the start of the pandemic.

Figure 9: Text description
The graph presents 8 stacked bars displaying the substances used by worsening mental health since the start of the COVID-19 pandemic.
| Changes in frequency of substance use by worsening mental health | Cannabis | Alcohol | Heroin, fentanyl, or other non-medical opioids | Speed, methamphetamine, or crystal meth | Other substances |
Cocaine or crack | Hallucinogen | Ecstasy |
| Decrease | 4.6% | 11.7% | 9.1% | 22.9% | 4.5% | 24.0% | 14.2% | 21.2% |
| No change | 23.6% | 20.5% | 27.3% | 15.7% | 37.0% | 26.0% | 37.5% | 44.0% |
| Increase | 71.9% | 67.9% | 63.6% | 61.5% | 58.6% | 50.0% | 48.3% | 34.9% |
Changes in substance use behaviours
Since the start of the pandemic, many participants reported changes in their substance use behaviours (Figure 10). Among those who used illegal drugs, three-quarters (75.0%) reported an increase in having different triggers for using, 66.3% reported an increase in using alone, and 60.4% indicated an increase use of substances not usually used. Over one-half (60%) reported an increase in withdrawal symptoms, 51.3% reported an increase in not being able to get the substances they used, and 45.1% indicated an increase in their worry about overdosing. Almost one-quarter (24.4%) reported an increase in sharing used drug injection equipment (e.g., needles or syringes, pipes, tourniquets, swabs, and cookers) while 16.3% reported a decrease in sharing since the start of the pandemic.

Figure 10: Text description
The graph presents 7 stacked bars displaying the changes in frequency of substance use behaviour since the start of the COVID-19 pandemic among participants who used illegal drugs.
| Changes in frequency of substance use behaviour | Had different triggers for using | Used alone | Used substances I do not usually use | Had withdrawal symptoms | Was unable to get the substances I use |
Worried about overdosing |
Shared used equipment such as needles or syringes, pipes, tourniquets, swabs, cookers |
| Decrease | 1.9% | 2.5% | 2.9% | 4.8% | 6.9% | 5.6% | 16.3% |
| No change | 23.2% | 31.3% | 36.7% | 35.2% | 41.8% | 49.4% | 59.4% |
| Increase | 75.0% | 66.3% | 60.4% | 60.0% | 51.3% | 45.1% | 24.4% |
Access to STBBI-related services
For indicators measuring access to STBBI prevention, testing and treatment services, the proportions reporting difficulties accessing each of these services were similar between all participants and those who used illegal drugs. Since cell counts for participants who used only alcohol and/or cannabis were small, the results are presented among all participants and among those who used illegal drugs, allowing comparisons of indicators measuring access to harm reduction services as well as substance use and treatment services.
STBBI prevention, testing and treatment services
Among all participants, 17.7% accessed or considered accessing STBBI prevention, testing and treatment services since the start of the pandemic (Table 10). Among those who accessed or considered accessing STBBI services, difficulties (i.e., only sometimes able to access or not able to access) were reported in accessing Indigenous health or healing services (88.0%), referrals to mental health counselling services (80.9%), community services (76.8%), interpreter and/or peer health service navigators (75.9%), and STBBI information and education (66.1%). Difficulties were also reported in accessing testing services, specifically HIV testing (49.5%), hepatitis C testing (48.4%), and other STI testing (57.3%). Participants could report more than one STBBI service accessed.
| Indicator: Since the start of the COVID-19 pandemic | All participants | Used illegal drugs | ||||
|---|---|---|---|---|---|---|
| n | TotalFootnote a | % | n | Total | % | |
| Accessed, considered accessing or wanted to access STBBI prevention, testing and treatment services | ||||||
| Yes | 147 | 829 | 17.7 | 101 | 385 | 26.2 |
| No | 682 | 829 | 82.3 | 284 | 385 | 73.8 |
| Difficulty in accessing STBBI prevention, testing and treatment servicesFootnote b Footnote c | ||||||
| Indigenous health or healing services | 22 | 25 | 88.0 | 19 | 22 | 86.4 |
| Mental health counselling referral | 76 | 94 | 80.9 | 56 | 68 | 82.4 |
| Community services (e.g., peer support services) | 53 | 69 | 76.8 | 43 | 54 | 79.6 |
| Interpreter and/or peer health service navigator | 22 | 29 | 75.9 | 17 | 22 | 77.3 |
| STBBI information and education including outreach events (e.g., health fairs, festivals, community events) | 41 | 62 | 66.1 | 29 | 44 | 65.9 |
| Pre and post HIV test counselling | 21 | 36 | 58.3 | 18 | 32 | 56.3 |
| Other sexually transmitted infection (STI) testing | 67 | 117 | 57.3 | 45 | 82 | 54.9 |
| HIV testing | 48 | 97 | 49.5 | 36 | 76 | 47.4 |
| HCV testing | 44 | 91 | 48.4 | 32 | 70 | 45.7 |
| Resources about safer sex (postcard, pamphlets) | 33 | 80 | 41.3 | 27 | 59 | 45.8 |
| PrEP and/or PEP | 21 | 51 | 41.2 | 17 | 39 | 43.6 |
| Condom and/or dental dam | 34 | 89 | 38.2 | 29 | 67 | 43.3 |
Abbreviations: STBBI: sexually transmitted and blood-borne infection; HIV: human immunodeficiency virus; HCV: hepatitis C virus; PrEP: pre-exposure prophylaxis; PEP: post-exposure prophylaxis. Note: The sum of the percentages may not equal 100% due to rounding, unless stated otherwise.
|
||||||
Support and treatment for people living with HIV and/or hepatitis C
Among all participants, 4.8% reported they were currently living with HIV, of whom most (92.3%) were linked to an HIV care provider or clinic in the year before the pandemic (Table 11). Among those linked to HIV care, one-half (50.0%) experienced challenges accessing this care since the start of the pandemic.
Among all participants, 5.8% reported ever being told they have hepatitis C, of whom 17.4% indicated they currently have hepatitis C (Table 11). All who currently have hepatitis C reported they did not experience any challenges accessing care for hepatitis C since the start of the pandemic.
| Indicator | n | TotalFootnote a | % |
| Self-reported HIV and access to HIV care | |||
|---|---|---|---|
| Currently living with HIV | 39 | 817 | 4.8 |
| Linked to HIV care the year before the COVID-19 pandemic | 36 | 39 | 92.3 |
| Experienced challenges accessing HIV care since the start of the COVID-19 pandemic | 18 | 36 | 50.0 |
| Self-reported hepatitis C and access to hepatitis C care | |||
| Ever been told to have hepatitis C | 47 | 813 | 5.8 |
| Currently have hepatitis CFootnote b | 8 | 46 | 17.4 |
| Linked to hepatitis C care the year before the COVID-19 pandemic | <5 | 8 | - |
| Experienced challenges accessing hepatitis C care since the start of the COVID-19 pandemicFootnote c | 0 | 8 | 0.0 |
Abbreviations: STBBI: sexually transmitted and blood-borne infection; HIV, human immunodeficiency virus; -, indicates data was suppressed due to small cell counts. Note: The sum of the percentages may not equal 100% due to rounding, unless stated otherwise.
|
|||
Harm reduction services
Among participants who used illegal drugs, 39.0% accessed or considered accessing harm reduction services since the start of the pandemic (Table 12). Among those who used illegal drugs and accessed or considered accessing harm reduction services, difficulties were reported in accessing drug consumption rooms (85.2%), drug checking services (83.5%), drop-in centres for people who use drugs (83.1%), community services (78.8%), and outreach services (77.0%). Participants could report more than one harm reduction service accessed.
| Indicator: Since the start of the COVID-19 pandemic | Used illegal drugs | ||
|---|---|---|---|
| n | TotalFootnote a | % | |
| Accessed, considered accessing or wanted to access harm reduction servicesFootnote b | |||
| Yes | 152 | 390 | 39.0 |
| No | 238 | 390 | 61.0 |
| Difficulty in accessing harm reduction servicesFootnote b Footnote c Footnote d | |||
| Drug consumption rooms | 46 | 54 | 85.2 |
| Drug checking services | 71 | 85 | 83.5 |
| Drop-in centres for people who use drugs | 64 | 77 | 83.1 |
| Community services (e.g., peer support services) | 67 | 85 | 78.8 |
| Outreach services | 67 | 87 | 77.0 |
| Delivery service for safe drug supplies | 51 | 73 | 69.9 |
| Needle and syringe distribution programs | 47 | 82 | 57.3 |
| Naloxone training | 46 | 93 | 49.5 |
| Safer drug use educational resources | 43 | 91 | 47.3 |
Abbreviations: STBBI: sexually transmitted and blood-borne infection. Note: The sum of the percentages may not equal 100% due to rounding, unless stated otherwise.
|
|||
Substance use and treatment services
Among participants who used illegal drugs, 30.0% accessed or considered accessing substance use and treatment services since the start of the pandemic (Table 13). Among those who used illegal drugs and accessed or considered accessing substance use and treatment services, difficulties were reported in accessing drug treatment in therapeutic communities (86.5%), psychiatric hospitals (85.7%), and outpatient mental health care centres (82.5%). Difficulties were also reported in accessing opioid substitution treatment (OST) provided by family physicians or nurse practitioners (81.8%). Participants could report more than one substance use and treatment service accessed.
| Indicator: Since the start of the COVID-19 pandemic | Used illegal drugs | ||
|---|---|---|---|
| n | TotalFootnote a | % | |
| Accessed, considered accessing or wanted to access substance-related treatment servicesFootnote b | |||
| Yes | 116 | 387 | 30.0 |
| No | 271 | 387 | 70.0 |
| Difficulty in accessing substance-related treatment servicesFootnote bFootnote cFootnote d | |||
| Drug treatment in non-hospital based residential settings (therapeutic communities) | 32 | 37 | 86.5 |
| Drug treatment in hospital-based residential settings (psychiatric hospitals) | 24 | 28 | 85.7 |
| Drug treatment in outpatient mental health care centres | 33 | 40 | 82.5 |
| OST in non-specialized outpatient treatment centres (e.g., provided by a family doctor or nurse practitioner) | 36 | 44 | 81.8 |
| Outpatient counselling and psychosocial treatment | 62 | 77 | 80.5 |
| Indigenous health or healing services | 11 | 14 | 78.6 |
| Drug treatment in primary healthcare settings (e.g., provided by a family doctor or nurse practitioner) | 34 | 45 | 75.6 |
| Community support services (e.g., peer support services, linkage to safe injection sites and treatment) | 42 | 56 | 75.0 |
| Overdose prevention and response | 28 | 39 | 71.8 |
| OST in specialized outpatient treatment centres | 28 | 42 | 66.7 |
Abbreviations: STBBI: sexually transmitted blood-borne infection; OST, opioid substitution treatment. Note: The sum of the percentages may not equal 100% due to rounding, unless stated otherwise.
|
|||
Barriers to access of STBBI-related services
Since the start of the pandemic, among all participants, the most frequently reported reasons as to why they were not able to access STBBI prevention, testing and treatment services, harm reduction services, and substance use and treatment services, included the following:
- Reduced hours of operation or the service was closed
- Difficulty getting an appointment
- Difficulty getting a referral
- Difficulty contacting a doctor or nurse to get information or advice
- Difficulty accessing the service because of COVID-19 related public health measures
- Fear of, or concern about exposure to someone with COVID-19
- Fear of, concern about or experienced stigma, discrimination or violence
Discussion
Findings from this national Survey on the Impact of COVID-19 on access to STBBI-related services, including harm reduction services, for people who use drugs or alcohol in Canada highlight the negative impacts of the COVID-19 pandemic on access to STBBI-related services, social determinants of health, and substance use.
At the time of this survey (January 5 to February 5, 2021), Canada was at the tail end of the second wave of the COVID-19 pandemic that began in late August 2020 and peaked nationally in January 2021. Many restrictions, including business, workplace and school closures, limits on social gatherings, and cancellation of public events, were eased by end of summer of 2020Footnote 12. The second wave was characterized by increased community transmission related to workplace outbreaks and social gatherings, especially among the younger age groupsFootnote 12. Areas and populations (i.e., the Territories, Prairie provinces, some Indigenous communities, and younger Canadians) not greatly affected in the first wave were impacted in the second waveFootnote 12. Vaccination efforts began in December 2020 and focused on residents in long-term care facilities and healthcare workers. Since vaccines were still not widely available in early February 2021, public health measures (e.g., case management and contact tracing, school and business closures, and stay-at-home orders) and individual prevention practices (e.g., masking, physical distancing and hand hygiene) continued to be the primary means to manage the pandemic. International border measures, restricting non-essential travel and business activities, also remained in place.
Impact of COVID-19 on access to STBBI-related services
"During the pandemic, the use of some health services noticeably decreased. This may be driven both by fewer people seeking care as well as a decrease in the number and types of services available."
Since the start of the pandemic, less than one-fifth (18%) of all participants of this survey (PWUD participants) accessed or considered accessing STBBI prevention, testing and treatment services while two-thirds (66%) of STBBI service providers experienced a decrease in demand for their servicesFootnote 2. PWUD participants reported difficulties accessing community support (e.g., Indigenous health or healing services, referrals to mental health counselling, and peer support services) and testing (i.e., STI, HIV and hepatitis C) services. Many PWUD participants living with HIV and linked to HIV care before the pandemic reported challenges accessing this care since the start of the pandemic.
Over one-third (39%) of PWUD participants who used illegal drugs accessed or considered accessing harm reduction services while nearly one-half (45%) of harm reduction service providers experienced a decreased demand for their services since the start of the pandemicFootnote 2. PWUD participants who used illegal drugs reported difficulties accessing harm reduction services, especially drug consumption rooms, drug checking services, and drop-in centres for people who use drugs.
Almost one-third (30%) of PWUD participants who used illegal drugs accessed or considered accessing substance use and treatment services while over one-third (39%) of substance use and treatment service providers experienced a decreased demand for their services since the start of the pandemicFootnote 2. PWUD participants who used illegal drugs had difficulty accessing services, including drug treatment in non-hospital and hospital-based residential settings, and in outpatient mental health care centres. Of note, while overall emergency department visits and hospitalizations for most conditions declined during the pandemic, from October 2020 to June 2021, emergency department visits increased for harms related to both cannabis (14%) and opioids (36%) and similarly, hospitalizations increased for cannabis (14%) and opioids (30%)Footnote 13.
Most of the difficult to access services reported by PWUD participants were also the services where service providers reported the need to stop or reduce services at some point during the pandemicFootnote 2. These closures and service reductions affected the delivery of and access to STBBI-related services, and may have contributed to the access barriers (e.g., reduced hours of operation, difficulty getting an appointment or a referral) reported by PWUD participants. Other access barriers reported by PWUD participants included concern about exposure to someone with COVID-19 and experiences of stigma, discrimination or violence.
Since the start of the pandemic, STBBI-related service providers who experienced challenges in delivering services pivoted to develop new service delivery models. New approaches to service delivery were reported from across Canada. These approaches included mobile outreach for HIV, hepatitis C and other STI testing services; delivery of harm reduction by outreach, including mobile vehicle and home delivery; and self-serve pick-up and drop-off of harm reduction supplies at service windows or curbside depotsFootnote 2.
Impact of COVID-19 on social determinants of health
"While the pandemic affects all Canadians, we did not all have access to the same resources and choices before or during the pandemic, leading to different health, social and economic impacts."
Discrimination
Discrimination often prevents people from accessing the resources they need to be healthy, including STBBI-related services. Just prior to the start of the second wave of the pandemic, one-quarter (28%) of Canadians who participated in a Statistics Canada crowdsourced survey (August 2020) reported they had experienced discrimination since the start of the pandemicFootnote 14. One-third (33%) of PWUD participants experienced discrimination when accessing healthcare services in the year before the pandemic with many reporting an increase in these experiences since the start of the pandemic. Many reported experiencing an increase in discrimination based on their substance use since the start of the pandemic.
Employment and financial security
The COVID-19 pandemic has greatly affected the financial security of Canadians. Employment declined in January 2021 to its lowest level since August 2020. Declines were concentrated in part-time work among youth aged 15 to 24 years in the retail trade sectorsFootnote 15. The unemployment rate rose to 9.4% in January 2021Footnote 15. Despite three-quarters (76%) of PWUD participants working full or part time, many reported the pandemic had an impact on their ability to pay bills. To compensate for these financial losses, one-third (32%) of PWUD participants applied and received COVID-19 related income support transfers implemented by the federal and provincial/territorial governments. The Canada Emergency Response Benefit (CERB) and employment insurance benefits were the most common supports reported.
Food insecurity
In the fall of 2020, during the second wave of the COVID-19 pandemic, about one-in-ten (9.6%) Canadians reported they experienced food insecurity in their household because of financial hardshipsFootnote 16. In comparison, four-in-ten (42%) PWUD participants reported experiencing food insecurity in early 2021. Food insecurity was highest among PWUD participants who had stopped working or worked reduced hours and/or had reduced pay since the start of the pandemic.
Domestic violence
At the time of this survey, physical distancing measures were still recommended since vaccines were prioritized for older Canadians. Social isolation, loss of employment and reduced income are factors known to increase the risk of domestic violenceFootnote 17. One-third (32%) of Canadians who participated in a Statistics Canada survey (March to April 2020) reported that they were very or extremely concerned about family stress from confinementFootnote 18. About one-in-ten (8%) Canadians reported that they were very or extremely concerned about the possibility of violence in the homeFootnote 19. In this survey, PWUD participants who did not feel safe in their home before the pandemic, reported the greatest increase in feeling less safe since the start of the pandemic. Indeed, PWUD participants who experienced domestic violence since the start of the pandemic reported experiencing an increase (ranging from 32% to 63%) across all acts of domestic violence, including verbal, physical, financial, and sexual abuse.
Mental health
Impacts of the pandemic such as increased social isolation and domestic violence, reduced income, and food insecurity, may negatively affect the mental health and well-being of Canadians. According to the Canadian Community Health Survey (January to February 2021), four-in-ten (39%) Canadians reported their perceived mental health was somewhat worse or much worse compared to before the pandemicFootnote 20. Six-in-ten (60%) PWUD participants in this survey reported their mental health had worsened since the start of the pandemic. Worsening mental health was reported most among PWUD participants who also endorsed having poor mental health at the time of the survey. Among PWUD participants who accessed or considered accessing mental health and wellness services since the start of the pandemic, many (66%) reported they were not always able to access such services. Of note, service providers also encountered challenges in their ability to refer clients to mental health servicesFootnote 2.
During the pandemic, it appears that PWUD participants reported higher rates of experienced discrimination, food insecurity, domestic violence, and worsening mental health when compared to results from surveys of the general population.
Impact of COVID-19 on substance use
"The stress and uncertainty of the pandemic, including its associated social and economic upheavals, altered the substance use patterns of many Canadians."
Substance use
According to a Statistics Canada survey (January 25 to 31, 2021), nearly one-quarter (24%) of Canadians reported an increase in their alcohol consumption and more than one-third (34%) reported an increase in their cannabis consumption during the pandemicFootnote 21. Since the start of the pandemic, among PWUD participants who used only alcohol and/or cannabis, more than one-half reported increased use of alcohol (56%) and cannabis (57%). Similarly, among PWUD participants who used illegal drugs, more than one-half reported increased use of alcohol (57%) and almost two-thirds (65%) reported increased use of cannabis since the start of the pandemic.
The negative relationship between substance use and mental health is well establishedFootnote 22Footnote 23Footnote 24. In a Statistics Canada survey (March 29 to April 3, 2020), Canadians who rated their mental health as fair or poor during the pandemic, also reported increases in their use of alcohol (28%) and cannabis (17%)Footnote 22. Among PWUD participants who reported worsening mental health since the start of the pandemic, many reported increased use of alcohol (68%) and cannabis (72%).
Substance use behaviour
International border restrictions during the pandemic disrupted substance supply chains in CanadaFootnote 25. In May 2020, the Canadian Community Epidemiology Network on Drug Use (CCENDU) issued an alert about the impact of public health measures on the illegal drug supply in CanadaFootnote 26. The alert warned of the following: a decreased or change in the availability of different drugs; increased prices or drugs sold at the same price but more diluted; people using drugs that are not from their regular source; and an increase in people using drugs alone in an attempt to adhere to physical distancing measures. From this survey, PWUD participants who used illegal drugs since the start of the pandemic also reported increases in triggers for using, using alone, using substances not usually used, withdrawal symptoms, and worries about overdosing and their ability to access usual substances. These disruptions to the drug supply, in combination with other public health measures and the closures or reductions of STBBI-related services (i.e., STBBI prevention, testing and treatment services; harm reduction services; and substance use and treatment services) at some point during the pandemic, may have increased the risks associated with substance use.
Strengths and limitations
An anonymous online survey was used to limit COVID-19 risks and meet the need to reach a large number of participants over a short data collection period. Therefore, survey participants represent a convenience sample of PWUD with access to a computer/internet. As such, results should not be generalized to all people who use drugs or alcohol in Canada. Similar caution should be used in interpreting results for the small sample of participants living with HIV who reported experiencing challenges accessing HIV care since the start of the pandemic.
The possible selection bias introduced by the online nature of the survey meant that information from participants without access to a computer/internet is lacking, possibly leading to underestimates related to financial and food insecurity, precarious or inadequate housing, and mental health. In addition, the survey findings are based on self-reported data and subject to response biases such as social desirability; however, the anonymous nature of the survey likely minimized these biases.
Given the cross-sectional study design, it is not possible to make any attributions regarding COVID-19 as the "cause" of findings summarized in this report. The study was purposefully designed to gather information about participants' "perceived" experiences across social determinants of health, substance use, and access to STBBI-related services, including harm reduction and substance use and treatment services.
Despite these limitations, the survey findings nonetheless provide a descriptive snapshot of the impact of the COVID-19 pandemic on access to STBBI-related services by people who use drugs or alcohol in Canada.
Conclusion
"This pandemic has demonstrated that inequities in our society place some populations – and ultimately, all Canadians at risk. No one is protected from the risk of COVID-19 until everyone is protected."
The COVID-19 pandemic has not affected Canadians equally. Findings from this survey underscore the disproportionate impact of the pandemic on social determinants of health, especially among those who experienced poorer health and socioeconomic circumstances before the pandemic. Survey findings substantiate how the pandemic may have placed people who use drugs or alcohol at greater risk of poorer health and well-being because of their increased experiences of discrimination, employment or income loss, increased food insecurity, increased experiences of domestic violence, increased substance use, and more risky substance use behaviours during the pandemic.
In Canada, it is understood that STBBI disproportionately affect key populations, including people who use drugsFootnote 27. Since the start of the pandemic, difficulties in accessing STBBI-related services coupled with further declines in the social determinants of health, especially in key populations, may ultimately affect Canada's progress in achieving global STBBI targets as outlined in the Pan-Canadian STBBI Framework for ActionFootnote 27 Footnote 28.
References
- Footnote 1
-
Public Health Agency of Canada. The Chief Public Health Officer of Canada's Report on the State of Public Health in Canada. From Risk to Resilience: An Equity Approach to COVID-19 [Internet]. 2020. Available from: https://www.canada.ca/content/dam/phac-aspc/documents/corporate/publications/chief-public-health-officer-reports-state-public-health-canada/from-risk-resilience-equity-approach-covid-19/cpho-covid-report-eng.pdf
- Footnote 2
-
Public Health Agency of Canada, Centre for Communicable Diseases and Infection Control. Findings from the survey of the impact of COVID-19 on the ability to provide STBBI prevention, testing and treatment including harm reduction services in Canada [Internet]. 2021. Available from: https://www.canada.ca/content/dam/phac-aspc/documents/services/publications/diseases-conditions/survey-impact-covid-19-delivery-stbbi-prevention-testing-treatment/survey.pdf
- Footnote 3
-
European Monitoring Centre for Drugs and Drug Addiction. Trendspotter manual: A handbook for the rapid assessment of emerging drug-related trends [Internet]. 2018. 60p. Available from: https://www.emcdda.europa.eu/system/files/publications/10233/2018-trendspotter-manual.pdf
- Footnote 4
-
Public Health Agency of Canada. How has COVID-19 impacted access to STBBI-related health services, including harm reduction services, for people who use drugs or alcohol in Canada?: Data blog [internet]. 2021 May. Available from: https://health-infobase.canada.ca/datalab/covid-19-stbbi-services.html
- Footnote 5
-
Public Health Agency of Canada. National findings from the Tracks survey of people who inject drugs in Canada, Phase 4, 2017–2019 [Internet]. 2020 May. 11p. Available from: https://www.canada.ca/content/dam/phac-aspc/documents/services/reports-publications/canada-communicable-disease-report-ccdr/monthly-issue/2020-46/issue-5-may-7-2020/ccdrv46i05a07-eng.pdf
- Footnote 6
-
European Monitoring Centre for Drugs and Drug Addiction. Impact of COVID-19 on drug services and help-seeking in Europe, EMCDDA trendspotter briefing, EMCDDA, Lisbon [Internet]. 2020. Available from: https://www.emcdda.europa.eu/system/files/publications/13073/EMCDDA-Trendspotter-Covid-19_Wave-1-2.pdf
- Footnote 7
-
Community Based Research Center. Sex Now Survey COVID-19 Edition - Full questionnaire [Internet]. 2020. Available from: https://www.cbrc.net/sex_now_survey_covid_19_edition_full_questionnaire
- Footnote 8
-
Johns Hopkins University (JHU). COVID-19 Community Response Survey [Internet]. 2020. Available from: https://www.nlm.nih.gov/dr2/JHU_COVID-19_Community_Response_Survey_v1.3.pdf
- Footnote 9
-
Statistics Canada. Canadian Perspectives Survey Series (CPSS) [Internet]. 2020. Available from: https://www23.statcan.gc.ca/imdb/p2SV.pl?Function=getSurvey&SDDS=5311
- Footnote 10
-
Statistics Canada. Canadian Community Health Survey (CCHS) – 2019 [Internet]. 2019 Dec. Available from: https://www23.statcan.gc.ca/imdb/p3Instr.pl?Function=assembleInstr&lang=en&Item_Id=1207185#qb1208907
- Footnote 11
-
Board of Governors of the Federal Reserve System. Report on the Economic Well-Being of U.S. Households in 2013 [Internet]. 2014. Available from: https://www.federalreserve.gov/econresdata/2014-economic-well-being-of-us-households-in-2013-appendix-2.htm#subsection-157-9D40F64E
- Footnote 12
-
Public Health Agency of Canada. The Chief Public Health Officer of Canada's Report on the State of Public Health in Canada. A Vision to Transform Canada's Public Health System [Internet]. 2021. Available from: https://www.canada.ca/en/public-health/corporate/publications/chief-public-health-officer-reports-state-public-health-canada/from-risk-resilience-equity-approach-covid-19.html
- Footnote 13
-
Canadian Institute for Health Information. Unintended consequences of COVID-19: Impact on harms caused by substance use, self-harm and accidental falls [Internet]. 2021 May. Available from: https://www.cihi.ca/en/covid-19-resources/impact-of-covid-19-on-canadas-health-care-systems/unintended-consequences
- Footnote 14
-
Statistics Canada. Experiences of discrimination during the COVID-19 pandemic [Internet]. 2020. Available from: https://www150.statcan.gc.ca/n1/daily-quotidien/200917/dq200917a-eng.htm
- Footnote 15
-
Statistics Canada. Labour Force Survey, January 2021 [Internet]. 2021 Feb. available from: https://www150.statcan.gc.ca/n1/daily-quotidien/210205/dq210205a-eng.htm
- Footnote 16
-
Statistics Canada. Household food insecurity during the COVID-19 pandemic [Internet]. 2022. Available from: https://www150.statcan.gc.ca/n1/daily-quotidien/220216/dq220216f-eng.htm
- Footnote 17
-
Statistics Canada. StatCan COVID-19: Data to insights for a better Canada: The COVID-19 pandemic and its impacts on Canadian victim services [Internet]. 2020 July. Available from: https://www150.statcan.gc.ca/n1/pub/45-28-0001/2020001/article/00065-eng.htm
- Footnote 18
-
Statistics Canada. How are Canadians coping with the COVID-19 situation? [Internet]. 2022 April. Available from: https://www150.statcan.gc.ca/n1/en/pub/11-627-m/11-627-m2020029-eng.pdf?st=D0b568Dq
- Footnote 19
-
Statistics Canada. Canadian perspectives survey series 1: Impacts of COVID-19 [Internet]. 2020 April. Available from: https://www150.statcan.gc.ca/n1/daily-quotidien/200408/dq200408c-eng.htm
- Footnote 20
-
Statistics Canada. Canadian's health and COVID-19, by age and gender [Internet]. 2022 May. Available from: https://www150.statcan.gc.ca/t1/tbl1/en/tv.action?pid=1310080601
- Footnote 21
-
Statistics Canada. Alcohol and cannabis use during the pandemic: Canadian perspective survey series 6 [Internet]. 2021 Mar. Available from: https://www150.statcan.gc.ca/n1/daily-quotidien/210304/dq210304a-eng.htm
- Footnote 22
-
Statistics Canada. StatCan COVID-19: Data to insights for a better Canada- Canadians who report lower self-perceived mental health during the COVID-19 pandemic more likely to report increased use of cannabis, alcohol and tobacco [Internet]. 2020 May. Available from: https://www150.statcan.gc.ca/n1/pub/45-28-0001/2020001/article/00008-eng.htm
- Footnote 23
-
Mental Health Commission of Canada. Mental health and substance use [Internet]. 2022. Available from: https://mentalhealthcommission.ca/what-we-do/mental-health-and-substance-use/
- Footnote 24
-
Canadian Centre on Substance Use and Addiction. Mental health and substance use during COVID-19: Summary report [Internet]. 2021 May. Available from: https://www.ccsa.ca/mental-health-and-substance-use-during-covid-19
- Footnote 25
-
Ali F,Russell C, Nafeh F, Rehm J, Leblanc S, Elton-Marshall T. Changes in substance supply and use characteristics among people who use drugs (PWUD) during the COVID-19 global pandemic: A national qualitative assessment in Canada. International Journal of Drug policy [Internet]. 2021 July (93). Available from: https://www.sciencedirect.com/science/article/pii/S0955395921001420
- Footnote 26
-
Canadian Centre on Substance Use and Addiction. CCENDU ALERT: Changes related to COVID-19 in the illegal drug supply and access to services, and resulting health harms[Internet]. 2020 Mar-May. Available from: https://www.drugpolicy.ca/wp-content/uploads/2020/05/CCSA-COVID-19-CCENDU-Illegal-Drug-Supply-Alert-2020-en.pdf
- Footnote 27
-
Public Health Agency of Canada. A pan-Canadian framework for action: Reducing the health impact of sexually transmitted and blood-borne infections in Canada by 2030: A pan-Canadian STBBI framework for action. 2018 Jun 29. Available from: https://www.canada.ca/content/dam/phac-aspc/documents/services/infectious-diseases/sexual-health-sexually-transmitted-infections/reports-publications/sexually-transmitted-blood-borne-infections-action-framework/sexually-transmitted-blood-borne-infections-action-framework.pdf
- Footnote 28
-
Public Health Agency of Canada. Accelerating our response: Government of Canada five-year action plan on sexually transmitted and blood-borne infections. 2019 Jul 17. Available from: https://www.canada.ca/en/public-health/services/infectious-diseases/sexual-health-sexually-transmitted-infections/reports-publications/sexually-transmitted-blood-borne-infections-action-framework.html