
Benefits of immunization: Canadian Immunization Guide
For health professionals
Last complete chapter revision: July 2025
This chapter was completely reviewed and revised to include updated information on the impact of vaccines on the epidemiology of vaccine preventable diseases in Canada. The Impact of vaccines on vaccine preventable diseases section including Table 1, Figure 1 and Figure 2, has been revised to include national - level surveillance data from the Canadian Notifiable Disease Surveillance System (CNDSS) and the Canadian Measles and Rubella Surveillance System (CMRSS). The Value for money of vaccines section was updated to align content with the April 2023 publication of the National Advisory Committee on Immunization (NACI) Guidelines for the economic evaluation of vaccination programs in Canada.
This information is captured in the table of updates.
On this page
- Benefits of immunization
- Epidemiology and immunization
- Impact of vaccines on vaccine preventable diseases
- Table 1. Incidence of select vaccine preventable diseases in Canada - pre-vaccine era compared with 2018-2022
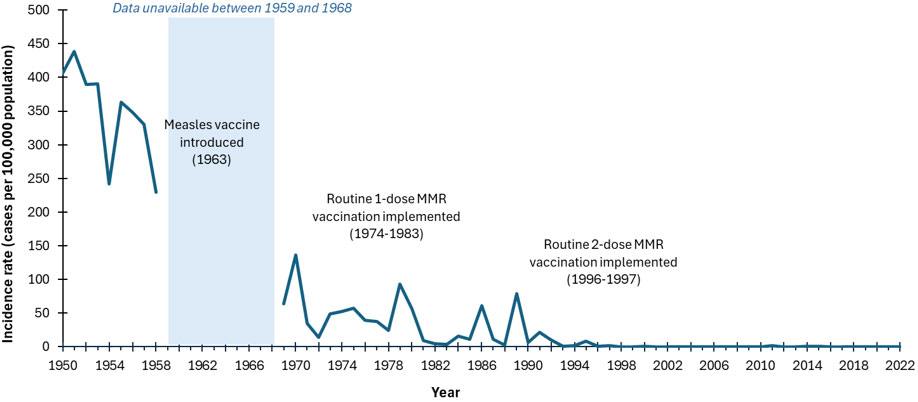
- Figure 1. Incidence rates (cases per 100,000 population) of reported measles cases, Canada, 1950 to 2022
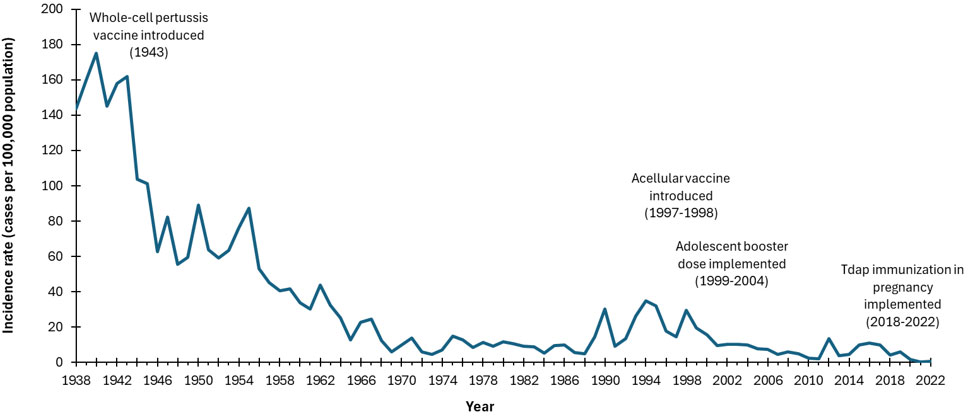
- Figure 2. Incidence rates (cases per 100,000 population) of reported pertussis cases in Canada by year, 1938 to 2022
- Value for money of vaccines
- Chapter revision process
- Acknowledgments
- Selected references
Benefits of immunization
Immunization is one of the most important accomplishments in public health that has, over the past 50 years, led to the elimination, containment and control of diseases that were once very common in Canada. Before vaccines became available, many Canadian children were hospitalized or died from diseases such as diphtheria, pertussis, measles and polio. Today, although these disease-causing bacteria and viruses still exist, such diseases are rarely, and in some cases (such as polio) never seen in Canada. However, if vaccination was reduced or stopped, diseases controlled through immunization would re-appear in Canada. This phenomenon has been observed in other countries where large epidemics occurred following a decline in immunization rates, resulting in many preventable hospitalizations and deaths.
Immunization is important in all stages of life. Infants and young children are particularly susceptible to vaccine preventable diseases because their immune systems are less able to fight infection; as a result, they require timely immunization. Older children and adults also require immunization to restore waning immunity and to build new immunity against diseases that are more common in adults.
Immunization directly protects individuals who receive vaccines. Through community (or herd) immunity, immunization against many diseases also prevents the spread of infection in the community and indirectly protects:
- newborns who have not yet received all of their vaccines
- people who cannot be vaccinated for medical reasons, such as people who had an organ transplant or are undergoing treatment for cancer or other illnesses
- people who may not adequately respond to immunization such as the elderly
Epidemiology and immunization
Epidemiology provides data on the distribution and determinants of diseases. Epidemiology informs the first steps in vaccine development by describing the diseases caused by a pathogen in a particular population and indicating the need for vaccine development. As a vaccine is introduced into the population, epidemiology monitors the effect of the vaccine in the population by describing changes in the disease burden and the pathogens causing that disease. Epidemiology can also provide information regarding immunization coverage and vaccine safety.
Surveillance is the process of systematic collection, orderly analysis, evaluation and reporting of epidemiological data to inform disease control measures or policy decisions, or both. Surveillance of vaccine preventable diseases, including immunization coverage and vaccine safety, is needed to:
- identify and quantify risk factors to enable appropriate control of communicable diseases
- assist in the investigation, containment and management of vaccine preventable disease outbreaks or a signal of adverse events following immunization
- monitor progress toward the achievement of set goals and targets in disease control programs
- provide up-to-date information to assist in the development of evidence-based guidelines
Determining the burden of disease is important in setting immunization priorities. Burden of disease includes: the prevalence (total number of cases of a disease in a geographic area); the incidence (number of new cases of a disease in a geographic area over a specified period of time); the age or risk group that is most affected (for example, infants, children, adults, the elderly, immunocompromised persons); the severity of the disease (for example, as measured by time missed from work, hospitalization, complications or death); and the risk factors for disease that should be considered. These factors are particularly important when making vaccine recommendations regarding:
- populations who are susceptible to the disease and who require the direct protection of a vaccine
- populations who require indirect protection through herd immunity because they are susceptible to the disease but may not be the ideal target group to receive the vaccine.
Evaluation of vaccine programs is the systematic investigation of the structure, activities, or outcomes of public health programs. It explores whether or not activities are implemented as planned and outcomes have occurred as intended, and why. Evaluation can help to support program implementation and build on the program monitoring activities that immunization programs currently conduct to assess whether program objectives have been met.
Impact of vaccines on vaccine preventable diseases
Table 1, Figure 1 and Figure 2 illustrate the impact of vaccines on infectious diseases in Canada. Refer to the vaccine-specific chapters in Part 4 for additional information about the success of immunization programs against specific vaccine preventable diseases.
| Disease and impact | Vaccine introduction and disease reporting | Pre-vaccine era | 2018-2022Footnote a | |||
|---|---|---|---|---|---|---|
| Pre-vaccine period | 5-year average annual incidence per 100,000 | 5-year average annual cases (minimum - maximum) | 5-year average annual incidence per 100,000 | 5-year average annual cases (minimum - maximum) | ||
Diphtheria Infection of the throat causes severe breathing difficulty which may result in asphyxia. Infection also results in the dissemination of diphtheria toxin, which damages the heart and central nervous system. In the pre-vaccine era case fatality was about 5% to 10%, with the highest death rates occurring in the very young and the elderly. |
|
1925-1929 | 84.2 | 8,142 (7,175-9,010) | 0.01 | 4 (2-9) |
Haemophilus influenzae type b (Hib) invasive disease In children less than 5 years of age, this infection can cause otitis media, meningitis, epiglottitis, bacteremia, cellulitis, pneumonia or septic arthritis in young children. The case fatality rate of meningitis is about 5%. Severe neurologic sequelae occur in 10% to 15% of survivors and deafness in 15% to 20%. |
|
1986-1987 | 30.2Footnote b | 671 | 0.1Footnote c | 19 (11-37) |
Measles Bronchopneumonia and otitis media occur in about 1/10 cases and encephalitis occurs in 1/1,000 cases. Case fatality rate is 1 to 10 per 10,000. Subacute sclerosing panencephalitis is a rare but fatal complication. |
|
1950-1954 | 373.3 | 53,584 (36,850-61,370) | 0.01 | 29 (1-113) |
Meningococcal serogroup C invasive disease Invasive meningococcal disease most often results in meningitis or septicemia. Severe cases can result in delirium and coma and, if untreated, shock and death. The case fatality rate is 10%, and 10% to 20% of survivors have long term sequelae such as digit or limb amputations, neurologic disabilities, and deafness. |
|
1997-2001 | 0.30 | 92.6 (39-186) | 0.01 | 3.8 (1-7) |
Mumps Acute parotitis develops in 40%, of which 25% are unilateral. Complications include orchitis (20% to 30% of post-pubertal males), oophoritis (5% of post-pubertal females), meningitis (less than 10% of cases), deafness (0.5 to 5/100,000 cases) and encephalitis (less than 1/50,000 cases). Rarely, mumps can cause permanent infertility. |
|
1950-1954 | 251.2 | 36,100 (26,908-43,671) | 0.592 | 220 (13-808) |
Pertussis Young infants are most affected by complications, such as vomiting after a coughing spell, weight loss, breathing problems, choking spells, pneumonia, convulsions, encephalopathy, and death. Older children and adults may develop persistent cough. |
|
1938-1942 | 156.2 | 17,776 (16,003- 19,878) | 2.35 | 880 (28-2,139) |
Poliomyelitis Paralysis occurs in less than 1% of infections but among those paralyzed, about 2% to 5% of children and 15% to 30% of adults die. |
|
1950-1954 | 17.5 | 2,545 (911-5,384) | 0 | 0 |
Rubella and congenital rubella syndrome (CRS) Although rubella is generally a mild disease, encephalitis occurs in 1/6,000 cases. However, rubella infection in pregnancy can cause (CRS). Infection in the first 10 weeks of pregnancy has an 85% risk of leading to CRS. CRS can result in miscarriage, stillbirth and fetal malformations (congenital heart disease, cataracts, deafness and intellectual disability). |
|
|
|
|
|
|
Tetanus Infection leads to general rigidity, and convulsive spasms, with death in about 10% of cases. Higher rates of death occur among infants. |
|
1935-1939 | 0.2 | 36 (26-43) | 0.01 | 3 (1-5) |
Abbreviations: |
||||||
Abbreviation:
MMR = measles-mumps-rubella vaccine
Figure 1: Text Equivalent
This image includes a graph showing the incidence rates (cases per 100,000 population) of reported measles cases in Canada over time. On the graph, the x axis represents the time between 1950 and 2022. The y axis represents measles incidence rates per 100,000 population, starting with 0 at the bottom to 500 at the top. The blue line representing the reported incidence rate of measles shows a decline from a peak of 439 cases per 100,000 population in 1951 to 16 cases per 100,000 by 1984, following the introduction of the measles vaccine in 1963 and the routine 1-dose MMR vaccination between 1974 and 1983 (note: measles was not notifiable between 1959 and 1968). After a few fluctuations, the rate declined from 16 cases per 100,000 population in 1984 to less than 0.1 cases per 100,000 by 2022, following the introduction of the routine 2-dose MMR vaccination between 1996 and 1997. This figure effectively illustrates the impact of vaccination programs on reducing measles cases over time.
Abbreviation:
Tdap = Tetanus, diphtheria, and acellular pertussis
Figure 2: Text Equivalent
This image includes a graph showing the incidence rates (cases per 100,000 population) of reported pertussis cases in Canada over time. On the graph, the x axis represents the time period between 1938 and 2022. The y axis represents pertussis incidence rates per 100,000 population, starting with 0 at the bottom and going up to 200 at the top. The blue line representing the incidence rate of pertussis shows a decline from a peak of 180 cases per 100,000 population in 1940 to 4.9 per 100,000 by 1988, following the introduction of the whole-cell pertussis vaccine in 1943. After a few fluctuations, the incidence rate declined further from 14.9 cases per 100,000 population in 1989 to 0.5 per 100,000 by 2022, after the acellular vaccine was introduced in 1997-1998, adolescent booster doses were given between 1999-2004, and Tdap vaccination during pregnancy was implemented. This figure effectively illustrates the impact of vaccination programs on reducing pertussis cases over time.
Value for money of vaccines
Vaccine preventable diseases result in significant costs to individuals who fall ill, caregivers, the health system (healthcare system and public health system), and society, including costs associated with absenteeism from work or school, visits to health care providers, hospitalizations, and premature deaths. In addition to being one of the most beneficial, immunization is also one of the most cost-effective public health interventions.
Historically, many immunization programs compare very favourably to other interventions, providing savings to the health system and to society more broadly (refer to Table 2). Savings to the health system can be seen when the cost of implementing the immunization program is less than the cost of treating the illness that would occur if the program was not implemented. Benefits to society more broadly include productivity gains such as through improved cognition, physical strength, educational achievement, attendance in school and work, among other benefits. In the context of low- and middle-income countries, for every $1 invested in immunization programs, there are an estimated $20 to $52 in savings. In the United States, for every US$1 invested in childhood immunization programs, there are an estimated US$10 in savings. In the context of health emergencies such as that of the coronavirus disease 2019 (COVID-19) pandemic, the tremendous, negative health and economic impacts that extend to every area of the economy can be reduced through immunization. In Canada, the costs of COVID-19 pandemic immunization were far outweighed by the savings to society associated with the prevention of infections and premature deaths (estimated net benefit of $298.1 billion). Because immunization with these vaccines maintains health and results in cost savings, the decision to include these vaccines in publicly funded immunization programs is straightforward.
| Intervention | Cost per additional year of life saved as a result of the intervention |
|---|---|
| Immunization programs | |
| Measles, mumps, and rubella immunization for children | ≤ $0 (i.e., cost-saving) |
| Polio immunization for children age 0 to 4 | ≤ $0 (i.e., cost-saving) |
| Rubella vaccination for children age 2 | ≤ $0 (i.e., cost-saving) |
| National measles eradication program for children | ≤ $0 (i.e., cost-saving) |
| Other health interventions | |
| Breast cancer screening mammography, women age 50 | $1,598 |
| Hypertension screening for men age 60 | $21,697 |
| Home dialysis for end-stage renal disease | $39,449 |
| Neonatal intensive care for low birth weight infants | $532,568 |
| Other non-health interventions | |
| Mandatory seat belt law | $136 |
| Driver and passenger air bags/manual lap belts (vs. airbag for driver only and belts) | $120,321 |
| Smoke detectors in homes | $414,220 |
| Crossing control arm for school buses | $808,715 |
Costs are adjusted from 1993 US dollars to 2023 Canadian dollars. The interventions noted in the table are from Tengs TO, Adams ME, Pliskin JS, Safran DG, Siegel JE, Weinstein MC, Graham JD. Five-hundred life-saving interventions and their cost-effectiveness. Risk Anal. 1995 Jun;15(3):369-90. Refer to the article for additional examples.
Some vaccines are costlier and may not offer cost savings. However, some offer greater benefits than existing interventions, and thus, may warrant the higher costs. In such cases, the vaccines are considered cost-effective - that is, they offer good value for money, maximizing impact for the given resources spent. In the field of health economics, the value of a health intervention can be measured in terms of cost per quality-adjusted life year (QALY). The QALY metric captures the impacts of an intervention such as extending life or improving quality of life. In many cases, the lower the cost per QALY of a health intervention, the greater the value for money. Refer to Table 3 for examples of studies assessing the value for money of select immunization programs in Canada.
In Canada, evaluation of the benefits and costs of new immunization programs can be conducted at the federal level and/or at the provincial and territorial level. Refer to Immunization in Canada in Part 1 for additional information about immunization policy and program development.
| Immunization program | Cost per QALY |
|---|---|
| Influenza: pregnant women | $50,481 |
| Human papillomavirus: young women aged 25 years | $93,474 (with bivalent vaccine) $63,275 (with quadrivalent vaccine) |
| Human papillomavirus: young women aged 18 years | $9,635 |
| Herpes zoster: adults aged 60 years | $77,437 to $113,763 |
| Herpes zoster: adults aged 60 years and older | $70,312 (60+ years) $59,605 (60 to 75 years) $109,568 (75+ years) |
Costs are adjusted from 2016 US dollars to 2023 Canadian dollars; QALY = quality-adjusted life year. The immunization programs noted in the table are identified and synthesized by Leidner AJ, Murthy N, Chesson HW, Biggerstaff M, Stoecker C, Harris AM, Acosta A, Dooling K, Bridges CB. Cost-effectiveness of adult vaccinations: A systematic review. Vaccine. 2019 Jan 7;37(2):226-34. |
|
Chapter revision process
The Impact of vaccines on vaccine preventable diseases section has been revised to include national-level surveillance data for vaccine-preventable diseases from the Canadian Notifiable Disease Surveillance System (CNDSS) and the Canadian Measles and Rubella Surveillance System (CMRSS).
The Value for money of vaccines section was updated to align its content with the April 2023 publication of the National Advisory Committee on Immunization (NACI): Guidelines for the economic evaluation of vaccination programs in Canada. The metric of quality-adjusted life years is described. Examples were updated with newer references, including one from the COVID-19 pandemic context. The revisions were based on literature searches in PubMed and Google using concepts related to cost-effectiveness analyses, return on investment, and immunization programs.
Acknowledgements
This chapter revision was prepared by S Pierre, MW Yeung, AR Tuite on behalf of NACI and D Bhagat, S David, A Kodua, and S Rajakumar on behalf of the Centre for Emerging Respiratory Infections and Pandemic Preparedness.
PHAC gratefully acknowledges the contribution of SH Lim, N Haddad and C Jensen.
Selected references
- Leidner AJ, Murthy N, Chesson HW, Biggerstaff M, Stoecker C, Harris AM, Acosta A, Dooling K, Bridges CB. Cost-effectiveness of adult vaccinations: A systematic review. Vaccine. 2019 Jan 7;37(2):226-34.
- Public Health Agency of Canada (PHAC). Reported cases from 1924 to 2022 in Canada — notifiable diseases on-line. [Internet]. Ottawa (ON): Government of Canada; 2022 [cited 2024 Oct 24] Available at: https://diseases.canada.ca/notifiable/charts?c=pl
- Public Health Agency of Canada (PHAC). Measles and Rubella Weekly Monitoring Reports. [Internet]. Ottawa (ON): Government of Canada; 2024 [cited 2024 Oct 24] Available at: https://www.canada.ca/en/public-health/services/diseases/measles/surveillance-measles/measles-rubella-weekly-monitoring-reports.html
- Public Health Agency of Canada (PHAC). National Advisory Committee on Immunization (NACI): Guidelines for the economic evaluation of vaccination programs in Canada [Internet]. Ottawa (ON): Government of Canada; 2023 Aug 02 [cited 2024 Feb 05]. Available from: https://www.canada.ca/en/public-health/services/immunization/national-advisory-committee-on-immunization-naci/methods-process/incorporating-economic-evidence-federal-vaccine-recommendations/guidelines-evaluation-vaccination-programs-canada.html
- Public Health Agency of Canada (PHAC). National Advisory Committee on Immunization (NACI): Interpretation Guide - Health Economics [Internet]. Ottawa (ON): Government of Canada; 2024 Mar 18 [cited 2024 Mar 20]. Available from https://www.canada.ca/en/public-health/services/immunization/national-advisory-committee-on-immunization-naci/methods-process/interpretation-guide-health-economics.html
- Public Health Agency of Canada. (PHAC). Measles: Health professionals [Internet]. Ottawa (ON): Government of Canada; 2024 [cited 2024 Oct 24]. Available from https://www.canada.ca/en/public-health/services/diseases/measles/health-professionals-measles.html#s10
- Sim SY, Watts E, Constenla D, Huang S, Brenzel L, Patenaude BN. Costs of immunization programs for 10 vaccines in 94 low- and middle-income countries from 2011 to 2030. Value Health. 2021 Jan;24(1):70-77.
- Tengs TO, Adams ME, Pliskin JS, Safran DG, Siegel JE, Weinstein MC, Graham JD. Five-hundred life-saving interventions and their cost-effectiveness. Risk Anal. 1995 Jun;15(3):369-90
- Tuite AR, Ng V, Ximenes R, Diener A, Rafferty E, Ogden NH, Tunis M. Quantifying the economic gains associated with COVID-19 vaccination in the Canadian population: A cost-benefit analysis. Can Commun Dis Rep 2023;49(6):263-73.
- Zhou F, Shefer A, Wenger J, Messonnier M, Wang LY, Lopez A, Moore M, Murphy TV, Cortese M, Rodewald L. Economic evaluation of the routine childhood immunization program in the United States, 2009. Pediatrics. 2014 Apr;133(4):577-85.