
National report: Apparent opioid-related deaths in Canada (released March 2018)
Suggested citation
Special Advisory Committee on the Epidemic of Opioid Overdoses. National report: Apparent opioid-related deaths in Canada (January 2016 to September 2017) Web-based Report. Ottawa: Public Health Agency of Canada; March 2018.
Key findings
The opioid crisis has affected every part of the country, but there are clear differences in death rates and the substances involved across provinces and territories. According to data reported as of March 22, 2018:
- in 2016, there were 2,946 apparent opioid-related deaths in Canada
- 88% were accidental (unintentional)
- from January to September 2017, there were at least 2,923 apparent opioid-related deaths; 92% were accidental
- 72% of accidental apparent opioid-related deaths involved fentanyl or fentanyl analogues, compared to 55% in 2016
- most accidental apparent opioid-related deaths occurred among males (76%) and among individuals between the ages of 30 and 39 (28%)
- it is expected that these numbers will change as additional data become available
On this page
- Background
- 1.0 Apparent opioid-related deaths in Canada
- 2.0 Apparent opioid-related deaths by manner of death
- Considerations and Limitations
Background
Canada is experiencing a serious and growing opioid crisis. Across the country, it is having devastating effects on families and communities.
Accurate information about the crisis will help the efforts to reduce opioid-related harms and deaths.
The Government of Canada works closely with the provinces and territories to collect and share data on apparent opioid-related deaths.
The data in this report:
- are updated four times a year
- may change based on review and refinement
- have been collected by the provinces and territories from their respective offices of Chief Coroners or Medical Examiners
- have been shared through the Special Advisory Committee on the Epidemic of Opioid Overdoses (SAC)
Changes from the last report include:
- the addition of available preliminary data from July to September 2017
- updates to previously reported data from January 2016 to June 2017
- sections reporting data separately for apparent opioid-related deaths classified as accidental or suicide, where available
1.0 Apparent opioid-related deaths in Canada
The opioid crisis has affected every part of the country, but some provinces and territories have been impacted more than others. According to data reported as of March 22, 2018:
- there were 2,946 apparent opioid-related deaths in Canada in 2016, corresponding to a death rate of 8.1 per 100,000 population (Table 1)Footnote a
- there were at least 2,923 apparent opioid-related deaths from January to September 2017, corresponding to an estimated annual death rate of 10.6 per 100,000 population in 2017 (Table 1)Footnote b
- an increase of 45%Footnote c in the number of apparent opioid-related deaths was observed from January to September 2017 when compared to the same time period in 2016; however, this is subject to change as data become available or are updated
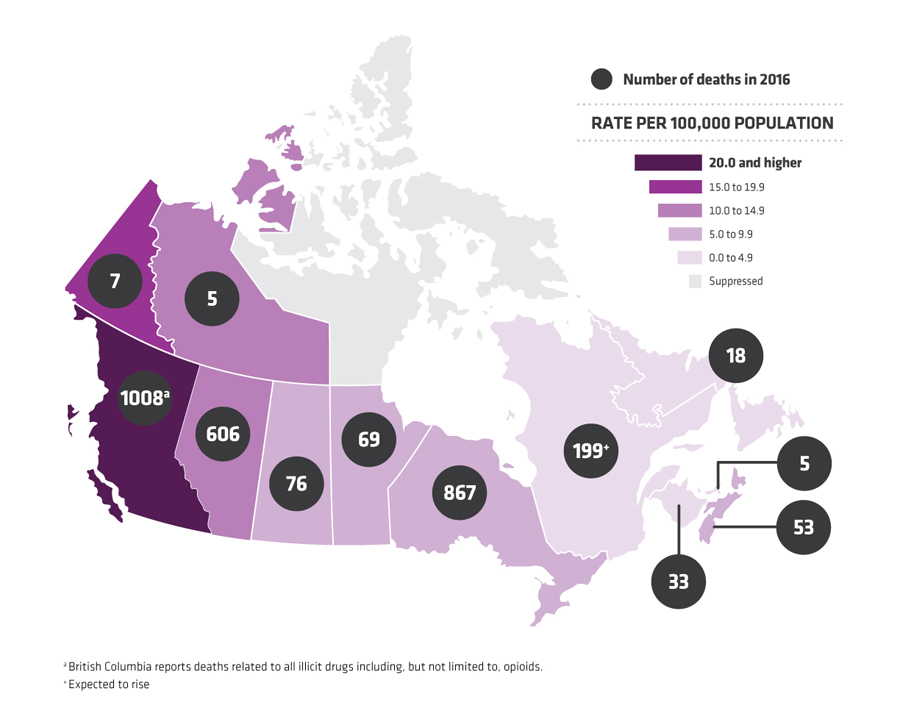
Figure 1a. Number and rate (per 100,000 population) of apparent opioid-related deaths by province or territory, 2016.
Text description
| Province or territory | Number | Death rate per 100,000 population |
|---|---|---|
| British Columbia (Note 1) | 1008 | 21.2 |
| Alberta | 606 | 14.3 |
| Saskatchewan | 76 | 6.6 |
| Manitoba | 69 | 5.2 |
| Ontario | 867 | 6.2 |
| Quebec (Note 2) | 199 | 2.4 |
| New Brunswick | 33 | 4.4 |
| Nova Scotia | 53 | 5.6 |
| Prince Edward Island | 5 | 3.3 |
| Newfoundland and Labrador | 18 | 3.4 |
| Yukon | 7 | 18.4 |
| Northwest Territories | 5 | 11.2 |
| Nunavut | Suppressed | Suppressed |
- Note 1: British Columbia reports deaths related to all illicit drugs including, but not limited to, opioids.
- Note 2: Expected to rise
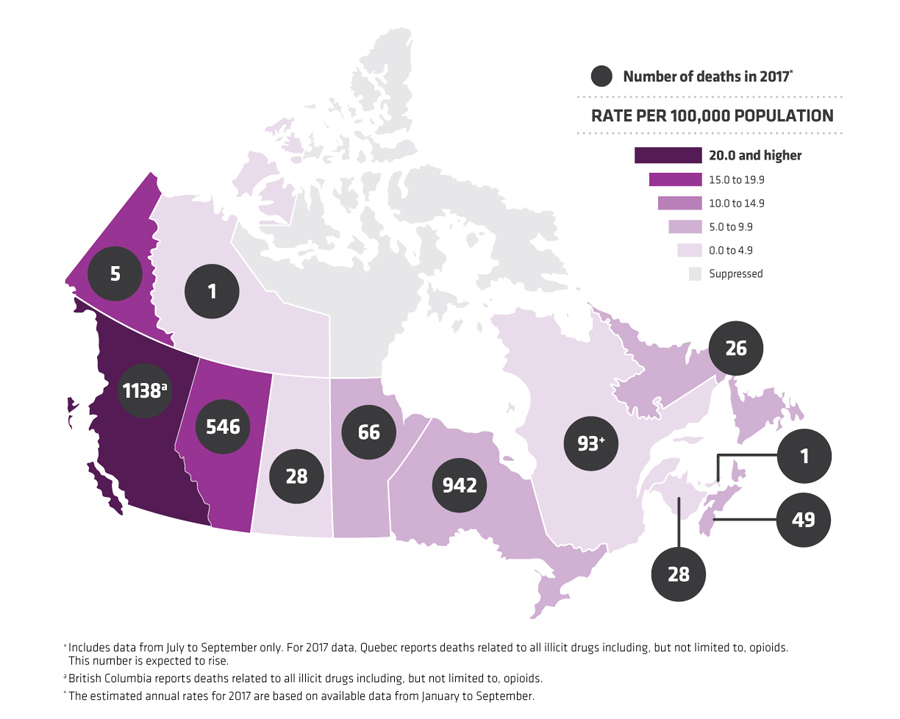
Figure 1b. Number (January to September) and estimated annual rate (per 100,000 population) of apparent opioid-related deaths by province or territory, 2017.
Text description
| Province or territory | Number | Death rate per 100,000 populationFigure 1b Footnote 1 |
|---|---|---|
| British ColumbiaFigure 1b Footnote 2 | 1138 | 31.5 |
| Alberta | 546 | 17 |
| Saskatchewan | 28 | 3.2 |
| Manitoba | 66 | 6.6 |
| Ontario | 942 | 8.8 |
| QuebecFigure 1b Footnote 3 | 93 | 1.5 |
| New Brunswick | 28 | 4.9 |
| Nova Scotia | 49 | 6.8 |
| Prince Edward Island | 1 | 0.9 |
| Newfoundland and Labrador | 26 | 6.6 |
| Yukon | 5 | 17.3 |
| Northwest Territories | 1 | 3.0 |
| Nunavut | Suppressed | Suppressed |
|
||
| 2016 | 2017 (Jan to Sep) | ||
|---|---|---|---|
| Number | 2946 | 2923 | |
| Rate per 100,000 population | 8.1 | 10.6Table 1 Footnote 2 | |
| % male | 68% | 76% | |
| Age group (years) | ≤ 19 | 2% | 2% |
| 20 to 29 | 18% | 19% | |
| 30 to 39 | 27% | 28% | |
| 40 to 49 | 21% | 23% | |
| 50 to 59 | 23% | 19% | |
| 60 to 69 | 7% | 8% | |
| ≥ 70 | 2% | 1% | |
| % involvingTable 1 Footnote 3 fentanyl or fentanyl analoguesTable 1 Footnote 4 | 51% | 68% | |
| % also involving non-opioid substancesTable 1 Footnote 5 | 71% | 77% | |
|
|||
2.0 Apparent opioid-related deaths by manner of death
The following section presents apparent opioid-related death data according to the manner of death assigned by the coroner or medical examiner during, or following, an investigation (Table 2).
Accidental: Deaths where the completed investigation determined that the death was unintentional. This category also includes deaths with ongoing investigations where the manner of death was believed to be accidental or had not been assigned at the time of reporting.
Suicide: Deaths where the completed investigation determined that the opioids were consumed with the intent to die. This category also includes deaths with ongoing investigations where suicide was believed to be the manner of death at the time of reporting.
Undetermined: Deaths with completed investigations where the manner of death could not be assigned based on available or competing information.
Collecting data on how deaths occurred, including whether they were intentional or not, is critical in understanding how the opioid crisis is affecting Canadians. According to available data reported as of March 22, 2018, the majority of apparent opioid-related deaths were accidental (unintentional) in both 2016 (88%) and January to September 2017 (92%) (Table 2).
In other words, these data indicate that the vast majority of apparent opioid-related deaths were of individuals who did not intend to die. This distinction is important to inform an appropriate public health response. For example, the high percent of unintended deaths reinforces the concern that a variety of street drugs are being laced with toxic substances, such as fentanyl, without the knowledge of the people consuming them. Public health officials will be able to use this information in designing strategies to address these hidden risks in order to reduce harms and effectively prevent unintended apparent opioid-related deaths.
| Manner of death | 2016 | 2017 (Jan to Sep) | ||
|---|---|---|---|---|
| Number | Percent | Number | Percent | |
| Accidental (unintentional) | 2593 | 88.0% | 2694 | 92.2% |
| Suicide | 250 | 8.5% | 126 | 4.3% |
| Undetermined | 103 | 3.5% | 103 | 3.5% |
| TotalTable 2 Footnote 2 | 2946 | 2923 | ||
|
||||
2.1 National and regional trends of accidental apparent opioid-related deaths
The following section provides detailed information on accidental apparent opioid-related deaths, which also shows that some provinces and territories have been impacted more than others.
According to data reported as of March 22, 2018:
- there were 2,593 accidental apparent opioid-related deaths in Canada in 2016, corresponding to a death rate of 7.2 per 100,000 population (Table 2a)Footnote a
- there were at least 2,694 accidental apparent opioid-related deaths from January to September 2017, corresponding to an estimated annual death rate of 9.8 per 100,000 population (Table 2a)Footnote b
| Province or territory | 2016 | 2017 | ||
|---|---|---|---|---|
| Number | Rate | Number (Jan to Sep) |
Estimated annual rateTable 2a Footnote 2 | |
| British ColumbiaTable 2a Footnote 3 | 966 | 20.3 | 1076 | 29.8 |
| Alberta | 551 | 13.0 | 522 | 16.2 |
| Saskatchewan | 69 | 6.0 | 25 | 2.9 |
| Manitoba | 57 | 4.3 | 55 | 5.5 |
| Ontario | 726 | 5.2 | 829 | 7.8 |
| QuebecTable 2a Footnote 3 | 131 | 1.6 | 93 | 1.5 |
| New Brunswick | 26 | 3.4 | 25 | 4.4 |
| Nova Scotia | 40 | 4.2 | 45 | 6.3 |
| Prince Edward Island | 5 | 3.3 | 1 | 0.9 |
| Newfoundland and Labrador | 13 | 2.5 | 18 | 4.5 |
| Yukon | 5 | 13.1 | 4 | 13.9 |
| Northwest Territories | 4 | 9.0 | 1 | 3.0 |
| Nunavut | Suppressed | Suppressed | Suppressed | Suppressed |
| Total | 2593 | 7.2 | 2694 | 9.8 |
Suppressed – Data may be suppressed in provinces or territories with low numbers of cases. Please see Considerations and Limitations for more information.
|
||||
| Province or territory | 2016 | 2017 (Jan to Sep) | |||||
|---|---|---|---|---|---|---|---|
| Jan to Mar | Apr to Jun | Jul to Sep | Oct to Dec | Jan to Mar | Apr to Jun | Jul to Sep | |
| British ColumbiaTable 2b Footnote 2 | 219 | 190 | 191 | 366 | 379 | 389 | 308 |
| Alberta | 117 | 138 | 143 | 153 | 156 | 176 | 190 |
| SaskatchewanTable 2b Footnote 3 | N/A | N/A | N/A | N/A | N/A | N/A | N/A |
| Manitoba | 11 | 10 | 13 | 23 | 31 | 20 | 4 |
| Ontario | 174 | 180 | 174 | 198 | 189 | 265 | 375 |
| QuebecTable 2b Footnote 2 | 41 | 35 | 34 | 21 | N/A | N/A | 93 |
| New Brunswick | 11 | 3 | 6 | 6 | 8 | 8 | 9 |
| Nova Scotia | 14 | 8 | 15 | 3 | 17 | 15 | 13 |
| Prince Edward IslandTable 2b Footnote 3 | N/A | N/A | N/A | N/A | Suppressed | Suppressed | Suppressed |
| Newfoundland and Labrador | Suppressed | Suppressed | Suppressed | Suppressed | Suppressed | Suppressed | Suppressed |
| Yukon | 0 | 2 | 0 | 3 | 3 | 0 | 1 |
| Northwest Territories | 1 | 0 | 1 | 2 | 0 | 0 | 1 |
| Nunavut | Suppressed | Suppressed | Suppressed | Suppressed | Suppressed | Suppressed | Suppressed |
N/A – Data were not available at the time of this publication. Suppressed – Data may be suppressed in provinces or territories with low numbers of cases. Please see Considerations and Limitations for more information.
|
|||||||
2.2 Sex and age trends of accidental apparent opioid-related deaths
This crisis has affected Canadians from all walks of life. However, available data from January 2016 to September 2017, reported as of March 22, 2018, indicate there are differences by sex and age.
Although these trends vary by province or territory, at the national level:
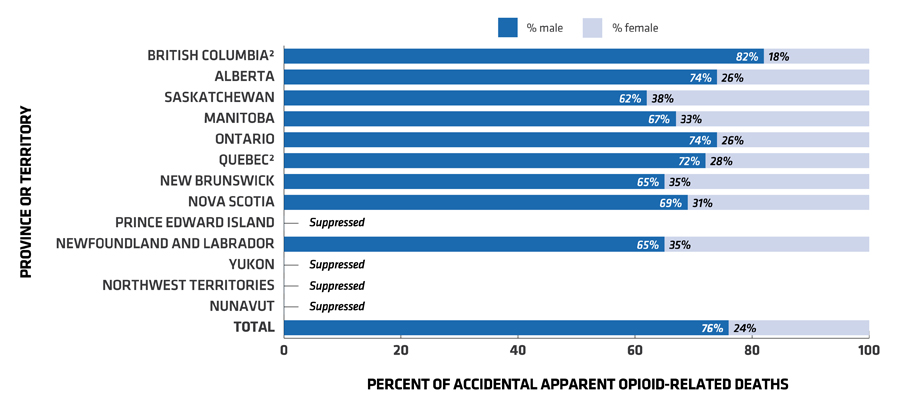
- most (76%) accidental apparent opioid-related deaths occurred among males (Figure 2)
- the highest percent (28%) of accidental apparent opioid-related deaths occurred among individuals between the ages of 30 and 39 (Table 2c)
Figure 2. Sex distribution of accidental apparent opioid-related deaths by province or territory, January 2016 to September 2017.Figure 2 Footnote 1
Suppressed – Data may be suppressed in provinces or territories with low numbers of cases. Please see Considerations and Limitations for more information.
1 Not all provinces and territories reported data for all stages of investigation and all time periods (January 2016 to September 2017); refer to Table 4 for more details. Updates to previously reported data will be provided in future reports.
2 Data from British Columbia and available 2017 data from Quebec (July to September) include deaths related to all illicit drugs including, but not limited to, opioids.
Text description
| Province or territory | % male | % female |
|---|---|---|
| British ColumbiaFigure 2 Footnote 2 | 82% | 18% |
| Alberta | 74% | 26% |
| Saskatchewan | 62% | 38% |
| Manitoba | 67% | 33% |
| Ontario | 74% | 26% |
| QuebecFigure 2 Footnote 2 | 72% | 28% |
| New Brunswick | 65% | 35% |
| Nova Scotia | 69% | 31% |
| Prince Edward Island | Suppressed | Suppressed |
| Newfoundland and Labrador | 65% | 35% |
| Yukon | Suppressed | Suppressed |
| Northwest Territories | Suppressed | Suppressed |
| Nunavut | Suppressed | Suppressed |
| Total | 76% | 24% |
Suppressed – Data may be suppressed in provinces or territories with low numbers of cases. Please see Considerations and Limitations for more information.
|
||
| Province or territory | Age group | ||||||
|---|---|---|---|---|---|---|---|
| ≤ 19 | 20 to 29 | 30 to 39 | 40 to 49 | 50 to 59 | 60 to 69 | ≥ 70 | |
| British ColumbiaTable 2c Footnote 2 | 2% | 18% | 28% | 24% | 21% | 6% | 0% |
| Alberta | 3% | 21% | 34% | 19% | 17% | 5% | 1% |
| Saskatchewan | 3% | 17% | 38% | 14% | 18% | 9% | 1% |
| Manitoba | 1% | 27% | 34% | 15% | 11% | 10% | 3% |
| Ontario | 2% | 21% | 25% | 22% | 22% | 7% | 1% |
| QuebecTable 2c Footnote 3 | 0% | 13% | 21% | 27% | 23% | 11% | 1% |
| New Brunswick | 2% | 20% | 20% | 22% | 22% | 12% | 4% |
| Nova Scotia | 2% | 18% | 28% | 19% | 25% | 8% | 0% |
| Prince Edward Island | Suppressed | Suppressed | Suppressed | Suppressed | Suppressed | Suppressed | Suppressed |
| Newfoundland and Labrador | Suppressed | Suppressed | Suppressed | Suppressed | Suppressed | Suppressed | Suppressed |
| Yukon | 0% | 11% | 56% | 22% | 11% | 0% | 0% |
| Northwest Territories | 0% | 40% | 20% | 0% | 20% | 20% | 0% |
| Nunavut | Suppressed | Suppressed | Suppressed | Suppressed | Suppressed | Suppressed | Suppressed |
| Total | 2% | 19% | 28% | 22% | 21% | 7% | 1% |
Suppressed – Data may be suppressed in provinces or territories with low numbers of cases. Please see Considerations and Limitations for more information.
|
|||||||
2.3 Fentanyl, fentanyl analogues, and other substances involved in accidental apparent opioid-related deaths
Apparent opioid-related deaths often involveFootnote d multiple substances including one or more opioids as well as non-opioid substances. Knowing the type(s) of opioid and non-opioid substances involved in these deaths can help public health officials and other government agencies communicate risks and target harm reduction efforts.
Available data reported as of March 22, 2018, suggest that more accidental apparent opioid-related deaths have involved fentanyl or fentanyl analogues over time (Table 2d, Table 2e):
- the percent of accidental apparent opioid-related deaths involving fentanyl or fentanyl analogues was 55% in 2016 and increased to 72% in 2017 (January to September)Footnote e
- the number of accidental apparent opioid-related deaths involving fentanyl or fentanyl analogues more than doubled in January to September of 2017 compared to the same time period in 2016
In addition, available data suggest that approximately 80% of accidental apparent opioid-related deaths from January 2016 to September 2017Footnote f also involved one or more types of non-opioid substances.
| Province or territory | 2016 | 2017 (Jan to Sep) | ||
|---|---|---|---|---|
| Number | Percent | Number | Percent | |
| British ColumbiaTable 2d Footnote 2 | 652 | 67% | 901 | 84% |
| Alberta | 355 | 64% | 400 | 77% |
| Saskatchewan | 8 | 12% | 7 | 28% |
| Manitoba | 30 | 53% | 29 | 53% |
| Ontario | 330 | 45% | 541 | 68% |
| QuebecTable 2d Footnote 2 | 30 | 23% | 15 | 16% |
| New Brunswick | 3 | 12% | 7 | 28% |
| Nova Scotia | 10 | 25% | 5 | 11% |
| Prince Edward Island | 1 | 20% | 0 | 0% |
| Newfoundland and Labrador | Suppressed | Suppressed | Suppressed | Suppressed |
| Yukon | 4 | 80% | 3 | 75% |
| Northwest Territories | 1 | 25% | 0 | 0% |
| Nunavut | Suppressed | Suppressed | Suppressed | Suppressed |
| Total | 1424 | 55% | 1908 | 72% |
Suppressed – Data may be suppressed in provinces or territories with low numbers of cases. Please see Considerations and Limitations for more information.
|
||||
| 2016 | 2017 (Jan to Sep) | ||||||
|---|---|---|---|---|---|---|---|
| Jan to Mar | Apr to Jun | Jul to Sep | Oct to Dec | Jan to Mar | Apr to Jun | Jul to Sep | |
| TotalTable 2e Footnote 1 | 280 | 311 | 288 | 536 | 559 | 653 | 689 |
|
|||||||
2.4 Apparent opioid-related deaths: suicide
The following section provides information on apparent opioid-related deaths where the completed investigation determined that the opioids were consumed with the intent to die. This section also includes deaths with ongoing investigations where the manner of death was believed to be suicide.
| 2016 | 2017 (Jan to Sep) | ||
|---|---|---|---|
| Number | 250 | 126 | |
| Rate per 100,000 population | 0.7 | 0.5Table 2f Footnote 2 | |
| % male | 47% | 54% | |
| Age group (years) | ≤ 19 | 2% | 1% |
| 20 to 29 | 9% | 10% | |
| 30 to 39 | 11% | 15% | |
| 40 to 49 | 19% | 17% | |
| 50 to 59 | 29% | 25% | |
| 60 to 69 | 21% | 17% | |
| ≥ 70 | 11% | 14% | |
| % involvingTable 2f Footnote 3 fentanyl or fentanyl analoguesTable 2f Footnote 4 | 13% | 18% | |
| % also involving non-opioid substancesTable 2f Footnote 5 | 63% | 77% | |
|
|||
Considerations and Limitations
Definition of an apparent opioid-related death
An apparent opioid-related death is a death caused by an intoxication/toxicity (poisoning) resulting from substance use, where one or more of the substances is an opioid, regardless of how it was obtained (e.g. illegally or through personal prescription).
How apparent opioid-related deaths are counted
Counts are provided by the provinces and territories that collect data from their respective offices of Chief Coroners or Medical Examiners. Rates are calculated using the most current population data from Statistics Canada.
The data provided by the provinces and territories can include:
- deaths with completed or ongoing investigations
- deaths classified as accidental, suicide, or with an undetermined manner of death
These data do not include deaths due to:
- the medical consequences of long term substance use or overuse (for example, alcoholic cirrhosis)
- medical assistance in dying
- trauma where use of the substance(s) contributed to the circumstances of the injury that lead to the death, but was not directly involved in the death
- homicide
However, some provincial and territorial differences remain in the type of data reported and in the time periods for which data are available (refer to Table 4).
| BCTable 4 Footnote 1 | AB | SK | MB | ONTable 4 Footnote 2 | QCTable 4 Footnote 3 | NB | NS | PE | NL | YT | NT | NU | ||
|---|---|---|---|---|---|---|---|---|---|---|---|---|---|---|
| Reporting period (as of March 22, 2018) | ||||||||||||||
| 2016 | January to December | |||||||||||||
| 2017 | January to March | |||||||||||||
| April to June | ||||||||||||||
| July to September | ||||||||||||||
| Classification of deaths included in the reported data | ||||||||||||||
| Accidental | Completed investigations | N/A | ||||||||||||
| Ongoing investigations where manner of death was believed to be accidental | N/U | N/U | N/A | |||||||||||
| Ongoing investigations where manner of death had not been assigned at the time of reporting | N/U | N/U | N/U | N/U | N/U | N/A | ||||||||
| Suicide | Completed investigations | N/A | ||||||||||||
| Ongoing investigations where the manner of death was believed to be suicide | N/U | N/U | N/A | |||||||||||
| Deaths with completed investigations and an undetermined manner of death | N/A | |||||||||||||
|
||||||||||||||
Data suppression
The suppression of data in this report is based on the preferences of individual provinces or territories to address concerns around releasing small numbers for their jurisdiction.
- Prince Edward Island suppressed counts less than five for quarterly data, and for any data regarding sex and age distribution.
- Newfoundland and Labrador suppressed all counts less than five.
- Nunavut suppressed all counts less than five.
- Quebec suppressed counts less than five for deaths with ongoing investigations (July to September 2017)
In addition, suppression was applied in some instances where all data for a province or territory fell in a single category of a given table or figure.
Opioids and other substances
Fentanyl and fentanyl analogues include, but are not limited to:
- 3-methylfentanyl
- acetylfentanyl
- butyrylfentanyl
- carfentanil
- despropionyl-fentanyl
- fentanyl
- furanyl-fentanyl
- norfentanyl
Non-fentanyl-related opioids include, but are not limited to:
- buprenorphine metabolites
- codeine
- dihydrocodeine
- heroin
- hydrocodone
- hydromorphone
- loperamide
- meperidine
- methadone
- monoacetylmorphine
- morphine
- normeperidine
- oxycodone
- tapentadol
- tramadol
- U-47700
Non-opioid substances include, but are not limited to:
- alcohol
- benzodiazepines
- cocaine
- W-18
Limitations of these apparent opioid-related deaths data
Data presented in this report should be interpreted with caution.
- This report is based on data submitted to the Public Health Agency of Canada on or before March 22, 2018. New or revised data submitted after this date will be reflected in future reports.
- Data released by provinces and territories may differ from the data provided in this report due to the availability of updated data, differences in the type of data reported (e.g. manners of death), the use of alternate age groupings, differences in time periods presented, etc.
- As some data are based on ongoing investigations by coroners and medical examiners, they are considered preliminary and subject to change. The time required to complete an investigation and related administrative processes is case-dependent and can range from approximately three to twenty-four months.
- This report is based on data that do not specify how the opioids were obtained (e.g. illegally or through personal prescription); the level of toxicity may differ depending on the source of the opioid.
- Jurisdictional differences in the death investigation process, death classification method, toxicology testing and the manners of death reported may impact the interpretation and comparability of the data presented in this report.
- Information related to changes over time at the national level is based only on jurisdictions where data were available for all time periods of interest.
- Rates reported here have not been adjusted for existing differences in provincial and territorial age distributions.
- Rates for jurisdictions with relatively smaller populations may change substantially with even slight changes in the number of deaths. As a result, comparisons over time and between provinces and territories should be interpreted with caution.
Footnotes
- Footnote a
Changes to previously reported counts and rates of apparent opioid-related deaths reflect updates to provincial or territorial data.
- Footnote b
The estimated annual rate for 2017 is based on available data from January to September 2017.
- Footnote c
This percentage does not include data from Saskatchewan, Prince Edward Island or Nunavut.
- Footnote d
Given jurisdictional differences in death classification methods, the term "involve" includes deaths where the substance was either detected and/or directly contributed to the death.
- Footnote e
These percentages do not include data from Newfoundland and Labrador or Nunavut. Higher percentages in 2017 compared to 2016 of apparent opioid-related deaths involving fentanyl or fentanyl analogues should be interpreted with caution. The observed differences between the two time periods may reflect relative increases in the numbers of deaths involving fentanyl or fentanyl analogues, or may reflect a delay in the reporting of deaths not involving fentanyl or fentanyl analogues in some provinces and territories. In addition, these data are preliminary and subject to change.
- Footnote f
Data were not available from British Columbia, Saskatchewan, Ontario (for 2017), Quebec (for 2017) or Nunavut. For Alberta, the data included in this percentage were for deaths with completed investigations only. Ontario data do not include alcohol as one of the non-opioid substances.