
Mental health and problematic social media use in Canadian adolescents
Download the alternative format
(PDF format, 1.1 MB, 13 pages)
Organization: Public Health Agency of Canada
Type: Publication
Date published: 2022-01-04
Related topics
Findings from the 2018 Health Behaviour in School-aged Children (HBSC) Study.
On this page
- Introduction
- Mental health of Canadian adolescents
- Risk of problematic social media use by characteristics
- Association between mental health and problematic social media use by gender
- Association between mental health and problematic social media use by gender and grade
- Predicted probabilities of mental health outcomes by problematic social media use across gender and grade
- Limitations
- Conclusions
- Methods
- References
- Acknowledgements
Introduction
According to the World Health Organization, around 10 to 20% of all children and adolescents worldwide live with mental health problems.Footnote 1
Approximately 50% of mental health diagnoses are received by adolescents at the age of 14 years and 75% at the age of 19 years.Footnote 1
The use of social media use is a central focus in the lives of many adolescents.Footnote 2 As such, there is a need to better understand the link between mental health and social media use.
Some researchers have suggested that it is not general social media use but rather problematic social media use (indicated by behavioural and psychological symptoms of addiction to social media) that is associated with difficulties in academic functioning, psychosocial functioning, mental health symptoms, and cyber-bullying.Footnote 3Footnote 4Footnote 5Footnote 6
Most research has focused on either problematic or non-problematic social media use. There is little research on varying degrees of problematic social media use on adolescent mental health and well-being.
The current study investigated 1) the prevalence of mental health outcomes (e.g., psychological symptoms, emotional problems, and life satisfaction) among adolescents (grades 6 to 10) in Canada, and 2) the association between varying degrees of problematic social media use with these mental health measures.
Mental health of Canadian adolescents
Grades 6 to 8 students reported having better mental health than Grades 9 to 10 students. For both boys and girls, the prevalence of psychological symptoms and emotional problems increased, and the prevalence of high life satisfaction decreased, from Grades 6 to 8 to Grades 9 to 10.
Boys reported having better mental health than girls. More girls than boys reported psychological symptoms and emotional problems, and more boys than girls reported high life satisfaction.
Students who reported not being financially well off were more likely to report having psychological symptoms and emotional problems, and less likely to report life satisfaction than students who reported being financially well off.
| N/A | High psychological symptoms weighted % (95% CI) |
High emotional problems weighted % (95% CI) |
High life satisfaction weighted % (95% CI) |
|---|---|---|---|
| Total sample | 28.59 |
13.66 |
50.60 |
| Girls | 37.03 |
18.15 |
44.77 |
| Boys | 17.73 |
7.58 |
58.58 |
| Grade 6 to 8 | 24.36 |
12.51 |
55.99 |
| Grade 9 to 10 | 34.26 |
15.20 |
43.34 |
| Foreign born | 28.94 |
13.76 |
51.29 |
| Canadian born | 26.06 |
12.76 |
45.56 |
| Perceived family wealth: Financially well-off | 22.88 |
9.73 |
60.43 |
| Perceived family wealth: Average | 33.75 |
16.51 |
39.35 |
| Perceived family wealth: Not financially well-off | 47.26 |
28.09 |
34.80 |
See Methods for details regarding 'high psychological symptoms', 'high emotional problems' and 'high life satisfaction'. Source: Health Behaviour in School-aged Children (HBSC), Canada, 2018 |
|||
Risk of problematic social media use by characteristics
Overall, 6.85% of students were classified as having problematic social media use (PSMU), 33.14% of students as being at moderate risk for PSMU and 60.00% of students as being at low risk for PSMU.
Girls were more likely to be classified as having PSMU (7.96%) than boys (5.35%).
Students in Grades 9 to 10 were more likely to be classified as having PSMU (8.10%) than those in Grades 6 to 8 (5.93%).
| N/A | Low risk of PSMU weighted % (95% CI) |
Moderate risk of PSMU weighted % (95% CI) |
PSMU weighted % (95% CI) |
|---|---|---|---|
| Total sample | 60.00 |
33.14 |
6.84 |
| Girls | 54.01 |
38.03 |
7.96 |
| Boys | 67.71 |
26.95 |
5.35 |
| Grade 6 to 8 | 63.08 |
30.99 |
5.93 |
| Grade 9 to 10 | 55.85 |
36.05 |
8.10 |
| Foreign born | 48.62 |
40.98 |
10.39 |
| Canadian born | 61.62 |
32.00 |
6.38 |
| Perceived family wealth: Financially well-off | 64.58 |
29.59 |
5.83 |
| Perceived family wealth: Average | 54.97 |
37.27 |
7.75 |
| Perceived family wealth: Not financially well-off | 52.72 |
38.15 |
9.13 |
Problematic social media use was determined from the number of problematic behaviours related to social media use. The survey used the Social Media Disorder Scale to ask students if they experienced nine problematic behaviours related to social media use in the past year. Respondents were classified as having PSMU if they reported 6 to 9 problematic behaviours; moderate risk of PSMU if they reported 2 to 5; and low risk of PSMU if they reported 0 to 1.
Source: Health Behaviour in School-aged Children (HBSC), Canada, 2018 |
|||
Association between mental health and problematic social media use by gender
Moderate risk of PSMU and PSMU were associated with a greater risk of reporting high psychological symptoms and emotional problems for both boys and girls. In addition, moderate risk of PSMU and PSMU was negatively associated with high life satisfaction.
The association between PSMU and psychological problems was stronger for boys (PSMU RR = 3.15) than girls (PSMU RR = 2.16).
The association between PSMU and high emotional problems was similar for boys and girls (PSMU RR = 3.88 and 2.92, respectively).
The association between PSMU and high life satisfaction was stronger for girls (PSMU RR = 0.51) than boys (PSMU RR = 0.63).
| N/A | High psychological symptoms adjusted RR (95% CI) |
High emotional problems adjusted RR (95% CI) |
High life satisfaction adjusted RR (95% CI) |
|---|---|---|---|
| Overall: Moderate risk of PSMU |
1.85 |
2.23 |
0.69 |
| PSMU | 2.64 |
3.45 |
0.54 |
| Boys: Moderate risk of PSMU |
1.88 |
2.19 |
0.80 |
| Boys: PSMU | 3.15 |
3.88 |
0.63 |
| Girls: Moderate risk of PSMU |
1.63 |
1.96 |
0.65 |
| Girls: PSMU | 2.16 |
2.92 |
0.51 |
Source: Health Behaviour in School-aged Children (HBSC), Canada, 2018 |
|||
Association between mental health and problematic social media use by gender and grade
Across gender and grade groups, there was a gradient in risk of poor mental health among those at moderate risk of PSMU and PSMU.
The association between PSMU and poor mental health was particularly strong among boys in Grades 9 to 10 who had about 5 times the risk of reporting high emotional problems, and boys in Grades 6 to 8 who had about 3.5 times the risk of reporting high psychological symptoms, relative to their peers who were at low risk of PSMU.
The inverse association between PSMU and high life satisfaction was greatest in Grades 6 to 8 girls (PSMU RR = 0.40) and lowest among Grades 6 to 8 boys (PSMU RR = 0.73) relative to their peers who were at low risk of PSMU.
Gender was found to modify the association between PSMU and poor mental health in both Grades 6 to 8 and Grades 9 to 10, except for high emotional problems where the association was similar in boys and girls from Grades 6 to 8.
| N/A | High psychological symptoms adjusted RR (95% CI) |
High emotional problems adjusted RR (95% CI) |
High life satisfaction adjusted RR (95% CI) |
|---|---|---|---|
| Boys grades 6 to 8: Moderate risk of PSMU |
1.81 |
2.49 |
0.81 |
| Boys grades 6 to 8: PSMU | 3.46 |
3.08 |
0.73 |
| Boys grades 9 to 10: Moderate risk of PSMU |
1.95 |
1.92 |
0.79 |
| Boys grades 9 to 10: PSMU | 2.92 |
4.96 |
0.49 |
| Girls grades 6 to 8: Moderate risk of PSMU |
1.93 |
2.16 |
0.66 |
| Girls grades 6 to 8: PSMU | 2.85 |
3.31 |
0.40 |
| Girls grades 9 to 10: Moderate risk of PSMU |
1.42 |
1.82 |
0.63 |
| Girls grades 9 to 10: PSMU | 1.80 |
2.80 |
0.63 |
Source: Health Behaviour in School-aged Children (HBSC), Canada, 2018 |
|||
Predicted probabilities of mental health outcomes by problematic social media use across gender and grade
Figure 1 shows that the absolute probability of high psychological symptoms and emotional problems was higher in girls than in boys, across grades.
Across almost all gender and grade groups, there was a gradient in risk of poor mental health with greater risk of PSMU.
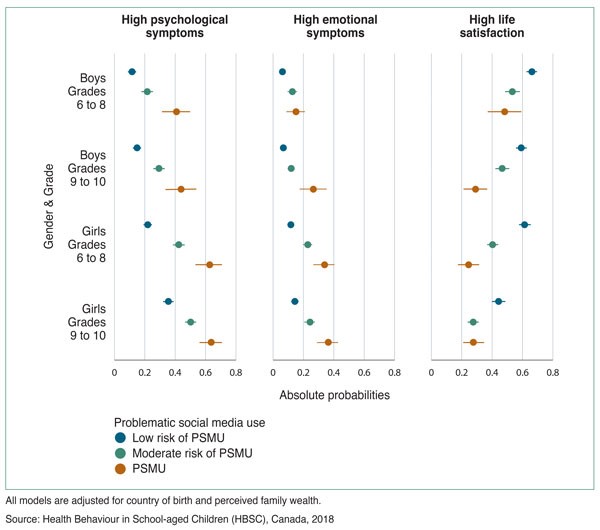
Figure 1: Text equivalent
| N/A | Absolute probabilities | ||||||||
|---|---|---|---|---|---|---|---|---|---|
| High psychological symptoms | High emotional symptoms | High life satisfaction | |||||||
| Problematic social media use | Low risk | Moderate risk | High risk | Low risk | Moderate risk | High risk | Low risk | Moderate risk | High risk |
| Boys Grades 6 to 8 | 0.12 | 0.21 | 0.41 | 0.05 | 0.12 | 0.14 | 0.66 | 0.53 | 0.48 |
| Boys Grades 9 to 10 | 0.15 | 0.29 | 0.44 | 0.05 | 0.10 | 0.27 | 0.59 | 0.47 | 0.29 |
| Girls Grades 6 to 8 | 0.22 | 0.42 | 0.63 | 0.11 | 0.23 | 0.35 | 0.61 | 0.40 | 0.25 |
| Girls Grades 9 to 10 | 0.36 | 0.50 | 0.64 | 0.13 | 0.24 | 0.38 | 0.44 | 0.28 | 0.28 |
All models are adjusted for country of birth and perceived family wealth. Source: Health Behaviour in School-aged Children (HBSC), Canada, 2018 |
|||||||||
Limitations
All research studies have limitations, and it is important to interpret results in light of their limitations.
- All data in the HBSC were collected using self-report, which is prone to reporting biases. For example, youth have difficulty recalling past social media use.Footnote 7 Light mobile phone users tend to overestimate their use, while heavy users may underestimate their use.Footnote 8
- The cross-sectional design of the HBSC does not allow for the inference of causality. For example, it is possible that problematic social media use led to poorer mental health. It is also possible that poorer mental health led to problematic social media use or something else may have led to both.
- Students were asked to respond to the question "Are you male or female?" by selecting from the three responses, "male", "female" or "neither term describes me". Students who indicated "neither term describes me" did not comprise a large enough group to include in the statistical analyses.
Conclusions
Nearly one third of adolescents reported high psychological symptoms; about 14% reported high emotional problems; and only about half reported high life satisfaction.
With 40% of adolescents being classified as having PSMU or at moderate risk for PSMU, it is important to understand the implications this technological trend has on the mental health of Canadian youth.
Adolescents who were classified as having PSMU and at moderate risk of PSMU were more likely to report high psychological symptoms, high emotional problems, and less likely to report high life satisfaction, compared to adolescents at low risk of PSMU.
While boys who were classified as having PSMU were more likely to report poor mental health compared to other boys, girls reported poorer mental health overall compared to boys.
Social media will continue to be an important tool for youth, and as such, it is important to understand the processes that are related to creating healthy and unhealthy patterns of social media use.
Methods
Data source
Data were from the Canadian Health Behaviour in School-aged Children (HBSC) study, a national cross-sectional study of adolescents conducted every four years since 1989-90.Footnote 9 In 2018, data were collected in school settings from a nationally representative random two-stage cluster sample of adolescents in grades 6 to 10 from all provinces and two territories in Canada. For this study, we included the 15,184 participants who responded to items on social media use.*
*Refer to the international HBSC webpage for more information on the HBSC study.
Measures
Mental health measures included psychological symptoms, emotional problems, and life satisfaction. Psychological symptoms were measured from the HBSC symptom checklistFootnote 11 that asked about the frequency of four psychological health complaints over the past 6 months, including "feeling low/depressed", "irritability or bad temper", feeling nervous", and "difficulties getting to sleep". Responses were scored on a 5-point scale ranging from 1 (rarely or never) to 5 (about every day) (α = 0.78). We calculated the sum score and classified participants as experiencing high psychological symptoms if they had a score of 12 or more, equivalent to an average rating of "about every week" or more frequent across the 4 psychological symptoms. Emotional problems were assessed using the Emotional Problems IndexFootnote 10 which asked how much the student agreed with the following five emotional concerns: "I often wish I were someone else"; "I often feel helpless"; "I would change how I look if I could"; "I often feel left out of things"; "I often feel lonely". Response categories ranged from 1 (strongly disagree) to 5 (strongly agree) (α =.88). We calculated the sum score and classified participants as experiencing high emotional problems if they had a score of 20 or more, equivalent to an average response of "agree" and "strongly agree" across the five emotional problems. Finally, the survey assessed life satisfaction using the Cantril ladder. The participants were asked where they felt their life ranked at the moment on a scale of 0 (worst possible life) to 10 (best possible life). We defined high life satisfaction using a cut-off score of 8 or higher.Footnote 11
Problematic social media use (PSMU) was assessed using the nine-item Social Media Disorder Scale (SMDS).Footnote 4 The SMDS is a validated and reliable scale that asks students if they experienced (yes/no) nine problem behaviours related to social media use in the past year.Footnote 4 Respondents were classified as having PSMU (sum score 6 to 9), moderate risk of PSMU (sum score 2 to 5), and low risk of PSMU (sum score 0 to 1).Footnote 4
We included information on grade (grades 6 to 10), gender (boy; girl), country of birth (Canadian; non-Canadian), and perceived wealth. Perceived wealth was assessed by asking students how well off they thought their family was. Responses ranged from "not well off at all" to "very well off". We collapsed the responses into three categories of well-off (quite well off/ very well off), average (average), and not well-off (quite well off/very well off).
Statistical analyses
We tested the association between PSMU and mental health measures using modified poisson regression models to estimate the relative risk of high psychological symptoms, emotional problems, and life satisfaction in unadjusted models and in models adjusted for gender, grade, country of birth, perceived family wealth. We further conducted stratified analyses by gender and grade. We presented the predicted probabilities of high psychological symptoms, emotional problems, and life satisfaction (from the Poisson models) by gender and grade group using the margins and coefplot commands in Stata. All variables had between 0 and 5% missing data. Analyses were done using Stata/SE 15 and accounted for clustering at the school level and incorporated sampling weights to ensure results were nationally representative.
Acknowledgements
- Health Behaviour in School-aged Children (HBSC) is an international study carried out in collaboration with the World Health Organization, European Region (WHO/EURO). The International HBSC Coordinator was Dr. Joanna Inchley (University of Glasgow, Scotland) for the 2017/18 survey and the Data Bank Manager was Dr. Oddrun Samdal (University of Bergen, Norway). The Canadian 2017/18 HBSC survey was funded by the Public Health Agency of Canada, the principal investigators were Drs. John Freeman, William Pickett and Wendy Craig (Queen's University), and the national coordinator was Matthew King (Social Program Evaluation Group, Queen's University).