
Canadian Nosocomial Infection Surveillance Program (CNISP): Summary Report of Healthcare Associated Infection (HAI), Antimicrobial Resistance (AMR) and Antimicrobial Use (AMU) Surveillance Data from January 1, 2013 to December 31, 2017
Download the alternative format
(PDF format, 2.76 MB, 42 pages)
Organization: Public Health Agency of Canada
Published: May 2019
Cat.: HP37-30E-PDF
ISBN: 2562-5640
Pub.: 190006
Table of contents
- Introduction
- Methods
- Data Highlights
- Results
- Appendix A: Hospitals participating in the Canadian Nosocomial Infection Surveillance Program, as of December 2017
- Appendix B:Summary of hospitals participating in CNISP, 2017
- Appendix C: 2017 Surveillance Case Definitions and Eligibility Criteria
- Appendix D: Antibiotics included in antibiotic class categories
Introduction
This report entitled Canadian Nosocomial Infection Surveillance Program (CNISP): Summary Report of Healthcare Associated Infection (HAI), Antimicrobial Resistance (AMR) and Antimicrobial Use (AMU) Surveillance Data from January 1, 2013 to December 31, 2017, was produced by the Centre for Communicable Diseases and Infection Control (CCDIC) of the Public Health Agency of Canada (PHAC). The report provides a review of available HAI, AMR and AMU surveillance data from sentinel hospitals across Canada.
PHAC collects national data on various healthcare associated infections and AMU through the Canadian Nosocomial Infection Surveillance Program (CNISP), a collaborative effort of CCDIC, the National Microbiology Laboratory (NML) and sentinel hospitals across Canada who participate as members of the Canadian Hospital Epidemiology Committee (CHEC), a subcommittee of the Association of Medical Microbiology and Infectious Disease (AMMI) Canada. Their ongoing contributions to national HAI surveillance are gratefully acknowledged.
CCDIC coordinates the data collection and is responsible for the data management, analysis and report production related to this summary report. CCDIC supports the use of these data to inform public health and policy action.
CNISP surveillance provides key information that informs the development of federal, provincial, territorial and local infection prevention and control and antimicrobial stewardship programs and policies. When carried out in a uniform manner, surveillance provides a measure of the burden of illness, establishes benchmark rates for internal and external comparison, identifies potential risk factors, and allows for the assessment of specific interventions. Surveillance for HAIs is considered an important component of the quality of patient care.
Methods
This report provides case counts and rates based on data from January 1, 2013 to December 31, 2017. All rates presented in this report represent infections and/or colonizations identified in patients admitted (inpatients) to CNISP hospitals. Where possible, rates are provided by region and include Western (British Columbia, Alberta, Saskatchewan and Manitoba), Central (Ontario and Quebec), and Eastern Regions (Nova Scotia, New Brunswick, Prince Edward Island and Newfoundland and Labrador). The territories do not currently submit data to PHAC.
National and regional infection rates are based on total number of cases divided by the total number of patient admissions (multiplied by 1,000) or patient days (multiplied by 10,000). Molecular characterization and antimicrobial resistance testing is conducted by the National Microbiology Laboratory (NML) on all patient-linked isolates received for CDI, MRSA, VRE, CPE and CPA with select results presented. The 2017 case definitions and eligibility criteria for these surveillance programs are provided in Appendix C.
This report supersedes the data in previous CNISP reports. The most current report should be considered the most accurate. Surveillance data are dynamic and results are subject to change as more updated data are made available by the participating hospitals. Note that for all years, only hospitals that submitted both numerator and denominator data are included in the rate calculations.
For questions or more detailed information on these methods, rates or for a copy of the most recent surveillance report, please contact CNISP by sending an email to phac.cnisp-pcsin.aspc@canada.ca.
Data highlights
Clostridioides difficile Infection (CDI)
- From 2013 to 2017, healthcare associated CDI (HA-CDI)Footnote 1 rates have significantly decreased by 25%.
- Approximately one-third of all CDI casesFootnote 2 were community-associated CDI from 2015 to 2017.
- The number of deaths attributable to CDI during the two-month study period each year ranged from 12 (3.0% in 2016) to 22 (4.3% in 2014)Footnote 3.
- Among HA-CDI strains from 2013 to 2017, NAP1 has significantly decreased by 44%, while NAP4 and NAP11 continue to increase from 17.4% to 21.6% and 6.4% to 13.7%, respectively. A similar trend is observed from 2015 to 2017 among community associated C. difficile strains.
- A significantly larger proportion of NAP1 strains are identified among HA-CDI isolates (50.6%) compared to CA-CDI isolates (9.9%).
Methicillin-Resistant Staphylococcus aureus (MRSA)
- There has been a gradual but significant increase in overall MRSA infection rates (includes both bloodstream and non-bloodstream infections) since 2013. This increase in the overall rates is primarily driven by the increase in community-associated MRSA (CA-MRSA) infection rates. Healthcare-associated (HA-MRSA) infection rates have continued to steadily decrease since 2013.
- Since 2015, CMRSA10 strain type (the strain associated with community-acquired MRSA) has been the predominant strain type identified. Prior to 2015, CMRSA2 (the strain associated with CA-MRSA) represented the largest proportion of strain types identified.
- There has been a significant decrease in all-cause mortality among patients identified with MRSA-BSI from 26% in 2013 to 16% in 2017.
- From 2013 to 2017, there has been a significant decrease in Clindamycin resistance (84% to 42%) among all MRSA isolates tested (blood and non-blood).
Vancomycin-Resistant Enterococci (VRE)
- From 2015 to 2017 there has been a steady yet significant increase in VRE bloodstream infection (BSI) rates (approximately 28% each year), with the largest increase reported in Central Canada.
- From 2016 to 2017, a significant increase in VRE BSI isolates that are non-typeable using MLST was observed (9.8% to 62.1%).
- Among VRE BSI isolates, a significant increase in resistance to nitrofurantoin (18.7% to 44.8%) and HL-Gentamicin (17.3% to 38.8%) has been identified from 2013-2017.
Carbapenemase-Producing Enterobacteriaceae (CPE) and Carbapenemase-Producing Acinetobacter (CPA)
- CPE infection rates have remained stable from 2013 to 2017 (0.03 per 10,000 patient days). However, CPE colonization rates have significantly increased from 2014 (0.03 per 10,000 patient days) to 2017 (0.14 per 10,000 patient days), largely due to an increase in colonized cases in central Canada.
- CPA rates in Canada remain extremely low, with the exception of a 2013 outbreak attributed to one hospital in the Central region.
- Among CPEs, KPC and NDM continue to be the predominant carbapenemases, while OXA-23 continues to be the predominant carbapenemase for CPA.
Escherichia coli Antibiogram (E. coli)
- In 2015, CNISP initiated a pilot project to assess the feasibility of collecting hospital antibiogram data for Escherichia coli (E. coli). In 2016, surveillance using standardized antibiogram data collection was conducted. These data are presented for the first time in this report and indicate minimal changes in E. coli resistance patterns between 2015 and 2016.
Antimicrobial Use (AMU)
- Antimicrobial use among adult inpatients on ICU wards is significantly higher than antimicrobial use on other hospital wards; defined daily doses of antibiotics are 2.5 to 3 times higher on ICU wards compared to non-ICU wards.
- Among adult inpatients, cephalosporins were the most common class of antibiotics and represented approximately one quarter of all defined daily doses.
Results
1. Clostridioides difficile Infection (CDI)
1a. Healthcare associated Clostridioides difficile Infection (HA-CDI)
| 2013 | 2014 | 2015 | 2016 | 2017 | |
|---|---|---|---|---|---|
| National | |||||
| No. of HA-CDI cases | 3,160 | 2,870 | 2,895 | 2,814 | 2,721 |
| Rate per 1,000 pt admissions | 3.99 | 3.43 | 3.30 | 3.13 | 2.99 |
| Rate per 10,000 pt days | 5.19 | 4.39 | 4.28 | 4.05 | 3.85 |
| No. of reporting hospitals | 54 | 60 | 62 | 63 | 64 |
| West | |||||
| No. of HA-CDI cases | 1,198 | 1,121 | 1,303 | 1,254 | 1,180 |
| Rate per 1,000 pt admissions | 3.61 | 3.10 | 3.31 | 3.10 | 2.91 |
| Rate per 10,000 pt days | 4.82 | 4.10 | 4.36 | 4.05 | 3.82 |
| Central | |||||
| No. of HA-CDI cases | 1,732 | 1,506 | 1,3382 | 1,290 | 1,237 |
| Rate per 1,000 pt admissions | 4.56 | 3.89 | 3.39 | 3.22 | 3.00 |
| Rate per 10,000 pt days | 6.07 | 5.13 | 4.56 | 4.35 | 3.97 |
| East | |||||
| No. of HA-CDI cases | 230 | 243 | 254 | 270 | 304 |
| Rate per 1,000 pt admissions | 2.86 | 2.75 | 2.89 | 2.90 | 3.27 |
| Rate per 10,000 pt days | 3.07 | 2.81 | 3.03 | 3.07 | 3.57 |
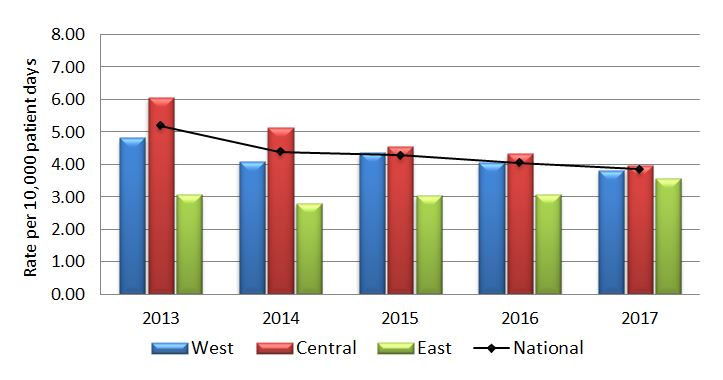
Figure 1.1 - Text description
| Year | Region | Rate |
|---|---|---|
| 2013 | West | 4.82 |
| 2013 | Central | 6.07 |
| 2013 | East | 3.07 |
| 2013 | National | 5.19 |
| 2014 | West | 4.10 |
| 2014 | Central | 5.13 |
| 2014 | East | 2.81 |
| 2014 | National | 4.39 |
| 2015 | West | 4.36 |
| 2015 | Central | 4.56 |
| 2015 | East | 3.03 |
| 2015 | National | 4.28 |
| 2016 | West | 4.05 |
| 2016 | Central | 4.35 |
| 2016 | East | 3.07 |
| 2016 | National | 4.05 |
| 2017 | West | 3.82 |
| 2017 | Central | 3.97 |
| 2017 | East | 3.57 |
| 2017 | National | 3.85 |
| Year | Number of deathsFootnote 4 | Attributable mortality rate per 100 cases (%) |
|---|---|---|
| 2013 | 21 | 3.9 |
| 2014 | 22 | 4.3 |
| 2015 | 16 | 3.8 |
| 2016 | 12 | 3.0 |
| 2017 | 14 | 3.2 |
| Strain Type | 2013 | 2014 | 2015 | 2016 | 2017 |
|---|---|---|---|---|---|
| No. (%) | No. (%) | No. (%) | No. (%) | No. (%) | |
| NAP4 | 90 (17.5) | 92 (19.1) | 103 (20.6) | 91 (20.1) | 107 (21.6) |
| NAP1 | 152 (29.6) | 114 (23.6) | 115 (23.0) | 53 (11.8) | 83 (16.7) |
| NAP11 | 33 (6.4) | 62 (12.9) | 50 (10.0) | 73 (16.2) | 68 (13.7) |
| Other NAP typesFootnote 6 | 91 (17.8) | 84 (17.4) | 94 (18.8) | 72 (16.0) | 88 (17.7) |
| Other-not assigned | 147 (28.7) | 130 (27.0) | 138 (27.6) | 162 (35.9) | 150 (30.2) |
| Total | 513 | 482 | 500 | 451 | 496 |
| Antibiotics | 2013 | 2014 | 2015 | 2016 | 2017 |
|---|---|---|---|---|---|
| No. (%) | No. (%) | No. (%) | No. (%) | No. (%) | |
| Clindamycin | 156 (30.5) | 209 (43.1) | 122 (24.4) | 99 (22.0) | 104 (21.0) |
| Moxifloxacin | 166 (32.4) | 137 (28.2) | 138 (27.6) | 72 (16.0) | 89 (17.9) |
| Rifampin | 13 (2.5) | 5 (1.0) | 10 (2.0) | 7 (1.6) | 13 (2.6) |
| Total isolates tested | 512 | 482 | 500 | 451 | 496 |
Note: All C. difficile strains from 2013 to 2017 submitted to NML were susceptible to metronidazole, tigecycline and vancomycin.
1 b. Community associated Clostridioides difficile Infection (CA-CDI)
| 2013 | 2014 | 2015 | 2016 | 2017 | |
|---|---|---|---|---|---|
| National | |||||
| No. of CA-CDI cases | N/A | N/A | 1,035 | 961 | 1,053 |
| Rate per 1,000 pt admissions | N/A | N/A | 1.56 | 1.39 | 1.49 |
| Rate per 10,000 pt days | N/A | N/A | 2.03 | 1.81 | 1.91 |
| No. of reporting hospitals | N/A | N/A | 49 | 51 | 53 |
| West | |||||
| No. of CA-CDI cases | N/A | N/A | 254 | 243 | 287 |
| Rate per 1,000 pt admissions | N/A | N/A | 1.15 | 1.07 | 1.24 |
| Rate per 10,000 pt days | N/A | N/A | 1.55 | 1.44 | 1.65 |
| Central | |||||
| No. of CA-CDI cases | N/A | N/A | 675 | 613 | 634 |
| Rate per 1,000 pt admissions | N/A | N/A | 1.91 | 1.64 | 1.65 |
| Rate per 10,000 pt days | N/A | N/A | 2.57 | 2.22 | 2.18 |
| East | |||||
| No. of CA-CDI cases | N/A | N/A | 106 | 105 | 132 |
| Rate per 1,000 pt admissions | N/A | N/A | 1.20 | 1.15 | 1.45 |
| Rate per 10,000 pt days | N/A | N/A | 1.27 | 1.19 | 1.55 |
| Strain Type | 2013 | 2014 | 2015 | 2016 | 2017 |
|---|---|---|---|---|---|
| No. (%) | No. (%) | No. (%) | No. (%) | No. (%) | |
| NAP4 | N/A | N/A | 49 (17.4) | 49 (19.4) | 48 (22.7) |
| NAP11 | N/A | N/A | 40 (14.2) | 28 (11.1) | 37 (17.5) |
| NAP1 | N/A | N/A | 35 (12.4) | 25 (9.9) | 14 (6.6) |
| Other NAP typesFootnote6 | N/A | N/A | 50 (17.7) | 51 (20.2) | 32 (15.2) |
| Other-not assigned | N/A | N/A | 108 (38.3) | 99 (39.3) | 80 (37.9) |
| Total | N/A | N/A | 282 | 252 | 211 |
| Antibiotics | 2013 | 2014 | 2015 | 2016 | 2017 |
|---|---|---|---|---|---|
| No.(%) | No. (%) | No. (%) | No. (%) | No. (%) | |
| Clindamycin | N/A | N/A | 73 (25.9) | 60 (23.8) | 40 (19.0) |
| Moxifloxacin | N/A | N/A | 40 (14.2) | 25 (9.9) | 18 (8.5) |
| Rifampin | N/A | N/A | 3 (1.1) | 1 (0.4) | 1 (0.5) |
| Total isolates tested | N/A | N/A | 282 | 252 | 211 |
2. Methicillin-Resistant Staphylococcus aureus (MRSA)
| 2013 | 2014 | 2015 | 2016 | 2017 | |
|---|---|---|---|---|---|
| National | |||||
| No. of MRSA infections | 1,849 | 1,969 | 2,049 | 2,237 | 2,313 |
| Rate per 1,000 pt admissions | 2.12 | 2.12 | 2.18 | 2.30 | 2.35 |
| Rate per 10,000 pt days | 2.83 | 2.89 | 2.93 | 3.11 | 3.17 |
| No. of reporting hospitals | 53 | 58 | 59 | 61 | 62 |
| West | |||||
| No. of MRSA infections | 898 | 949 | 1,117 | 1,268 | 1,303 |
| Rate per 1,000 pt admissions | 2.48 | 2.33 | 2.63 | 2.88 | 2.95 |
| Rate per 10,000 pt days | 3.40 | 3.29 | 3.54 | 3.90 | 4.06 |
| Central | |||||
| No. of MRSA infections | 739 | 801 | 732 | 784 | 851 |
| Rate per 1,000 pt admissions | 1.79 | 1.91 | 1.75 | 1.82 | 1.94 |
| Rate per 10,000 pt days | 2.48 | 2.68 | 2.47 | 2.60 | 2.68 |
| East | |||||
| No. of MRSA infections | 212 | 219 | 200 | 185 | 159 |
| Rate per 1,000 pt admissions | 2.15 | 2.19 | 2.03 | 1.77 | 1.53 |
| Rate per 10,000 pt days | 2.34 | 2.33 | 2.24 | 1.98 | 1.74 |
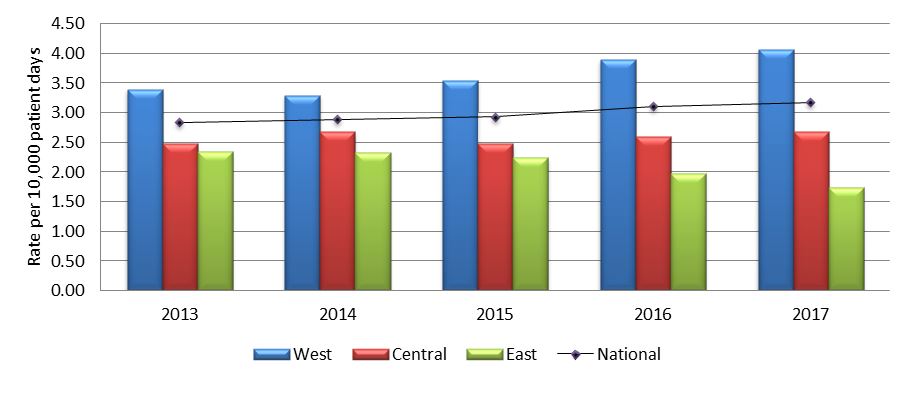
Figure 2.1 - Text description
| Year | Region | Rate |
|---|---|---|
| 2013 | West | 3.40 |
| 2013 | Central | 2.48 |
| 2013 | East | 2.34 |
| 2013 | National | 2.83 |
| 2014 | West | 3.29 |
| 2014 | Central | 2.68 |
| 2014 | East | 2.33 |
| 2014 | National | 2.89 |
| 2015 | West | 3.54 |
| 2015 | Central | 2.47 |
| 2015 | East | 2.24 |
| 2015 | National | 2.93 |
| 2016 | West | 3.90 |
| 2016 | Central | 2.60 |
| 2016 | East | 1.98 |
| 2016 | National | 3.11 |
| 2017 | West | 4.06 |
| 2017 | Central | 2.68 |
| 2017 | East | 1.74 |
| 2017 | National | 3.17 |
| 2013 | 2014 | 2015 | 2016 | 2017 | |
|---|---|---|---|---|---|
| National | |||||
| No. of HA-MRSA infections | 1,141 | 1,171 | 1,193 | 1,206 | 1,202 |
| Rate per 1,000 pt admissions | 1.31 | 1.26 | 1.27 | 1.24 | 1.22 |
| Rate per 10,000 pt days | 1.75 | 1.72 | 1.70 | 1.67 | 1.65 |
| No. of reporting hospitals | 53 | 58 | 59 | 61 | 62 |
| West | |||||
| No. of HA-MRSA infections | 554 | 535 | 631 | 676 | 637 |
| Rate per 1,000 pt admissions | 1.53 | 1.31 | 1.48 | 1.54 | 1.44 |
| Rate per 10,000 pt days | 2.10 | 1.86 | 2.00 | 2.07 | 1.99 |
| Central | |||||
| No. of HA-MRSA infections | 404 | 459 | 405 | 381 | 447 |
| Rate per 1,000 pt admissions | 0.98 | 1.09 | 0.97 | 0.89 | 1.02 |
| Rate per 10,000 pt days | 1.36 | 1.53 | 1.37 | 1.26 | 1.41 |
| East | |||||
| No. of HA-MRSA infections | 183 | 177 | 157 | 149 | 118 |
| Rate per 1,000 pt admissions | 1.85 | 1.77 | 1.59 | 1.43 | 1.14 |
| Rate per 10,000 pt days | 2.02 | 1.89 | 1.76 | 1.59 | 1.29 |
| 2013 | 2014 | 2015 | 2016 | 2017 | |
|---|---|---|---|---|---|
| National | |||||
| No. of CA-MRSA infections | 547 | 653 | 729 | 921 | 993 |
| Rate per 1,000 pt admissions | 0.63 | 0.70 | 0.77 | 0.94 | 1.01 |
| Rate per 10,000 pt days | 0.84 | 0.96 | 1.04 | 1.28 | 1.36 |
| No. of reporting hospitals | 53 | 58 | 59 | 61 | 62 |
| West | |||||
| No. of CA-MRSA infections | 321 | 380 | 449 | 569 | 637 |
| Rate per 1,000 pt admissions | 0.89 | 0.93 | 1.06 | 1.29 | 1.44 |
| Rate per 10,000 pt days | 1.21 | 1.32 | 1.42 | 1.75 | 1.99 |
| Central | |||||
| No. of CA-MRSA infections | 205 | 241 | 245 | 322 | 324 |
| Rate per 1,000 pt admissions | 0.50 | 0.57 | 0.59 | 0.75 | 0.74 |
| Rate per 10,000 pt days | 0.69 | 0.81 | 0.83 | 1.07 | 1.02 |
| East | |||||
| No. of CA-MRSA infections | 21 | 32 | 35 | 30 | 32 |
| Rate per 1,000 pt admissions | 0.21 | 0.32 | 0.35 | 0.29 | 0.31 |
| Rate per 10,000 pt days | 0.23 | 0.34 | 0.39 | 0.32 | 0.35 |
| 2013 | 2014 | 2015 | 2016 | 2017 | |
|---|---|---|---|---|---|
| National | |||||
| No. of MRSA-BSI | 365 | 450 | 490 | 605 | 608 |
| Rate per 1,000 pt admissions | 0.42 | 0.48 | 0.52 | 0.62 | 0.62 |
| Rate per 10,000 pt days | 0.56 | 0.66 | 0.70 | 0.84 | 0.83 |
| No. of reporting hospitals | 53 | 58 | 59 | 61 | 62 |
| West | |||||
| No. of MRSA-BSI | 131 | 166 | 215 | 278 | 282 |
| Rate per 1,000 pt admissions | 0.36 | 0.41 | 0.51 | 0.63 | 0.64 |
| Rate per 10,000 pt days | 0.50 | 0.58 | 0.68 | 0.85 | 0.88 |
| Central | |||||
| No. of MRSA-BSI | 191 | 240 | 224 | 281 | 278 |
| Rate per 1,000 pt admissions | 0.46 | 0.57 | 0.54 | 0.65 | 0.63 |
| Rate per 10,000 pt days | 0.64 | 0.80 | 0.76 | 0.93 | 0.88 |
| East | |||||
| No. of MRSA-BSI | 43 | 44 | 51 | 46 | 48 |
| Rate per 1,000 pt admissions | 0.44 | 0.44 | 0.52 | 0.44 | 0.46 |
| Rate per 10,000 pt days | 0.48 | 0.47 | 0.57 | 0.49 | 0.52 |
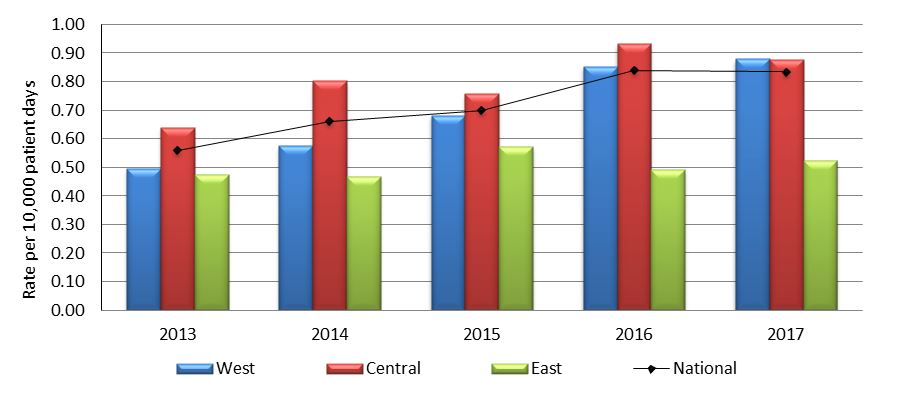
Figure 2.2 - Text description
| Year | Region | Rate |
|---|---|---|
| 2013 | West | 0.50 |
| 2013 | Central | 0.64 |
| 2013 | East | 0.48 |
| 2013 | National | 0.56 |
| 2014 | West | 0.58 |
| 2014 | Central | 0.80 |
| 2014 | East | 0.47 |
| 2014 | National | 0.66 |
| 2015 | West | 0.68 |
| 2015 | Central | 0.76 |
| 2015 | East | 0.57 |
| 2015 | National | 0.70 |
| 2016 | West | 0.85 |
| 2016 | Central | 0.93 |
| 2016 | East | 0.49 |
| 2016 | National | 0.84 |
| 2017 | West | 0.88 |
| 2017 | Central | 0.88 |
| 2017 | East | 0.52 |
| 2017 | National | 0.83 |
| Year | Number of deathsFootnote 11 | All-cause mortality rate per 100 MRSA-BSI cases |
|---|---|---|
| 2013 | 93 | 25.5 |
| 2014 | 103 | 24.4 |
| 2015 | 95 | 20.3 |
| 2016 | 111 | 19.0 |
| 2017 | 99 | 16.3 |
| Strain Type | 2013 | 2014 | 2015 | 2016 | 2017 |
|---|---|---|---|---|---|
| No. (%) | No. (%) | No. (%) | No. (%) | No. (%) | |
| CMRSA 10 | 214 (36.5) | 266 (38.7) | 303 (42.3) | 408 (46.2) | 398 (45.2) |
| CMRSA 2 | 278 (47.4) | 302 (43.9) | 266 (37.2) | 279 (31.6) | 284 (32.3) |
| CMRSA 7 | 24 (4.1) | 41 (6.0) | 48 (6.7) | 72 (8.1) | 68 (7.7) |
| Other strain typesFootnote 13 | 65 (11.1) | 70 (10.2) | 76 (10.6) | 92 (10.4) | 88 (10.0) |
| Unassigned | 6 (1.0) | 9 (1.3) | 23 (3.2) | 33 (3.7) | 42 (4.8) |
| Total | 587 | 688 | 716 | 884 | 880 |
MRSA non-blood isolates (urine, respiratory, wound, surgical site) are collected from January to March of every year and blood isolates are collected year round.
| Antibiotics | 2013 | 2014 | 2015 | 2016 | 2017 |
|---|---|---|---|---|---|
| No. (%) | No. (%) | No. (%) | No. (%) | No. (%) | |
| Erythromycin | 495 (88.7) | 535 (84.4) | 576 (80.9) | 624 (78.0) | 689 (79.8) |
| Ciprofloxacin | 479 (85.8) | 228 (84.1)Footnote 14 | 85 (81.7)Footnote 14 | 609 (76.1) | 659 (76.3) |
| Clindamycin | 349 (83.5)Footnote 15 | 374 (65.4)Footnote 15 | 385 (54.1) | 335 (41.9) | 361 (41.8) |
| Fusidic acid | 57 (10.2) | 91 (14.4) | 126 (17.7) | 148 (18.5) | 174 (20.1) |
| Mupirocin HLR | 15 (2.7) | 30 (4.7) | 40 (6.6)Footnote 16 | Not tested in 2016 | Not tested in 2017 |
| Tetracycline | 25 (4.5) | 34 (5.4) | 37 (5.2) | 54 (6.8) | 56 (6.5) |
| TMP/SMX | 25 (4.5) | 14 (2.2) | 14 (2.0) | 20 (2.5) | 12 (1.4) |
| Rifampin | 3 (0.5) | 3 (0.5) | 3 (0.4) | 10 (1.3) | 10 (1.2) |
| Tigecycline | 25 (4.5) | 17 (2.7) | 6 (0.8) | 0 (0.0) | 0 (0.0) |
| Daptomycin | 2 (0.4) | 2 (0.3) | 5 (0.7) | 5 (0.6) | 5 (0.6) |
| Total | 558 | 634 | 712 | 800 | 864 |
MRSA non-blood isolates (urine, respiratory, wound, surgical site) are collected from January to March of every year and blood isolates are collected year round.
Note: All MRSA isolates from 2013 to 2017 submitted to NML were susceptible to linezolid and vancomycin
3. Vancomycin-Resistant Enterococci (VRE)
| 2013 | 2014 | 2015 | 2016 | 2017 | |
|---|---|---|---|---|---|
| National | |||||
| No. of VRE infections | 322 | 297 | 271 | 299 | 387 |
| Rate per 1,000 pt admissions | 0.39 | 0.33 | 0.30 | 0.32 | 0.42 |
| Rate per 10,000 pt days | 0.52 | 0.45 | 0.41 | 0.43 | 0.57 |
| No. of reporting hospitals | 48 | 56 | 53 | 56 | 56 |
| West | |||||
| No. of VRE infections | 154 | 153 | 142 | 146 | 181 |
| Rate per 1,000 pt admissions | 0.52 | 0.45 | 0.40 | 0.40 | 0.51 |
| Rate per 10,000 pt days | 0.72 | 0.65 | 0.56 | 0.54 | 0.71 |
| Central | |||||
| No. of VRE infections | 161 | 143 | 127 | 145 | 201 |
| Rate per 1,000 pt admissions | 0.37 | 0.32 | 0.29 | 0.31 | 0.42 |
| Rate per 10,000 pt days | 0.51 | 0.44 | 0.41 | 0.45 | 0.61 |
| East | |||||
| No. of MRSA-BSI | 7 | 1 | 2 | 8 | 5 |
| Rate per 1,000 pt admissions | 0.08 | 0.01 | 0.02 | 0.08 | 0.05 |
| Rate per 10,000 pt days | 0.08 | 0.01 | 0.02 | 0.09 | 0.05 |
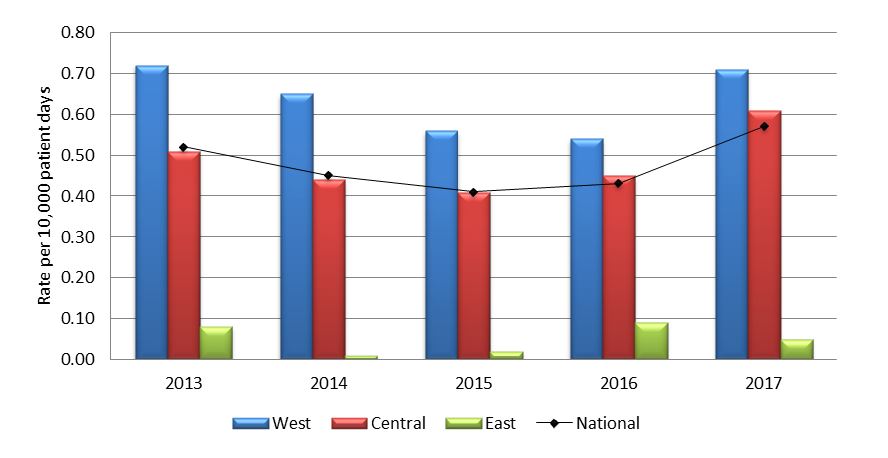
Figure 3.1 - Text description
| Year | Region | Rate |
|---|---|---|
| 2013 | West | 0.72 |
| 2013 | Central | 0.51 |
| 2013 | East | 0.08 |
| 2013 | National | 0.52 |
| 2014 | West | 0.65 |
| 2014 | Central | 0.44 |
| 2014 | East | 0.01 |
| 2014 | National | 0.45 |
| 2015 | West | 0.56 |
| 2015 | Central | 0.41 |
| 2015 | East | 0.02 |
| 2015 | National | 0.41 |
| 2016 | West | 0.54 |
| 2016 | Central | 0.45 |
| 2016 | East | 0.09 |
| 2016 | National | 0.43 |
| 2017 | West | 0.71 |
| 2017 | Central | 0.61 |
| 2017 | East | 0.05 |
| 2017 | National | 0.57 |
| 2013 | 2014 | 2015 | 2016 | 2017 | |
|---|---|---|---|---|---|
| National | |||||
| No. of VRE infections | N/A | 274 | 258 | 272 | 356 |
| Rate per 1,000 pt admissions | N/A | 0.31 | 0.29 | 0.29 | 0.38 |
| Rate per 10,000 pt days | N/A | 0.42 | 0.39 | 0.39 | 0.52 |
| No. of reporting hospitals | N/A | 56 | 53 | 56 | 56 |
| West | |||||
| No. of VRE infections | N/A | 143 | 138 | 131 | 165 |
| Rate per 1,000 pt admissions | N/A | 0.42 | 0.39 | 0.35 | 0.47 |
| Rate per 10,000 pt days | N/A | 0.61 | 0.54 | 0.48 | 0.64 |
| Central | |||||
| No. of VRE infections | N/A | 130 | 118 | 133 | 186 |
| Rate per 1,000 pt admissions | N/A | 0.29 | 0.27 | 0.28 | 0.39 |
| Rate per 10,000 pt days | N/A | 0.40 | 0.38 | 0.41 | 0.56 |
| East | |||||
| No. of MRSA-BSI | N/A | 1 | 2 | 8 | 5 |
| Rate per 1,000 pt admissions | N/A | 0.01 | 0.02 | 0.08 | 0.05 |
| Rate per 10,000 pt days | N/A | 0.01 | 0.02 | 0.09 | 0.05 |
From 2014 to 2017, 94.3% of VRE infections were reported as healthcare associated, while only 5.7% were community associated infections.
| 2013 | 2014 | 2015 | 2016 | 2017 | |
|---|---|---|---|---|---|
| National | |||||
| No. of VRE-BSI infections | 98 | 94 | 89 | 121 | 157 |
| Rate per 1,000 pt admissions | 0.12 | 0.10 | 0.10 | 0.13 | 0.17 |
| Rate per 10,000 pt days | 0.16 | 0.14 | 0.14 | 0.18 | 0.23 |
| No. of reporting hospitals | 48 | 56 | 53 | 56 | 56 |
| West | |||||
| No. of VRE-BSI infections | 31 | 36 | 35 | 45 | 48 |
| Rate per 1,000 pt admissions | 0.11 | 0.10 | 0.10 | 0.12 | 0.14 |
| Rate per 10,000 pt days | 0.15 | 0.15 | 0.14 | 0.17 | 0.19 |
| Central | |||||
| No. of VRE-BSI infections | 67 | 58 | 53 | 75 | 108 |
| Rate per 1,000 pt admissions | 0.15 | 0.13 | 0.12 | 0.16 | 0.23 |
| Rate per 10,000 pt days | 0.21 | 0.18 | 0.17 | 0.23 | 0.33 |
| East | |||||
| No. of VRE-BSI infections | 0 | 0 | 1 | 1 | 1 |
| Rate per 1,000 pt admissions | 0.00 | 0.00 | 0.01 | 0.01 | 0.01 |
| Rate per 10,000 pt days | 0.00 | 0.00 | 0.01 | 0.01 | 0.01 |
Figure 3.2 - Text description
Long description goes here
| Year | Region | Rate |
|---|---|---|
| 2013 | West | 0.15 |
| 2013 | Central | 0.21 |
| 2013 | East | 0.00 |
| 2013 | National | 0.16 |
| 2014 | West | 0.15 |
| 2014 | Central | 0.18 |
| 2014 | East | 0.00 |
| 2014 | National | 0.14 |
| 2015 | West | 0.14 |
| 2015 | Central | 0.17 |
| 2015 | East | 0.01 |
| 2015 | National | 0.14 |
| 2016 | West | 0.17 |
| 2016 | Central | 0.23 |
| 2016 | East | 0.01 |
| 2016 | National | 0.18 |
| 2017 | West | 0.19 |
| 2017 | Central | 0.33 |
| 2017 | East | 0.01 |
| 2017 | National | 0.23 |
| Isolate Type | 2013 | 2014 | 2015 | 2016 | 2017 |
|---|---|---|---|---|---|
| No. (%) | No. (%) | No. (%) | No. (%) | No. (%) | |
| vanA, Enterococcus faecium | 72 (96.0) | 70 (100.0) | 75 (100.0) | 88 (96.7) | 111 (95.7) |
| vanB, Enterococcus faecium | 3 (4.0) | 0 (0.0) | 0 (0.0) | 3 (3.3) | 5 (4.3) |
| Total | 75 | 70 | 75 | 91 | 116 |
| Sequence Type | 2013 | 2014 | 2015 | 2016 | 2017 |
|---|---|---|---|---|---|
| No. (%) | No. (%) | No. (%) | No. (%) | No. (%) | |
| ST117 | 26 (34.7) | 16 (22.9) | 13 (17.3) | 23 (25.3) | 11 (9.5) |
| ST18 | 15 (20.0) | 20 (28.6) | 11 (14.7) | 14 (15.4) | 3 (2.6) |
| ST412 | 14 (18.7) | 7 (10.0) | 12 (16.0) | 12 (13.2) | 5 (4.3) |
| ST203 | 1 (1.3) | 5 (7.1) | 6 (8.0) | 5 (5.5) | 7 (6.0) |
| ST734 | 4 (5.3) | 2 (2.9) | 13 (17.3) | 4 (4.4) | 8 (6.9) |
| OthersFootnote 18 | 13 (17.3) | 20 (28.6) | 16 (21.3) | 23 (25.3) | 10 (8.6) |
| Untypeable | 2 (2.7) | 0 | 4 (5.3) | 10 (11.0) | 72 (62.1) |
| Total | 75 | 70 | 75 | 91 | 116 |
| Antibiotics | 2013 | 2014 | 2015 | 2016 | 2017 |
|---|---|---|---|---|---|
| No. (%) | No. (%) | No. (%) | No. (%) | No. (%) | |
| Ampicillin | 75 (100) | 70 (100) | 75 (100) | 91 (100) | 116 (100) |
| Levofloxacin | 75 (100) | 70 (100) | 75 (100) | 91 (100) | 116 (100) |
| Penicillin | 75 (100) | 70 (100) | 75 (100) | 91 (100) | 116 (100) |
| VancomycinFootnote 19 | 75 (100) | 70 (100) | 74 (98.7) | 88 (96.7) | 111 (95.7) |
| HL-Gentamicin | 13 (17.3) | 7 (10.0) | 6 (8.0) | 13 (14.3) | 45 (38.8) |
| HL- Streptomycin | 28 (37.3) | 29 (41.4) | 27 (36.0) | 32 (35.2) | 39 (33.6) |
| Nitrofurantoin | 14 (18.7) | 15 (21.4) | 25 (33.3) | 35 (38.5) | 52 (44.8) |
| Chloramphenicol | 0 (0.0) | 0 (0.0) | 0 (0.0) | 2 (2.2) | 11 (9.5) |
| DaptomycinFootnote 20 | 5 (6.7) | 0 (0.0) | 0 (0.0) | 7 (7.7) | 10 (8.6) |
| Linezolid | 1 (1.3) | 0 (0.0) | 0 (0.0) | 1 (1.1) | 0 (0.0) |
| Tigecycline | 0 (0.0) | 2 (2.9) | 0 (0.0) | 0 (0.0) | 0 (0.0) |
| Total isolates tested | 75 | 70 | 75 | 91 | 116 |
4. Carbapenemase-Producing Enterobacteriaceae (CPE) and Carbapenemase-Producing Acinetobacter (CPA)
| 2013 | 2014 | 2015 | 2016 | 2017 | |
|---|---|---|---|---|---|
| National | |||||
| No. of CPE infections | 19 | 22 | 17 | 20 | 17 |
| Rate per 1,000 pt admissions | 0.02 | 0.02 | 0.02 | 0.02 | 0.02 |
| Rate per 10,000 pt days | 0.03 | 0.03 | 0.03 | 0.03 | 0.03 |
| No. of reporting hospitals | 45 | 58 | 58 | 58 | 59 |
| West | |||||
| No. of CPE infections | 9 | 10 | 10 | 6 | 11 |
| Rate per 1,000 pt admissions | 0.03 | 0.03 | 0.03 | 0.02 | 0.03 |
| Rate per 10,000 pt days | 0.05 | 0.04 | 0.03 | 0.02 | 0.04 |
| Central | |||||
| No. of CPE infections | 9 | 12 | 5 | 14 | 5 |
| Rate per 1,000 pt admissions | 0.02 | 0.03 | 0.01 | 0.03 | 0.01 |
| Rate per 10,000 pt days | 0.03 | 0.04 | 0.02 | 0.04 | 0.02 |
| East | |||||
| No. of CPE infections | 1 | 0 | 2 | 0 | 1 |
| Rate per 1,000 pt admissions | 0.01 | 0.00 | 0.02 | 0.00 | 0.01 |
| Rate per 10,000 pt days | 0.01 | 0.00 | 0.02 | 0.00 | 0.01 |
| 2013 | 2014 | 2015 | 2016 | 2017 | |
|---|---|---|---|---|---|
| National | |||||
| No. of CPE colonizations | 23 | 20 | 33 | 69 | 92 |
| Rate per 1,000 pt admissions | 0.03 | 0.02 | 0.04 | 0.07 | 0.10 |
| Rate per 10,000 pt days | 0.04 | 0.03 | 0.05 | 0.10 | 0.14 |
| No. of reporting hospitals | 45 | 58 | 58 | 58 | 59 |
| West | |||||
| No. of CPE colonizations | 12 | 2 | 9 | 15 | 18 |
| Rate per 1,000 pt admissions | 0.05 | 0.01 | 0.02 | 0.04 | 0.05 |
| Rate per 10,000 pt days | 0.06 | 0.01 | 0.03 | 0.05 | 0.07 |
| Central | |||||
| No. of CPE colonizations | 11 | 18 | 24 | 54 | 74 |
| Rate per 1,000 pt admissions | 0.03 | 0.04 | 0.06 | 0.12 | 0.16 |
| Rate per 10,000 pt days | 0.04 | 0.06 | 0.08 | 0.17 | 0.23 |
| East | |||||
| No. of CPE colonizations | 0 | 0 | 0 | 0 | 0 |
| Rate per 1,000 pt admissions | 0.00 | 0.00 | 0.00 | 0.00 | 0.00 |
| Rate per 10,000 pt days | 0.00 | 0.00 | 0.00 | 0.00 | 0.00 |
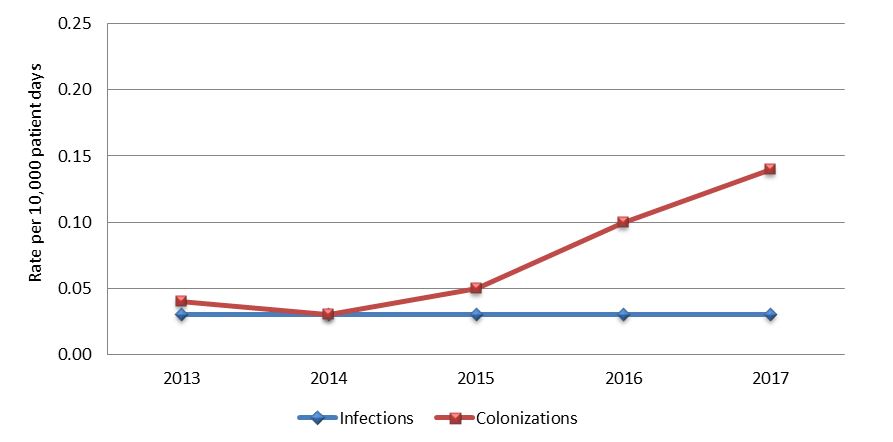
Figure 4.1 - Text description
| Year | Classification | Rate |
|---|---|---|
| 2013 | Infection | 0.03 |
| 2013 | Colonization | 0.04 |
| 2014 | Infection | 0.03 |
| 2014 | Colonization | 0.03 |
| 2015 | Infection | 0.03 |
| 2015 | Colonization | 0.05 |
| 2016 | Infection | 0.03 |
| 2016 | Colonization | 0.10 |
| 2017 | Infection | 0.03 |
| 2017 | Colonization | 0.14 |
| 2013 | 2014 | 2015 | 2016 | 2017 | |
|---|---|---|---|---|---|
| National | |||||
| No. of CPA infections | 9 | 3 | 2 | 9 | 3 |
| Rate per 1,000 pt admissions | 0.012 | 0.003 | 0.002 | 0.010 | 0.003 |
| Rate per 10,000 pt days | 0.016 | 0.005 | 0.003 | 0.013 | 0.004 |
| No. of reporting hospitals | 45 | 58 | 58 | 58 | 59 |
| West | |||||
| No. of CPA infections | 0 | 1 | 2 | 2 | 3 |
| Rate per 1,000 pt admissions | 0.000 | 0.003 | 0.005 | 0.005 | 0.008 |
| Rate per 10,000 pt days | 0.000 | 0.004 | 0.007 | 0.007 | 0.011 |
| CentralFootnote 21 | |||||
| No. of CPA infections | 9 | 2 | 0 | 7 | 0 |
| Rate per 1,000 pt admissions | 0.022 | 0.005 | 0.000 | 0.016 | 0.000 |
| Rate per 10,000 pt days | 0.030 | 0.006 | 0.000 | 0.022 | 0.000 |
| East | |||||
| No. of CPA infections | 0 | 0 | 0 | 0 | 0 |
| Rate per 1,000 pt admissions | 0.000 | 0.000 | 0.000 | 0.000 | 0.000 |
| Rate per 10,000 pt days | 0.000 | 0.000 | 0.000 | 0.000 | 0.000 |
| 2013 | 2014 | 2015 | 2016 | 2017 | |
|---|---|---|---|---|---|
| National | |||||
| No. of CPA colonizations | 17 | 0 | 3 | 5 | 7 |
| Rate per 1,000 pt admissions | 0.022 | 0.000 | 0.003 | 0.005 | 0.007 |
| Rate per 10,000 pt days | 0.029 | 0.000 | 0.004 | 0.007 | 0.010 |
| No. of reporting hospitals | 45 | 58 | 58 | 58 | 59 |
| West | |||||
| No. of CPA colonizations | 2 | 0 | 3 | 0 | 2 |
| Rate per 1,000 pt admissions | 0.008 | 0.000 | 0.008 | 0.000 | 0.005 |
| Rate per 10,000 pt days | 0.010 | 0.000 | 0.010 | 0.000 | 0.008 |
| CentralFootnote 21 | |||||
| No. of CPA colonizations | 15 | 0 | 0 | 5 | 5 |
| Rate per 1,000 pt admissions | 0.036 | 0.000 | 0.000 | 0.011 | 0.011 |
| Rate per 10,000 pt days | 0.050 | 0.000 | 0.000 | 0.016 | 0.015 |
| East | |||||
| No. of CPA colonizations | 0 | 0 | 0 | 0 | 0 |
| Rate per 1,000 pt admissions | 0.000 | 0.000 | 0.000 | 0.000 | 0.000 |
| Rate per 10,000 pt days | 0.000 | 0.000 | 0.000 | 0.000 | 0.000 |
| Year | Number of deathsFootnote 22 | All-cause mortality rate per 100 infected cases |
|---|---|---|
| 2013 | 6 | 21.4 |
| 2014 | 5 | 20.0 |
| 2015 | 4 | 22.2 |
| 2016 | 3 | 10.7 |
| 2017 | 5 | 20.8 |
| Pathogen | 2013 | 2014 | 2015 | 2016 | 2017 |
|---|---|---|---|---|---|
| No. (%) | No. (%) | No. (%) | No. (%) | No. (%) | |
| Klebsiella pneumoniae | 27 (28.4) | 27 (38.0) | 30 (35.7) | 49 (35.8) | 44 (26.7) |
| Escherichia coli | 5 (5.3) | 11( 15.5) | 22 (26.2) | 24 (17.5) | 42 (25.5) |
| Enterobacter cloacae complexFootnote 24 | 4 (4.2) | 12 (17.0) | 10 (11.9) | 23 (16.8) | 37 (22.4) |
| Acinetobacter baumannii | 37 (39.0) | 8 (11.3) | 9 (10.7) | 17 (12.4) | 14 (8.5) |
| Serratia marcescens | 11 (11.6) | 6 (8.5) | 3 (3.6) | 3 (2.2) | 3 (1.8) |
| OthersFootnote 25 | 11 (11.6) | 7 (9.9) | 10 (11.9) | 21 (15.3) | 25 (15.2) |
| Total | 95 | 71 | 84 | 137 | 165 |
| Antibiotics | 2013 | 2014 | 2015 | 2016 | 2017 |
|---|---|---|---|---|---|
| No. (%) | No. (%) | No. (%) | No. (%) | No. (%) | |
| Piperacillin-Tazobactam | 52 (91.2) | 56 (88.9) | 69 (92.0) | 91 (76.5) | 126 (96.9)Footnote 26 |
| Cefotaxime | 46 (80.1) | 56 (88.9) | 68 (90.1) | 113 (95.0) | 140 (92.7) |
| Meropenem | 53 (93.0) | 59 (93.7) | 66 (88.0) | 106 (89.1) | 139 (92.1) |
| Ceftazidime | 46 (80.1) | 56 (88.9) | 66 (88.0) | 109 (91.6) | 137 (90.7) |
| Trimethoprim-sulfamethoxazole | 39 (68.4) | 42 (66.7) | 57 (76.0) | 79 (66.4) | 94 (62.3) |
| Ciprofloxacin | 29 (50.1) | 35 (55.6) | 49 (65.3) | 75 (63.0) | 93 (61.6) |
| Tobramycin | 29 (50.9) | 40( 63.5) | 41 (54.7) | 62 (52.1) | 67 (44.4) |
| Gentamicin | 26 (45.6) | 32 (50.8) | 39 (53.4) | 51 (42.9) | 55 (36.4) |
| Amikacin | 18 (31.6) | 17 (27.0) | 23 (30.7) | 44 (37.0) | 32 (21.2) |
| Tigecycline | 10 (17.5) | 11 (17.5) | 13 (17.3) | 28 (23.5) | 18 (11.9) |
| Total no. of Isolates | 57 | 63 | 75 | 119 | 151 |
All isolates were resistant to Ampicillin, and all but one to Cefazolin. All CPO isolates were screened for the mcr-type gene which is an acquired gene associated with colistin resistance.
| Antibiotics | 2013 | 2014 | 2015 | 2016 | 2017 |
|---|---|---|---|---|---|
| No. (%) | No. (%) | No. (%) | No. (%) | No. (%) | |
| Cefotaxime | 35 (92.1) | 8 (100) | 9 (100) | 16 (88.9) | 13 (92.9) |
| Ceftazidime | 36 (94.7) | 8 (100) | 9 (100) | 16 (88.9) | 13 (92.9) |
| Ciprofloxacin | 36 (94.7) | 8 (100) | 9 (100) | 16 (88.9) | 13 (92.9) |
| Piperacillin-Tazobactam | 37 (97.4) | 8 (100) | 9 (100) | 18 (100) | 13 (92.9) |
| Meropenem | 36 (94.7) | 8 (100) | 9 (100) | 18 (100) | 12 (85.7) |
| Trimethoprim-sulfamethoxazole | 35 (92.1) | 8 (100) | 7 (77.8) | 15 (83.3) | 11 (78.6) |
| Gentamicin | 34 (89.5) | 8 (100) | 7 (77.8) | 14 (77.8) | 10 (71.4) |
| Tobramycin | 32 (84.2) | 5 (62.5) | 7 (77.8) | 12 (66.7) | 9 (64.3) |
| Tigecycline | 0 (0.0) | 0 (0.0) | 0 (0.0) | 0 (0.0) | 1 (7.1) |
| Amikacin | 5 (13.1) | 0 (0.0) | 3 (33.3) | 12 (66.7) | N/A |
| Total no. of Isolates | 38 | 8 | 9 | 18 | 14 |
All isolates were resistant to Ampicillin, Amoxicillin/Clavulanic Acid, Cefazolin, Cefoxitin
N/A = not available
All isolates were resistant to Ampicillin, and all but one to Cefazolin. All CPO isolates were screened for the mcr-type gene which is an acquired gene associated with colistin resistance
| Carbapenemase | 2013 | 2014 | 2015 | 2016 | 2017 |
|---|---|---|---|---|---|
| No. (%) | No. (%) | No. (%) | No. (%) | No. (%) | |
| KPC | 30 (52.6) | 31 (49.2) | 26 (34.7) | 62 (52.1) | 69 (45.7) |
| NDM | 14 (24.6) | 17 (27.0) | 29 (38.7) | 38 (31.9) | 55 (36.4) |
| OXA-48 | 6 (10.5) | 7 (11.1) | 14 (18.7) | 17 (14.3) | 23 (15.2) |
| NMC/IMI | 1 (1.8) | 2 (3.2) | 0 (0.0) | 2 (1.6) | 4 (2.6) |
| VIM | 0 (0.0) | 1 (1.6) | 1 (1.3) | 1 (0.8) | 3 (2.0) |
| SME Footnote 29 | 6 (10.5) | 5 (7.9) | 3 (4.0) | 1 (0.8) | 2 (1.3) |
| GES-5 | 1 (1.8) | 1 (1.6) | 3 (4.0) | 0 (0.0) | 0 (0.0) |
| IMP | 0 (0.0) | 1 (1.6) | 0 (0.0) | 0 (0.0) | 0 (0.0) |
| Total no. of Isolates | 57Footnote 30 | 63Footnote 30 | 75Footnote 30 | 119Footnote 30 | 151Footnote 30 |
| Carbapenemase | 2013 | 2014 | 2015 | 2016 | 2017 |
|---|---|---|---|---|---|
| No. (%) | No. (%) | No. (%) | No. (%) | No. (%) | |
| OXA-23 | 5 (13.2) | 5 (62.5) | 8 (88.9) | 6 (33.3) | 11 (78.6) |
| NDM | 0 (0.0) | 0 (0.0) | 1 (11.1) | 0 (0.0) | 2 (14.3) |
| OXA-24 | 4 (10.5) | 0 (0.0) | 0 (0.0) | 3 (16.7) | 1 (7.1) |
| OXA-235 | 0 (0.0) | 0 (0.0) | 0 (0.0) | 9 (50.0) | 0 (0.0) |
| OXA-58 | 0 (0.0) | 0 (0.0) | 1(11.1) | 0 (0.0) | 0 (0.0) |
| OXA-237 | 29 (76.3) | 3 (37.5) | 0 (0.0) | 0 (0.0) | 0 (0.0) |
| IMP | 0 (0.0) | 0 (0.0) | 0 (0.0) | 0 (0.0) | 0 (0.0) |
| Total no. of Isolates | 38 | 8 | 9Footnote 31 | 18 | 14 |
5. Escherichia coli Antibiogram (E. coli)
| National | ||||
|---|---|---|---|---|
| All patient and specimen typesFootnote 32 | 2015Footnote 33 | 2016 | ||
| Antibiotics | No.isolates tested (N) |
% non-susceptible | No. isolates tested (N) |
% non-susceptible |
| Penicillins and Penicillin combinations | ||||
| Ampicillin | 66,756 | 43.7 | 47,411 | 43.6 |
| Amoxicillin/Clavulanate | 56,200 | 16.8 | 40,174 | 16.5 |
| Piperacillin-tazobactam | 59,085 | 5.3 | 45,177 | 4.7 |
| Cephalosporins | ||||
| Cephalothin | N/A | 17,504 | 46.9 | |
| Cefazolin (for systemic use) | 40,291 | 19.1 | 23,048 | 25.2 |
| Cefazolin (marker for oral use) | N/A | 19,300 | 22.7 | |
| Cefuroxime | N/A | 496 | 7.0 | |
| Cefoxitin | N/A | 26,162 | 9.4 | |
| Ceftriaxone | 57,215 | 8.5 | 40,269 | 8.9 |
| Cefotaxime (Pediatric) | N/A | 1,205 | 9.6 | |
| Carbapenems | ||||
| Ertapenem | N/A | 34,088 | 0.4 | |
| Imipenem | N/A | 28,845 | 0.2 | |
| Meropenem | 44,299 | 0.5 | 37,212 | 0.1 |
| Fluoroquinolones | ||||
| Ciprofloxacin | 64,548 | 18.4 | 47,404 | 18.6 |
| Levofloxacin | N/A | 10,550 | 19.4 | |
| Aminoglycosides | ||||
| Gentamicin | 51,714 | 7.7 | 47,419 | 7.9 |
| Tobramycin | 40,654 | 7.4 | 44,102 | 8.9 |
| Amikacin | N/A | 34,679 | 0.1 | |
| Other | ||||
| TMP-SMX | 66,760 | 22.3 | 43,884 | 22.8 |
| Nitrofurantoin | 62,020 | 4.9 | 35,820 | 2.8 |
| No. hospitalsFootnote 34 | 21 | 42 | ||
N/A Data not collected in 2015
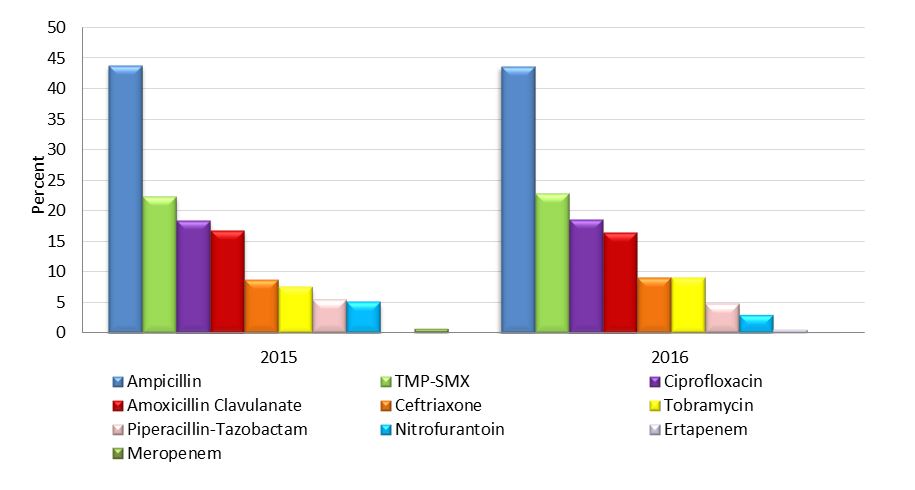
Figure 5.1 - Text description
| 2015 | 2016 | |
|---|---|---|
| Antibiotic | % Non-susceptible E.coli isolates |
% Non-susceptible E.coli isolates |
| Ampicillin | 43.7 | 43.6 |
| TMP-SMX | 22.3 | 22.8 |
| Ciprofloxacin | 18.4 | 18.6 |
| Amoxicillin Clavulanate | 16.8 | 16.5 |
| Ceftriaxone | 8.5 | 8.9 |
| Tobramycin | 7.4 | 8.9 |
| Piperacillin-Tazobactam | 5.3 | 4.7 |
| Nitrofurantoin | 4.9 | 2.8 |
| Ertapenem | 0 | 0.4 |
| Meropenem | 0.5 | 0.1 |
6. Antimicrobial Use (AMU)
| 2014Footnote 36 | 2015 | 2016 | |
|---|---|---|---|
| National | |||
| DDDs | 1,681,652 | 1,680,080 | 1,925,259 |
| DDDs per 1,000 patient days | 534 | 482 | 555 |
| No.of reporting hospitals | 21 | 21 | 22 |
| West | |||
| DDDs | 631,443 | 692,567 | 726,943 |
| DDDs per 1,000 patient days | 570 | 492 | 594 |
| No. of reporting hospitals | 5 | 7 | 6 |
| Central | |||
| DDDs | 852,196 | 809,677 | 1,020,994 |
| DDDs per 1,000 patient days | 587 | 567 | 682 |
| No. of reporting hospitals | 12 | 11 | 13 |
| East | |||
| DDDs | 198,013 | 177,835 | 177,322 |
| DDDs per 1,000 patient days | 453 | 466 | 453 |
| No. of reporting hospitals | 4 | 3 | 3 |
| ICUFootnote 37 | |||
| DDDs | 196,371 | 208,147 | 215,543 |
| DDDs per 1,000 patient days | 1282 | 1320 | 1353 |
| No. of reporting hospitals | 18 | 18 | 19 |
| Non-ICUsFootnote 37 | |||
| DDDs | 1,485,281 | 1,471,930 | 1,597,835 |
| DDDs per 1,000 patient days | 496 | 442 | 514 |
| No.of reporting hospitals | 21 | 21 | 21 |
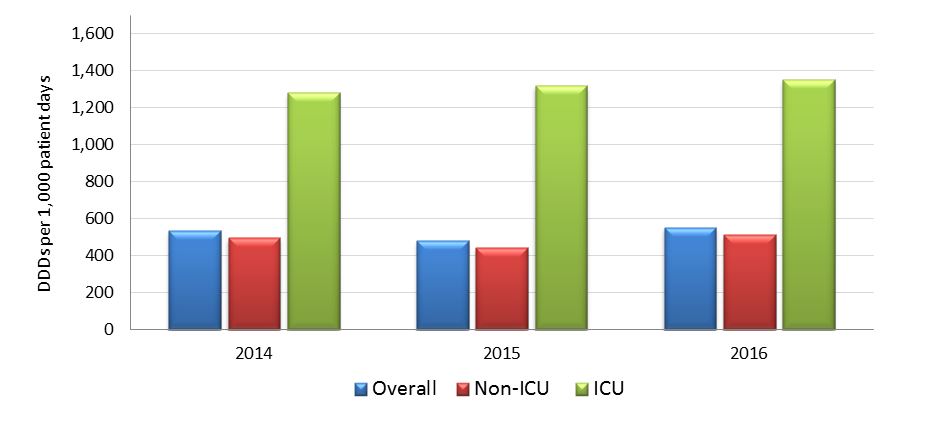
Figure 6.1 - Text description
| DDD's per 1,000 patient days | 2014 | 2015 | 2016 |
|---|---|---|---|
| Overall | 534 | 482 | 555 |
| Non-ICU | 496 | 442 | 514 |
| ICU | 1282 | 1320 | 1353 |
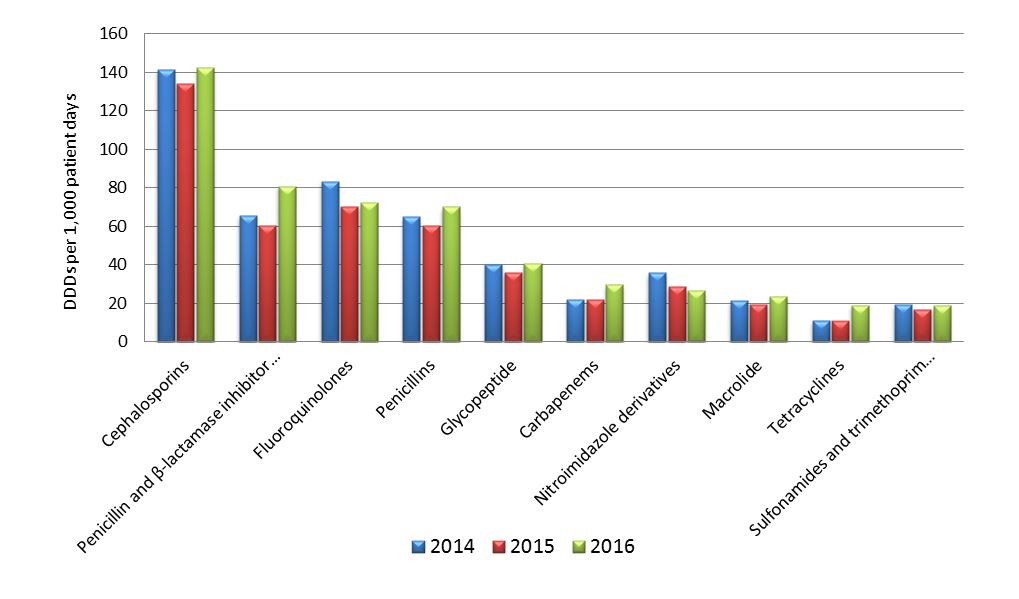
Figure 6.2 - Text description
| Antibiotic class | 2014 DDDs | 2015 DDDs | 2016 DDDs | 2014 patient days |
2015 patient days |
2016 patient days |
2014 rates | 2015 rates | 2016 rates |
|---|---|---|---|---|---|---|---|---|---|
| Cephalosporins | 446084 | 466860 | 494387 | 3149830 | 3485875 | 3470454 | 141.62 | 133.93 | 142.46 |
| Penicillin and β -lactamase inhibitor combos |
206871 | 210913 | 280422 | 3149830 | 3485875 | 3470454 | 65.68 | 60.51 | 80.80 |
| Fluoroquinolones | 262753 | 245481 | 250603 | 3149830 | 3485875 | 3470454 | 83.42 | 70.42 | 72.21 |
| Penicillins | 204612 | 210983 | 243192 | 3149830 | 3485875 | 3470454 | 64.96 | 60.53 | 70.08 |
| Glycopeptide | 126769 | 126221 | 141992 | 3149830 | 3485875 | 3470454 | 40.25 | 36.21 | 40.91 |
| Carbapenems | 69611 | 76064 | 102828 | 3149830 | 3485875 | 3470454 | 22.10 | 21.82 | 29.63 |
| Nitroimidazole derivatives |
113109 | 99782 | 92120 | 3149830 | 3485875 | 3470454 | 35.91 | 28.62 | 26.54 |
| Macrolide | 67543 | 67149 | 82297 | 3149830 | 3485875 | 3470454 | 21.44 | 19.26 | 23.71 |
| Tetracyclines | 34891 | 37696 | 65850 | 3149830 | 3485875 | 3470454 | 11.08 | 10.81 | 18.97 |
| Sulfonamides and trimethoprim combos |
60819 | 57689 | 65196 | 3149830 | 3485875 | 3470454 | 19.31 | 16.55 | 18.79 |
Appendix A: Hospitals participating in the Canadian Nosocomial Infection Surveillance Program (CNISP), as of December 2017
Participating hospitals from the Western region
- Vancouver General Hospital, Vancouver, BC
- Richmond General Hospital, Richmond, BC
- UBC Hospital, Vancouver, BC
- Lions Gate Hospital, Vancouver, BC
- Powell River Hospital, Powell River, BC
- Sechelt Hospital, Sechelt, BC
- Squamish Hospital, Squamish, BC
- Children’s and Women’s Health Centre, Vancouver, BC
- Royal Jubilee, Victoria, BC
- Nanaimo Regional General Hospital, Nanaimo, BC
- Victoria General Hospital, Victoria, BC
- Kelowna Hospital, Kelowna, BC
- University of Northern BC, Prince George, BC
- Peter Lougheed Hospital, Calgary, AB
- Rockyview General Hospital, Calgary, AB
- Foothills Hospital, Calgary, AB
- South Health Campus, Calgary, AB
- Alberta Children’s Hospital, Calgary, AB
- University of Alberta Hospital, Edmonton, AB
- Stollery Children’s Hospital, Edmonton, AB
- Royal University Hospital, Saskatoon, SK
- St. Paul’s Hospital, Saskatoon, SK
- Regina General Hospital, Regina, SK
- Pasqua Hospital, Regina, SK
- Health Sciences Centre, Winnipeg, MB
- Children’s Hospital, Winnipeg, MB
Participating hospitals from the Central region
- Children’s Hospital of Western Ontario, London, ON
- Victoria Hospital, London, ON
- University Hospital, London, ON
- Toronto Western Hospital, Toronto, ON
- Toronto General Hospital, Toronto, ON
- Princess Margaret Hospital, Toronto, ON
- North York General Hospital, Toronto, ON
- The Hospital for Sick Children, Toronto, ON
- Mount Sinai Hospital, Toronto, ON
- Bridgepoint Active Healthcare, Toronto, ON
- Sunnybrook Health Sciences Centre, Toronto, ON
- Kingston General Hospital, Kingston, ON
- Hamilton Health Sciences Centre, McMaster, Hamilton, ON
- Hamilton Health Sciences Centre, Juravinski Site, Hamilton, ON
- Hamilton Health Sciences Centre, General Site, Hamilton, ON
- St Joseph’s Healthcare, Hamilton, ON
- The Ottawa Hospital, Civic Campus, Ottawa, ON
- The Ottawa Hospital, General Site, Ottawa, ON
- The Ottawa Hospital, Heart Institute, Ottawa, ON
- Children’s Hospital of Eastern Ontario, Ottawa, ON
- Health Sciences North, Sudbury, ON
- Jewish General Hospital, Montréal, QC
- Montréal Children’s Hospital, Montréal, QC
- Maisonneuve-Rosemont Hospital, Montréal, QC
- Montréal General Hospital, Montréal, QC
- Royal Victoria Hospital, Montréal, QC
- Montréal Neurological Hospital, Montréal, QC
- Hôtel-Dieu de Québec de CHUQ, Québec, QC
Participating hospitals from the Eastern region
- The Moncton Hospital, Moncton, NB
- Queen Elizabeth Hospital, Charlottetown, PEI
- Prince County Hospital, PEI
- QE II Health Sciences Centre, Halifax, NS
- IWK Health Centre, Halifax, NS
- Health Sciences Centre General Hospital, St. John’s, NL
- Janeway Children's Health and Rehabilitation Centre, St. John’s, NL
- St. Clare's Mercy Hospital, St. John’s, NL
- Burin Peninsula Health Centre, Burin, NL
- Carbonear General Hospital, Carbonear, NL
- Dr. G.B. Cross Memorial Hospital, Clarenville, NL
- Western Memorial Regional Hospital, NL
We gratefully acknowledge the contribution of the physicians, epidemiologists, infection control practitioners and laboratory staff at each participating hospital and the Public Health Agency staff within the Centre for Communicable Diseases and Infection Control and the National Microbiology Laboratory, Winnipeg.
Appendix B: Summary of hospitals participating in CNISP, 2017
| Region | Western | Central | Eastern | National |
| Total number of hospitals | 26 | 28 | 12 | 66 |
| By hospital type | ||||
|---|---|---|---|---|
| AdultFootnote 44 | 11 | 17 | 4 | 32 |
| Mixed | 12 | 7 | 7 | 26 |
| Pediatric | 3 | 4 | 1 | 8 |
| By hospital size | ||||
| Small (1-200 beds) | 7 | 6 | 5 | 18 |
| Medium (201-499 beds) | 13 | 16 | 6 | 35 |
| Large (500+ beds) | 6 | 6 | 1 | 13 |
| Total number of beds | 8,840 | 9,610 | 3,097 | 21,547 |
| Total number of admissions | 452,390 | 475,375 | 103,644 | 1,031,409 |
| Total number of patient days | 3,261,626 | 3,460,831 | 914,818 | 7,637,275 |
Surveillance of HAIs at participating hospitals is considered to be within the mandate of hospital infection prevention and control programs and does not constitute human research. The ability for a hospital to participate in CNISP HAI surveillance is based on funding, the site capacity for data collection, access to hospital laboratory services and their operational capacity to participate in a given year. Therefore, the variation in the number of reporting hospitals each year reflects the changes in the number of participating hospitals, which has generally increased over time.
Appendix C: 2017 Surveillance Case Definitions and Eligibility Criteria
1. Clostridioides difficile Infection (CDI)
A “primary” episode of CDI is defined as either the first episode of CDI ever experienced by the patient or a new episode of CDI which occurs greater than eight (8) weeks after the diagnosis of a previous episode in the same patient.
A patient is identified as having CDI if:
- the patient has diarrhea* or fever, abdominal pain and/or ileus AND a laboratory confirmation of a positive toxin assay or positive polymerase chain reaction (PCR) for C.difficile (without reasonable evidence of another cause of diarrhea)
OR
- the patient has a diagnosis of pseudomembranes on sigmoidoscopy or colonoscopy (or after colectomy) or histological/pathological diagnosis of CDI
OR
- the patient is diagnosed with toxic megacolon (in adult patients only)
*Diarrhea is defined as one of the following:
- 6 or more watery/unformed stools in a 36-hour period
- 3 or more watery/ unformed stools in a 24-hour period and this is new or unusual for the patient (in adult patients only)
Exclusion
- Any patients age less than 1 year.
- Any pediatric patients (aged 1 year to less than 18 years) with alternate cause of diarrhea found (i.e. rotavirus, norovirus, enema or medication etc.) are excluded even if C. difficile diagnostic test result is positive.
Please note that starting in 2017, we will no longer accept an asymptomatic case identified only by a laboratory confirmation of a positive toxin assay or PCR for C. difficile. (i.e., a patient must have diarrhea or fever, abdominal pain and/or ileus AND a laboratory confirmation of a positive toxin assay or PCR for C. difficile to be identified as having CDI).
CDI case classification
Once a patient has been identified with CDI, the infection will be classified further based on the following criteriaFootnote 45 and the best clinical judgment of the healthcare and/or infection prevention and control practitioner (ICP).
Healthcare associated (from CNISP reporting hospitals only) CDI case definition
- Related to the current hospitalization
- The patient’s CDI symptoms occur in your healthcare facility 3 or more days (or ≥72 hours) after admission.
- Related to a previous hospitalization
- Inpatient: The patient’s CDI symptoms occur less than 3 days after the current admission (or <72 hours) AND the patient had been previously hospitalized at your healthcare facility and discharged within the previous 4 weeks.
- Outpatient: The patient presents with CDI symptoms at your ER or outpatient locationFootnote 46 AND the patient had been previously hospitalized at your healthcare facility and discharged within the previous 4 weeks.
- Related to a previous healthcare exposureFootnote 47 at your facility
- Inpatient: The patient’s CDI symptoms occur less than 3 days after the current admission (or <72 hours) AND the patient had a previous healthcare exposure Footnote 47 at your facility within the previous 4 weeks.
- Outpatient: The patient presents with CDI symptoms at your ER or outpatient locationFootnote 46 AND the patient had a previous healthcare exposure Footnote 47 at your facility within the previous 4 weeks.
Community associated CDI case definition
- Inpatient: The patient’s CDI symptoms occur less than 3 days (or <72 hours) after admission, with no history of hospitalization or any other healthcare exposureFootnote 47 within the previous 12 weeks.
- Outpatient: The patient presents with CDI symptoms at your ER or outpatient location with no history of hospitalization or any other healthcare exposure Footnote 47within the previous 12 weeks.
2. Methicillin-Resistant Staphylococcus aureus (MRSA)
MRSA surveillance inclusion criteria
MRSA case definition:
- isolation of Staphylococcus aureus from any body site
AND
- resistance of isolate to oxacillin
AND
- patient must be admitted to the hospitalFootnote 48
AND
- is a "newly identified MRSA case" at a CNISP hospital at the time of hospital admission or identified during hospitalization.
This includes:
- MRSA infections identified for the first time during this hospital admission
- Infections that have been previously identified at other non-CNISP hospitals (since we want newly identified MRSA cases at CNISP hospitals)
- Infections that have already been identified at your site but are new infections. This can only be identified if the previously identified case has another strain. This means the person was exposed again to MRSA and acquired another strain of it from another source (a new patient identifier is assigned only if confirmed with a different strain type)
- MRSA infection identified at a new (different) site in a patient with a MRSA infection identified in a previous surveillance (calendar) yearFootnote 49
AND
- meets the criteria for MRSA infection as determined using the January 2017 CDC/NHSN surveillance definitionsFootnote 50 for specific infections, and in accordance with the best judgment of the healthcare and/or IPC practitioner.
MRSA surveillance exclusion criteria:
- MRSA infections previously identified at other CNISP sites
- Emergency, clinic, or other outpatient cases who are not admitted to the hospital.
- Infections re-admitted with MRSA (unless it is a different strain or a new/different site of MRSA infection).
Healthcare associated (HA) case definition:
Healthcare associated is defined as an inpatient who meets the following criteria and in accordance with the best clinical judgement of the healthcare and/or infection prevention and control practitioner (IPC):
- Exposure to any healthcare setting (including long-term care facilities or clinics) in the previous 12 monthsFootnote 51
OR
- Patient is on calendar day 3Footnote 52 of their hospitalization
Community associated case definition:
- MRSA identified on admission to hospital (Calendar Day 1 = day of hospital admission) and/or the day after admission (day 2).
AND
- Has no previous history of the organism.
AND
- Has no prior hospital, long-term care admission or other exposure to a healthcare setting (rehab, clinics)Footnote 52 in the past 12 monthsFootnote 49 .
AND
- Has no reported use of medical devices.
MRSA clinical infection
MRSA infection is determined using the 2016 CDC/NHSN surveillance definitions for specific infections (PDF: 960 KB), and in accordance with the best judgment of the healthcare and/or IPC practitioner.
The MRSA infection would be considered HA if all elements of a CDC/NHSN site-specific infection criterion were present on or after the 3rd calendar day of admission to the facility (the day of hospital admission is calendar day 1). The MRSA infection would be considered CA if all elements of a CDC/NHSN site-specific infection criterion were present during the two calendar days before the day of admission, the first day of admission (day 1) and/or the day after admission (day 2) and are documented in the medical record.
MRSA Bloodstream infection (bacteremia)
To be considered a MRSA bloodstream infection the patient must have MRSA cultured (lab-confirmed) from at least one blood culture
3. Vancomycin-Resistant Enterococci (VRE)
VRE infection case definition:
- Isolation of Enterococcus faecalis or faecium
AND
- Vancomycin MIC ≥ 8 μg/ml
AND
- Patient is admitted to the hospital
AND
- Is a "newly” identified VRE-infection at a CNISP facility at the time of hospital admission or identified during hospitalization
VRE infection is determined using the January 2017 Centers for Disease Control and Prevention (CDC) National Healthcare Safety Network (NHSN) definitions/criteria for infections, and in accordance with the best judgment of the ICP. These criteria should be met at the time of the culture that yielded VRE, or within 72 hours of the culture.
CDC/NHSN Surveillance Definitions for Specific Types of Infections (PDF: 960 KB)
Exclusion criteria:
- Previously identified at other CNISP sites (to avoid duplicate reporting to CNISP)
- Identified through emergency, clinic, or other outpatient areas
- Re-admitted with VRE (UNLESS it is a different strain)
Healthcare associated is defined as an inpatient who meets the following criteria and in accordance with the best clinical judgement of the healthcare and/or infection prevention and control practitioner (IPC):
- Exposure to any healthcare setting (including long-term care facilities or clinics) in the previous 12 monthsFootnote 53
OR
- Patient is on calendar day 3Footnote 54 of their hospitalization
4. Carbapenemase-Producing Enterobacteriaceae (CPE) and Carbapenem-Producing Acinetobacter (CPA)
Any patient admitted to a participating CNISP hospital with a hospital laboratory confirmation (and subsequent confirmation by the NML) that tested/screened positive for a least one potential carbapenem-reduced susceptible Enterobacteriaceae and Acinetobacter spp., from any body site that meets the following CLSI criteria.Footnote 55
4.1 CLSI criteria for both Enterobacteriacae and Acinetobacter
| At least ONE of the following: |
Enterobacteriaceae: | |
|---|---|---|
| MIC (μg/ml) |
Disk diffusion (mm) |
|
| Imipenem | ≥ 4 | ≤ 19 |
| Meropenem | ≥ 4 | ≤ 19 |
| Doripenem | ≥ 4 | ≤ 19 |
| Ertapenem | ≥ 2 | ≤ 18 |
Disk diffusion is using a 10 µg disk of the appropriate antimicrobial
| At least ONE of the following: |
Acinetobacter: | |
|---|---|---|
| MIC (μg/ml) |
Disk diffusion (mm) |
|
| Imipenem | ≥ 8 | ≤ 18 |
| Meropenem | ≥ 8 | ≤ 14 |
| Doripenem | ≥ 8 | ≤ 14 |
Carbapenems are a class of beta-lactam antibiotics with broad-spectrum activity recommended as first-line therapy for severe infections caused by certain gram negative organisms and as directed therapy for organisms that are resistant to narrower spectrum antibiotics.
Carbapenem resistance can be due to changes in the permeability of the organism to the antibiotic and/or the up-regulation of efflux systems that “pump” the antibiotic out of the cell, usually concomitant with the presence of an acquired extended-spectrum beta-lactamase (ESBL) or AmpC enzyme or the hyperproduction of intrinsic chromosomally –located beta-lactamase(s). More recently, resistance is increasingly due to the acquisition of enzymes that break down the carbapenems: carbapenemases (e.g. NDM-1, OXA-48, KPC, VIM, IMP etc). These latter subsets of carbapenem-resistant organisms are called carbapenemase-producing organisms (CPOs) and are of particular concern because of their ability to transfer resistance easily across different genera and species of bacteria. They are quickly becoming a public health problem not only because of the ability to cause healthcare acquired infections which have limited treatment options, but because of the potential for colonizing both inpatient and outpatient populations due to their ease of transmissibility, thus, creating a reservoir of bacterial resistance.
The data presented in this report include Enterobacteriaceae spp. and Acinetobacter spp. that are resistant to carbapenems through the production of a carbapenemase. The first positive isolate from an inpatient identified as colonized or infected with CPE or CPA is eligible. Subsequent positive isolates from the same patient in the same calendar year are eligible only if the patient tests positive for a different carbapenemase. If the patient was initially colonized and subsequently develops an infection with the same gene, within the same calendar year, only the infection is eligible for inclusion in surveillance. Data from previous years included in this report have been adjusted to reflect this change in reporting.
5. Escherichia coli (E. coli) Antibiogram
Eligibility to participate
- Hospitals that are part of the CNISP network or affiliated with a CNISP site (and hence contributing to that institution’s annual antibiogram data)
- Able to submit annual antibiogram data for the target organism E.coli (non-screening specimen isolates)
- Able to indicate whether the antibiogram data is from one of the following categories:
- Inpatient and outpatient combined, i.e., inpatients and patients seen at hospital clinics or emergency department who might or might not have been admitted
- Inpatient only
- Outpatient only
- Able to indicate antibiogram data specimen type is ‘all specimen types’ or ‘all urine’
Inclusion criteria
- All E. coli bacterial isolates (non-screening specimen isolates with duplicates removed) included in the annual antibiogram data.
- A minimum of 30 isolates per reported antibiotic are required in order to submit antibiogram data.
6. Antimicrobial Use (AMU)
Participating hospitals provide total adult inpatient hospital antimicrobial usage, separated by ward or ward category. Adult AMU data are collected in defined daily doses (DDDs). Hospitals additionally provide patient-day denominator data broken down by ward categories.
Inclusion criteria:
- Acute adult in-patient antibiotic use includes all systemic antibacterials (J01), metronidazole oral (ATC code: P01AB01) and vancomycin oral (ATC code: A07AA10).
- Only antibiotic use by medical, surgical, combined (medical/surgical), ICU or other wards that are comprised of inpatients are included.
Collected variables for adult inpatient AMU:
- Generic (drug name) – according to the inclusion criteria
- Dose form or route (parenteral, oral or inhalation)
- Total DDD or DDD Units (i.e. grams, milligrams or million units)
- Days of Therapy (DOTs) if possible
- Program, ward or ward category
Calculation of defined daily doses:
For adult AMU, national, regional, and ward-specific DDD quantities were calculated by antibiotic and antibiotic class. Total antibiotic use was calculated. Standardized rates per 1,000 patient days were calculated. Where DDD were not provided by the hospital site, WHO ATC/DDD Index 2016 was used to convert grams to DDD equivalents.
The following antimicrobials are special cases:
- For co-trimoxazole (J01EE01), also known as sulfamethoxazole-trimethoprim, 1.6 g per DDD was used for conversion based on Health Canada Drug Product Database (WHO does not provide DDD conversion).
- For benzylpenicillin (J01ECE01), also known as penicillin G, and benzathine benzylpenicillin (J01CE08), data received in million units (MU) was converted to grams (where 0.6 g = 1 MU), before conversion to DDDs using WHO values.
Appendix D: Antibiotics included in antibiotic class categoriesFootnote 56Footnote 57
| Cephalosporins | Penicillin and β-lactamase inhibitor combos | Fluoroquinolones | Penicillins | Glycopeptides |
|---|---|---|---|---|
| Cefaclor | Amoxicillin and clavulanic acid | Ciprofloxacin | Amoxicillin | Vancomycin |
| Cefadroxil | Amoxicillin and other enzyme inhibitor | Levofloxacin | Ampicillin | |
| Cefazolin | Ampicillin and enzyme inhibitor | Moxifloxacin | Ampicillin, combinations | |
| Cefixime | Piperacillin and enzyme inhibitor | Norfloxacin | Cloxacillin | |
| Cefotaxime | Piperacillin and tazobactam | Ofloxacin | Penicillin g | |
| Cefotetan | Ticarcillin and clavulanic acid | Penicillin v | ||
| Cefoxitin | Ticarcillin and enzyme inhibitor | Piperacillin | ||
| Cefprozil | Ticarcillin | |||
| Ceftazidime | ||||
| Ceftobiprole | ||||
| Ceftriaxone | ||||
| Ceftriaxone combinations | ||||
| Cefuroxime | ||||
| Cephalexin |
| Carbapenems | Nitroimidazole derivatives | Macrolides | Tetracyclines | Sulfonamides and trimethoprim combos |
|---|---|---|---|---|
| Doripenem | Metronidazole | Azithromycin | Combinations of tetracyclines | Sulfadiazine and tetroxoprim |
| Ertapenem | Clarithromycin | Demeclocycline | Sulfadiazine and trimethoprim | |
| Imipenem | Erythromycin | Doxycycline | Sulfadimidine and trimethoprim | |
| Imipenem and cilastatin | Erythromycin ethylsuccinate | Minocycline | Sulfamerazine and trimethoprim | |
| Meropenem | Tetracycline | Sulfamethoxazole and trimethoprim | ||
| Tigecycline | Sulfametrole and trimethoprim | |||
| Sulfamoxole and trimethoprim |
Footnotes
- Footnote 1
-
HA-CDI from CNISP reporting hospitals only: includes all cases identified and have been acquired only within a CNISP hospital as per the case definition in Appendix C.
- Footnote 2
-
Proportion calculated from hospitals that reported both HA- and CA-CDI cases.
- Footnote 3
-
Data collected during March and April, 2013 to 2017
- Footnote 4
-
Deaths where CDI was the direct cause of death or contributed to death 30 days after the date of the first positive lab specimen or positive histopathology specimen. Mortality data are collected during the two-month period (March and April of each year) for adults (age 18 years and older) and year-round for children (age 1 year to less than 18 years old). Among pediatric patients, there was no death attributable to HA-CDI.
- Footnote 5
-
CDI isolates are collected for typing during the two-month period (March and April of each year) for adults (age 18 years and older) and year-round for children (age 1 year to less than 18 years old from admitted patients only).
- Footnote 6
-
Other NAP strain types include NAP2, NAP3, NAP5, NAP6, NAP7, NAP8, NAP9, NAP10 and NAP12.
- Footnote 7
-
CA-CDI includes all cases identified among admitted patients within a CNISP hospital as per the case definition in Appendix C.
- Footnote 8
-
Includes infections identified from blood AND clinical isolates as well as healthcare and community associated cases identified in admitted patients.
- Footnote 9
-
HA-MRSA: includes all cases identified and have been acquired within CNISP hospitals and/or from any other healthcare exposure (non-CNISP hospitals, clinics, long-term care facility, etc.) as per the case definition in Appendix C.
- Footnote 10
-
CA-MRSA includes cases identified on admission to hospital with no previous history of MRSA and no prior hospital, long-term care admission or other exposure to a healthcare setting (rehab, clinics) in the past 12 months and no reported use of medical devices as per the case definition in Appendix C.
- Footnote 11
-
All-cause mortality rate based on the number of cases with associated 30-day outcome data.
- Footnote 12
-
MRSA non-blood isolates (urine, respiratory, wound, surgical site) are collected from January to March of every year and blood isolates are collected year round.
- Footnote 13
-
Other strain types from 2013 to 2017 include CMRSA 1, CMRSA 3/6, CMRSA 4, CMRSA 5, CMRSA 8, ST72, ST88, ST97, ST398, ST772, USA 700, USA 1000, USA 1100 and European.
- Footnote 14
-
Total # isolates tested for Ciprofloxacin= 271 (2014) 104 (2015)
- Footnote 15
-
Total # isolates tested for clindamycin = 418 (2013), 572 (2014)
- Footnote 16
-
Total # isolates tested for Mupirocin HLR = 608 (2015)
- Footnote 17
-
Healthcare associated VRE: includes all cases identified and have been acquired within CNISP hospitals and/or from any other healthcare exposure (non-CNISP hospitals, clinics, long-term care facility, etc.) as per the case definition in Appendix C.
- Footnote 18
-
Others include ST16, ST17, ST78, ST80, ST154, ST252, ST262, ST282, ST414, ST494, ST584, ST664, ST665, ST734, ST736, ST772, ST787, ST835, ST836, ST912, ST982, ST983, ST984, ST992, ST1032, ST1112, ST1113, ST1265.
- Footnote 19
-
Some isolates were susceptible or intermediate to vancomycin, but all harboured VanA or VanB
- Footnote 20
-
Daptomycin does not have breakpoints for intermediate or resistant. Therefore, these are considered non-susceptible.
- Footnote 21
-
The greater number of cases reported in the Central region is largely attributed to one hospital in 2013 and another hospital in 2016.
- Footnote 22
-
Mortality rates are based on infected cases where outcome, classification and inpatient data are available.
- Footnote 23
-
Includes data for all isolates submitted
- Footnote 24
-
Enterobacter cloacae complex includes Enterobacter cloacae and other Enterobacter spp.excluding E. aerogenes
- Footnote 25
-
Others includes: Acinetobacter spp., Citrobacter spp., Klebsiella oxytoca, Kluyvera cryocrescens, Morganella morganii, Providencia rettgeri, Raoutella spp.
- Footnote 26
-
The denominator for this drug was 130 as MIC values were not given in all cases due to vitek algorithms
- Footnote 27
-
Includes data for all CPA isolates submitted
- Footnote 28
-
Includes data for all CPE isolates submitted
- Footnote 29
-
Only found in Serratia marcescens
- Footnote 30
-
1 isolate in 2013, 2 isolates in 2014, 1 isolate in 2015, 2 isolates in 2016, and 5 in 2017 harboured both NDM and OXA-48
- Footnote 31
-
1 isolate in 2015 harboured OXA-58 and NDM
- Footnote 32
-
All patient types includes inpatients and outpatients, all specimen types includes urine, blood, and any other source e.g. wound, respiratory etc.
- Footnote 33
-
Antibiogram data collection was a pilot project in 2015
- Footnote 34
-
Includes hospitals that do and do not participate in CNISP
- Footnote 35
-
Includes only adult DDDs and adult patient days
- Footnote 36
-
At one site, submitted 2014 data is from fiscal year. At one site, only 9 months of data available
- Footnote 37
-
Counts that combined ICU and non-ICU units have been excluded
- Footnote 38
-
Includes only adult DDDs and adult patient days
- Footnote 39
-
Counts from hospital sites that did not separate ICU and non-ICU units have been excluded from the ICU and non-ICU ward types
- Footnote 40
-
In 2014: at one site, submitted 2014 data is from fiscal year; at one site, only 9 months of data available
- Footnote 41
-
Presented antibiotic classes represent 94–95% of annual DDDs. Antibiotic class classification is based on WHO ATC/DDD Index 2016; see Appendix D for antimicrobials included in each category
- Footnote 42
-
In 2014: at one site, submitted 2014 data is from fiscal year; at one site, only 9 months of data available
- Footnote 43
-
For glycopeptides and nitroimidazole derivatives, the antibiotic class category includes only one antibiotic (vancomycin and metronidazole, respectively)
- Footnote 44
-
Seven hospitals classified as Adult are Adult hospitals with a NICU
- Footnote 45
-
Adapted from SHEA/IDSA practice recommendations 'Strategies to Prevent Clostridium difficile Infections in Acute Care Hospitals: 2014 Update '– available at URL http://www.jstor.org/stable/10.1086/676023?origin=JSTOR-pdf
- Footnote 46
-
This includes all of your outpatient clinics (oncology [including chemotherapy or radiation], dialysis, day surgery, day hospital, transfusion clinic, interventional radiology), but may not be exhaustive.
- Footnote 47
-
Healthcare exposure: The patient had 2 or more visits at any of the following locations (oncology [ including chemotherapy or radiation], dialysis, day surgery, day hospital, transfusion clinic, interventional radiology or emergency department) OR had a single visit to the emergency department for more than or equal to 24 hours.
- Footnote 48
-
includes ER and outpatients who tested positive for MRSA and then are subsequently admitted or are admitted but still in ER awaiting a bed on a ward.
- Footnote 49
-
For example, patient identified in 2014 with a MRSA respiratory infection. Same patient admitted in 2017 and identified with SSI MRSA infection. The patient would be counted as a new infection in 2017
- Footnote 50
-
MRSA infection is determined using the 2017 CDC/NHSN surveillance definitions for specific infections, and in accordance with the best judgement of the healthcare and/or IPC practitioner. CDC/NHSN criteria for infection can be access at https://www.cdc.gov/nhsn/PDFs/pscManual/17pscNosInfDef_current.pdf.
- Footnote 51
-
Consideration should be given to the frequency and nature of exposure to a healthcare setting. For example, pediatric patients with clinic visits for otitis media, asthma, well-baby etc. in the previous 12 months may or may not be considered as HA while pediatric patients with clinic visits that involved invasive procedures or day surgery may be more likely to be considered HA.
- Footnote 52
-
Calendar day 1 is the day of hospital admission.
- Footnote 53
-
Consideration should be given to the frequency and nature of exposure to a healthcare setting. For example, pediatric patients with clinic visits for otitis media, asthma, well-baby etc. in the previous 12 months may or may not be considered as HA while pediatric patients with clinic visits that involved invasive procedures or day surgery may be more likely to be considered HA.
- Footnote 54
-
Calendar day 1 is the day of hospital admission.
- Footnote 55
-
Clinical and Laboratory Standards Institute. 2016. Performance standards for antimicrobial susceptibility testing; 25th informational supplement, M100-S27 (December 2016). Clinical and Laboratory Standards, Wayne, PA.
- Footnote 56
-
Source: WHO ATC/DDD Index 2016
- Footnote 57
-
Table only includes top ten antibiotic classes in 2016