
Trends in health inequalities in Canadian adolescents from 2002 to 2018
Download the alternative format
(PDF format, 2.8 MB, 13 pages)
Organization: Public Health Agency of Canada
Type: Publication
Date published: 2022-01-04
Related topics
Findings from the 2018 Health Behaviour of School-aged Children (HBSC) Study.
On this page
- Introduction
- Characteristics of the study sample
- Socioeconomic differences in six health domains
- Gender differences in six health domains
- Trends in prevalence and inequalities in adolescent health
- Limitations
- Conclusions
- Methods
- References
- Acknowledgements
Introduction
Social patterns in health track strongly from childhood and adolescence into adulthood (Patton et al., 2016). Therefore, trends in adolescent health inequalities between genders and socioeconomic groups may foreshadow future health inequalities in the adult population.
Despite rising wealth and greater scientific evidence of systemic differences in population health, little progress has been made globally towards the goal of reducing health inequality (Mackenbach, 2012). Data from the Health Behaviour in School-aged Children (HBSC) study show that inequalities in some domains of adolescent health have widened between socioeconomic groups in international populations (Elgar et al., 2015) and gender groups in Canadian populations (Gariépy and Elgar 2016), resembling similar trends found in adult populations (Hu et al., 2016; Mackenbach et al., 2015; Shahidi et al., 2018).
The Canadian HBSC study provides a long view of these trends on nationally representative samples of adolescents in multiple health domains. This report describes trends in socioeconomic and gender inequalities in six domains of adolescent health measured in five consecutive survey cycles (2002 to 2018):
- physical activity
- excess body weight
- frequent physical symptoms
- frequent psychological symptoms
- low life satisfaction
- fair or poor self-rated health
Characteristics of the study sample
There was a decline in two-parent households from 2002 (84.9%) to 2014 (78.0%). Although still lower than 2002, there was an increase in two-parent households noted from 2014 to 2018 (81.3%).
The prevalence of excess body weight increased from 2002 (19.7%) to 2014 (25.1%). Although still higher than 2002, there was a decrease in excess body weight noted from 2014 to 2018 (23.0%).
Across the survey years, adolescents in 2002 had the lowest prevalence of psychological symptoms, low life satisfaction, and fair or poor health with increases reported in the following survey years.
| N/A | 2002 | 2006 | 2010 | 2014 | 2018 |
|---|---|---|---|---|---|
| Girls | 53.41 |
52.92 |
50.83 |
50.63 |
51.33 |
| Boys | 46.59 |
47.06 |
49.14 |
48.87 |
46.52 |
| Family structure: Two-parent family |
84.94 |
78.93 |
77.68 |
77.98 |
81.33 |
| Family structure: One-parent family |
13.84 |
18.25 |
18.67 |
17.64 |
16.35 |
| Family structure: Other | 1.23 |
2.82 |
3.65 |
4.38 |
2.32 |
| Physically activeTable 1 Footnote a | 22.27 |
23.18 |
22.80 |
24.00 |
24.98 |
| Excess body weightTable 1 Footnote b | 19.67 |
21.39 |
21.43 |
25.05 |
23.01 |
| Two or more physical symptomsTable 1 Footnote c | 24.35 |
27.50 |
26.85 |
25.98 |
25.42 |
| Two or more psychological symptomsTable 1 Footnote d | 38.12 |
42.21 |
41.33 |
40.95 |
42.73 |
| Low life satisfactionTable 1 Footnote e | 14.32 |
14.91 |
16.93 |
17.09 |
17.86 |
| Fair or poor healthTable 1 Footnote f | 12.95 |
15.87 |
16.17 |
17.05 |
17.10 |
Socioeconomic differences in six health domains
Socioeconomic differences were found in five health domains, with adolescents at the lowest level of material deprivation (i.e., highest socioeconomic status) experiencing more physical activity, less excess body weight, fewer psychological symptoms, less low life satisfaction, and less fair or poor health as compared to adolescents at the highest level of material deprivation. The prevalence of physical symptoms did not differ between socioeconomic groups.
From 2002 to 2018, differences in health between socioeconomic groups increased in four domains - in excess body weight, physical symptoms, low life satisfaction and fair or poor health. In each case, the absolute difference in prevalence between the highest and lowest socioeconomic groups increased. However, relative differences (i.e., rate ratio for the lowest socioeconomic group compared to the highest) were found only in excess body weight. The significance of these trends is summarized in Table 2. Measures of socioeconomic status and health inequality are described in the Methods.
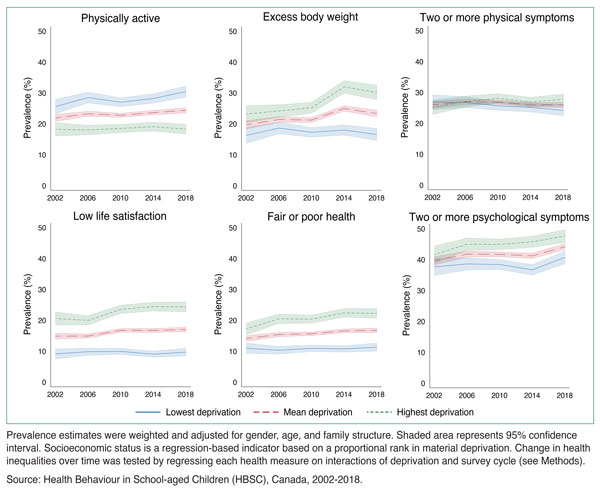
Figure 1: Text equivalent
| Deprivation | Survey cycle | Prevalence (%) | 95% confidence interval (lower limit) |
95% confidence interval (upper limit) |
|---|---|---|---|---|
| Lowest deprivation | 2002 | 25.56% | 23.17% | 27.95% |
| 2006 | 28.51% | 26.74% | 30.28% | |
| 2010 | 26.97% | 25.51% | 28.43% | |
| 2014 | 28.21% | 26.67% | 29.74% | |
| 2018 | 30.44% | 28.61% | 32.27% | |
| Mean deprivation | 2002 | 21.89% | 20.72% | 23.07% |
| 2006 | 23.25% | 22.39% | 24.11% | |
| 2010 | 22.75% | 22.02% | 23.47% | |
| 2014 | 23.64% | 22.88% | 24.40% | |
| 2018 | 24.35% | 23.46% | 25.23% | |
| Highest deprivation | 2002 | 18.23% | 16.02% | 20.44% |
| 2006 | 17.99% | 16.42% | 19.56% | |
| 2010 | 18.52% | 17.16% | 19.88% | |
| 2014 | 19.07% | 17.62% | 20.53% | |
| 2018 | 18.25% | 16.64% | 19.87% |
| Deprivation | Survey cycle | Prevalence (%) | 95% confidence interval (lower limit) |
95% confidence interval (upper limit) |
|---|---|---|---|---|
| Lowest deprivation | 2002 | 16.24% | 13.66% | 18.82% |
| 2006 | 18.64% | 16.74% | 20.54% | |
| 2010 | 17.24% | 15.66% | 18.83% | |
| 2014 | 17.99% | 16.30% | 19.68% | |
| 2018 | 16.54% | 14.53% | 18.55% | |
| Mean deprivation | 2002 | 19.69% | 18.33% | 21.06% |
| 2006 | 21.40% | 20.43% | 22.38% | |
| 2010 | 21.21% | 20.37% | 22.06% | |
| 2014 | 24.98% | 24.04% | 25.91% | |
| 2018 | 23.33% | 22.22% | 24.43% | |
| Highest deprivation | 2002 | 23.15% | 20.35% | 25.94% |
| 2006 | 24.17% | 22.12% | 26.21% | |
| 2010 | 25.19% | 23.40% | 26.98% | |
| 2014 | 31.96% | 29.93% | 33.99% | |
| 2018 | 30.12% | 27.70% | 32.53% |
| Deprivation | Survey cycle | Prevalence (%) | 95% confidence interval (lower limit) |
95% confidence interval (upper limit) |
|---|---|---|---|---|
| Lowest deprivation | 2002 | 26.81% | 24.41% | 29.22% |
| 2006 | 26.81% | 25.03% | 28.60% | |
| 2010 | 25.61% | 24.19% | 27.02% | |
| 2014 | 25.10% | 23.60% | 26.59% | |
| 2018 | 24.15% | 22.41% | 25.89% | |
| Mean deprivation | 2002 | 25.97% | 24.77% | 27.18% |
| 2006 | 26.91% | 26.02% | 27.80% | |
| 2010 | 26.85% | 26.11% | 27.59% | |
| 2014 | 25.99% | 25.22% | 26.75% | |
| 2018 | 25.94% | 25.05% | 26.83% | |
| Highest deprivation | 2002 | 25.13% | 22.80% | 27.46% |
| 2006 | 27.01% | 25.23% | 28.78% | |
| 2010 | 28.09% | 26.59% | 29.60% | |
| 2014 | 26.88% | 25.33% | 28.42% | |
| 2018 | 27.74% | 25.97% | 29.50% |
| Deprivation | Survey cycle | Prevalence (%) | 95% confidence interval (lower limit) |
95% confidence interval (upper limit) |
|---|---|---|---|---|
| Lowest deprivation | 2002 | 9.14% | 7.49% | 10.78% |
| 2006 | 9.83% | 8.62% | 11.04% | |
| 2010 | 9.94% | 8.91% | 10.96% | |
| 2014 | 9.04% | 8.02% | 10.06% | |
| 2018 | 9.70% | 8.43% | 10.97% | |
| Mean deprivation | 2002 | 14.87% | 13.87% | 15.88% |
| 2006 | 14.90% | 14.19% | 15.61% | |
| 2010 | 16.74% | 16.11% | 17.38% | |
| 2014 | 16.73% | 16.05% | 17.40% | |
| 2018 | 17.02% | 16.24% | 17.79% | |
| Highest deprivation | 2002 | 20.61% | 18.49% | 22.72% |
| 2006 | 19.97% | 18.45% | 21.48% | |
| 2010 | 23.55% | 22.19% | 24.92% | |
| 2014 | 24.42% | 22.96% | 25.87% | |
| 2018 | 24.33% | 22.70% | 25.96% |
| Deprivation | Survey cycle | Prevalence (%) | 95% confidence interval (lower limit) |
95% confidence interval (upper limit) |
|---|---|---|---|---|
| Lowest deprivation | 2002 | 10.97% | 9.29% | 12.64% |
| 2006 | 10.30% | 9.03% | 11.58% | |
| 2010 | 10.92% | 9.84% | 12.00% | |
| 2014 | 10.74% | 9.67% | 11.80% | |
| 2018 | 11.30% | 9.96% | 12.65% | |
| Mean deprivation | 2002 | 14.10% | 13.15% | 15.04% |
| 2006 | 15.39% | 14.65% | 16.12% | |
| 2010 | 15.64% | 15.02% | 16.26% | |
| 2014 | 16.57% | 15.91% | 17.23% | |
| 2018 | 16.76% | 15.99% | 17.52% | |
| Highest deprivation | 2002 | 17.22% | 15.29% | 19.16% |
| 2006 | 20.47% | 18.91% | 22.02% | |
| 2010 | 20.37% | 19.04% | 21.69% | |
| 2014 | 22.41% | 21.00% | 23.81% | |
| 2018 | 22.21% | 20.61% | 23.81% |
| Deprivation | Survey cycle | Prevalence (%) | 95% confidence interval (lower limit) |
95% confidence interval (upper limit) |
|---|---|---|---|---|
| Lowest deprivation | 2002 | 37.61% | 34.82% | 40.40% |
| 2006 | 38.57% | 36.56% | 40.58% | |
| 2010 | 38.39% | 36.75% | 40.03% | |
| 2014 | 36.66% | 34.94% | 38.38% | |
| 2018 | 40.72% | 38.64% | 42.81% | |
| Mean deprivation | 2002 | 39.59% | 38.20% | 40.98% |
| 2006 | 41.76% | 40.76% | 42.77% | |
| 2010 | 41.65% | 40.81% | 42.49% | |
| 2014 | 41.19% | 40.31% | 42.08% | |
| 2018 | 44.16% | 43.11% | 45.21% | |
| Highest deprivation | 2002 | 41.58% | 38.80% | 44.35% |
| 2006 | 44.96% | 42.93% | 46.99% | |
| 2010 | 44.91% | 43.18% | 46.63% | |
| 2014 | 45.73% | 43.90% | 47.55% | |
| 2018 | 47.60% | 45.51% | 49.69% | |
Prevalence estimates were weighted and adjusted for gender, age, and family structure. Shaded area represents 95% confidence interval. Socioeconomic status is a regression-based indicator based on a proportional rank in material deprivation. Change in health inequalities over time was tested by regressing each health measure on interactions of deprivation and survey cycle (see Methods). Source: Health Behaviour in School-aged Children (HBSC), Canada, 2002-2018. |
||||
Gender differences in six health domains
In all five survey cycles, girls reported experiencing worse health than boys in all domains, except for excess body weight which was more prevalent in boys.
From 2002 to 2018, health differences between gender groups widened in terms of physical symptoms, psychological symptoms, and low life satisfaction. Health differences between gender groups remained stable in physical activity and fair or poor health.
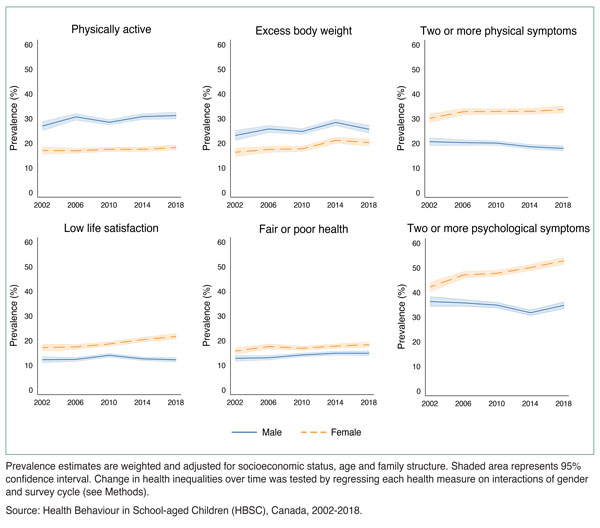
Figure 2: Text equivalent
| Gender | Year | Prevalence (%) | 95% confidence interval (lower limit) |
95% confidence interval (upper limit) |
|---|---|---|---|---|
| Male | 2002 | 26.92% | 25.03% | 28.81% |
| 2006 | 30.64% | 29.25% | 32.04% | |
| 2010 | 28.45% | 27.32% | 29.59% | |
| 2014 | 30.76% | 29.54% | 31.99% | |
| 2018 | 31.17% | 29.72% | 32.61% | |
| Female | 2002 | 17.04% | 15.54% | 18.55% |
| 2006 | 16.89% | 15.84% | 17.93% | |
| 2010 | 17.49% | 16.57% | 18.42% | |
| 2014 | 17.48% | 16.54% | 18.43% | |
| 2018 | 18.23% | 17.12% | 19.34% |
| Gender | Year | Prevalence (%) | 95% confidence interval (lower limit) |
95% confidence interval (upper limit) |
|---|---|---|---|---|
| Male | 2002 | 23.11% | 21.02% | 25.20% |
| 2006 | 25.73% | 24.23% | 27.23% | |
| 2010 | 24.72% | 23.48% | 25.96% | |
| 2014 | 28.38% | 27.00% | 29.76% | |
| 2018 | 25.62% | 23.96% | 27.27% | |
| Female | 2002 | 16.30% | 14.52% | 18.07% |
| 2006 | 17.43% | 16.17% | 18.68% | |
| 2010 | 17.66% | 16.53% | 18.78% | |
| 2014 | 21.13% | 19.87% | 22.38% | |
| 2018 | 20.24% | 18.77% | 21.71% |
| Gender | Year | Prevalence (%) | 95% confidence interval (lower limit) |
95% confidence interval (upper limit) |
|---|---|---|---|---|
| Male | 2002 | 20.64% | 18.97% | 22.30% |
| 2006 | 20.27% | 19.08% | 21.46% | |
| 2010 | 20.07% | 19.10% | 21.03% | |
| 2014 | 18.59% | 17.62% | 19.56% | |
| 2018 | 17.91% | 16.80% | 19.03% | |
| Female | 2002 | 30.09% | 28.27% | 31.92% |
| 2006 | 32.80% | 31.46% | 34.14% | |
| 2010 | 32.87% | 31.72% | 34.01% | |
| 2014 | 32.94% | 31.75% | 34.12% | |
| 2018 | 33.69% | 32.32% | 35.06% |
| Gender | Year | Prevalence (%) | 95% confidence interval (lower limit) |
95% confidence interval (upper limit) |
|---|---|---|---|---|
| Male | 2002 | 12.23% | 10.96% | 13.51% |
| 2006 | 12.34% | 11.45% | 13.24% | |
| 2010 | 14.02% | 13.22% | 14.82% | |
| 2014 | 12.57% | 11.77% | 13.38% | |
| 2018 | 12.20% | 11.28% | 13.11% | |
| Female | 2002 | 17.17% | 15.71% | 18.63% |
| 2006 | 17.42% | 16.37% | 18.47% | |
| 2010 | 18.61% | 17.65% | 19.57% | |
| 2014 | 20.34% | 19.33% | 21.36% | |
| 2018 | 21.67% | 20.50% | 22.84% |
| Gender | Year | Prevalence (%) | 95% confidence interval (lower limit) |
95% confidence interval (upper limit) |
|---|---|---|---|---|
| Male | 2002 | 12.78% | 11.56% | 14.00% |
| 2006 | 13.02% | 12.07% | 13.97% | |
| 2010 | 14.16% | 13.34% | 14.98% | |
| 2014 | 14.86% | 14.00% | 15.72% | |
| 2018 | 14.84% | 13.81% | 15.87% | |
| Female | 2002 | 15.73% | 14.40% | 17.06% |
| 2006 | 17.57% | 16.50% | 18.63% | |
| 2010 | 16.86% | 15.96% | 17.76% | |
| 2014 | 17.74% | 16.79% | 18.69% | |
| 2018 | 18.33% | 17.23% | 19.44% |
| Gender | Year | Prevalence (%) | 95% confidence interval (lower limit) |
95% confidence interval (upper limit) |
|---|---|---|---|---|
| Male | 2002 | 36.27% | 34.25% | 38.30% |
| 2006 | 35.73% | 34.29% | 37.17% | |
| 2010 | 34.81% | 33.65% | 35.98% | |
| 2014 | 31.74% | 30.55% | 32.93% | |
| 2018 | 34.73% | 33.28% | 36.18% | |
| Female | 2002 | 42.17% | 40.21% | 44.14% |
| 2006 | 47.09% | 45.67% | 48.51% | |
| 2010 | 47.74% | 46.53% | 48.96% | |
| 2014 | 50.07% | 48.80% | 51.33% | |
| 2018 | 52.80% | 51.34% | 54.27% | |
Prevalence estimates are weighted and adjusted for socioeconomic status, age and family structure. Shaded area represents 95% confidence interval. Change in health inequalities over time was tested by regressing each health measure on interactions of gender and survey cycle (see Methods). Source: Health Behaviour in School-aged Children (HBSC), Canada, 2002-2018. |
||||
Trends in prevalence and inequalities in adolescent health
From 2002 to 2018, the prevalence of ill health increased in four domains. However, the prevalence of daily physical activity rose from 22 to 25 percent. Physical activity is the only health measure that showed no change in inequality between socioeconomic and gender groups over the five survey cycles.
Differences in the prevalence of ill health between socioeconomic groups increased in four domains - excess body weight, physical symptoms, low life satisfaction, and fair or poor health. The largest change was found in excess body weight, where the difference between the highest and lowest socioeconomic groups increased from a 7-point difference in 2002 to a 14-point difference in 2018.
Gender differences in health were stable with respect to daily physical activity and fair or poor health and increased in three domains in both absolute and relative terms: physical symptoms, psychological symptoms, and low life satisfaction. In each case, girls reported poorer health than boys and those gender gaps increased over time.
A decrease in health inequality was found in excess body weight, which decreased in relative terms between gender groups. In 2002, the prevalence of excess body weight in girls was 71% the rate found in boys. In 2018, that figure decreased slightly to 69%.
| N/A | Prevalence | Socioeconomic inequality | Gender inequality | ||
|---|---|---|---|---|---|
| AbsoluteTable 2 Footnote a | RelativeTable 2 Footnote b | AbsoluteTable 2 Footnote a | RelativeTable 2 Footnote b | ||
| Physically active | (22 to 25%)Table 2 Footnote 1 | (-7 to -12)Table 2 Footnote 3 | (71 to 60%)Table 2 Footnote 3 | (-10 to -13)Table 2 Footnote 3 | (63 to 58%)Table 2 Footnote 3 |
| Excess body weight | (20 to 23%)Table 2 Footnote 1 | (7 to 14)Table 2 Footnote 1 | (142 to 182%)Table 2 Footnote 1 | (-7 to -8)Table 2 Footnote 3 | (71 to 69%)Table 2 Footnote 2 |
| Two or more physical symptoms | (24 to 25%)Table 2 Footnote 3 | (-2 to 4)Table 2 Footnote 1 | (94 to 114%)Table 2 Footnote 3 | (6 to 16)Table 2 Footnote 1 | (146 to 188%)Table 2 Footnote 1 |
| Two or more psychological symptoms | (38 to 43%)Table 2 Footnote 1 | (4 to 7)Table 2 Footnote 3 | (111 to 117%)Table 2 Footnote 3 | (6 to 18)Table 2 Footnote 1 | (116 to 152%)Table 2 Footnote 1 |
| Low life satisfaction | (14 to 18%)Table 2 Footnote 1 | (11 to 15)Table 2 Footnote 1 | (225 to 251%)Table 2 Footnote 3 | (5 to 10)Table 2 Footnote 1 | (140 to 178%)Table 2 Footnote 1 |
| Fair or poor health | (13 to 17%)Table 2 Footnote 1 | (6 to 11)Table 2 Footnote 1 | (156 to 196%)Table 2 Footnote 3 | (3 to 4)Table 2 Footnote 3 | (123 to 124%)Table 2 Footnote 3 |
Limitations
All research studies have limitations and it is important to interpret results in light of their limitations.
- All data in the HBSC were collected using self-report, which is prone to reporting biases (Choi & Pak, 2005).
- Socioeconomic status is estimated using an index of material assets that provide or symbolize affluence in the family (e.g., car ownership, vacations). The HBSC Family Affluence Scale is a valid, age-appropriate tool for adolescents, however these data do not correlate closely to household income or parent occupational rank (Elgar et al., 2017). Therefore, the health inequalities reported here may differ from other estimates based on other socioeconomic assessments. Additionally, two items were added to the scale in 2014 and 2018 cycles that were not included in previous cycles. Our use of a proportional rank index (ridit score) to estimate socioeconomic status adjusts for this and harmonizes the variable accordingly.
- Binary measures of gender (male/female) were used from 2002 to 2014, which excluded and/or misrepresented adolescents who did not identify as either. The 2018 survey allowed for a non-binary response option ("neither term describes me"), as will future cycles.
Conclusions
Five survey cycles of the Canadian HBSC study revealed increased health inequalities between socioeconomic and gender groups from 2002 to 2018.
The burden of ill health shifted towards disadvantaged adolescents in terms of excess body weight, physical symptoms, low life satisfaction, and fair or poor health.
Gender inequalities increased in frequent physical and psychological symptoms and low life satisfaction.
Similar trends were reported in the Canadian adult population (Shahidi et al., 2018) and in adolescents in several European countries (Inchley, 2020).
Monitoring health inequalities in adolescents informs policy approaches to reducing these gaps early in the life course.
Methods
Data source
The data were collected from the 4th to 8th cycles of the Canadian Health Behaviour in School-aged Children (HBSC) study, a World Health Organization cross-national research study that focuses on the health of 11-15 year-old students and was conducted every 4 years.
The main purposes of the HBSC are to understand youth health and well-being and to inform education, health policy and health promotion programs in Canada and abroad (Public Health Agency of Canada, 2020).
Eligible school classrooms across Canada were selected at random and invited to participate in the study. Data were collected in school settings from a nationally representative random two-stage cluster sample of adolescents in grades 6 to 10 from all provinces and territories in Canada.
Measures
Questionnaires included a 6-item measure of material assets in the home (HBSC Family Affluence Scale), which measures number of cars, having one's own bedroom, number of computers in the home, number of bathrooms, family holidays in the past year, and having a dishwasher. The responses were compiled into proportional rank index of material deprivation in the family, ranging from a score of 0 (lowest deprivation) to a score 1 (highest deprivation) with an average of 0.5 (Elgar et al., 2017). Questionnaires also included measures of physical activity (days of 60+ minutes of moderate-to-vigorous physical activity in the previous week), self-reported height and weight, eight psychological and physical symptoms (Gariepy et al., 2016), life satisfaction (Cantril, 1965), and general health (fair, poor, good or excellent).
Statistical analyses
We evaluated differences in health between socioeconomic and gender groups in six health domains. The measure of socioeconomic status (SES) allowed for the computation of regression-based indicators of socioeconomic inequality (Mackenbach & Kunst, 1997). SES was used as an interaction term with the survey cycle to assess for significant trends in socioeconomic inequality over time, while controlling for age, gender, and family structure in multilevel regression models. The gender inequality analysis used gender as an interaction term with the survey cycle to assess for significant trends in gender inequality over time, while controlling for age, SES, and family structure in multilevel regression models. Survey weights were applied to ensure the results were representative of the Canadian population and to equalize the importance of each survey cycle to the analysis. All analyses used standardized weights to account for variations in sampling and a level of significance set at p<0.05, and were conducted in Stata 16.0 (Stata Press, 2019).
References
Bor, W., Dean, A. J., Najman, J., & Hayatbakhsh, R. (2014). Are child and adolescent mental health problems increasing in the 21st century? A systematic review. The Australian and New Zealand Journal of Psychiatry, 48(7), 606-616. https://doi.org/10.1177/0004867414533834
Cantril, H. (1965). The pattern of human concerns. Rutgers University Press, New Brunswick.
Choi, B. C. K., & Pak, A. W. P. (2005). A catalog of biases in questionnaires. Preventing Chronic Disease, 2, A13.
Eikemo, T. A., Skalická, V., & Avendano, M. (2009). Variations in relative health inequalities: are they a mathematical artefact? International Journal for Equity in Health, 8, 32. https://doi.org/10.1186/1475-9276-8-32
Elgar, F. J., Pförtner, T. K., Moor, I., De Clercq, B., Stevens, G. W. J. M., & Currie, C. (2015). Socioeconomic inequalities in adolescent health 2002-2010: A time-series analysis of 34 countries participating in the Health Behaviour in School-aged Children study. The Lancet, 385(9982), 2088-2095. https://doi.org/10.1016/s0140-6736(14)61460-4
Elgar, F. J., Xie, A., Pfortner, T.-K., White, J., & Pickett, K. E. (2017). Assessing the view from bottom: How to measure socioeconomic position and relative deprivation in adolescents. In SAGE Research Methods Cases (Vol. Part 2). SAGE.
Gariépy, G., & Elgar, F. J. (2016). Trends in psychological symptoms among Canadian adolescents from 2002 to 2014: Gender and socioeconomic differences. Canadian Journal of Psychiatry, 61(12), 797-802. https://dx.doi.org/10.1177%2F0706743716670130
Gariepy, G., McKinnon, B., Sentenac, M., & Elgar, F. J. (2016). Validity and reliability of a brief symptom checklist to measure psychological health in school-aged children. Child Indicators Research, 9(2), 471-484.
Hu, Y., van Lenthe, F. J., Borsboom, G. J., Looman, C. W., Bopp, M., Burström, B., Dzúrová, D., Ekholm, O., Klumbiene, J., Lahelma, E., Leinsalu, M., Regidor, E., Santana, P., de Gelder, R., & Mackenbach, J. P. (2016). Trends in socioeconomic inequalities in self-assessed health in 17 European countries between 1990 and 2010. Journal of Epidemiology and Community Health, 70(7), 644-652.
Inchley, J., Currie, D., Budisavljevic, S., Torsheim, T., Jåstad, A., Cosma, A. et al. (2020). Spotlight on adolescent health and well-being. Findings from the 2017/2018 Health Behaviour in School-aged Children (HBSC) survey in Europe and Canada. International report. Volume 1. Key findings. Copenhagen: WHO Regional Office for Europe.
Keeley, B. (2015). Income inequality: The gap between rich and poor. OECD Insights, Paris: OECD Publishing.
Mackenbach, J. P., Kulhánová, I., Menvielle, G., Bopp, M., Borrell, C., Costa, G., Deboosere, P., Esnaola, S., Kalediene, R., Kovacs, K., Leinsalu, M., Martikainen, P., Regidor, E., Rodriguez-Sanz, M., Strand, B. H., Hoffmann, R., Eikemo, T. A., Östergren, O., Lundberg, O., & Eurothine and EURO-GBD-SE consortiums (2015). Trends in inequalities in premature mortality: a study of 3.2 million deaths in 13 European countries. Journal of Epidemiology and Community Health, 69(3), 207-206.
McCartney, G., Collins, C., & Mackenzie, M. (2013). What (or who) causes health inequalities: theories, evidence and implications? Health Policy, 113(3), 221-227. https://doi.org/10.1016/j.healthpol.2013.05.021
Patton, G. C., Sawyer, S. M., Santelli, J. S., Ross, D. A., Afifi, R., Allen, N. B., Arora, M., Azzopardi, P., Baldwin, W., Bonell, C., Kakuma, R., Kennedy, E., Mahon, J., McGovern, T., Mokdad, A. H., Patel, V., Petroni, S., Reavley, N., Taiwo, K., Waldfogel, J., Wickremarathne, D., Barroso, C., Bhutta, Z., Fatusi, A. O., Mattoo, A., Diers, J., Fang, J., Ferguson, J., Ssewamala, F., & Viner, R. M. (2016). Our future: A Lancet commission on adolescent health and wellbeing. The Lancet, 387(10036), 2423-2478. https://doi.org/10.1016/s0140-6736(16)00579-1
Pillas, D., Marmot, M., Naicker, K., Goldblatt, P., Morrison, J., & Pikhart, H. (2014). Social inequalities in early childhood health and development: A European-wide systematic review. Pediatric Research, 76(5), 418-424.
Public Health Agency of Canada [PHAC]. (2020). The health of Canadian youth: Findings from the health behaviour in school-aged children study. Retrieved from https://www.canada.ca/en/public-health/services/publications/science-research-data/youth-findings-health-behaviour-school-agedchildren-study.html
Shahidi, Vahid, F., Muntaner, C., Shankardass, K., Quiñonez, C., & Siddiqi, A. (2018). Widening health inequalities between the employed and the unemployed: A decomposition of trends in Canada (2000-2014). PloS one, 13(11), e0208444. https://dx.doi.org/10.1371%2Fjournal.pone.0208444
Acknowledgements
- Health Behaviour in School-aged Children (HBSC) is an international study carried out in collaboration with the World Health Organization, European Region (WHO/EURO). The International HBSC Coordinator was Dr. Joanna Inchley (University of Glasgow, Scotland) for the 2017/18 survey and the Data Bank Manager was Dr. Oddrun Samdal (University of Bergen, Norway). The Canadian 2017/18 HBSC survey was funded by the Public Health Agency of Canada, the principal investigators were Drs. John Freeman, William Pickett and Wendy Craig (Queen's University), and the national coordinator was Matthew King (Social Program Evaluation Group, Queen's University).