
The health of young people in Canada: Focus on mental health
Download in PDF format
(38.7 MB, 241 pages)
Organization: Public Health Agency of Canada
Date published: 2025-06-23
Cat.: HP15-13/2025E-PDF
ISBN: 978-0-660-74692-0
Pub.: 240653
Findings from the 2022 Health Behaviour in School-aged Children Study
Foreword
We are pleased to present the 2022 National Report, Health Behaviour in School-aged Children (HBSC): The Health of Young People in Canada: A Focus on Mental Health.
The 2022 National Report focuses on mental health, building on a similar theme from the 2010 National Report, and examines other important social determinants of youth health including physical activity, bullying, teen dating violence, substance use, social media use, healthy eating, and COVID-19. Additionally, for the first time, the 2022 HBSC report explores the experiences of transgender and gender-diverse youth, marking a pivotal step in recognizing, understanding, and addressing the diverse needs of all young people in Canada, regardless of gender identity. These findings are particularly revealing, as the health and health behaviour experiences of these “TGD” youth are consistently worse than others, no matter which indicator of health status is examined.
More positively, we were encouraged by the finding that strong relationships continue to matter to youth. Students who report strong relationships with their parents, families, friends, and within their schools are much more likely to report better mental health and higher levels of well-being. The report also identifies that – regardless of socioeconomic background – it is possible for young people in adverse conditions to thrive if they are fortunate enough to have the right supports and relationships in their lives. On the other hand, the findings also identified some important concerns. We continue to observe that cisgender girls in Canada report experiencing significant health problems in multiple domains. Developmentally, as young people transition to grades 9 and 10 many different negative health outcomes start to emerge, especially those related to mental health. The report also provides insights into the effects of the COVID-19 pandemic, with many HBSC survey participants reporting negative effects on their relationships with others and their school and health experiences.
The 2022 HBSC National Report is consistent with the Public Health Agency of Canada’s mission to promote and protect the health of Canadians through leadership, partnership, innovation, and action in public health. Canadian HBSC findings improve our understanding of young people's health and serve as a vital source of information and evidence for researchers, stakeholders, and those who work in the school setting.
We would like to extend our gratitude to the over 26,000 students from more than 300 schools across Canada who shared their lived experiences and provided their reflections and insights on the findings. These youth perspectives continue to be an invaluable contribution to our work. We are also grateful to teachers and school administrators for their collaboration and support in carrying out this survey. Together, we can support a healthier future for young people in Canada.
Acknowledgements
This report was prepared by: Wendy Craig (Queen’s University, Department of Psychology), Valerie F. Pagnotta (Brock University, Department of Health Sciences), Stephanie Wadge (Brock University, Department of Health Sciences), Matthew King (Queen’s University, Department of Psychology), and William Pickett (Brock University, Department of Health Sciences, Queen’s University, Department of Public Health Sciences).
This report presents findings from the 9th cycle of the Health Behaviour in School-aged Children survey in Canada. We would like to acknowledge the collaborative efforts of the 50 participating research teams from Europe and North America and the ongoing support of the International Coordinating Centre in Scotland, as well as the International Databank Coordinating Centre in Norway.
The administration of the HBSC survey and the presentation of findings in this report are made possible by funding from the Public Health Agency of Canada through the Youth Policy and Partnerships Unit in the Division of Children and Youth. Special appreciation is given to Dr. Suzy Wong, Senior Policy Analyst; Deepika Sriram, Acting Senior Policy Analyst; Jennifer Anderson, Manager; as well as reviewers within the Government of Canada for providing invaluable insight and contributions throughout the planning and the completion of this report.
The Pan-Canadian Joint Consortium for School Health (JCSH) collaborated with the HBSC team to provide active support in the data collection phase of the study and to identify priority issues in the development of the survey instruments and for reporting. Leadership in our collaboration was provided by Susan Hornby, Senior Advisor the JCSH Secretariat, and the JCSH School Health Coordinators’ Committee.
We would like to acknowledge Larissa Lobo and Jayne Morrish, for their work in bringing together our National Youth Advisory Council and to thank the young people who made up the Council. Our Council provided advice and input throughout the process from input on questions to interpreting the data, and providing lived experiences based on the results and who so candidly shared with us their thoughts and experiences. Salony Sharma contributed to the youth engagement component of the Canadian national survey, including being the designer of the school reports generated as part of the HBSC Canada dissemination efforts.
The HBSC team was responsible for collecting and analyzing the data under the supervision and organization of Matthew King. Zoe Saine, Christina Luzius-Vanin, Ella Blondin and Rebecca Stroud Stasel were responsible for contacting school jurisdictions and schools and coordinating the administration of the survey.
Data entry, coding, questionnaire handling, and the related tracking and documentation were carried out by Mahma Ahmed, Reem Atallah, Dayna Bastien, Arielle Ventura Baguio, Riley Bonar, J Burns, Kadance Byron, Sophie Craig, Sophia Coppolino, Jade Deluca-Ahooja , Mackenzie Gribbon, Joshua Williams Haberer, Andrew Hall, Kareen Hewitt, Mazin Hussain, Yuhan Jiang, Jade Leonard, Nicole Li, John-Angus Maclean Davison, Lachlan Maclean Davison, Sofia Mancini, Logan McLellan, Olivia Merulla, Lucy Morrow, Julia Noble, Efkan Oguz, Sydney Orsak, Bridgette Paisley, Hope Rutledge, Kyran Sachdeva, Kerlas Samaan, Emily Sowa, Hailey Swain, Madison Taylor, Jacob Turnbull, Luning Wang, Haichaoyang Yan, and Lilly Zepp.
Diane Yocum was responsible for carrying out and overseeing the many administrative tasks required in the questionnaire development process and collecting the data. Grace Moffat carried out a similar role for the research team in the completion of this report.
Cameron Hines was responsible for preparing and editing the data files and figures and the text in the report. Brock Ostrom graphically designed the report. Chantal Caron was responsible for translating the English version of the report into French.
We would like to thank all of the co-investigators who have contributed to the development of the measures, the methodology, as well as the conceptual direction of the report: Dr. Colleen Davison and Dr. Ian Janssen of Queen’s University; Dr. Gina Martin, Athabasca University; Dr. Frank Elgar, McGill University; Dr. Kathy Georgiades, McMaster University; Dr. Scott Leatherdale, University of Waterloo; Dr. Michael McIsaac, University of Prince Edward Island; Dr. Nour Hammami, Trent University; Dr. Theodore Christou, Ontario Tech University; and Dr. Elizabeth Saewyc, University of British Columbia.
Most importantly, we wish to thank all the students who were willing to share their experiences with us, as well as the school principals, teachers, school jurisdictions, and parents, for making this survey happen.
Contents
- Chapter 1: Introduction
- Chapter 2: Mental health
- Chapter 3: Home and family
- Chapter 4: Friends
- Chapter 5: School
- Chapter 6: Community
- Chapter 7: Physical activity, screen time and sleep
- Chapter 8: Healthy eating
- Chapter 9: Healthy weights
- Chapter 10: Injury and concussions
- Chapter 11: Bullying and teen dating violence
- Chapter 12: Spiritual health
- Chapter 13: Substance use
- Chapter 14: Sexual health
- Chapter 15: Social media use
- Chapter 16: Covid-19 pandemic
- Chapter 17: Youth perspective and priorities
- Chapter 18: Key messages and themes
Chapter 1: Introduction
Purpose
Conducted every four years using a common research protocol that is developed by its International Assembly of Principal Investigators, the Health Behaviour in School-aged Children (HBSC) study examines the health and health behaviours of youth aged 11-15 across 50+ countries. As a cross-national research study, the survey aims to understand young people’s health through their social and environmental contexts. By gathering various health indicators in relation to their home life, school life, community setting, peer relationships, and health risk or health-promoting behaviours, the health of our youth can be analyzed and compared at internationalReference 1 and nationalReference 2 levels. In 1990, Canada became a member country and has participated in each cycle of the survey since, allowing for comparisons over time. Through the HBSC study, a robust body of literature and reports has been developed and used to inform both policy and practice in the country.
Canadian HBSC objectives
In Canada, the HBSC study is funded by the Public Health Agency of Canada (PHAC) and conducted by Queen’s University, with collaborative support from other university-based researchers from across Canada. The questionnaire and sampling approach used for Canadian students is governed by the international HBSC study protocol, which includes the requirement to ask a large series of items contained in the mandatory international HBSC questionnaire.Reference 1Reference 2 Additional items used in Canada are developed through a broad-based consultation model with PHAC, provincial and territorial Ministries of Health and Education through the Pan-Canadian Joint Consortium for School Health (JCSH), a diverse panel of Canadian youth, and the Canadian HBSC research team.
The primary objectivesReference 3 of the HBSC are to:
- Initiate and sustain national and international research on health and well-being, health behaviour, the social determinants of health, and the social context of health in adolescents.
- Disseminate findings to relevant audiences, including researchers, policymakers, health promotion practitioners, teachers, parents, and adolescents.
- Inform and support the development of health promotion programs and interventions with adolescents (referred to as “school-aged children”, internationally).
- Contribute to a global network that generates new evidence related to adolescent health and well-being.
Methods
Selection of schools:
- Nine provinces and two territories participated in the 2022 cycle of the HBSC study. New Brunswick and Nunavut were unable to participate in this cycle.
Selection of students:
- The number of classes in specific schools was estimated based on the grades in the school, the number of teachers, the total enrolment, and the enrolment by grade, while accounting for known variations in class structure.
- Classes had an approximately equal chance of being selected.
- All classes in grades 6 through 10 in selected schools were invited to participate.
- Students within the selected classrooms, following consent, were asked to complete the survey questionnaire.
Survey administration:
- Data were collected in 2022 and 2023, during the 2021-22 and 2022-23 school years.
- Participating students completed questionnaires in school during one 45 to 70 minute class.
- Schools could choose to have students complete the questionnaire using an online web-based methodology or with paper booklets. Fifty-four percent of the questionnaires in the dataset were completed using the online methodology.
- In Yukon, data collection was carried out under the supervision of the Yukon Bureau of Statistics. Onsite data collection was carried out by research personnel going into the schools.
The Canadian HBSC Youth Advisor Panel was consulted in the development of the questionnaire, and their thoughtful feedback is reflected in the report content as well as their illustrative thoughts provided in every chapter.
Sex and Gender Considerations:
In the 2022 cycle of the HBSC study, youth were asked to identify what sex they were assigned at birth according to the following categories: “Female” or “Male.” Additionally, youth were asked to self-identify their gender identity according to the following categories: “Girl”, “Boy”, “I identify myself neither boy nor girl” or “Other/s (please specify).” Youth whose gender identity aligned with the sex they were assigned at birth were categorized as cisgender boys (sex assigned at birth=male and gender identity=boy) or cisgender girls (sex assigned at birth=female and gender identity=girl). Youth whose sex assigned at birth did not align with their gender identity, and those who selected “I identify myself neither boy nor girl” or “Other/s (please specify)” as their gender identity, were categorized as transgender and gender-diverse (TGD) youth. All TGD youth were grouped together in a separate category of adolescents, to ensure sufficient sample sizes for analyses that stratified by gender identity.
| Gender | Measure | Grade | Total | ||||
|---|---|---|---|---|---|---|---|
| 6 | 7 | 8 | 9 | 10 | |||
| Cisgender boys | n | 2,931 | 2,663 | 2,704 | 2,395 | 1,812 | 12,505 |
| % | 48.0 | 48.4 | 49.4 | 47.2 | 47.8 | 48.2% | |
| Cisgender girls | n | 2,841 | 2,487 | 2,436 | 2,372 | 1,747 | 11,883 |
| % | 46.5 | 45.2 | 44.5 | 46.7 | 46.1 | 45.8% | |
| Transgender & gender-diverse (TGD) youth | n | 333 | 355 | 329 | 310 | 228 | 1,555 |
| % | 5.5 | 6.4 | 6.0 | 6.1 | 6.0 | 6.0% | |
| Total | n | 6,105 | 5,505 | 5,469 | 5,077 | 3,787 | 25,943 |
| n = Total population | |||||||
| Province or Territory | Schools | Students | ||
|---|---|---|---|---|
| % | n | % | nTable 1.2 Footnote * | |
British Columbia |
2.5 |
8 |
3.8 |
1,007 |
Alberta |
6.0 |
19 |
8.3 |
2,180 |
Saskatchewan |
6.3 |
20 |
6.9 |
1,815 |
Manitoba |
39.1 |
124 |
43.5 |
11,465 |
Ontario |
9.1 |
29 |
8.3 |
2,201 |
Quebec |
7.3 |
23 |
2.9 |
772 |
Newfoundland and Labrador |
7.9 |
25 |
8.1 |
2,142 |
Nova Scotia |
1.3 |
4 |
1.7 |
456 |
Prince Edward Island |
5.0 |
16 |
7.5 |
1,985 |
Northwest Territories |
8.8 |
28 |
4.5 |
1,193 |
Yukon |
6.6 |
21 |
4.3 |
1,144 |
TOTAL |
100% |
317 |
100% |
26,360 |
n = Total population
|
||||
The focus of this report
Following the 2010 HBSC national report, which focused on mental health, it was evident that further understanding the mental health of Canadian young people was critical. In consultation with PHAC, the JCSH, and the HBSC Youth Advisor Panel, it was determined that the 2022 national report would also focus on mental health. This topic will be explored through standard, internationally accepted indicators of mental health status, both positive and negative. Each of these indicators had been subjected to extensive validation efforts in Canada and internationally. Four of these indicators were chosen for more in-depth analyses throughout the report, including factors associated with positive mental health status (Life Satisfaction, World Health Organization-5 (WHO-5) Well-being index), and negative mental health status (Loneliness, Health Complaints).
Life satisfaction
Life satisfaction was measured by asking youth to rate their lives on the Cantril ladderReference 4 from zero to ten. Zero, the lowest position on the ladder, represented “the worst possible life for you” and ten, the highest position on the ladder, represented “the best possible life for you.”
WHO-5 Well-being Index
The WHO-5 Well-being indexReference 5Reference 6 is comprised of five questions, with response options ranging from 0 (“at no time”) to 5 (“all of the time”). Responses to these five questions were then totaled and multiplied by four (scores could range from 0-100) to determine the overall WHO-5 Well-being Score. Based on precedent,Reference 5Reference 6 scores in the range of 0 to 50 are categorized as “poor well-being”.
Table 1.3. WHO-5 Well-being items:
- I have felt cheerful and in good spirits.
- All of the time= 5
- Most of the time=4
- More than half the time=3
- Less than half of the time=2
- Some of the time=1
- At no time=0
- I have felt calm and relaxed.
- All of the time= 5
- Most of the time=4
- More than half the time=3
- Less than half of the time=2
- Some of the time=1
- At no time=0
- I have felt active and energetic.
- All of the time= 5
- Most of the time=4
- More than half the time=3
- Less than half of the time=2
- Some of the time=1
- At no time=0
- I woke up feeling fresh and rested.
- All of the time= 5
- Most of the time=4
- More than half the time=3
- Less than half of the time=2
- Some of the time=1
- At no time=0
- My daily life has been filled with things that interest me.
- All of the time= 5
- Most of the time=4
- More than half the time=3
- Less than half of the time=2
- Some of the time=1
- At no time=0
Loneliness
Students were asked how frequently they had felt lonely in the last 12 months. Frequency of loneliness was measured as occurring “never,” “rarely,” “sometimes,” “most of the time,” and “always.”
Health complaints
Students were asked to rate how often in the last six months they had experienced each of the following subjective health complaints: “headache,” “stomach-ache,” “backache,” “feeling low,” “irritability or bad temper,” “feeling nervous,” “difficulties in getting to sleep,” and “feeling dizzy.” Frequency responses included “about every day,” “more than once a week,” “about every week,” “about every month,” and “rarely or never.”
Statistical analysis
Nationally representative estimates (e.g., proportions) were calculated using survey weights, in order to reflect the actual enrolments of students within each grade (from grades 6 to 10) and province or territory. Across the report, data are most often presented within two grade groupings (grades 6 to 8 and grades 9 and 10). The dataset is weighted such that each provincial/territorial sample has each of the single grades contribute to the grade groupings proportionate to the actual known student enrolment in those grades. All reported estimates and 95% confidence intervals (CIs) accounted for classroom-level clustering.
In this report, we present prevalence levels of key health indicators, overall and within groups defined (for example) by grade level and gender. In doing so, we present differences between groups in terms of absolute differences in prevalence, expressed in terms of “percentage points”. For example, if the prevalence of a health behaviour is 15% in cisgender girls and 10% in cisgender boys, the absolute difference is 5% in terms of prevalence or percentage points (15% minus 10%). This could also be described as a 5 percentage point increase in cisgender girls relative to cisgender boys, or a 5 percentage point decrease in cisgender boys relative to cisgender girls. An alternative expression of these differences could be in terms of “relative difference”. For example, the 15% vs. 10% increase described above could be described in relative terms as a 150% increase in prevalence for cisgender girls relative to cisgender boys, or a 1.5-fold increase in prevalence in cisgender girls vs. cisgender boys. However, to be aligned with past national reports and to be consistent throughout the report, we have chosen to describe differences in absolute and not relative terms.
Some analyses of prevalence estimates are also presented over time. In these analyses, estimates are stratified by up to nine survey cycles (1990 to 2022), grade level (6 to 8, 9 and 10) and gender. Because sex assigned at birth was only asked in the 2022 survey, these trends analyses are limited to the students who self-identified as “boys” (cisgender and transgender) and “girls” (cisgender and transgender) to ensure comparability between cycles.
In addition, in some analyses, prevalence estimates are presented with corresponding 95% confidence intervals for each group. In making comparisons, the statistical significance of group differences can be inferred by whether or not the CIs overlap, where a lack of overlap implies significance at the 5% level of statistical significance (p<0.05). Throughout the report, where statistical significance is achieved using this method, we comment upon the importance of the observed differences. Where there is clear overlap in the CIs, we interpret this pattern as indicating no difference between the groups. This represents a very conservative method of inferring statistical significance from confidence intervals.
The theme of this report is on the mental health of young people in Canada. A special focus of many of the chapters was therefore on how the four standard indicators of mental health status correlated with other relevant HBSC indicators presented in the chapter. These analyses considered potential determinants of mental health, as well as the consequences of mental health status. This analysis was also “intersectional”Reference 7 in design, meaning here that analyses were repeated within socio-demographic “social locations” defined by combinations of grade level (6 to 8, 9 and 10), gender identity (cisgender boys, cisgender girls, transgender and gender-diverse (TGD) youth) and socio-economic status (more well off vs. less well off, as measured by the HBSC relative material wealth item, which asks students to report how “well off” they perceive themselves to be compared to their peers). Pearson’s correlation statistics were used to explore the correlations, with resulting values categorized into four groups: 0 to 0.19 (very weak), 0.2 to 0.39 (weak), 0.4 to 0.59 (moderate), and 0.6 and higher (strong). Variables included in these correlational analyses were left in their original (continuous, scaled ordinal) as opposed to reclassified, categorical forms. Correlations that were not statistically significant (p<.05) were denoted as ‘NS’ within analyses.
Chapter 2: Mental health
According to the World Health Organization, “mental health is a state of well-being that enables people to cope with the stresses of life, realize their abilities, learn well and work well, and contribute to their community.”Reference 8 Mental health “underpins our individual and collective abilities to make decisions, build relationships, and shape the world that we live in”Reference 8 and it is “a basic human right”Reference 8 which is “crucial to personal, community and socio-economic development.”Reference 8
In recent years, the mental health of young people in Canada has become a public health priority as indicators of poor mental health have been on the rise.Reference 9 Nearly 25% of hospitalizations for children and youth aged five to 24 were for a mental health concern in 2020.Reference 9 Of these mental health related hospitalizations, 58% were for females and 42% were for males.Reference 9 Mental health consultations,Reference 10 diagnosed mood and anxiety disorders,Reference 10 the rates of prescribing mood and anxiety medications to young people,Reference 9 and incidence of anorexia nervosa,Reference 11 have all increased. Reasons for these increases are complex but research suggests an interplay of factors including, but not limited to, the COVID-19 pandemic,Reference 12Reference 13Reference 14 the climate crisis,Reference 15Reference 16 discrimination,Reference 17Reference 18 and problematic social media use.Reference 19Reference 20
Youth often perceive their own mental health differently than their parents do, with many young people rating it less positively than their parents.Reference 21 Parents may not always be aware of the mental health difficulties that their children are experiencingReference 22 and it is important to learn directly from young people about their own perceptions of their mental health experiences.
Description of items
In the HBSC survey, mental health is measured through various questions and scales. With respect to negative indicators suggestive of mental illness, some describe the frequency and intensity of feelings of being sad or hopeless, lonely, and nervous. Youth were also asked to indicate how frequently in the last six months they had experienced subjective health complaints (e.g., headache, stomach-ache, difficulties in falling asleep), as a further indicator of psychosomatic symptoms consistent with poor mental health. In terms of positive mental health, youth reported on their mental health through the WHO-5 Well-being Index.Reference 23Reference 24 This index has a range of values from 0-100, and a score between 51-100 quantifies higher relative well-being. Other indicators of positive mental health include measures of self confidence and life satisfaction.
Felt sad or hopeless
Figure 2.1. Students who reported that during the past 12 months they felt so sad or hopeless almost every day for two weeks or more in a row that they stopped doing some usual activities, by grade and gender (%)
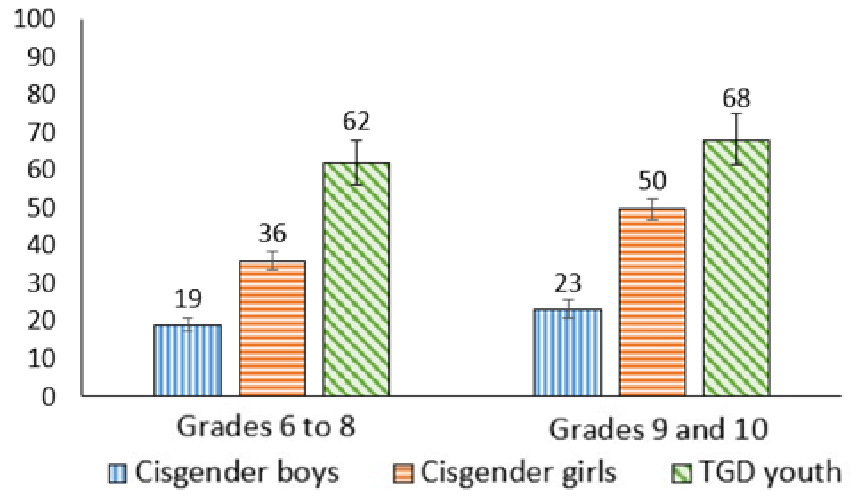
Figure 2.1: Text description
| Grade level | Cisgender boys | Cisgender girls | TGD youth |
|---|---|---|---|
| Grades 6 to 8 | 19 (17.3, 20.8) | 36 (33.8, 38.7) | 62 (56.2, 67.9) |
| Grades 9 to 10 | 23 (21.0, 25.6) | 50 (46.9, 52.5) | 68 (61.6, 75.3) |
Source: Health Behaviour in School-aged Children (HBSC), Canada, 2022 |
|||
- In each gender group, the proportion of young people feeling sad or hopeless almost every day for two weeks or more was higher among grades 9 and 10 youth compared to those in grades 6 to 8.
- This difference was highest among cisgender girls, with 50% of cisgender girls in grades 9 and 10 reporting feeling sad or hopeless almost every day for two weeks or more compared to 36% of cisgender girls in grades 6 to 8; a 14 percentage point difference.
- The highest prevalence levels of feeling sad and hopeless almost every day for two weeks or more were reported by TGD youth, regardless of grade.
“I think that boys report higher positive mental health because of societal expectations, boys are expected to just get over it.”
Trends in feeling sad or hopeless among boys
Figure 2.2. Boys who reported that during the past 12 months they felt so sad or hopeless almost every day for two weeks or more in a row that they stopped doing some usual activities, by grade and year of survey (%)
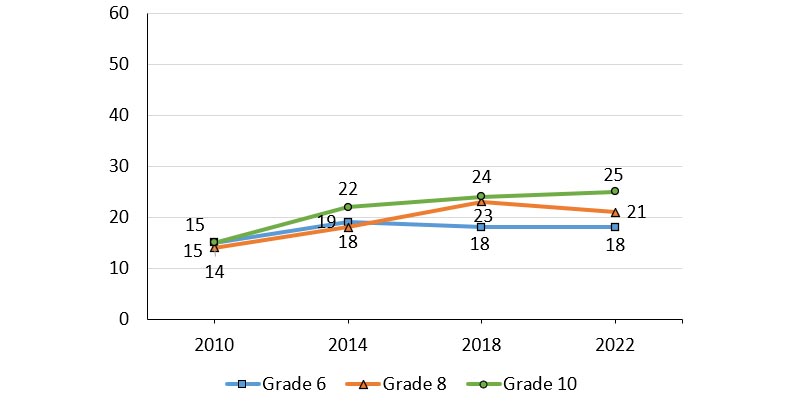
Note: When considering the above trends, estimates are provided for young people identifying as “boys” in all cycles.
Figure 2.2: Text description
| Grade level | 2010 | 2014 | 2018 | 2022 |
|---|---|---|---|---|
| Grade 6 | 15 | 19 | 18 | 18 |
| Grade 8 | 14 | 18 | 23 | 21 |
| Grade 10 | 15 | 22 | 24 | 25 |
Source: Health Behaviour in School-aged Children (HBSC), Canada |
||||
- In general, the proportion of boys who reported feeling sad or hopeless has increased over time. For example, 25% of boys in grade 10 reported this measure in 2022 compared to 15% in 2010.
- When the three grade levels are compared, boys in grade 10 consistently reported the highest prevalence of feeling sad or hopeless.
Trends in feeling sad or hopeless among girls
Figure 2.3. Girls who reported that during the past 12 months they felt so sad or hopeless almost every day for two weeks or more in a row that they stopped doing some usual activities, by grade and year of survey (%)
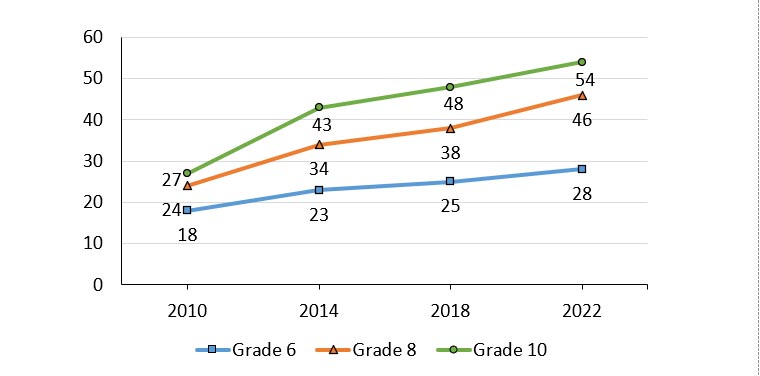
Note: When considering the above trends, estimates are provided for young people identifying as “girls” in all cycles.
Figure 2.3: Text description
| Grade level | 2010 | 2014 | 2018 | 2022 |
|---|---|---|---|---|
| Grade 6 | 18 | 23 | 25 | 28 |
| Grade 8 | 24 | 34 | 38 | 46 |
| Grade 10 | 27 | 43 | 48 | 54 |
Source: Health Behaviour in School-aged Children (HBSC), Canada |
||||
- In general, the proportion of girls who reported feeling sad or hopeless has increased over time. For example, 54% of girls in grade 10 reported this measure in 2022 compared to 27% in 2010.
- Girls in grade 10 consistently reported higher proportions of feeling sad or hopeless compared to girls in grades 6 and 8.
- Girls, when compared to boys, have consistently reported higher proportions of feeling sad or hopeless in all survey cycles from 2010 to 2022.
Felt lonely
Figure 2.4. Students who reported they felt lonely most of the time or always, by grade and gender (%)
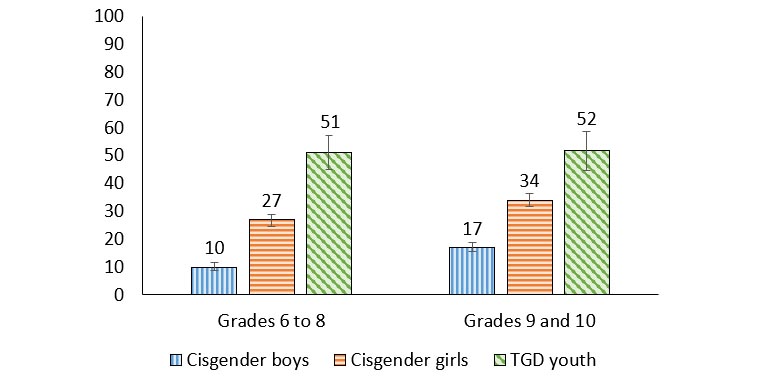
Figure 2.4: Text description
| Grade level | Cisgender boys | Cisgender girls | TGD youth |
|---|---|---|---|
| Grades 6 to 8 | 10 (9.0, 11.5) | 27 (24.5, 28.9) | 51 (44.9, 57.1) |
| Grades 9 to 10 | 17 (15.5, 19.0) | 34 (31.7, 36.4) | 52 (44.7, 58.6) |
Source: Health Behaviour in School-aged Children (HBSC), Canada, 2022 |
|||
- In cisgender boys and cisgender girls, the proportion of young people feeling lonely most of the time or always was 7 percentage points higher among grade 9 and 10 youth compared to those in grades 6 to 8.
- The highest prevalence of feeling lonely most or all of the time was among TGD youth (51% in grades 6 to 8 and 52% in grades 9 and 10). The fact that a majority of TGD youth experience these negative feelings even in the early grades was of concern.
Felt nervous
Figure 2.5. Students who reported that they felt nervous at least once a week in the last six months, by grade and gender (%)
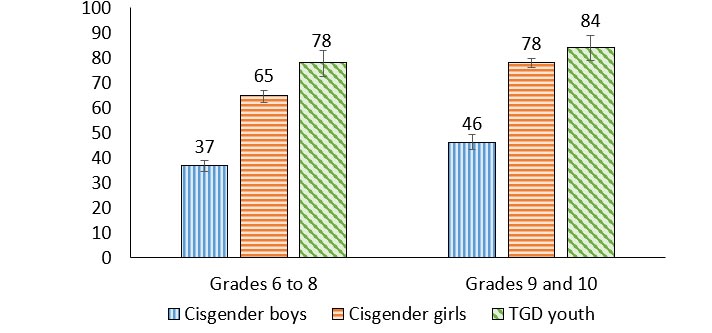
Figure 2.5: Text description
| Grade level | Cisgender boys | Cisgender girls | TGD youth |
|---|---|---|---|
| Grades 6 to 8 | 37 (34.5, 38.8) | 65 (62.2, 67.0) | 78 (72.7, 82.8) |
| Grades 9 to 10 | 46 (43.2, 49.2) | 78 (76.0, 79.9) | 84 (79.2, 88.9) |
Source: Health Behaviour in School-aged Children (HBSC), Canada, 2022 |
|||
- The proportion of cisgender youth feeling nervous at least once a week was higher among grade 9 and 10 youth compared to those in grades 6 to 8.
- This difference in feeling nervous was highest among cisgender girls in grades 9 and 10 (78% vs. 65%, a 13 percentage point difference), followed by cisgender boys (46% versus 37%, a 9 percentage point difference).
- In grades 6 to 8, TGD youth reported feeling nervous more than cisgender youth (78% of TGD youth vs. 65% of cisgender girls vs. 37% of cisgender boys).
Health complaints
Figure 2.6. Students who reported 2 or more of 8 subjective health complaints more than weekly, by grade and gender (%)
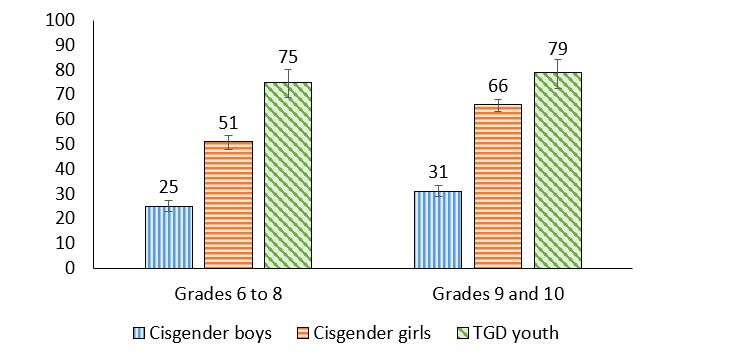
Figure 2.6: Text description
| Grade level | Cisgender boys | Cisgender girls | TGD youth |
|---|---|---|---|
| Grades 6 to 8 | 25 (22.8, 27.2) | 51 (48.0, 53.5) | 75 (69.0, 80.4) |
| Grades 9 to 10 | 31 (28.8, 33.4) | 66 (63.4, 68.2) | 79 (72.6, 84.3) |
Source: Health Behaviour in School-aged Children (HBSC), Canada, 2022 |
|||
- In general, the proportion of young people who reported 2 or more of 8 subjective health complaints more than weekly (a standard indicator of negative mental health status) was higher among grade 9 and 10 youth compared to those in grades 6 to 8.
- This difference in health complaints was highest among cisgender girls, with 66% of cisgender girls in grades 9 and 10 reporting health complaints compared to 51% in grades 6 to 8, a 15 percentage point difference.
- Regardless of grade, TGD youth reported 2 or more of 8 subjective health complaints more than cisgender youth.
“People are starting to become more comfortable opening up with their health in high school, especially in my school we have presentations about mental health and it’s okay to talk about it.”
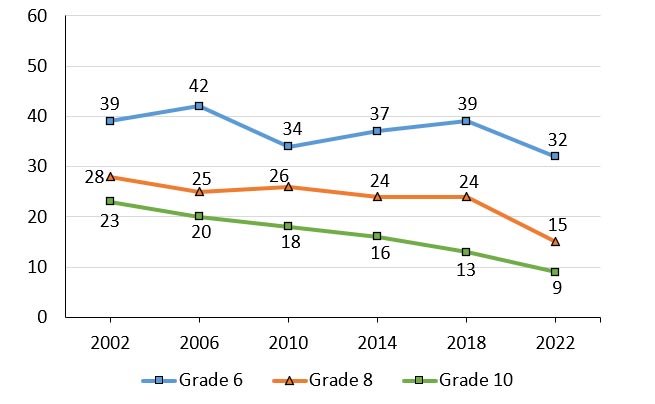
Trends in health complaints among boys
Figure 2.7. Boys who reported 2 or more of 8 subjective health complaints more than weekly, by grade and year of survey (%)
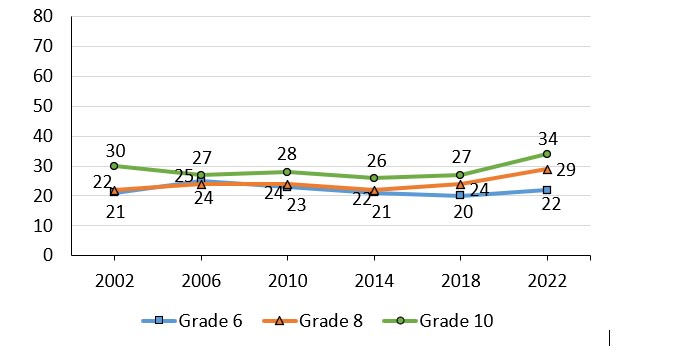
Note: When considering the above trends, estimates are provided for young people identifying as “boys” in all cycles.
Figure 2.7: Text description
| Grade level | 2002 | 2006 | 2010 | 2014 | 2018 | 2022 |
|---|---|---|---|---|---|---|
| Grade 6 | 21 | 25 | 23 | 21 | 20 | 22 |
| Grade 8 | 22 | 24 | 24 | 22 | 24 | 29 |
| Grade 10 | 30 | 27 | 28 | 26 | 27 | 34 |
Source: Health Behaviour in School-aged Children (HBSC), Canada |
||||||
- The proportion of boys reporting 2 or more of 8 subjective health complaints more than weekly was fairly stable over time. For example, among boys in grade 10, this proportion declined from 30% in 2002 to 26% in 2014, then increased to a high of 34% in 2022.
- 29% of boys in grade 8 and 34% of boys in grade 10 reported 2 or more of 8 subjective health complaints in 2022, the highest proportions ever reported amongst these groups.
- Trends among boys in grade 6 were less pronounced.
Trends in health complaints among girls
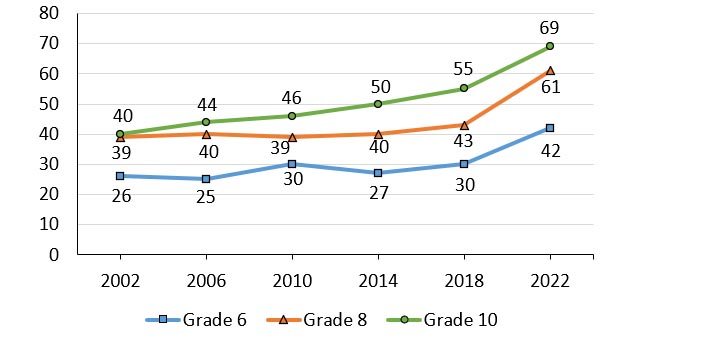
Figure 2.8. Girls who reported 2 or more of 8 subjective health complaints more than weekly, by grade and year of survey (%)
Note: When considering the above trends, estimates are provided for young people identifying as “girls” in all cycles.
Figure 2.8: Text description
| Grade level | 2002 | 2006 | 2010 | 2014 | 2018 | 2022 |
|---|---|---|---|---|---|---|
| Grade 6 | 26 | 25 | 30 | 27 | 30 | 42 |
| Grade 8 | 39 | 40 | 39 | 40 | 43 | 61 |
| Grade 10 | 40 | 44 | 46 | 50 | 55 | 69 |
Source: Health Behaviour in School-aged Children (HBSC), Canada |
||||||
- From 2002 to 2022, the proportion of girls reporting 2 or more of 8 subjective health complaints more than weekly has increased. For example, among girls in grade 6, in this proportion increased from a low of 26% in 2002 to a high of 42% in 2022, a 16 percentage point difference. A similar trend was observed in girls in grade 8, increasing from a low of 39% in 2002 to a high of 61% in 2022. Grade 10 girls had the largest increase (29%), from a low of 40% in 2002 to a high of 69% in 2022.
- Overall, girls reported higher proportions of subjective health complaints compared to boys from 2002 to 2022.
Self confidence
Figure 2.9. Students who strongly agreed that they had confidence in themselves, by grade and gender (%)
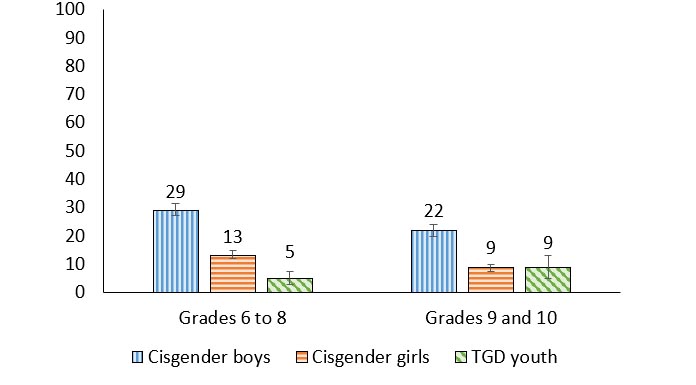
Figure 2.9: Text description
| Grade level | Cisgender boys | Cisgender girls | TGD youth |
|---|---|---|---|
| Grades 6 to 8 | 29 (27.3, 31.3) | 13 (11.9, 14.9) | 5 (2.7, 7.3) |
| Grades 9 to 10 | 22 (19.8, 24.0) | 9 (7.4, 9.8) | 9 (4.8, 13.0) |
Source: Health Behaviour in School-aged Children (HBSC), Canada, 2022 |
|||
- Cisgender boys reported the highest levels of confidence in themselves.
- In grades 6 to 8, 5% of TGD youth reported that they had confidence in themselves, a proportion that was 8 percentage points lower than cisgender girls, and 24 percentage points lower than cisgender boys.
- In grades 9 and 10, 9% of TGD youth reported having confidence in themselves, a proportion that was similar to cisgender girls, and 13percentage points lower than cisgender boys.
Trends in self confidence among boys
Figure 2.10. Boys who strongly agreed that they had confidence in themselves, by grade and year of survey (%)

Note: When considering the above trends, estimates are provided for young people identifying as “boys” in all cycles.
Figure 2.10: Text description
| Grade level | 2002 | 2006 | 2010 | 2014 | 2018 | 2022 |
|---|---|---|---|---|---|---|
| Grade 6 | 51 | 47 | 50 | 47 | 39 | 37 |
| Grade 8 | 32 | 31 | 34 | 35 | 26 | 24 |
| Grade 10 | 23 | 24 | 26 | 24 | 22 | 19 |
Source: Health Behaviour in School-aged Children (HBSC), Canada |
||||||
- Over time, the proportion of boys reporting that they strongly agree they have confidence in themselves has declined. For example, in 2002, 51% of grade 6 boys reported that they strongly agreed they had confidence in themselves compared to 37% of boys in 2022.
- Grade 10 boys have consistently reported the lowest proportions of self confidence. 23% of grade 10 boys reported self confidence in 2002 which increased to 26% in 2010 and has steadily declined since, with 19% reporting this measure in 2022.
Trends in self confidence among girls
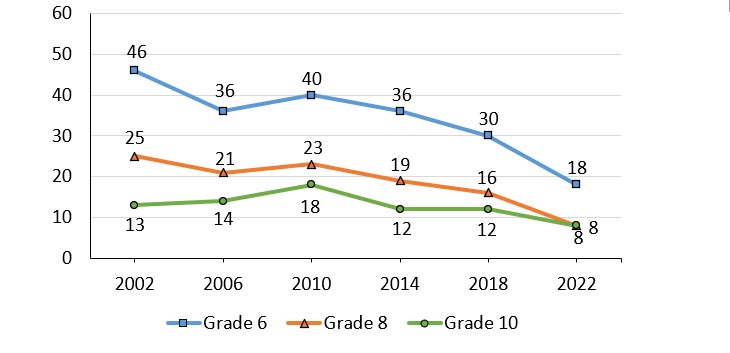
Figure 2.11. Girls who strongly agreed that they had confidence in themselves, by grade and year of survey (%)
Note: When considering the above trends, estimates are provided for young people identifying as “girls” in all cycles.
Figure 2.11: Text description
| Grade level | 2002 | 2006 | 2010 | 2014 | 2018 | 2022 |
|---|---|---|---|---|---|---|
| Grade 6 | 46 | 36 | 40 | 36 | 30 | 18 |
| Grade 8 | 25 | 21 | 23 | 19 | 16 | 8 |
| Grade 10 | 13 | 14 | 18 | 12 | 12 | 8 |
Source: Health Behaviour in School-aged Children (HBSC), Canada |
||||||
- Over time, the proportion of girls reporting that they strongly agree they have confidence in themselves has declined. For example, in 2002, 46% of grade 6 girls reported that they strongly agreed they had confidence in themselves compared to 18% of girls in 2022.
- Generally, more girls in grade 8 reported that they had self confidence when compared to girls in grade 10. However, in 2022, an equal proportion (8%) reported that they strongly agreed they have confidence in themselves.
- Overall, girls reported lower proportions of self confidence compared to boys from 2002 to 2022.
Life satisfaction
Figure 2.12. Students reporting high life satisfaction (9 or greater) on a scale of 0 to 10, by grade and gender (%)

Figure 2.12: Text description
| Grade level | Cisgender boys | Cisgender girls | TGD youth |
|---|---|---|---|
| Grades 6 to 8 | 30 (27.9, 32.5) | 24 (21.6, 25.7) | 9 (5.5, 11.5) |
| Grades 9 to 10 | 20 (17.6, 21.6) | 11 (9.1, 12.5) | 4 (1.4, 6.7) |
Source: Health Behaviour in School-aged Children (HBSC), Canada, 2022 |
|||
- In general, TGD youth reported the lowest levels of high life satisfaction, and cisgender boys reported the highest levels.
- In grades 6 to 8, 9% of TGD youth reported high life satisfaction, a proportion that was 15 percentage points lower compared with cisgender girls, and 21 percentage points lower than cisgender boys.
- In grades 9 and 10, 4% of TGD youth reported high life satisfaction, a proportion that was 7 percentage points lower than cisgender girls, and 16 percentage points lower than cisgender boys.
- High life satisfaction was reported less often in grades 9 and 10 compared with grades 6 to 8 among cisgender boys (30% vs. 20%, 10 percentage points lower), and cisgender girls (24% vs. 11%, 13 percentage points lower).
“The disparities between girls, boys, and TGD youth was something I expected based on my own experiences. TGD youth often have a harder time fitting in with their peers who are cisgender while girls often have many expectations placed upon them that may be restricting or damaging to their mental health.”
Trends in life satisfaction among boys
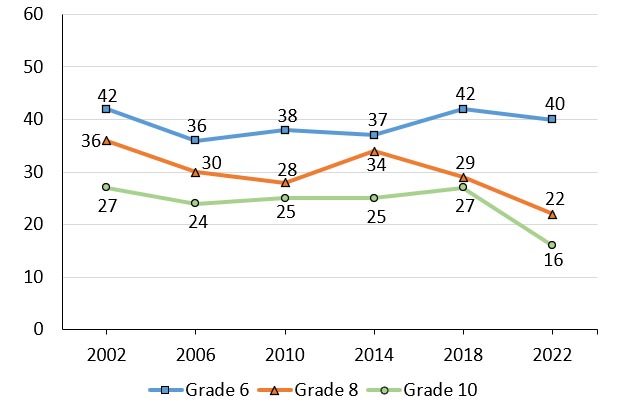
Figure 2.13. Boys reporting high life satisfaction (9 or greater) on a scale of 0 to 10, by grade and year of survey (%)
Note: When considering the above trends, estimates are provided for young people identifying as “boys” in all cycles.
Figure 2.13: Text description
| Grade level | 2002 | 2006 | 2010 | 2014 | 2018 | 2022 |
|---|---|---|---|---|---|---|
| Grade 6 | 42 | 36 | 38 | 37 | 42 | 40 |
| Grade 8 | 36 | 30 | 28 | 34 | 29 | 22 |
| Grade 10 | 27 | 24 | 25 | 25 | 27 | 16 |
Source: Health Behaviour in School-aged Children (HBSC), Canada |
||||||
|
Trends in life satisfaction among girls
Figure 2.14. Girls reporting high life satisfaction (9 or greater) on a scale of 0 to 10, by grade and year of survey (%)
Note: When considering the above trends, estimates are provided for young people identifying as “girls” in all cycles.
Figure 2.14: Text description
| Grade level | 2002 | 2006 | 2010 | 2014 | 2018 | 2022 |
|---|---|---|---|---|---|---|
| Grade 6 | 39 | 42 | 34 | 37 | 39 | 32 |
| Grade 8 | 28 | 25 | 26 | 24 | 24 | 14 |
| Grade 10 | 23 | 20 | 18 | 16 | 13 | 9 |
Source: Health Behaviour in School-aged Children (HBSC), Canada |
||||||
- Among girls in grades 8 and 10, over time, the proportion of girls reporting high levels of life satisfaction declined. For example, among girls in grade 10, the proportion declined by 14 percentage points from a high of 23% in 2002 to a low of 9% in 2022. A similar trend was observed in girls in grade 8, declining from 28% in 2002 to 15% in 2022, a 13 percentage point reduction.
- Among girls in grade 6, there was a steady increase in the proportion of girls reporting high life satisfaction between 2010 and 2018. In 2022, 32% of grade 6 girls reported high life satisfaction, the lowest proportion reported over the survey cycles.
WHO-5 Well-being Index
Figure 2.15. Students with poor well-being according to the WHO-5 Well-being Index
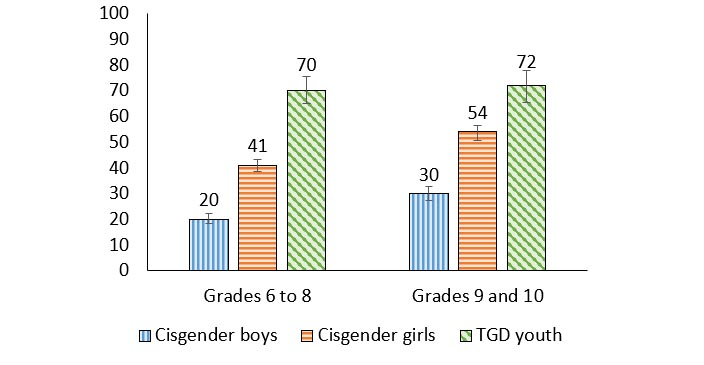
Figure 2.15: Text description
| Grade level | Cisgender boys | Cisgender girls | TGD youth |
|---|---|---|---|
| Grades 6 to 8 | 20 (18.5, 22.2) | 41 (38.4, 43.3) | 70 (65.0, 75.4) |
| Grades 9 to 10 | 30 (27.4, 32.6) | 54 (50.8, 56.3) | 72 (65.4, 78.0) |
Source: Health Behaviour in School-aged Children (HBSC), Canada, 2022 |
|||
- Poor well-being was reported most commonly among TGD youth, followed by cisgender girls, then cisgender boys.
- Among grade 9 and 10 youth, 72% of TGD youth reported poor well-being, a proportion that was 18 percentage points higher than cisgender girls, and 42 percentage points higher than cisgender boys.
- A similar gender pattern was reported by grade 6 to 8 youth, with 70% of TGD youth reporting poor well-being compared to 41% of cisgender girls and 20% of cisgender boys.
Summary of findings
Encouraging findings
- Compared with cisgender girls and TGD youth, cisgender boys reported relatively high levels of positive mental health outcomes and relatively low levels of negative mental health outcomes.
Areas of concern
- Overall, TGD youth reported worse mental health outcomes when compared to their cisgender peers.
- Cisgender girls reported worse mental health outcomes than cisgender boys.
- Cisgender boys and cisgender girls who are in grades 9 and 10 reported poorer mental health than their younger counterparts.
- In general, over time, girls and boys are reporting worse mental health outcomes.
Chapter 3: Home and family
In childhood, families typically assume the primary responsibility for their children’s health by creating and fostering the caregiving environment in addition to providing the child with the resources they need to thrive.Reference 25 It is often the family context, and relationships found within it, that introduce young people to both resources and stress which has implications for health both immediately and later in life.Reference 26 Family has the potential to influence psychological, physiological, behavioural, and social pathways that intersect with health across the life course,Reference 27 deeming it an important facet in understanding young people’s lives and health trajectories. Furthermore, parents’ health promoting behaviours such as encouraging and participating in physical activity and healthy eating,Reference 28 communicating about sexual health,Reference 29 in addition to monitoring and demonstrating healthy screen timeReference 28 influence young people’s behaviours. Finally, parental support and involvement is associated with positive mental health experiences.Reference 30Reference 31
Description of items
In the HBSC survey, students are asked to report on who they live with all or most of the time. Students were asked how much they agreed or disagreed with the statements “my parent(s)/guardian(s) understand me,” “I have a happy home life” and “there are times I would like to leave home” on a five-point Likert scale from 1 (strongly agree) to 5 (strongly disagree). Students were also asked specific questions relating to their parents. To gauge students’ ease of communication with their mother and father, youth were asked to report whether it was “very easy,” “easy,” “difficult,” or “very difficult,” to talk to them about things that really bother them. For students who are not in contact with one or both of their parents they had the option to select “don’t have or see this person.” Finally, the family support scale was used to assess family and home health. To compute this scale in its continuous form, responses to each item are added together to form a range of values from four (lower support) to 28 (higher support).
Table 3.1. Family support scale items:
- My family really tries to help me.
- 1=Very strongly disagree
- 7=Very strongly agree
- I get the emotional help and support I need from my family.
- 1=Very strongly disagree
- 7=Very strongly agree
- My family is willing to help me make decisions.
- 1=Very strongly disagree
- 7=Very strongly agree
- I can talk about my problems with my family.
- 1=Very strongly disagree
- 7=Very strongly agree
Family structure
Figure 3.1. Family Structure (%)

Figure 3.1: Text description
| Family structure | Percentage |
|---|---|
| Living with both parents | 75.1 |
| Living with mother and partner | 3.4 |
| Living with father and partner | 1.1 |
| Living with mother only | 14.1 |
| Living with father only | 3.2 |
| Other | 3.1 |
Source: Health Behaviour in School-aged Children (HBSC), Canada, 2022 |
|
- Approximately 75% of students in grades 6 to 10 reported living with both parents.
- 14% live with only their mother and 11% live in a different family structure.
Happy home life
Figure 3.2. Students who reported that they had a happy home life, by grade and gender (%)
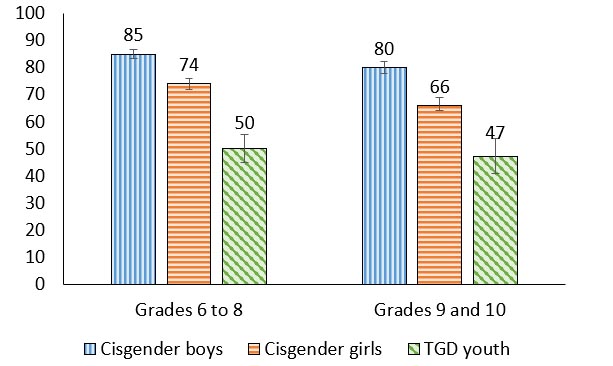
Figure 3.2: Text description
| Grade level | Cisgender boys | Cisgender girls | TGD youth |
|---|---|---|---|
| Grades 6 to 8 | 20 (18.0, 21.6) | 28 (25.5, 29.7) | 47 (41.3, 53.1) |
| Grades 9 to 10 | 23 (34.3, 36.8) | 34 (20.9, 25.9) | 59 (52.2, 65.4) |
Source: Health Behaviour in School-aged Children (HBSC), Canada, 2022 |
|||
- Cisgender boys reported the highest percentages of having a happy home life (85% of cisgender boys in grades 6 to 8; 80% of cisgender boys in grades 9 and 10).
- TGD youth had the lowest percentages of having a happy home life (50% of TGD youth in grades 6 to 8; 47% of TGD youth in grades 9 and 10).
- In general, the prevalence of reporting a happy home life was higher in grades 6 to 8 youth compared to those in grades 9 and 10, with the greatest difference amongst cisgender girls (74% in grades 6 to 8; 66% in grades 9 and 10).
Want to leave home
Figure 3.3. Students who reported that there were times they would like to leave home, by grade and gender (%)
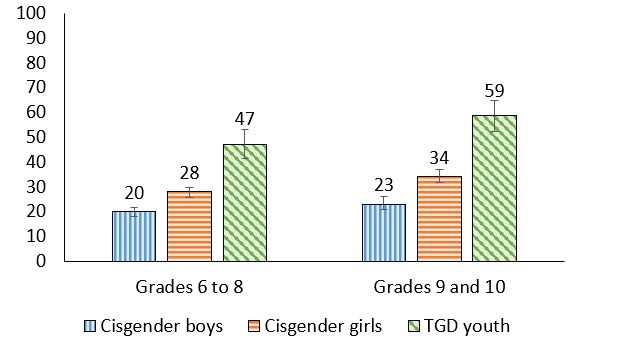
Figure 3.3: Text description
| Grade level | Cisgender boys | Cisgender girls | TGD youth |
|---|---|---|---|
| Grades 6 to 8 | 20 (18.0, 21.6) | 28 (25.5, 29.7) | 47 (41.3, 53.1) |
| Grades 9 to 10 | 23 (34.3, 36.8) | 34 (20.9, 25.9) | 59 (52.2, 65.4) |
Source: Health Behaviour in School-aged Children (HBSC), Canada, 2022 |
|||
- Cisgender boys were least likely to report wanting to leave home (20% of cisgender boys in grades 6 to 8; 23% of cisgender boys in grades 9 and 10)
- TGD youth were most likely to report wanting to leave home (47% of TGD youth in grades 6 to 8; 59% of TGD youth in grades 9 and 10).
- Cisgender girls in grades 9 and 10 (34%) reported wanting to leave home more than cisgender girls in grades 6 to 8 (28%).
Communication with mother
Figure 3.4. Students who reported that their mother was easy or very easy to talk to, by grade and gender (%)
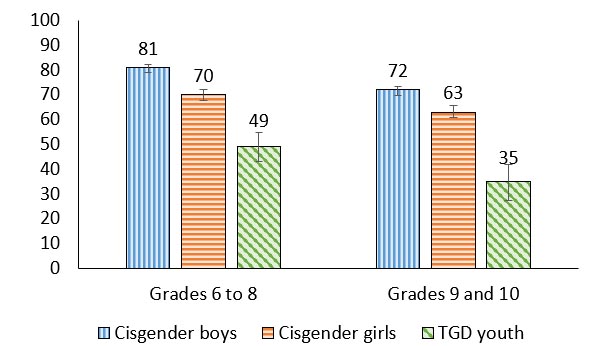
Figure 3.4: Text description
| Grade level | Cisgender boys | Cisgender girls | TGD youth |
|---|---|---|---|
Grades 6 to 8 |
81 (79.1, 82.4) |
70 (67.7, 72.1) |
49 (43.2, 54.8) |
Grades 9 to 10 |
72 (69.7, 73.5) |
63 (60.7, 65.5) |
35 (27.3, 41.9) |
Source: Health Behaviour in School-aged Children (HBSC), Canada, 2022 |
|||
- Among young people with a mother, between 35% and 81% of students felt that their mother was easy or very easy to talk to; this difference in percentages varies widely between groups.
- Ease of communication with their mother was lower in grades 9 and 10 compared to grades 6 to 8 for youth of all genders; 9 percentage points less for cisgender boys, 7 percentage points less for cisgender girls and 14 percentage points less for TGD youth.
- Regardless of grade, more cisgender boys reported ease of communication with their mother than cisgender girls and TGD youth.
Communication with father
Figure 3.5. Students who reported that their father was easy or very easy to talk to, by grade and gender (%)
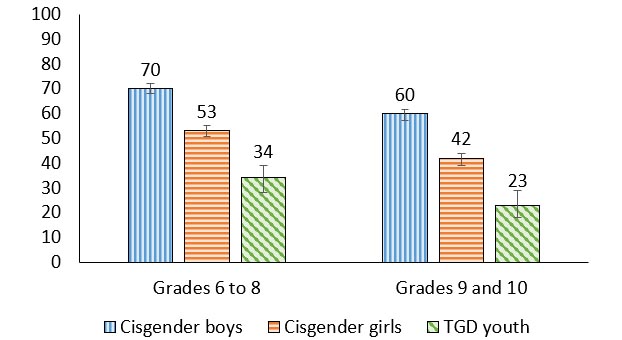
Figure 3.5: Text description
| Grade level | Cisgender boys | Cisgender girls | TGD youth |
|---|---|---|---|
| Grades 6 to 8 | 70 (67.9, 72.1) | 53 (50.6, 55.3) | 34 (28.1, 39.0) |
| Grades 9 to 10 | 60 (57.2, 61.7) | 42 (39.1, 43.9) | 23 (17.9, 28.8) |
Source: Health Behaviour in School-aged Children (HBSC), Canada, 2022 |
|||
- Among young people with a father, between 23% and 70% of students felt that their father was easy or very easy to talk to, a difference in percentage points that is very large.
- For cisgender girls and cisgender boys, the percentage of youth reporting that their father was easy to talk to decreased by grade.
- 70% of cisgender boys in grades 6 to 8 reported their father was easy to talk to compared to 60% in grades 9 and 10. Similarly, 53% of cisgender girls in grades 6 to 8 reported that it was easy to talk to their father compared to 42% in grades 9 and 10.
- Regardless of grade, more cisgender boys reported ease of communication with their father than cisgender girls and TGD youth.
Trends in feeling understood by parents among boys
Figure 3.6. Boys who reported that they were understood by their parents, by grade and year of survey (%)

Note: When considering the above trends, estimates are provided for young people identifying as “boys” in all survey cycles.
Figure 3.6: Text description
| Grade level | 1990 | 1994 | 1998 | 2002 | 2006 | 2010 | 2014 | 2018 | 2022 |
|---|---|---|---|---|---|---|---|---|---|
| Grade 6 | 66 | 78 | 76 | 91 | 90 | 90 | 87 | 87 | 84 |
| Grade 8 | 56 | 62 | 64 | 83 | 78 | 80 | 80 | 79 | 73 |
| Grade 10 | 51 | 50 | 53 | 72 | 66 | 72 | 71 | 75 | 65 |
Source: Health Behaviour in School-aged Children (HBSC), Canada |
|||||||||
- Between 1990 and 2002, increasing proportions of boys in grades 6, 8 and 10 reported feeling understood by their parents. Beyond 2002, a gradual decline in these reports of feeling understood by parents were reported for each of the three grade levels of boys.
- Overall, in 2022, fewer boys in grades 6, 8, and 10 reported feeling understood by their parents than in the previous five cycles of the HBSC survey (2002-2018).
- In general, the proportion of boys that reported feeling understood by their parents decreased with grade. For example, in 2022, 84% of grade 6 boys reported feeling understood by their parents compared to 73% of grade 8 boys and 65% of grade 10 boys.
Trends in feeling understood by parents among girls
Figure 3.7. Girls who reported that they were understood by their parents, by grade and year of survey (%)
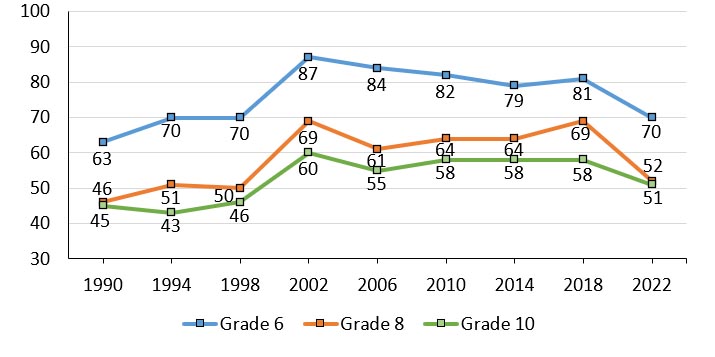
Note: When considering the above trends, estimates are provided for young people identifying as “girls” in all cycles.
Figure 3.7: Text description
| Grade level | 1990 | 1994 | 1998 | 2002 | 2006 | 2010 | 2014 | 2018 | 2022 |
|---|---|---|---|---|---|---|---|---|---|
| Grade 6 | 63 | 70 | 70 | 87 | 84 | 82 | 79 | 81 | 70 |
| Grade 8 | 46 | 51 | 50 | 69 | 61 | 64 | 64 | 69 | 52 |
| Grade 10 | 45 | 43 | 46 | 60 | 55 | 58 | 58 | 58 | 51 |
Source: Health Behaviour in School-aged Children (HBSC), Canada |
|||||||||
- Between 1990 and 2002, increasing proportions of girls in grades 6, 8 and 10 reported feeling understood by their parents. Beyond 2002, a gradual decline in these reports of feeling understood by parents were reported for each of the three grade levels of girls.
- Overall, in 2022, fewer girls in grades 6, 8, and 10 reported feeling understood by their parents than in the previous five cycles of the HBSC survey (2002-2018).
- In 2022, the proportion of girls in grades 6, 8, and 10 that reported they were understood by their parents significantly declined when compared to 2018. Among girls in grade 6 there was an 11 percentage point reduction (81% in 2018 to 70% in 2022), girls in grade 8 had an 17 percentage point reduction (69% in 2018 to 52% in 2022), and a 7 percentage point reduction (58% in 2018 to 51% in 2022) was reported amongst grade 10 girls.
- Typically, the proportion of girls that felt understood by their parents decreased with grade. However, in 2022, approximately the same proportion of grade 8 and grade 10 girls reported feeling understood by their parents.
- Compared to boys, a consistently lower proportion of girls reported that they were understood by their parents.
“This increase in cisgender girls reporting feeling less understood in grade 8 was a common theme amongst my classmates. Most youths as new teenagers start to participate in behaviours like drinking, social media use, and using makeup. These behaviors can be seen as problematic in different family structures and parents causing more conflict resulting in cisgender girls feeling less understood by their parents.”
Family support
Figure 3.8 Students reporting high family support, by grade and gender (%)
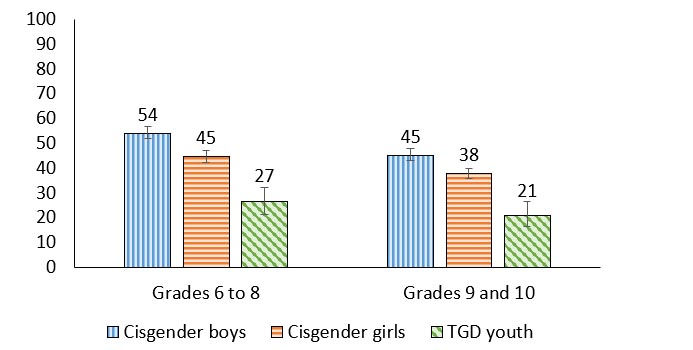
Figure 3.8: Text description
| Grade level | Cisgender boys | Cisgender girls | TGD youth |
|---|---|---|---|
| Grades 6 to 8 | 54 (52.0, 56.9) | 45 (42.2, 47.2) | 27 (21.1, 32.0) |
| Grades 9 to 10 | 45 (42.9, 47.7) | 38 (35.6, 39.7) | 21 (16.5, 26.5) |
Source: Health Behaviour in School-aged Children (HBSC), Canada, 2022 |
|||
- In general, TGD youth had the lowest proportion reporting high family support, and cisgender boys had the highest proportion.
- In grades 6 to 8, 27% of TGD youth reported high family support, a proportion that was 18 percentage points lower than cisgender girls and 27 percentage points lower than cisgender boys. This gendered pattern of decline was also seen amongst grades 9 and 10 students.
- The proportion of youth reporting high family support was lower in grades 9 and 10 compared to grades 6 to 8 among cisgender boys (45% vs 54%), and cisgender girls (38% vs 45%).
Happy home life and mental health
| Gender | Grade | Affluence | Positive indicators | Negative indicators | ||
|---|---|---|---|---|---|---|
| Life satisfaction | WHO-5 Well-being | Lonely | Health complaints | |||
| Cisgender boys | 6 to 8 |
Less |
.61 |
.61 |
-.48 |
-.44 |
More |
.51 |
.51 |
-.40 |
-.31 |
||
9 and 10 |
Less |
.52 |
.47 |
-.34 |
-.37 |
|
More |
.46 |
.46 |
-.33 |
-.28 |
||
| Cisgender girls | 6 to 8 |
Less |
.72 |
.67 |
-.60 |
-.53 |
More |
.56 |
.51 |
-.38 |
-.36 |
||
9 and 10 |
Less |
.54 |
.52 |
-.50 |
-.51 |
|
More |
.53 |
.44 |
-.37 |
-.38 |
||
| TGD youth | 6 to 8 | Both affluence groups | .58 | .42 | -.42 | -.40 |
| 9 and 10 | .48 | .50 | -.27 | -.35 | ||
| Both grade groups | Less | .64 | .40 | -.38 | -.38 | |
| More | .49 | .47 | -.33 | -.37 | ||
| Overall | .57 | .53 | -.44 | -.42 | ||
- Overall, reporting a happy home life was consistently associated with the mental health indicators. Having a happy home life was positively associated with life satisfaction and well-being, and negatively associated with loneliness and health complaints, for students in all grades, of all genders, and for all levels of affluence.
- Happy home life was more strongly related to the positive mental health indicators, compared to the negative mental health indicators.
- Broadly, for cisgender boys and cisgender girls who are less affluent in grades 6 to 8 there is a stronger relationship between happy home life and the positive mental health indicators, relative to their older and more affluent peers.
- Among TGD youth who are less affluent, happy home life was most strongly correlated with life satisfaction.
Family support and mental health
| Gender | Grade | Affluence | Positive indicators | Negative indicators | ||
|---|---|---|---|---|---|---|
| Life satisfaction | WHO-5 Well-being | Lonely | Health complaints | |||
| Cisgender boys | 6 to 8 | Less | .38 | .35 | -.36 | -.41 |
| More | .28 | .25 | -.24 | -.22 | ||
| 9 and 10 | Less | .45 | .41 | -.24 | -.38 | |
| More | .24 | .27 | -.23 | -.24 | ||
| Cisgender girls | 6 to 8 | Less | .56 | .43 | -.45 | -.35 |
| More | .43 | .39 | -.36 | -.35 | ||
| 9 and 10 | Less | .45 | .54 | -.38 | -.29 | |
| More | .41 | .31 | -.32 | -.31 | ||
| TGD youth | 6 to 8 | Both affluence groups | .46 | .42 | -.24 | -.37 |
| 9 and 10 | .38 | .37 | -.23 | -.38 | ||
| Both grade groups | Less | .39 | .46 | -.18 | -.43 | |
| More | .43 | .40 | -.25 | -.37 | ||
| Overall | .39 | .36 | -.33 | -.34 | ||
- Overall, family support was consistently associated with the mental health indicators. Family support was positively associated with life satisfaction and well-being and negatively associated with loneliness and health complaints, for students in all grades, of all genders, and for all levels of affluence.
- Family support was more strongly related to the positive mental health indicators, compared to the negative mental health indicators.
- For cisgender girls, family support was moderately positively associated with life satisfaction. For less affluent cisgender girls, family support was moderately positively associated with well-being.
- For cisgender boys, except those in grades 9 and 10 who are less affluent, family support had a weak correlation with the positive mental health indicators.
- Among TGD youth, those who are younger and more affluent had stronger associations between family support and the positive mental health indicators compared to the negative mental health indicators.
Summary of findings
Encouraging findings
- Cisgender boys reported relatively high levels of positive home and family measures and relatively low levels of negative home and family measures.
- 80-85% of cisgender boys reported having a happy home life.
- Reporting a happy home life was strongly correlated with life satisfaction and well-being for some youth, especially those who are younger. Additionally, having a happy home life was moderately correlated with many of the mental health indicators for most students.
Areas of concern
- TGD youth reported significantly worse home and family measures than their cisgender counterparts.
- 47%-59% of TGD youth reported wanting to leave home.
- When compared to 2018, boys and girls reported feeling less understood by their parents in 2022. This finding is especially prominent among grade 8 girls.
- Broadly, as youth get older, they reported smaller proportions of home and family measures that are indicative of positive health outcomes, including family support and happy home life.
"More gender diverse youth want to leave home because their parents don’t accept them or make them feel wanted."
Chapter 4: Friends
Relationships with friends are important throughout the school-aged years and become increasingly significant throughout adolescence. As children develop, their friendships evolve from being play-focused to offering the opportunity for increased closeness and intimacy.Reference 32 For many young people, their connection to friends exists in both their physical environments, such as school, and within virtual spaces such as social media.Reference 32
Friends have a direct influence on adolescents’ behaviours.Reference 33Reference 34 Friends that have a higher involvement in risk behaviours, including binge drinkingReference 35 and substance use,Reference 36 have a higher probability of negatively influencing their peers while friends that participate in more protective behaviours have a higher probability of positively influencing their peers.Reference 34 With respect to mental health, supportive peer relationships act as a protective factor with positive social connections predicting lower rates of depressionReference 37 and anxiety,Reference 38 in addition to buffering the negative effects of stress.Reference 39
Description of items
In the HBSC survey, relationships with friends are measured through various questions and scales. First, the friend support scale is used to assess how supportive students feel their friends are. To compute this scale in its continuous form, responses to each item are added together to form a range of values from four (lower support) to 28 (higher support). Questions regarding communication with friends are assessed based on ease of communication and frequency of communicating online throughout the day. Additionally, the students in grades 9 and 10 were asked to report on the positive and risky peer group activities that their friends participated in. The risky peer group activities in Table 4.3 (smoke cigarettes, get drunk at least once a week, have used drugs to get high, and vape) were added together to form a scale with values ranging from four (lowest level) to 20 (highest level).
Table 4.1 Friend support scale items:
- My friends really try to help me.
- 1=Very strongly disagree
- 7=Very strongly agree
- I can count on my friends when things go wrong.
- 1=Very strongly disagree
- 7=Very strongly agree
- I have friends with whom I can share my joys and sorrows.
- 1=Very strongly disagree
- 7=Very strongly agree
- I can talk about my problems with my friends.
- 1=Very strongly disagree
- 7=Very strongly agree
Positive peer group attributes
| Item | Grades 9 and 10 | ||
|---|---|---|---|
| Cisgender boys | Cisgender girls | TGD youth | |
| Do well at school | 58 | 63 | 53 |
| Participate in organized sports activities with others | 43 | 41 | 23 |
| Participate in cultural activities other than sports | 17 | 16 | 17 |
| Get along well with their parents | 64 | 53 | 29 |
- The most prevalent positive attribute reported by cisgender boys was that their friends get along well with their parents (64%).
- 63% of cisgender girls and 53% of TGD youth reported that their friends do well at school.
- The least prevalent positive peer group attribute among all students was participation in cultural activities other than sports. 16% of cisgender girls and 17% of cisgender boys and TGD youth reported that their friends participate in such cultural activities.
- TGD youth, compared to cisgender youth, had the smallest proportions of their friends doing well in school, participating in organized sports, and getting along well with their parents.
Risky peer group activities
| Item | Grades 9 and 10 | ||
|---|---|---|---|
| Cisgender boys | Cisgender girls | TGD youth | |
| Smoke cigarettes | 3 | 5 | 6 |
| Get drunk at least once a week | 5 | 6 | 4 |
| Have used drugs to get high | 10 | 13 | 14 |
| Vaping | 12 | 19 | 14 |
- For cisgender boys and cisgender girls, vaping was the most prevalent risky peer group activity. 19% of cisgender girls and 12% of cisgender boys reported that their friend group engaged in vaping.
- For TGD youth, using drugs to get high and vaping were the most prevalent risky peer group activity. 14% of TGD youth reported that their group of friends engaged in using drugs to get high, with similar proportions reporting engagement in vaping.
- Relative to cisgender girls and TGD youth, cisgender boys had the lowest proportion of their friends participating in smoking cigarettes (3%), using drugs to get high (10%), and vaping (12%).
Friend support
Figure 4.1. Students reporting high friend support, by grade and gender (%)
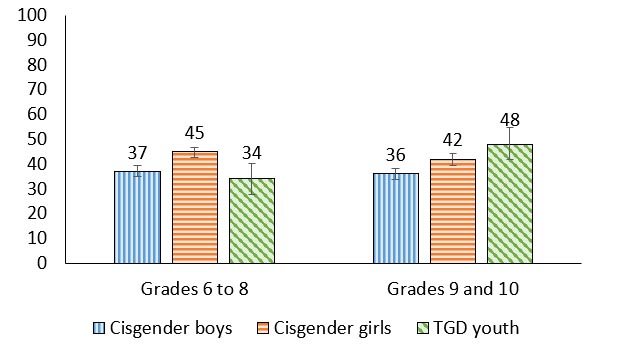
Figure 4.1: Text description
| Grade level | Cisgender boys | Cisgender girls | TGD youth |
|---|---|---|---|
| Grades 6 to 8 | 37 (35.0, 39.3) | 45 (42.5, 46.8) | 34 (27.5, 40.3) |
| Grades 9 to 10 | 36 (33.7, 38.1) | 42 (39.5, 44.0) | 48 (41.8, 54.6) |
Source: Health Behaviour in School-aged Children (HBSC), Canada, 2022 |
|||
- In grades 6 to 8, 45% of cisgender girls reported high friend support, a proportion that was 8 percentage points higher than cisgender boys and 11 percentage points higher than TGD youth.
- In grades 9 and 10, 36% of cisgender boys reported high friend support, a proportion that was 6 percentage points lower than cisgender girls and 12 percentage points lower than TGD youth.
“As a gender queer youth, there is not a lot of support for me, I stick with my friends who also fit in this category. We are a tight-knit group. If you are out, like looking at clothing appearance, then you are pressured to dress a certain way or questioned. It’s hard to deal with that and be normal.”
Online communication with close friends
Figure 4.2. Students who reported they have online contact with close friend(s) almost all the time throughout the day, by grade and gender (%)

Figure 4.2: Text description
| Grade level | Cisgender boys | Cisgender girls | TGD youth |
|---|---|---|---|
| Grades 6 to 8 | 42 (39.8, 44.3) | 54 (51.4, 56.2) | 45 (38.4, 50.9) |
| Grades 9 to 10 | 57 (54.5, 60.0) | 73 (70.4, 74.8) | 61 (54.7, 67.5) |
Source: Health Behaviour in School-aged Children (HBSC), Canada, 2022 |
|||
- The proportion of cisgender boys and cisgender girls reporting they have online contact with close friend(s) almost all the time throughout the day was higher in grades 9 and 10 compared to grades 6 to 8.
- The proportion increase by grade in online contact with close friend(s) was most prominent among cisgender girls, from 54% reporting online contact almost all the time in grades 6 to 8 to 73% of cisgender girls in grades 9 and 10, a 19 percentage point increase.
- In grades 6 to 8, 42% of cisgender boys reported they have online contact with close friend(s) almost all the time throughout the day, a proportion that was 12 percentage points lower than cisgender girls.
- In grades 9 and 10, 73% of cisgender girls reported they have online contact with close friend(s) almost all the time throughout the day, a proportion that was 16 percentage points higher than cisgender boys and 12 percentage points higher than TGD youth.
“A good amount of time, my friends are with me at school, but we still talk online. On the weekend I might talk to them more online because I can’t see them in person.”
Ease of communication with best friend
Figure 4.3. Students who reported they find it easy to talk to their best friend about things that really bother them, by grade and gender (%)
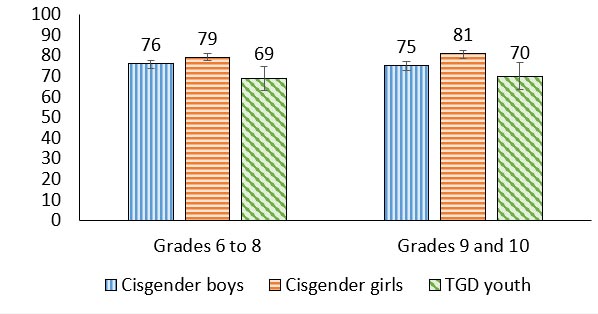
Figure 4.3: Text description
| Grade level | Cisgender boys | Cisgender girls | TGD youth |
|---|---|---|---|
| Grades 6 to 8 | 76 (73.8, 77.7) | 79 (77.5, 81.3) | 69 (63.1, 74.6) |
| Grades 9 to 10 | 75 (73.0, 77.2) | 81 (78.5, 82.5) | 70 (63.5, 76.7) |
Source: Health Behaviour in School-aged Children (HBSC), Canada, 2022 |
|||
- Across all grade groups, cisgender girls most frequently reported that it was easy to talk to their best friend about things that really bothered them, compared to cisgender boys and TGD youth.
- In grades 6 to 8, 79% of cisgender girls reported it was easy to talk to their best friend about things that really bothered them, a proportion that was 10 percentage points higher than TGD youth.
- In grades 9 and 10, 81% of cisgender girls reported that it was easy to talk to their best friend about things that really bothered them, a proportion that was 6 percentage points higher than cisgender boys and 11 percentage points higher than TGD youth.
Risky peer behaviours and mental health
| Gender | Grade | Affluence | Positive indicators | Negative indicators | ||
|---|---|---|---|---|---|---|
| Life satisfaction | WHO-5 Well-being | Lonely | Health complaints | |||
| Cisgender boys | 9 and 10 | Less | -.30 | -.26 | .39 | .47 |
| More | -.13 | -.07 | .13 | .12 | ||
| Cisgender girls | 9 and 10 | Less | -.22 | -.24 | .33 | .47 |
| More | -.24 | -.20 | .28 | .33 | ||
| TGD youth | 9 and 10 | Both affluence groups | NS | -.17 | NS | .19 |
| Less | NS | NS | NS | .25 | ||
| More | NS | -.16 | NS | .13 | ||
| Overall | -.21 | -.18 | .24 | .28 | ||
- Overall, risky peer behaviours were negatively correlated with life satisfaction and well-being, and positively correlated with loneliness and health complaints, for all students.
- For cisgender girls and cisgender boys who are less affluent, risky peer behaviours were most strongly correlated with health complaints.
- Cisgender girls had the strongest correlations between risky peer behaviours and the mental health indicators compared to cisgender boys and TGD youth.
Friend support and mental health
| Gender | Grade | Affluence | Positive indicators | Negative indicators | ||
|---|---|---|---|---|---|---|
| Life satisfaction | WHO-5 Well-being | Lonely | Health complaints | |||
| Cisgender boys | 6 to 8 | Less | .12 | .18 | -.10 | -.16 |
| More | .23 | .27 | -.22 | -.15 | ||
| 9 and 10 | Less | NS | NS | -.16 | -.19 | |
| More | .16 | .23 | -.12 | -.10 | ||
| Cisgender girls | 6 to 8 | Less | .33 | .24 | -.35 | -.20 |
| More | .27 | .27 | -.31 | -.22 | ||
| 9 and 10 | Less | .18 | .27 | -.32 | -.16 | |
| More | .18 | .20 | -.24 | -.13 | ||
| TGD youth | 6 to 8 | .12 | .21 | -.10 | NS | |
| 9 and 10 | NS | .16 | -.19 | NS | ||
| Less | NS | .16 | NS | .15 | ||
| More | .12 | .19 | -.13 | NS | ||
| Overall | .20 | .21 | -.20 | -.12 | ||
- Overall, friend support was positively associated with increased life satisfaction and well-being, and negatively associated with loneliness and health complaints for most youth. Such correlations were strongest for cisgender girls.
“If you don’t identify as a girl or boy you are automatically outcasted by people at school.”
Summary of findings
Encouraging findings
|
Areas of concern
- 3%-19% of students reported that their friends participate in risky peer group activities (i.e. smoke cigarettes, get drunk at least once a week, use drugs to get high, vape). This is especially concerning for cisgender girls and cisgender boys who are less affluent, as risky peer behaviours were moderately positively correlated with health complaints for this group of young people.
Chapter 5: School
School climate encompasses academic, community, safety, and institutional environments that contribute to students’ experiences at school.Reference 40 School climates influence all aspects of student health, including mental health. For example, positive relationships with peers and teachers have been associated with increases in psychosocial well-being, and positive perceptions regarding school safety have been associated with decreases in engagement in risk behaviours.Reference 41
When students are at school, they can interact with peers, staff and teachers while also learning valuable life skills. When students get along with their teachers, they report fewer depressive symptomsReference 42 and when teachers have better well-being themselves, students have better well-being and lower psychological distress.Reference 43 Teachers also act as advocates for their students in the classroomReference 44Reference 45 indicating they have the potential to facilitate or impede students having their health needs met in the school environment.Reference 46
Description of items
In the HBSC survey, students were asked to report on various indicators describing their school environment, including questions relating to their teachers, classmates, schoolwork, and their overall enjoyment. The school climate scale is a composite measure of four items related to student’s perceptions of their school environments. To compute this scale in its continuous form, responses to each item are added together to form a range of values from four (lower school climate) to 20 (higher school climate). Perceptions of having caring teachers were evaluated by asking students how much they agreed or disagreed with the statement “I feel that my teachers care about me as a person” on a five-point Likert scale from 1 (Strongly agree) to 5 (Strongly disagree).
Table 5.1. School climate scale items:
- How do you feel about school at present?
- 1= I don’t like it at all
- 2= I don’t like it very much
- 3=I like it a bit
- 4=I like it a lot
- Our school is a nice place to be.
- 1= Strongly disagree
- 2= Disagree
- 3= Neither agree nor disagree
- 4= Agree
- 5= Strongly agree
- I feel I belong at this school.
- 1= Strongly disagree
- 2= Disagree
- 3= Neither agree nor disagree
- 4= Agree
- 5= Strongly agree
- The rules in this school are fair.
- 1= Strongly disagree
- 2= Disagree
- 3= Neither agree nor disagree
- 4= Agree
- 5= Strongly agree
Caring teachers
Figure 5.1. Students who reported that they felt that their teachers cared about them as persons, by grade and gender (%)
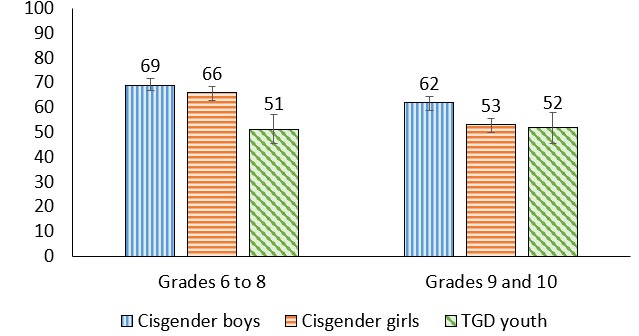
Figure 5.1: Text description
| Grade level | Cisgender boys | Cisgender girls | TGD youth |
|---|---|---|---|
| Grades 6 to 8 | 69 (66.9, 71.7) | 66 (62.8, 68.4) | 51 (45.3, 57.0) |
| Grades 9 to 10 | 62 (59.0, 64.3) | 53 (49.8, 55.4) | 52 (45.3, 57.8) |
Source: Health Behaviour in School-aged Children (HBSC), Canada, 2022 |
|||
- Overall, more than half of youth reported that they felt their teachers cared about them.
- For cisgender girls and cisgender boys, the percentage of youth reporting that they felt their teachers cared about them decreased with increasing grade level.
- The proportion of TGD youth who reported that they felt that their teachers cared about them was lower than cisgender boys and cisgender girls in grades 6 to 8
- 62% of cisgender boys in grades 9 and 10 reported that they felt their teachers cared about them, which was 9 percentage points higher than cisgender girls and 10 percentage points higher than TGD youth.
“To people who work in schools - Checking in on your students is important! School is basically a second home whether we want to or not, and it's the staff's job and priority to make that place comfortable and safe for the students. If school caused less distress on students, whether that's by adjusting lessons to their needs or lending an ear to them, it could bring down some of the stats found in the mental health chapter. A positive environment generates a positive mindset/mental health. Also, safe spaces for TGD youth is super beneficial to them!”
Teacher support
Figure 5.2. Students reporting different levels of perceived teacher support, by grade and gender (%)
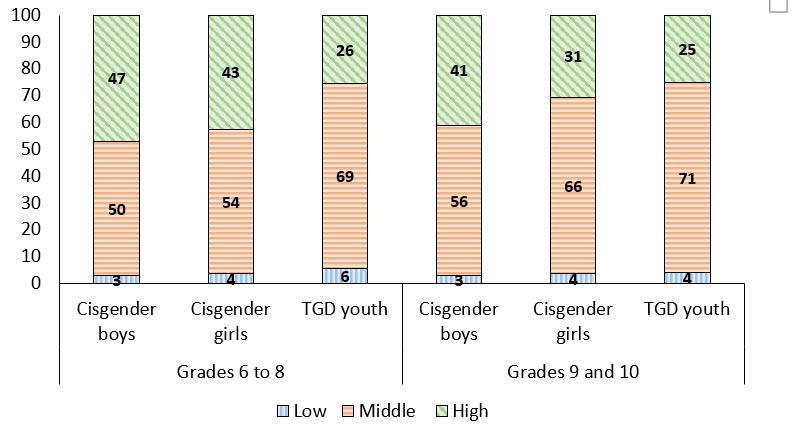
Figure 5.2: Text description
| Grade level | Gender | Low | Middle | High |
|---|---|---|---|---|
| Grades 6 to 8 | Cisgender Boys | 3 | 50 | 47 |
| Cisgender Girls | 4 | 54 | 43 | |
| TGD Youth | 6 | 69 | 26 | |
| Grades 9 to 10 | Cisgender Boys | 3 | 56 | 41 |
| Cisgender Girls | 4 | 66 | 31 | |
| TGD Youth | 4 | 71 | 25 | |
Source: Health Behaviour in School-aged Children (HBSC), Canada, 2022 |
||||
- Regardless of grade, TGD youth were least likely to report high teacher support (26% of TGD youth in grades 6 to 8; 25% of TGD youth in grades 9 and 10) compared to cisgender boys and cisgender girls.
- Cisgender boys were most likely to report high teacher support (47% of cisgender boys in grades 6 to 8; 41% of cisgender boys in grades 9 and 10) compared to cisgender girls and TGD youth.
- The proportion of cisgender boys and cisgender girls who reported high teacher support decreased in the older grade levels. 41% of cisgender boys in grades 9 to 10 reported high levels of teacher support compared to 47% in grades 6 to 8. Similarly, 31% of cisgender girls in grade 9 to 10 reported high levels of teacher support compared to 43% in grade 6 to 8.
- Overall, 3% to 6% of students reported low levels of teacher support.
“Our teachers are fine and helpful with our studies, but are reluctant to talk about anything that's not on the test, even if they are of interest to us.”
Feel accepted by other students
Figure 5.3. Students who agreed or strongly agreed that other students accept them as they are, by grade and gender (%)
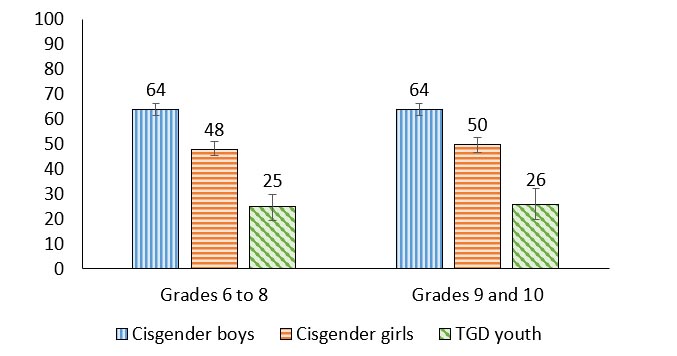
Figure 5.3: Text description
| Grade level | Cisgender boys | Cisgender girls | TGD youth |
|---|---|---|---|
| Grades 6 to 8 | 64 (61.3, 66.5) | 48 (45.6, 51.1) | 25 (19.4, 29.9) |
| Grades 9 to 10 | 64 (61.5, 66.3) | 50 (46.8, 52.6) | 26 (20.0, 32.4) |
Source: Health Behaviour in School-aged Children (HBSC), Canada, 2022 |
|||
- In grade 6 to 8, 64% of cisgender boys reported that they agreed or strongly agreed that other students accept them as they are, a proportion that was 16 percentage points higher than cisgender girls and 39 percentage points higher than TGD youth.
“With the cisgender girls, at least at my school, if one person does something wrong they are instantly shunned from their group and it spreads to other groups.”
Classmates are kind and helpful
Figure 5.4. Students who agreed or strongly agreed that other students were kind and helpful, by grade and gender (%)
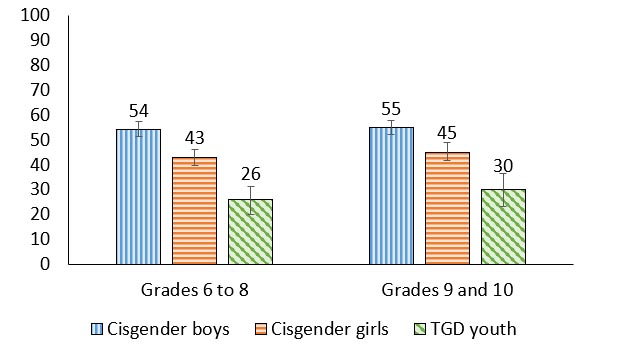
Figure 5.4: Text description
| Grade level | Cisgender boys | Cisgender girls | TGD youth |
|---|---|---|---|
| Grades 6 to 8 | 54 (51.4, 57.4) | 43 (39.9, 46.3) | 26 (20.0, 31.3) |
| Grades 9 to 10 | 55 (52.1, 57.7) | 45 (41.9, 48.9) | 30 (23.3, 36.5) |
Source: Health Behaviour in School-aged Children (HBSC), Canada, 2022 |
|||
- A higher proportion of cisgender boys agreed or strongly agreed that other students were kind and helpful compared to cisgender girls and TGD youth. For example, in grades 6 to 8, 54% of cisgender boys reported that they agreed or strongly agreed that other students were kind and helpful, a proportion that was 11 percentage points higher than cisgender girls and 28 percentage points higher than TGD youth.
- Across grades, a higher proportion of cisgender girls reported that their peers were kind and helpful compared to TGD youth.
Positive school climate
Figure 5.5. Students reporting positive school climates, by grade and gender (%)
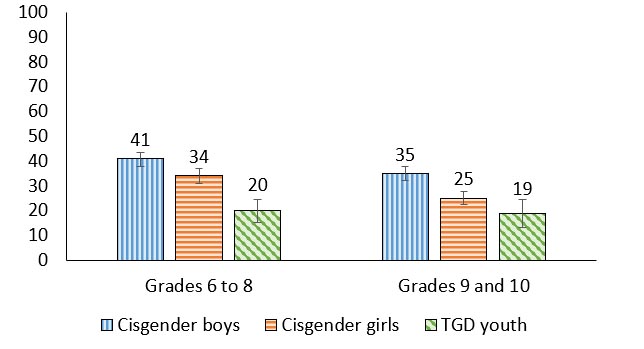
Figure 5.5: Text description
| Grade level | Cisgender boys | Cisgender girls | TGD youth |
|---|---|---|---|
| Grades 6 to 8 | 41 (37.7, 43.5) | 34 (31.0, 36.9) | 20 (15.0, 24.6) |
| Grades 9 to 10 | 35 (32.1, 37.7) | 25 (22.5, 27.5) | 19 (13.1, 24.6) |
Source: Health Behaviour in School-aged Children (HBSC), Canada, 2022 |
|||
- In grades 9 and 10, 35% of cisgender boys reported positive school climate, a proportion that was 10 percentage points higher than cisgender girls and 16 percentage points higher than TGD youth.
- The proportion of cisgender girls that reported positive school climates was lower in grades 9 and 10 compared with grade 6 to 8 (34% vs. 25%).
- In grades 6 to 8, 20% of TGD youth reported positive school climates, a proportion that was 14 percentage points less than cisgender girls and 21 percentage points less than cisgender boys.
“Create a safe space (quiet corner) where students can rest at school. This is really important for enjoying school more and feeling less nervous for those who are lonely and cannot stand long term stimulations. Add sofas and bean bags and tents and bookshelves and make it feel like home.”
Liking school
Figure 5.6. Students who reported that they liked school a bit or a lot, by grade and gender (%)
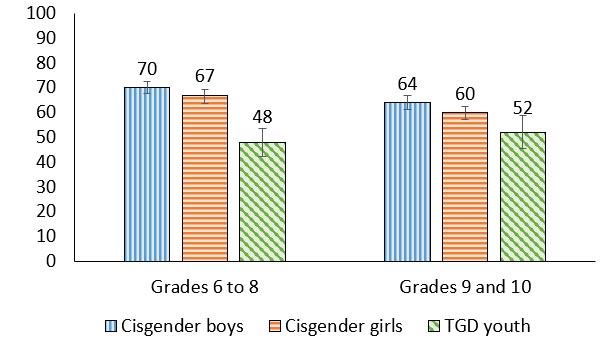
Figure 5.6: Text description
| Grade level | Cisgender boys | Cisgender girls | TGD youth |
|---|---|---|---|
| Grades 6 to 8 | 70 (67.5, 72.5) | 67 (63.8, 69.1) | 48 (42.1, 53.4) |
| Grades 9 to 10 | 64 (61.1, 66.9) | 60 (57.0, 62.6) | 52 (45.3, 59.0) |
Source: Health Behaviour in School-aged Children (HBSC), Canada, 2022 |
|||
- In grades 6 to 8, 48% of TGD youth reported that they liked school, a proportion that was 19% lower than cisgender girls and 22% lower than cisgender boys.
- In grades 9 and 10, 64% of cisgender boys reported they liked school, a proportion that was 12 percentage points higher than TGD youth.
Trends in pressure due to schoolwork among boys
Figure 5.7. Boys who reported that they felt a lot of pressure because of schoolwork, by grade and year of survey (%)
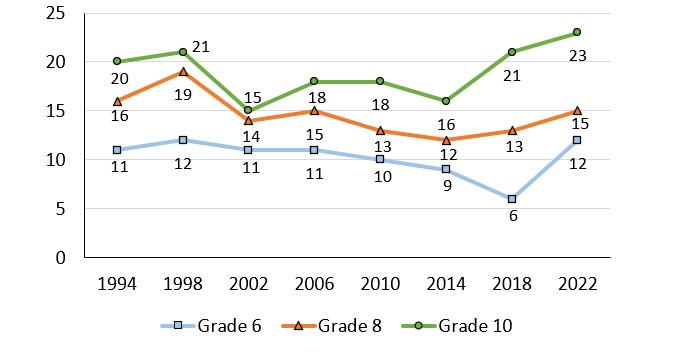
Note: When considering the above trends, estimates are provided for young people identifying as “boys” in all cycles.
Figure 5.7: Text description
| Grade level | 1994 | 1998 | 2002 | 2006 | 2010 | 2014 | 2018 | 2022 |
|---|---|---|---|---|---|---|---|---|
| Grade 6 | 11 | 12 | 11 | 11 | 10 | 9 | 6 | 12 |
| Grade 8 | 16 | 19 | 14 | 15 | 13 | 12 | 13 | 15 |
| Grade 10 | 20 | 21 | 15 | 18 | 18 | 16 | 21 | 23 |
Source: Health Behaviour in School-aged Children (HBSC), Canada |
||||||||
- Consistently over the survey cycles, boys who report feeling a lot of pressure because of schoolwork increases with increasing grade. For example, in 2022, 23% of boys in grade 10 reported feeling a lot of pressure because of schoolwork compared to 15% of boys in grade 8 and 12% of boys in grade 6.
- In 2022, 23% of boys in grade 10 reported that they felt a lot of pressure because of schoolwork. This is the highest prevalence reported by boys since the HBSC survey began in Canada in 1994.
- In 2022, the proportion of boys in grade 6 that reported they felt a lot of pressure because of schoolwork increased when compared to 2018 (12% in 2022, 6% in 2018; a 6 percentage point increase).
Trends in pressure due to schoolwork among girls
Figure 5.8. Girls who reported that they felt a lot of pressure because of schoolwork, by grade and year of survey (%)
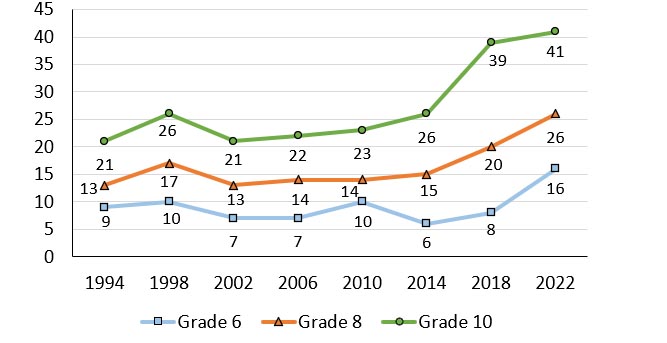
Note: When considering the above trends, estimates are provided for young people identifying as “girls” in all cycles.
Figure 5.8: Text description
| Grade level | 1994 | 1998 | 2002 | 2006 | 2010 | 2014 | 2018 | 2022 |
|---|---|---|---|---|---|---|---|---|
| Grade 6 | 9 | 10 | 7 | 7 | 10 | 6 | 8 | 16 |
| Grade 8 | 13 | 17 | 13 | 14 | 14 | 15 | 20 | 26 |
| Grade 10 | 21 | 26 | 21 | 22 | 23 | 26 | 39 | 41 |
Source: Health Behaviour in School-aged Children (HBSC), Canada |
||||||||
Percentage of girls who reported that they felt a lot of pressure because of schoolwork, by grade and year of survey
- Over the study cycles, the proportion of girls reporting that they felt a lot of pressure because of schoolwork has increased substantially. For example, among girls in grade 10, this proportion increased from a low of 21% in 2002 to a high of 41% in 2022.
- Similarly, among girls in grade 8, this proportion increased from a low of 13% in 2002 to a high of 26% in 2022, and among girls in grade 6, this proportion increased form a low of 6% in 2014 to a high of 16% in 2022.
- A consistently higher percentage of girls in grade 10 are reporting feeling pressure because of schoolwork relative to girls in grades 6 and 8.
- Compared to boys, the proportion of girls reporting feeling pressure because of schoolwork was substantially higher.
Caring teachers and mental health
| Gender | Grade | Affluence | Positive indicators | Negative indicators | ||
|---|---|---|---|---|---|---|
| Life satisfaction | WHO-5 Well-being | Lonely | Health complaints | |||
| Cisgender boys | 6 to 8 | Less | .24 | .19 | -.26 | -.22 |
| More | .18 | .27 | -.15 | -.11 | ||
| 9 and 10 | Less | .40 | .36 | -.35 | -.37 | |
| More | .22 | .28 | -.18 | -.15 | ||
| Cisgender girls | 6 to 8 | Less | .44 | .53 | -.42 | -.37 |
| More | .29 | .33 | -.24 | -.28 | ||
| 9 and 10 | Less | .23 | .36 | -.20 | -.26 | |
| More | .31 | .33 | -.20 | -.24 | ||
| TGD youth | 6 to 8 | Both affluence groups | .22 | .26 | -.15 | -.17 |
| 9 and 10 | .17 | .16 | -.13 | -.19 | ||
| Both grade groups | Less | NS | .19 | -.21 | -.36 | |
| More | .24 | .25 | -.14 | -.15 | ||
| Overall | .27 | .32 | -.22 | -.23 | ||
- Overall, perceptions of having caring teachers were consistently associated with the mental health indicators. Caring teachers were positively associated with higher life satisfaction and well-being and negatively associated with loneliness and health complaints for students in all grades, of all genders, and all levels of affluence.
- Cisgender girls had the strongest correlations between caring teachers and the mental health indicators. Cisgender girls in grades 6 to 8 who are less affluent had moderate positive correlations between caring teachers and the positive mental health indicators, as well as moderate negative correlations with loneliness.
- Amongst cisgender boys, those who are less affluent in grades 9 and 10 had the strongest association between caring teachers and the mental health indicators. In particular, caring teachers were moderately positively correlated with life satisfaction for this group of students.
- Relative to their older peers, there was a stronger association between caring teachers and the positive mental health indicators for younger TGD youth. Further, the association between caring teachers and the negative health indicators was less strong for less affluent TGD youth while the association between caring teachers and the positive mental health indicators was stronger for their more affluent peers.
Positive school climate and mental health
| Gender | Grade | Affluence | Positive indicators | Negative indicators | ||
|---|---|---|---|---|---|---|
| Life satisfaction | WHO-5 Well-being | Lonely | Health complaints | |||
| Cisgender boys | 6 to 8 | Less | .23 | .27 | -.29 | -.28 |
| More | .32 | .38 | -.26 | -.25 | ||
| 9 and 10 | Less | .55 | .51 | -.29 | -.38 | |
| More | .31 | .33 | -.21 | -.23 | ||
| Cisgender girls | 6 to 8 | Less | .52 | .53 | -.45 | -.48 |
| More | .45 | .50 | -.42 | -.46 | ||
| 9 and 10 | Less | .44 | .55 | -.43 | -.41 | |
| More | .44 | .46 | -.33 | -.39 | ||
| TGD youth | 6 to 8 | Both affluence groups | .45 | .52 | -.33 | -.39 |
| 9 and 10 | .26 | .34 | -.28 | -.39 | ||
| Both grade groups | Less | .24 | .35 | -.37 | -.42 | |
| More | .42 | .49 | -.31 | -.40 | ||
| Overall | .42 | .46 | -.36 | -.39 | ||
- Overall, positive school climate was consistently associated with the positive mental health indicators, with less pronounced correlations with the negative mental health indicators. Positive school climate was positively correlated with the positive mental health indicators and negatively correlated with the negative mental health indicators for all students.
- Cisgender girls, compared to cisgender boys and TGD youth, had the most pronounced associations between positive school climate and the mental health indicators.
- Among cisgender boys, those in grades 9 and 10 who are less affluent had the strongest correlations between positive school climate and the positive mental health indicators.
- Among TGD youth, those who are younger and more affluent had consistent associations between positive school climate and the positive mental health indicators.
Liking school and mental health
| Gender | Grade | Affluence | Positive indicators | Negative indicators | ||
|---|---|---|---|---|---|---|
| Life satisfaction | WHO-5 Well-being | Lonely | Health complaints | |||
| Cisgender boys | 6 to 8 | Less | .20 | .26 | -.13 | -.24 |
| More | .23 | .28 | -.16 | -.19 | ||
| 9 and 10 | Less | .40 | .44 | -.20 | -.25 | |
| More | .24 | .28 | -.12 | -.16 | ||
| Cisgender girls | 6 to 8 | Less | .35 | .45 | -.30 | -.35 |
| More | .39 | .45 | -.36 | -.41 | ||
| 9 and 10 | Less | .37 | .51 | -.32 | -.33 | |
| More | .38 | .44 | -.26 | -.34 | ||
| TGD youth | 6 to 8 | Both affluence groups | .39 | .47 | -.28 | -.31 |
| 9 and 10 | .29 | .35 | -.24 | -.29 | ||
| Both grade groups | Less | NS | .19 | -.17 | -.20 | |
| More | .41 | .48 | -.27 | -.33 | ||
| Overall | .34 | .38 | -.26 | -.31 | ||
- Overall, liking school had a weak correlation with the mental health indicators. Liking school was positively correlated with life satisfaction and well-being and negatively correlated with loneliness and health complaints for all students.
- Liking school was most strongly related to well-being.
- Among cisgender boys, liking school was more strongly related to the positive mental health indicators. Cisgender boys who are less affluent in grades 9 and 10 had moderate positive correlations between liking school and life satisfaction and well-being.
- For all cisgender girls, liking school was positively associated with well-being. More affluent cisgender girls in grades 6 to 8, in particular, had a moderate negative correlation between liking school and health complaints.
- More affluent TGD youth had moderate positive correlations between liking school and the positive mental health indicators.
Summary of findings
Encouraging findings
|
Areas of concern
|
Chapter 6: Community
Young people are actively involved in developing, participating within, and promoting the culture of their communities.Reference 47 During all periods of the life course including adolescence and young adulthood, active participation within the community benefits social well-being.Reference 48 Community involvement exists in various forms and can include civic engagement such as volunteering,Reference 49 recreational activities,Reference 50 or programming that is directly targeted to young people through national or grassroots community organizations.Reference 51
The neighbourhoods that youth live and spend time in are an important part of their community. A sense of neighbourhood belonging decreases engagement in risk taking behavioursReference 52 and adolescents’ perceptions of their neighbourhoods are associated with their mental health.Reference 53 Neighbourhood cohesion, which some have called “social capital”, can buffer against the effects of stressful life events such as depression and anxiety, suicidal ideation, and aggression.Reference 54 The ways in which young people interact with and perceive their communities play a critical role in their health.
Description of items
In the HBSC survey, various indicators of community supports are reported on. First, the community support scale is utilized. To compute this scale in its continuous form, responses to each item are reverse coded then added together to form a range of values from five (lower support) to 25 (higher support). Students are also asked about their perception of their neighbourhood’s safety by their agreement or disagreement with the statement “most people around here would try to take advantage of you if they got the chance.” Finally, students are asked to report on if they have volunteered in their communities.
Table 6.1. Community support scale items:
- People say ‘hello’ and often stop to talk to each other in the street.
- 1= Strongly disagree
- 2= Disagree
- 3= Neither agree nor disagree
- 4= Agree
- 5= Strongly agree
- You can trust people around here.
- 1= Strongly disagree
- 2= Disagree
- 3= Neither agree nor disagree
- 4= Agree
- 5= Strongly agree
- I could ask for help or a favour from neighbours.
- 1= Strongly disagree
- 2= Disagree
- 3= Neither agree nor disagree
- 4= Agree
- 5= Strongly agree
- It is safe for younger children to play outside during the day.
- 1= Strongly disagree
- 2= Disagree
- 3= Neither agree nor disagree
- 4= Agree
- 5= Strongly agree
- There are good places to spend your free time.
- 1= Strongly disagree
- 2= Disagree
- 3= Neither agree nor disagree
- 4= Agree
- 5= Strongly agree
Trends in perceived community support among boys
Figure 6.1. Mean score of perceived community support scale among boys, by grade and year of survey
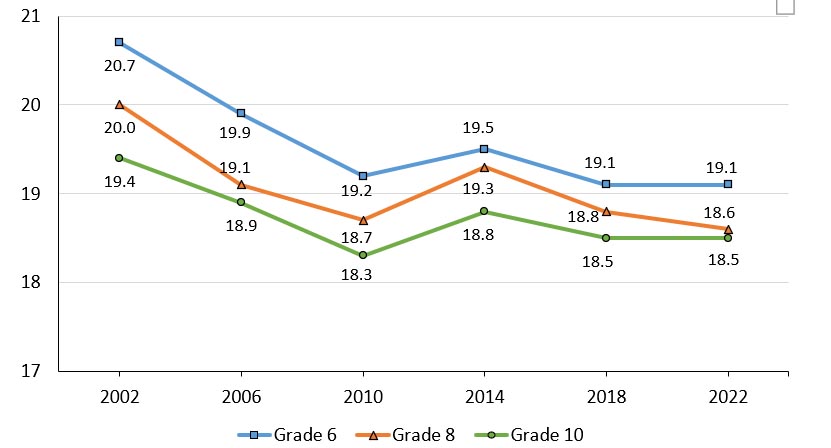
Note: When considering the above trends, estimates are provided for young people identifying as “boys” in all cycles.
Figure 6.1: Text description
| Grade level | 2002 | 2006 | 2010 | 2014 | 2018 | 2022 |
|---|---|---|---|---|---|---|
| Grade 6 | 20.7 | 19.9 | 19.2 | 19.5 | 19.1 | 19.1 |
| Grade 8 | 20.0 | 19.1 | 18.7 | 19.3 | 18.8 | 18.6 |
| Grade 10 | 19.4 | 18.9 | 18.3 | 18.8 | 18.5 | 18.5 |
Source: Health Behaviour in School-aged Children (HBSC), Canada |
||||||
- Generally, the perceived levels of community support among boys have decreased over time. Mean community support scores declined from 2002 to 2010, then seemed to plateau in the later cycles of the study.
Trends in perceived community support among girls
Figure 6.2. Mean score of perceived community support scale among girls, by grade and year of survey
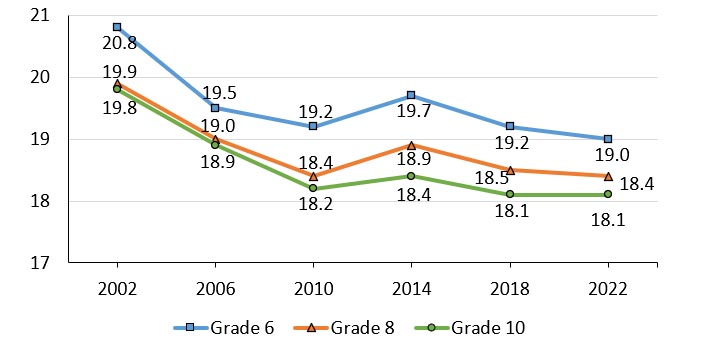
Note: When considering the above trends, estimates are provided for young people identifying as “girls” in all cycles.
Figure 6.2: Text description
| Grade level | 2002 | 2006 | 2010 | 2014 | 2018 | 2022 |
|---|---|---|---|---|---|---|
| Grade 6 | 20.8 | 19.5 | 19.2 | 19.7 | 19.2 | 19.0 |
| Grade 8 | 19.9 | 19.0 | 18.4 | 18.9 | 18.5 | 18.4 |
| Grade 10 | 19.8 | 18.9 | 18.2 | 18.4 | 18.1 | 18.1 |
Source: Health Behaviour in School-aged Children (HBSC), Canada |
||||||
- Generally, the perceived levels of community support among girls have decreased over time. Mean scores declined from 2002 to 2010, then appeared to plateau in the final three cycles of the study.
Neighbourhood trust
Figure 6.3. Students who agreed or strongly agreed that they can trust people in the area where they live, by grade and year of survey (%)
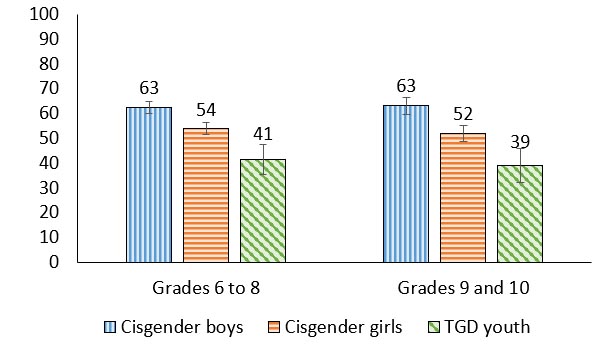
Figure 6.3: Text description
| Grade level | Cisgender boys | Cisgender girls | TGD youth |
|---|---|---|---|
| Grades 6 to 8 | 63 (60.1, 65.0) | 54 (51.6, 56.4) | 41 (35.5, 47.4) |
| Grades 9 to 10 | 63 (59.7, 66.3) | 52 (48.9, 55.2) | 39 (32.0, 46.0) |
Source: Health Behaviour in School-aged Children (HBSC), Canada, 2022 |
|||
- Between 39% and 63% of youth agreed or strongly agreed that they can trust people in the area where they live.
- Regardless of grade, compared to cisgender boys and cisgender girls, TGD youth had the smallest proportions of youth agreeing that they can trust people in the area where they live.
- In grades 6 to 8, 54% of cisgender girls reported that they can trust people in the area where they live, a proportion that was 9 percentage points lower than cisgender boys and 13 percentage points higher than TGD youth. This gendered pattern also was seen among grades 9 and 10 students.
“Myself and other girls don’t feel safe around strangers. TGD youth may not know if they can feel safe around certain people.”
Neighbourhood distrust
Figure 6.4. Students who agreed or strongly agreed that people in the area where they live would try to take advantage of them if they got the chance, by grade and year of survey (%)
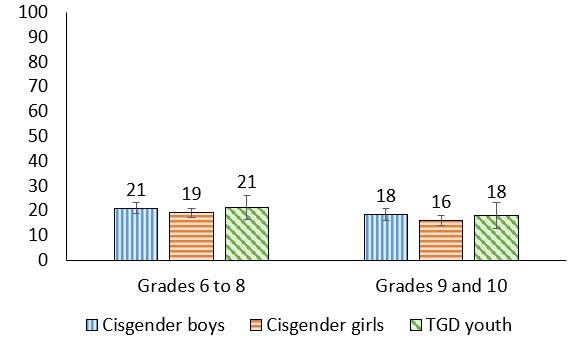
Figure 6.4: Text description
| Grade level | Cisgender boys | Cisgender girls | TGD youth |
|---|---|---|---|
| Grades 6 to 8 | 21 (18.8, 23.1) | 19 (17.2, 20.9) | 21 (16.3, 26.0) |
| Grades 9 to 10 | 18 (15.8, 20.8) | 16 (13.8, 18.0) | 18 (12.8, 23.1) |
Source: Health Behaviour in School-aged Children (HBSC), Canada, 2022 |
|||
- Between 16% and 21% of youth reported that they agree or strongly agree that people in their neighborhoods would take advantage of them if they got the chance. Differences by grade and gender were modest.
Trends in neighbourhood distrust among boys
Figure 6.5. Boys who agreed or strongly agreed that people in the area where they live would try to take advantage of them if they got the chance, by grade and year of survey (%)
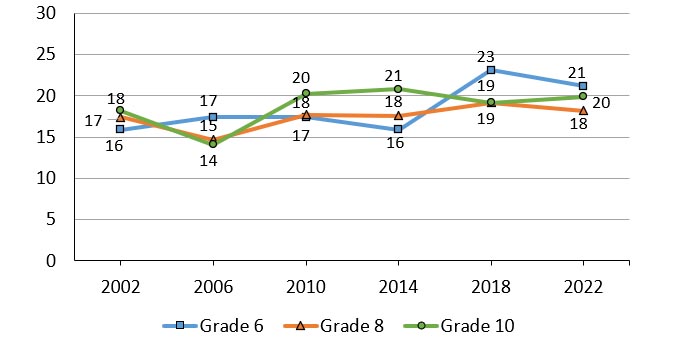
Note: When considering the above trends, estimates are provided for young people identifying as “boys” in all cycles.
Figure 6.5: Text description
| Grade level | 2002 | 2006 | 2010 | 2014 | 2018 | 2022 |
|---|---|---|---|---|---|---|
| Grade 6 | 16 | 17 | 17 | 16 | 23 | 21 |
| Grade 8 | 17 | 15 | 18 | 18 | 19 | 18 |
| Grade 10 | 18 | 14 | 20 | 21 | 19 | 20 |
Source: Health Behaviour in School-aged Children (HBSC), Canada |
||||||
- Over time, the proportion of grade 6 boys who reported that they agree or strongly agree that people in the area where they live would try to take advantage of them has increased.
- Trends over time for boys in grades 8 and 10 were less evident.
Trends in neighbourhood distrust among girls
Figure 6.6 Girls who agreed or strongly agreed that people in the area where they live would try to take advantage of them if they got the chance, by grade and year of survey (%)
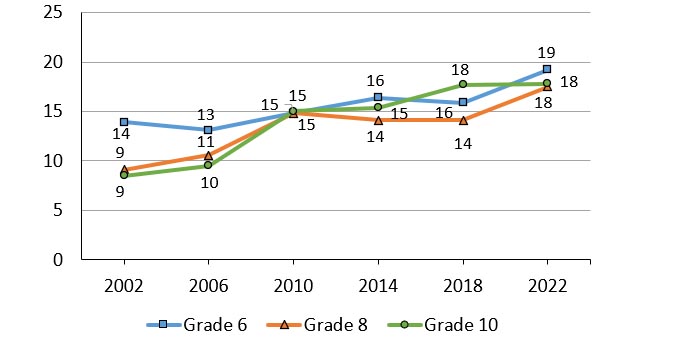
Note: When considering the above trends, estimates are provided for young people identifying as “girls” in all cycles.
Figure 6.6: Text description
| Grade level | 2002 | 2006 | 2010 | 2014 | 2018 | 2022 |
|---|---|---|---|---|---|---|
| Grade 6 | 14 | 13 | 15 | 16 | 16 | 19 |
| Grade 8 | 9 | 11 | 15 | 14 | 14 | 18 |
| Grade 10 | 9 | 10 | 15 | 15 | 18 | 18 |
Source: Health Behaviour in School-aged Children (HBSC), Canada |
||||||
- Overall, over time more girls agreed or strongly agreed that people in the area where they live would try to take advantage of them. This was particularly evident among girls in grade 6, where this proportion increased by 5 percentage points from a low of 14% in 2002 to a high of 19% in 2022. A similar trend was observed in girls in grade 8, increasing from a low of 9% in 2002 to a high of 18% in 2022, a 9 percentage point increase.
“There are often times when I do not feel comfortable walking alone in [my] neighbourhood and I'm 100% sure other girls feels the same way.”
Involved in volunteer work
Figure 6.7. Students who reported involvement in volunteer work, by grade and gender (%)
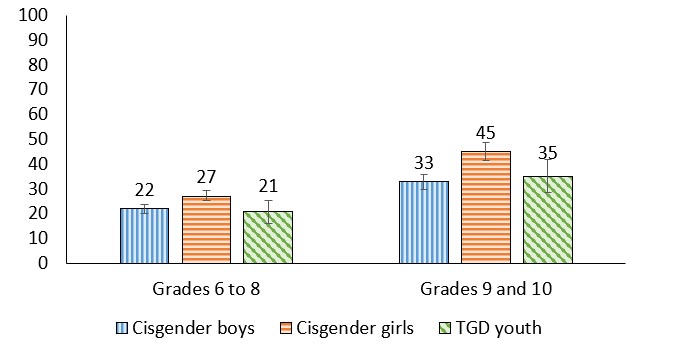
Figure 6.7: Text description
| Grade level | Cisgender boys | Cisgender girls | TGD youth |
|---|---|---|---|
| Grades 6 to 8 | 22 (20.1, 23.7) | 27 (25.3, 29.4) | 21 (15.9, 25.1) |
| Grades 9 to 10 | 33 (29.7, 35.9) | 45 (41.3, 48.8) | 35 (28.5, 41.8) |
Source: Health Behaviour in School-aged Children (HBSC), Canada, 2022 |
|||
- Cisgender girls reported the largest proportion of involvement in volunteer work (27% of cisgender girls in grades 6 to 8; 45% of cisgender girls in grades 9 and 10).
- Youth in grades 9 and 10 reported higher proportions of volunteering compared to youth in grades 6 to 8.
- The greatest percentage point increase between grade levels was among cisgender girls, from 27% reporting volunteerism in grades 6 to 8 to 45% of cisgender girls in grades 9 and 10, an 18 percentage point difference. This was followed by TGD youth where 21% reported volunteerism in grades 6 to 8 compared to 35% in grades 9 and 10, a 14 percentage point increase. Finally, among cisgender boys, 22% volunteered in grades 6 to 8 compared to 33% in grades 9 and 10, an 11 percentage point increase.
Community support and mental health
| Gender | Grade | Affluence | Positive indicators | Negative indicators | ||
|---|---|---|---|---|---|---|
| Life satisfaction | WHO-5 Well-being | Lonely | Health complaints | |||
| Cisgender boys | 6 to 8 | Less | .33 | .37 | -.37 | -.19 |
| More | .25 | .30 | -.22 | -.18 | ||
| 9 and 10 | Less | .28 | .32 | -.17 | -.24 | |
| More | .25 | .29 | -.19 | -.13 | ||
| Cisgender girls | 6 to 8 | Less | .50 | .43 | -.29 | -.35 |
| More | .27 | .30 | -.21 | -.17 | ||
| 9 and 10 | Less | .36 | .44 | -.40 | -.35 | |
| More | .29 | .30 | -.21 | -.16 | ||
| TGD youth | 6 to 8 | Both affluence groups | .44 | .34 | -.24 | -.20 |
| 9 and 10 | .23 | .33 | -.16 | -.19 | ||
| Both grade groups | Less | .50 | .46 | -.15 | -.25 | |
| More | .31 | .31 | -.20 | -.18 | ||
| Overall | .30 | .32 | -.24 | -.20 | ||
- Overall, community support was consistently associated with the mental health indicators. Community support was positively correlated with higher life satisfaction and well-being and negatively correlated with loneliness and health complaints for all students.
- Community support was more strongly correlated with the positive mental health indicators than the negative mental health indicators.
- Among TGD youth, those who are less affluent had moderate positive correlations between community support and the positive mental health indicators.
Summary of findings
Encouraging findings
- The proportion of youth that engaged in volunteering increased, as expected, with increased age and autonomy.
- Since 2010, community support has remained relatively stable for boys and girls. This is especially encouraging since community support is correlated with positive mental health indicators.
- Levels of community support were consistently associated with positive mental health outcomes.
Areas of concern
- Significantly fewer TGD youth agreed or strongly agreed that they trust people in the area where they live, when compared with cisgender boys and cisgender girls.
- There is a decrease in perceived community support over time which is especially pronounced in girls.
Chapter 7: Physical activity, screen time, and sleep
Physical activity encompasses all movement that occurs during leisure, as part of someone’s work, or in transit from one location to another.Reference 55 According to the Canadian 24-Hour Movement Guidelines, children and youth should engage in at least an average of 60 minutes of moderate-to-vigorous intensity physical activity per day and activities that strengthen muscle and bone should be incorporated at least three days per week.Reference 56 It is also recommended that several hours of structured, unstructured light and domestic/household physical activity should be incorporated into young people’s daily routines.Reference 56 The accumulation of adequate amounts of physical activity is associated with improved mental health,Reference 57 better cognitive functioning,Reference 57Reference 58 and lower chronic disease risk.Reference 59
In contrast to time spent being physically active, sedentary activity is the time that young people spend in an inactive state (e.g., watching TV, playing on an electronic device, and reading).Reference 60 As children age, their time spent being sedentary increases.Reference 61 Children from lower socioeconomic backgrounds and children who live in households that have access to multiple screens have higher levels of sedentary behaviour.Reference 61 Sedentary behaviour in youth is associated with higher risks for suicidal ideation,Reference 62 increased likelihood of substance use behaviours including higher frequency of cannabis use,Reference 63 and disrupted sleep patterns.Reference 64
During adolescence, sleep behaviour and physiology undergo significant changes.Reference 65 The Canadian 24-Hour Movement Guidelines recommend that those aged 5 to 13 years should sleep for nine to eleven hours per night and those aged 14 to 17 years should sleep for eight to ten hours per night.Reference 56 Additionally, this sleep should be uninterrupted, and children and youth should have consistent bed and wake-up times.Reference 56 Adequate and quality sleep is critical for emotional regulation, learning, memory, and cognition,Reference 65 while inadequate and disrupted sleep is associated with negative outcomes in several domains including school performance, risk-taking behaviours, and psychosocial health.Reference 66Reference 67
Description of items
In the HBSC survey, students are asked about the frequency and amount of time in which they engage in movement behaviours. This includes physical activity they get on a weekly basis broadly (students were asked to report the number of days they were physically active for a total of at least 60 minutes per day with response options ranging from 0 to 7 days), as well as specifying what physical activity they do outside of school time (students were asked to report how often outside of school hours they usually exercise in their free time so much that you get out of breath or sweat within the following response options: “everyday”, “4 to 6 times a week”, “3 times a week”, “2 times a week”, “once a week”, “once a month”, or “never”). Students were also asked about the physical activities they engage in and their mode of getting to school and if this was an active form of transport (i.e., walking, cycling, etc.).
In terms of sedentary behaviour, students reported their average screen time. Finally, student’s sleep habits are reported in terms of sleep duration, meeting the sleep recommendations, and frequency of sleep difficulties (students were asked to report how often they have trouble going to sleep or staying asleep within the following response options: “never”, “rarely”, “sometimes”, “most of the time”, or “all of the time”).
Physical activity in past week
Figure 7.1. Students who reported that they had been physically active each of the last 7 days for a total of at least 60 minutes per day, by grade and gender (%)
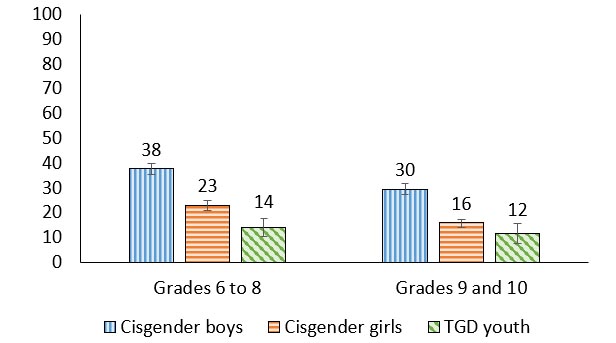
Figure 7.1: Text description
| Grade level | Cisgender boys | Cisgender girls | TGD youth |
|---|---|---|---|
| Grades 6 to 8 | 38 (35.5, 39.8) | 23 (21.0, 24.8) | 14 (10.2, 17.7) |
| Grades 9 to 10 | 30 (27.4, 31.9) | 16 (14.1, 17.3) | 12 (7.4, 15.6) |
Source: Health Behaviour in School-aged Children (HBSC), Canada, 2022 |
|||
- For cisgender students, the percentage of youth reporting that they had been physically active each of the last 7 days decreased by grade.
- 38% of cisgender boys in grades 6 to 8 reported that they had been physically active each of the last 7 days compared to 30% of cisgender boys in grades 9 and 10. Similarly, 23% of cisgender girls reported that they had been physically active each of the last 7 days compared to 16% of cisgender girls in grades 9 and 10.
- In grades 6 to 8, 38% of cisgender boys reported being physically active each of the last 7 days, which was 15 percentage points higher than cisgender girls and 24 percentage points higher than TGD youth. Cisgender girls also reported a higher proportion of physical activity than TGD youth (23% vs. 14%).
- In grades 9 and 10, 30% of cisgender boys reported being physically active each of the last 7 days, a proportion that was 14 percentage points higher than cisgender girls and 18 percentage points higher than TGD youth.
Physical activity outside of school
Figure 7.2. Students who reported that they had been physically active outside of school hours at least three times a week or more, by grade and gender (%)
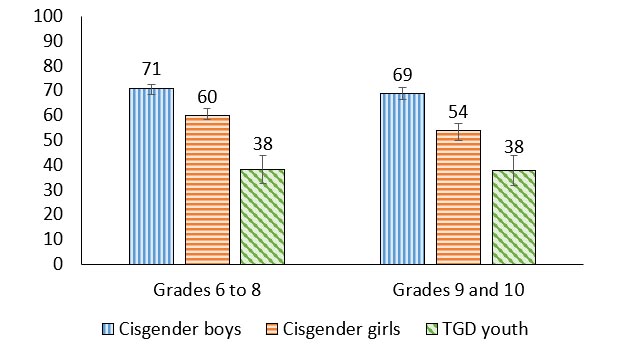
Figure 7.2: Text description
| Grade level | Cisgender boys | Cisgender girls | TGD youth |
|---|---|---|---|
| Grades 6 to 8 | 71 (68.4, 72.5) | 60 (58.2, 62.7) | 38 (32.5, 44.0) |
| Grades 9 to 10 | 69 (66.6, 71.3) | 54 (51.0, 56.9) | 38 (31.7, 43.8) |
Source: Health Behaviour in School-aged Children (HBSC), Canada, 2022 |
|||
- Across all grades, TGD youth reported the lowest proportions of being physically active outside of school, and cisgender boys reported the highest proportions.
- In grades 6 to 8, 71% of cisgender boys reported physical activity outside of school, which was 11 percentage points higher than cisgender girls and 33 percentage points than TGD youth. Similarly, in grades 9 and 10, more cisgender boys (69%) reported physical activity outside of school compared to cisgender girls (54%) and TGD youth (38%).
- For cisgender girls, the percentage who reported that they had been physically active outside of school decreased by grade (60% in grades 6 to 8 compared to 54% in grades 9 and 10, a 6 percentage point decline).
“The satisfaction of doing the exercise and knowing that you did something productive can contribute to your health.”
Physical activity engagement
| Item | Grades 6 to 8 | Grades 9 and 10 | ||||
|---|---|---|---|---|---|---|
| Cisgender boys | Cisgender girls | TGD youth | Cisgender boys | Cisgender girls | TGD youth | |
| Physical activity that makes you out of breath | 46 | 35 | 27 | 50 | 38 | 31 |
| Organized sports that are not part of gym class | 44 | 40 | 16 | 41 | 38 | 18 |
| Exercising that is not part of gym class or organized sports | 32 | 23 | 14 | 44 | 26 | 20 |
| Activities outdoors that are not part of gym class or organized sports | 45 | 30 | 24 | 35 | 21 | 19 |
| Using active ways like walking or cycling to get places | 32 | 25 | 22 | 34 | 32 | 30 |
- The most prevalent form of physical activity reported for cisgender boys and TGD youth, regardless of grade, was physical activity that makes you out of breath.
- For cisgender girls in grades 6 to 8, the most prevalent form of physical activity was organized sports not part of gym class. Among cisgender girls in grades 9 and 10 physical activity that makes you out of breath and organized sports that are not part of gym class were equally popular, at 38%.
- A smaller proportion of TGD youth reported engaging in each form of physical activity when compared to cisgender youth.
Active transportation to school
Figure 7.3. Students who reported that they use active transportation to get to school, by grade and gender (%)
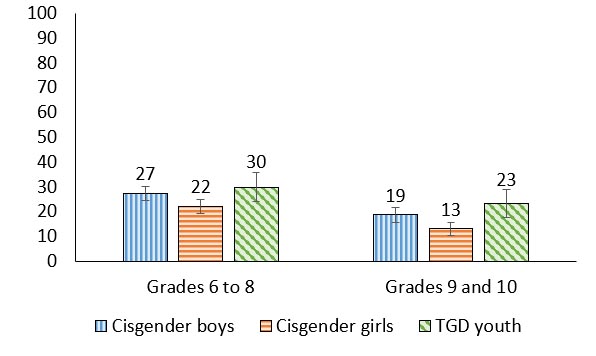
Figure 7.3: Text description
| Grade level | Cisgender boys | Cisgender girls | TGD youth |
|---|---|---|---|
| Grades 6 to 8 | 27 (24.6, 30.1) | 22 (19.3, 24.8) | 30 (24.0, 35.8) |
| Grades 9 to 10 | 19 (15.7, 21.8) | 13 (10.4, 15.5) | 23 (17.5, 29.0) |
Source: Health Behaviour in School-aged Children (HBSC), Canada, 2022 |
|||
- Using active transportation to get to school was reported less often among cisgender students in grades 9 and 10 compared to those in grades 6 to 8. 27% of cisgender boys reported using active transportation to get to school in grades 6 to 8 compared to 19% of cisgender boys in grades 9 and 10. Similarly, 22% of cisgender girls in grades 6 to 8 reported using active transportation to get to school compared to 13% in grades 9 and 10.
- 13% of cisgender girls in grades 9 and 10 reported using active transportation to get to school, a proportion 10 percentage points lower than TGD youth.
Screen time
Figure 7.4. Students who do not meet the recommended2 amount of daily screen time of two hours or less per day, by grade and gender (%)
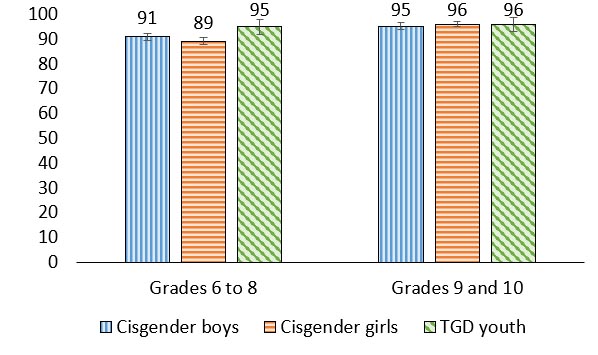
Figure 7.4: Text description
| Grade level | Cisgender boys | Cisgender girls | TGD youth |
|---|---|---|---|
| Grades 6 to 8 | 91 (89.6, 92.5) | 89 (87.7, 90.8) | 95 (92.0, 97.8) |
| Grades 9 to 10 | 95 (94.1, 96.7) | 96 (95.2, 97.0) | 96 (93.0, 98.7) |
Source: Health Behaviour in School-aged Children (HBSC), Canada, 2022 |
|||
- The vast majority (89%-96%) of youth in all groups did not meet the recommended amount of daily screen time of two hours per day.
Recommended hours of sleep
Figure 7.5. Students who meet the recommended amount of sleep per night,2 by grade and gender (%)
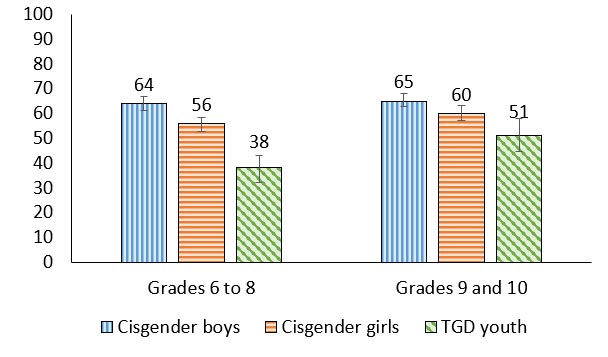
Figure 7.5: Text description
| Grade level | Cisgender boys | Cisgender girls | TGD youth |
|---|---|---|---|
| Grades 6 to 8 | 64 (61.2, 66.7) | 56 (52.9, 58.4) | 38 (32.2, 43.1) |
| Grades 9 to 10 | 65 (62.9, 67.9) | 60 (57.2, 63.1) | 51 (44.7, 58.1) |
Source: Health Behaviour in School-aged Children (HBSC), Canada, 2022 |
|||
- In grades 6 to 8, TGD youth were least likely to report that they had met the recommended amount of sleep per night. 38% of TGD youth reported that they met the recommended amount of sleep per night, a proportion that was 18 percentage points lower than cisgender girls and 26 percentage points lower than cisgender boys.
- In grades 9 and 10, 65% of cisgender boys reported that they met the recommended amount of sleep per night, a proportion that was 14 percentage points higher than TGD youth.
Trouble falling or staying asleep
Figure 7.6. Students who reported that they have trouble going to sleep or staying asleep most or all of the time, by grade and gender (%)
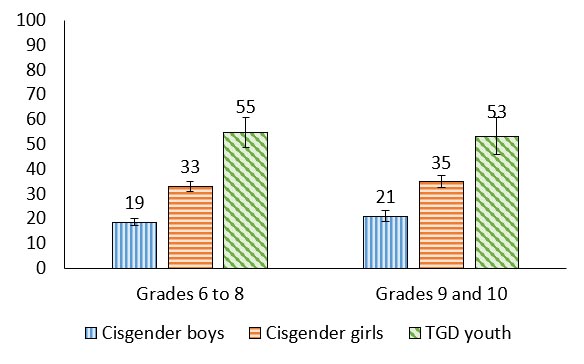
Figure 7.6: Text description
| Grade level | Cisgender boys | Cisgender girls | TGD youth |
|---|---|---|---|
| Grades 6 to 8 | 19 (17.1, 20.0) | 33 (31.0, 35.1) | 55 (48.7, 60.7) |
| Grades 9 to 10 | 21 (19.0, 23.2) | 35 (32.5, 37.4) | 53 (45.9, 60.7) |
Source: Health Behaviour in School-aged Children (HBSC), Canada, 2022 |
|||
- In general, TGD youth reported the highest proportions of trouble falling or staying asleep (55% in grades 6 to 8 and 53% in grades 9 and 10)
- Cisgender boys reported the lowest proportions with this indicator (19% in grades 6 to 8 and 21% in grades 9 and 10).
“I think falling asleep is a bigger problem as mental health is related to sleep. A lot of people going through anxiety and tough times may have trouble sleeping but are tired enough to sleep the entire night.”
Daytime sleepiness
Figure 7.7. Students who reported that they have trouble staying awake during the daytime when you want to be awake most or all of the time, by grade and gender (%)
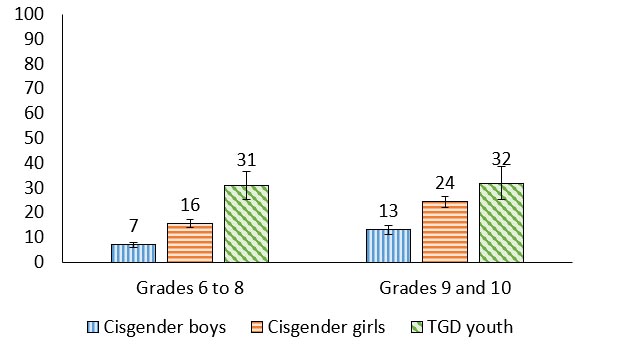
Figure 7.7: Text description
| Grade level | Cisgender boys | Cisgender girls | TGD youth |
|---|---|---|---|
| Grades 6 to 8 | 7 (5.9, 8.0) | 16 (13.8, 17.1) | 31 (25.4, 36.7) |
| Grades 9 to 10 | 13 (11.1, 14.8) | 24 (22.2, 26.5) | 32 (25.2, 38.4) |
Source: Health Behaviour in School-aged Children (HBSC), Canada, 2022 |
|||
- In general, cisgender boys reported the lowest proportions of daytime sleepiness.
- For cisgender boys and cisgender girls, the proportion of youth reporting daytime sleepiness increased with grade.
- For students in grades 6 to 8, 31% of TGD youth reported daytime sleepiness, a proportion that was 15 percentage points higher than cisgender girls and 24 percentage points higher than cisgender boys.
Extracurricular engagement
| Item | Grades 6 to 8 | Grades 9 and 10 | ||||
|---|---|---|---|---|---|---|
| Cisgender boys | Cisgender girls | TGD youth | Cisgender boys | Cisgender girls | TGD youth | |
| Organized team sports (e.g., hockey, soccer, basketball) | 64 | 53 | 29 | 51 | 43 | 18 |
| Organized individual sports (e.g., tennis, swimming, skating) | 32 | 39 | 26 | 28 | 29 | 18 |
| Arts groups (e.g., music, dance, drama) | 15 | 35 | 34 | 14 | 31 | 41 |
| Community groups (e.g., Scouts, Girl Guides, 4-H, cadets) | 9 | 9 | 13 | 8 | 7 | 13 |
| Church or other religious/spiritual group | 20 | 20 | 14 | 21 | 20 | 11 |
| Other activities or groups (e.g., chess, math, debate) | 23 | 16 | 20 | 18 | 16 | 24 |
- The most prevalent extracurricular activity reported by cisgender boys (64% in grades 6 to 8 and 51% in grades 9 and 10) and cisgender girls (53% in grades 6 to 8 and 43% in grades 9 and 10) was organized team sports.
- The most prevalent extracurricular activity reported by TGD youth was arts groups (34% in grades 6 to 8 and 41% in grades 9 and 10).
- The least prevalent extracurricular activity among all students, except TGD youth in grades 9 and 10, was engagement with community groups. For TGD youth in grades 9 and 10 the least prevalent extracurricular activity reported was church or other religious/spiritual groups.
- There was a decrease in reports of extracurricular engagement for youth in grades 9 and 10 compared to youth in grades 6 to 8, mainly driven by decreases in individual and team sports.
Physical activity at school in past week and mental health
| Gender | Grade | Affluence | Positive indicators | Negative indicators | ||
|---|---|---|---|---|---|---|
| Life satisfaction | WHO-5 Well-being | Lonely | Health complaints | |||
| Cisgender boys | 6 to 8 | Less | .28 | .29 | -.19 | -.13 |
| More | .20 | .27 | -.11 | -.08 | ||
| 9 and 10 | Less | .17 | .30 | -.15 | -.20 | |
| More | .19 | .26 | -.12 | -.04 | ||
| Cisgender girls | 6 to 8 | Less | .18 | .33 | -.26 | NS |
| More | .22 | .29 | -.14 | -.09 | ||
| 9 and 10 | Less | NS | .23 | NS | NS | |
| More | .18 | .24 | -.09 | -.06 | ||
| TGD youth | 6 to 8 | Both affluence groups | .20 | .24 | -.10 | -.18 |
| 9 and 10 | .15 | .12 | NS | NS | ||
| Both grade groups | Less | .24 | .23 | -.18 | NS | |
| More | .16 | .18 | NS | -.10 | ||
| Overall | .25 | .32 | -.19 | -.16 | ||
- Overall, physical activity at school was consistently associated with improved life satisfaction and well-being and negatively correlated with loneliness and health complaints for all students.
- Among all cisgender boys, cisgender girls, and younger and less affluent TGD youth, physical activity was weakly positively correlated with well-being.
- With increased grade, the correlation between physical activity and life satisfaction diminished.
- For older, less affluent cisgender boys there was a weak negative association between physical activity and health complaints.
- For younger, less affluent cisgender girls there was a weak negative association between physical activity and loneliness.
Physical activity outside of school and mental
| Gender | Grade | Affluence | Positive indicators | Negative indicators | ||
|---|---|---|---|---|---|---|
| Life satisfaction | WHO-5 Well-being | Lonely | Health complaints | |||
| Cisgender boys | 6 to 8 | Less | .12 | .26 | -.11 | NS |
| More | .14 | .23 | -.11 | -.04 | ||
| 9 and 10 | Less | NS | .15 | -.13 | -.25 | |
| More | .15 | .21 | -.05 | NS | ||
| Cisgender girls | 6 to 8 | Less | NS | .20 | -.16 | NS |
| More | .13 | .21 | -.08 | -.04 | ||
| 9 and 10 | Less | NS | .17 | NS | NS | |
| More | .15 | .22 | -.09 | NS | ||
| TGD youth | 6 to 8 | Both affluence groups | .23 | .29 | -.11 | -.14 |
| 9 and 10 | .22 | .18 | -.10 | -.09 | ||
| Both grade groups | Less | .27 | .29 | NS | NS | |
| More | .21 | .24 | -.12 | -.16 | ||
| Overall | .18 | .27 | -.14 | -.11 | ||
- Physical activity outside of school was positively correlated with life satisfaction and well-being and negatively correlated with loneliness and health complaints for all youth.
- TGD youth had the strongest relationships between physical activity outside of school and the positive mental health indicators.
- For more affluent cisgender girls, the relationship between physical activity outside of school and well-being was stronger compared to less affluent cisgender girls.
- Less affluent, cisgender boys in grades 9 and 10 were the only group of students who had a weak negative correlation between physical activity outside of school and health complaints.
Sleep trouble and mental health
| Gender | Grade | Affluence | Positive indicators | Negative indicators | ||
|---|---|---|---|---|---|---|
| Life satisfaction | WHO-5 Well-being | Lonely | Health complaints | |||
| Cisgender boys | 6 to 8 | Less | -.40 | -.40 | .44 | .51 |
| More | -.33 | -.34 | .35 | .47 | ||
| 9 and 10 | Less | -.25 | -.35 | .26 | .60 | |
| More | -.27 | -.32 | .35 | .47 | ||
| Cisgender girls | 6 to 8 | Less | -.42 | -.45 | .39 | .56 |
| More | -.36 | -.40 | .35 | .51 | ||
| 9 and 10 | Less | -.29 | -.37 | .36 | .43 | |
| More | -.32 | -.33 | .37 | .50 | ||
| TGD youth | 6 to 8 | Both affluence groups | -.34 | -.30 | .37 | .48 |
| 9 and 10 | -.39 | -.34 | .33 | .56 | ||
| Both grade groups | Less | -.47 | -.53 | .41 | .54 | |
| More | -.32 | -.29 | .35 | .49 | ||
| Overall | -.38 | -.41 | .41 | .53 | ||
- Overall, sleep trouble was negatively correlated with the positive mental health indicators and positively associated with the negative mental health indicators, for all youth.
- Among less affluent cisgender boys in grades 6 to 8, sleep trouble was also moderately positively associated with loneliness and moderately negatively associated with well-being.
- Among cisgender girls, those who are in grades 6 to 8 had stronger correlations between sleep trouble and the mental health indicators, compared to cisgender girls in grades 9 and 10.
- For less affluent cisgender girls in grades 6 to 8, sleep trouble was moderately negatively correlated with life satisfaction and well-being
- Among TGD youth, those who are less affluent had moderate correlations between sleep trouble and all of the mental health indicators.
Summary of findings
Encouraging findings
- Cisgender boys reported relatively high levels of physical activity. This is encouraging as physical activity is positively correlated with positive mental health indicators, especially well-being.
- Over half of cisgender youth met the recommended sleep amount guidelines.
- Arts groups (including dance) were an important area of extracurricular engagement for TGD youth, and could be an important potential source of physical activity.
Areas of concern
- Relative to cisgender boys, cisgender girls and TGD youth report low levels of physical activity. This is concerning given the many known benefits of physical activity to the health of young people.
- Relative to cisgender youth, TGD youth report high levels of sleep difficulties. This is especially concerning considering the correlations between sleep and indicators of mental health.
- The vast majority (89%-96%) of youth did not follow the recommended amount of daily screentime.
- Trouble falling or staying asleep was correlated with reductions in reports of positive mental health indicators, and increases in reports of negative indicators.
Chapter 8: Healthy eating
Consuming a well-balanced diet of fruits, vegetables, whole grains, and protein is important for maintaining good health.Reference 68 However, according to Canada’s Food Guide, healthy eating is more than just the foods you eat. It is also about being mindful of your eating habits, cooking more often, enjoying your food, and deciding who you eat your meals with.Reference 68 Encouraging habits of eating vegetables and fruits, limiting highly processed food, using food labels, making water your drink of choice, and becoming aware of the influence of food marketing are all ways of incorporating healthy eating into a young person’s daily routine.Reference 68
Like many other health behaviours, eating behaviours have the potential to shift during adolescence and present as an early indicator of eating habits in adulthood.Reference 69 Eating behaviours are influenced by an interplay of an individual’s physical environment, social environment, individual beliefs, and economic factors.Reference 70
Description of items
In this chapter, healthy eating is measured by examining consumption patterns of specific nutrients, frequency of eating breakfast and eating meals as a family (students were asked to report how often their family usually have meals together within the following response options: “everyday”, “most days”, “about once a week”, “less than once a week”, or “never”), as well as measures of hunger (students were asked how often they went to school or to bed hungry because there is not enough food at home within the following response items: “always”, “often”, “sometimes”, or “never”) and food insecurity. Finally, students reported on their teeth brushing habits.
Breakfast eating
Figure 8.1. Students who reported that they usually had breakfast (more than a glass of milk or fruit juice) every day on school days, by grade and gender (%)
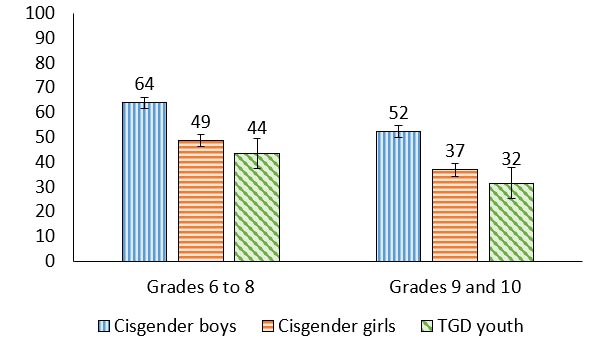
Figure 8.1: Text description
| Grade level | Cisgender boys | Cisgender girls | TGD youth |
|---|---|---|---|
| Grades 6 to 8 | 64 (61.7, 66.2) | 49 (46.1, 51.1) | 44 (37.4, 49.6) |
| Grades 9 to 10 | 52 (49.8, 54.7) | 37 (34.3, 39.3) | 32 (25.3, 37.8) |
Source: Health Behaviour in School-aged Children (HBSC), Canada, 2022 |
|||
- Among cisgender students in grades 9 and 10, there was a 12 percentage point reduction in reports of eating breakfast when compared to cisgender students in grades 6 to 8.
- Regardless of grade, more cisgender boys reported eating breakfast compared to cisgender girls. TGD youth reported the lowest levels of breakfast consumption.
“I know more people who don’t eat breakfast before school than who do …”
Hunger
Figure 8.2. Students who reported that they went to school or to bed hungry because there was not enough food at home at least sometimes, by grade and gender (%)
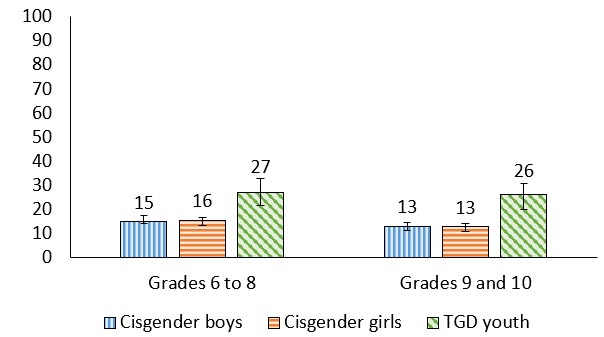
Figure 8.2: Text description
| Grade level | Cisgender boys | Cisgender girls | TGD youth |
|---|---|---|---|
| Grades 6 to 8 | 15 (14.2, 17.3) | 16 (13.8, 17.1) | 27 (21.6, 32.8) |
| Grades 9 to 10 | 13 (11.3, 14.6) | 13 (11.1, 14.4) | 26 (20.0, 30.9) |
Source: Health Behaviour in School-aged Children (HBSC), Canada, 2022 |
|||
- TGD youth reported the highest proportions of going to school or bed hungry at least sometimes (27% in grades 6 to 8; 26% in grades 9 and 10).
- The percentage of cisgender boys who reported that they went to school or bed hungry at least sometimes was approximately the same as the percentage for cisgender girls.
Food insecurity
Figure 8.3. Students reporting on the availability of food in their home (%)
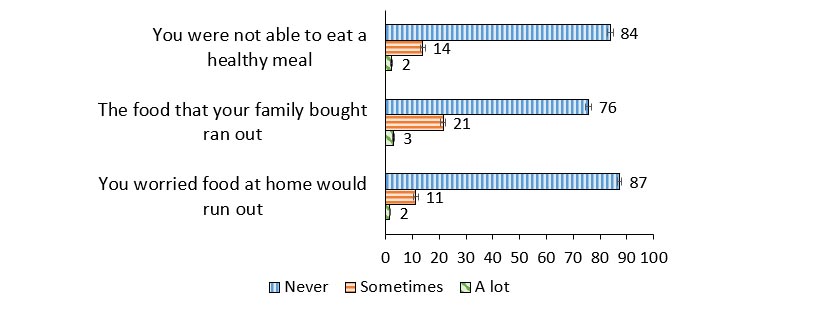
Figure 8.3: Text description
| Food availability indicator | Never | Sometimes | A lot |
|---|---|---|---|
| You were not able to eat a healthy meal | 84 | 14 | 2 |
| The food that your family bought ran out | 76 | 21 | 3 |
| You worried food at home would run out | 87 | 11 | 2 |
Source: Health Behaviour in School-aged Children (HBSC), Canada, 2022 |
|||
- When food security was described using three standard indicators, more than three-quarters of students reported living in a food secure home.
- 16% of students reported that they were not able to eat a healthy meal sometime or a lot.
- 24% reported that they ran out of food that their family bought sometimes or a lot.
- 13% of students reported that they worried about food at home running out sometimes or a lot.
Food security
Figure 8.4. Levels of food security reported among students (%)
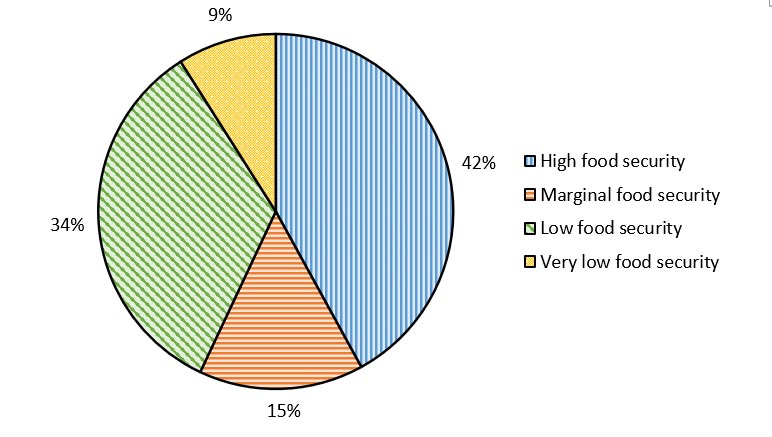
Figure 8.4: Text description
| Level of food security | Percentage |
|---|---|
| High | 42 |
| Marginal | 15 |
| Low | 34 |
| Very low | 9 |
Source: Health Behaviour in School-aged Children (HBSC), Canada, 2022 |
|
- When considered using the full food security index, 34% of students reported low food security and 9% reported very low food security.
Family meals
Figure 8.5. Students who reported that they have family meals most days or every day, by grade and gender (%)
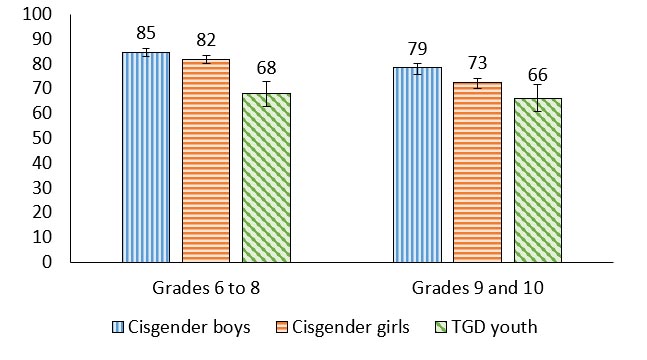
Figure 8.5: Text description
| Grade level | Cisgender boys | Cisgender girls | TGD youth |
|---|---|---|---|
| Grades 6 to 8 | 85 (83.4, 86.4) | 82 (80.2, 83.6) | 68 (32.8, 72.9) |
| Grades 9 to 10 | 79 (76.3, 80.7) | 73 (70.6, 74.5) | 66 (60.7, 71.8) |
Source: Health Behaviour in School-aged Children (HBSC), Canada, 2022 |
|||
- Between 66% and 85% of students reported that they have family meals most days or every day.
- Less cisgender students in grades 9 and 10 reported that they have family meals most or every day when compared to cisgender students in grades 6 to 8.
- Less TGD youth reported eating family meals compared to cisgender youth in both grade levels.
Tooth brushing
Figure 8.6. Students who reported that they brush their teeth more than once a day, by grade and gender (%)

Figure 8.6: Text description
| Grade level | Cisgender boys | Cisgender girls | TGD youth |
|---|---|---|---|
| Grades 6 to 8 | 61 (58.9, 63.6) | 72 (70.0, 74.2) | 48 (41.5, 53.7) |
| Grades 9 to 10 | 62 (59.2, 64.5) | 74 (71.1, 76.1) | 44 (37.1, 50.5) |
Source: Health Behaviour in School-aged Children (HBSC), Canada, 2022 |
|||
- Students’ teeth brushing habits did not significantly increase or decrease by grade.
- Cisgender girls reported the highest proportions of brushing their teeth more than once a day and TGD youth reported the lowest proportions.
- In grades 6 to 8, 72% of cisgender girls reported brushing their teeth more than once a day which was 11 percentage points more than cisgender boys and 24 percentage points more than TGD youth.
- Similarly, in grades 9 and 10, 74% of cisgender girls reported brushing their teeth more than once a day which was 12 percentage points more than cisgender boys and 30 percentage points more than TGD youth.
Consumption of healthy and unhealthy foods
Trends in consumption of healthy and unhealthy foods
Figure 8.7. Students who reported that they ate fruits, vegetables, sweets, and non-diet soft drinks once per day or more often, by year of survey (%)
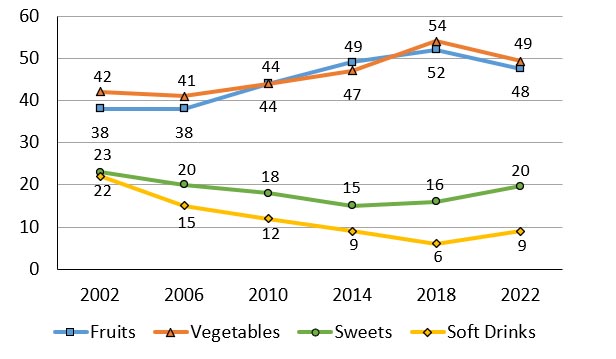
Figure 8.7: Text description
| Item | 2002 | 2006 | 2010 | 2014 | 2018 | 2022 |
|---|---|---|---|---|---|---|
| Fruits | 38 | 38 | 44 | 49 | 52 | 48 |
| Vegetables | 42 | 41 | 44 | 47 | 54 | 49 |
| Sweets | 23 | 20 | 18 | 15 | 16 | 20 |
| Soft Drinks | 22 | 15 | 12 | 9 | 6 | 9 |
Source: Health Behaviour in School-aged Children (HBSC), Canada |
||||||
- Over time, fruit and vegetable consumption has generally increased. However, in 2022, a decrease in consumption was reported with 49% of youth consuming vegetables compared to 54% in 2018, and 48% of youth consuming fruits compared to 52% in 2018.
- Over time, sweet and non-diet soft drink consumption has generally decreased. However, in 2022, slight increases in these indicators were reported.
Hunger and mental health
| Gender | Grade | Affluence | Positive indicators | Negative indicators | ||
|---|---|---|---|---|---|---|
| Life satisfaction | WHO-5 Well-being | Lonely | Health complaints | |||
| Cisgender boys | 6 to 8 | Less | -.20 | -.15 | .26 | .35 |
| More | -.17 | -.12 | .14 | .13 | ||
| 9 and 10 | Less | -.33 | -.23 | .25 | .36 | |
| More | -.19 | -.12 | .12 | .15 | ||
| Cisgender girls | 6 to 8 | Less | -.42 | -.29 | .20 | .25 |
| More | -.20 | -.12 | .15 | .17 | ||
| 9 and 10 | Less | -.36 | -.21 | .24 | .23 | |
| More | -.19 | -.13 | .11 | .19 | ||
| TGD youth | 6 to 8 | Both affluence groups | -.19 | -.08 | .19 | .08 |
| 9 and 10 | -.26 | NS | NS | .14 | ||
| Both grade groups | Less | -.33 | -.20 | .18 | .23 | |
| More | -.17 | NS | .09 | .07 | ||
| Overall | -.22 | -.14 | .15 | .17 | ||
- Overall, experiencing hunger was consistently associated with the mental health indicators. Hunger was negatively associated with life satisfaction and well-being and positively associated with loneliness and health complaints for all students.
- Students who were less affluent had the strongest associations between the mental health indicators and hunger.
Physical engagement in family meals and mental health
| Gender | Grade | Affluence | Positive indicators | Negative indicators | ||
|---|---|---|---|---|---|---|
| Life satisfaction | WHO-5 Well-being | Lonely | Health complaints | |||
| Cisgender boys | 6 to 8 | Less | .17 | .29 | -.18 | -.15 |
| More | .22 | .22 | -.19 | -.15 | ||
| 9 and 10 | Less | .40 | .36 | -.33 | -.45 | |
| More | .16 | .20 | -.16 | -.14 | ||
| Cisgender girls | 6 to 8 | Less | .46 | .45 | -.33 | -.42 |
| More | .30 | .29 | -.20 | -.21 | ||
| 9 and 10 | Less | .21 | .16 | -.24 | -.23 | |
| More | .23 | .22 | -.15 | -.21 | ||
| TGD youth | 6 to 8 | Both affluence groups | .28 | .23 | -.19 | -.23 |
| 9 and 10 | .20 | .23 | -.19 | -.22 | ||
| Both grade groups | Less | .22 | .24 | -.22 | -.20 | |
| More | .23 | .25 | -.18 | -.23 | ||
| Overall | .28 | .28 | -.23 | -.24 | ||
- Overall, the practice of eating family meals together was positively correlated with the positive mental health indicators and negatively correlated with the negative mental health indicators for all youth.
- These associations were especially pronounced for less affluent cisgender boys in grades 9 to 10, and less affluent cisgender girls in grades 6 to 8.
Summary of findings
Encouraging findings
- The majority (76% to 87%) of students reported they had never experienced specific indicators of food insecurity in their home. This is especially encouraging considering food security is associated with positive mental health.
- Over half of youth in Canada reported that they have family meals most days or every day. This practice is protective for mental health.
Areas of concern
- Overall, TGD students reported the lowest levels of health promoting eating behaviours.
- As cisgender students age, they were less likely to report eating breakfast.
- When compared to 2018, the prevalence of consuming fruits and vegetables declined in 2022, and the prevalence of consuming sweets and sugary soft drinks increased.
Chapter 9: Healthy weights
Weight fluctuations occur when there is an imbalance between the number of calories consumed and the amount of energy expended throughout the day. When caloric intake is higher than what a body uses, weight gain will occur, and this leads to situations of overweight and obesity. However, the causes of obesity are complex and include the interplay of genetic, environmental, and behavioural factors.Reference 71Reference 72 Obesity is associated with many chronic health conditions including type 2 diabetes, high cholesterol, non-alcoholic fatty liver disease, high blood pressure, depression, sleep apnea, and joint problems.Reference 71Reference 73 In addition, weight and weight perception is associated with outcomes in socially-oriented areas of young people’s lives such as experiencing bullying at schoolReference 74 and engaging in risk taking behaviours.Reference 75
Description of items
For the purposes of this report, body mass index (BMI) was used as the measure for reporting on healthy weight. BMI is calculated as weight (kg) divided by height squared (m2). In Canada, youth between the ages of 12 and 17 whose BMI falls out of the healthy weight ranges (as suggested by international classifications based on age and sex-specific cutpointsReference 76) are classified as “thin” (sometimes “underweight”), “overweight”, “obese”, or “severely obese.”Reference 77 Both height and weight were self-reported in this survey. In previous HBSC survey cycles conducted internationally, it has been reported that approximately half of respondents incorrectly estimated their weights.Reference 78 Over time, underestimation of weight has increased while overestimation of weight has decreased.Reference 79 Additionally, students were asked to report on if they had experienced being teased about their body weight and their body image perceptions.
Body mass index
Figure 9.1. Students with thinness, normal weight, overweight, or obesity, by grade and gender (%)
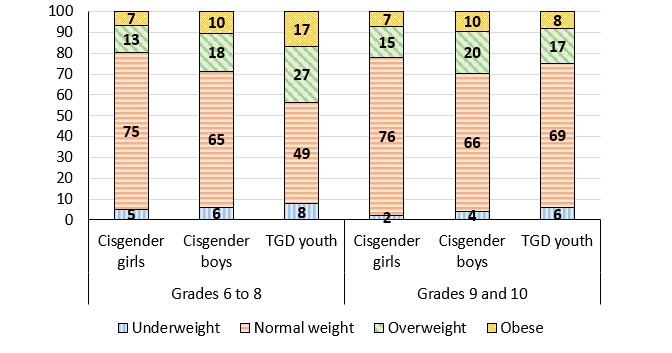
Figure 9.1: Text description
| Gender | Grade level | Underweight | Normal Weight | Overweight | Obesity |
|---|---|---|---|---|---|
| Cisgender Girls | Grade 6 to 8 | 5 | 75 | 13 | 7 |
| Grades 9 to 10 | 2 | 76 | 15 | 7 | |
| Cisgender Boys | Grades 6 to 8 | 6 | 65 | 18 | 10 |
| Grades 9 to 10 | 4 | 66 | 20 | 10 | |
| TGD Youth | Grade 6 to 8 | 8 | 49 | 27 | 17 |
| Grades 9 to 10 | 6 | 69 | 17 | 8 | |
Source: Health Behaviour in School-aged Children (HBSC), Canada, 2022 |
|||||
- The majority of cisgender boys and cisgender girls reported normal weight (between 65% and 77%).
- Irrespective of grade, compared to cisgender girls, more cisgender boys reported weights outside of the normal range.
- For grades 6 to 8, more TGD youth reported weights outside of the normal range compared to cisgender youth.
Trends in body mass index
Figure 9.2. Students who have a body mass index categorized as overweight or obese, by gender and year of survey (%)
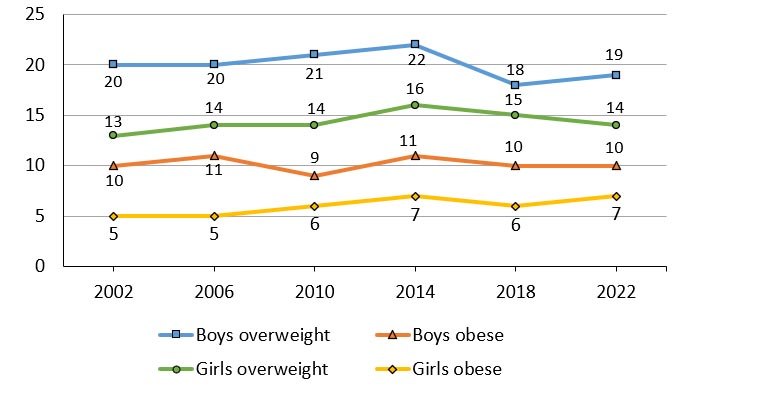
Note: When considering the above trends, estimates are provided for young people identifying as “boys” and “girls” in all cycles.
Figure 9.2: Text description
| Gender & BMI Category | 2002 | 2006 | 2010 | 2014 | 2018 | 2022 |
|---|---|---|---|---|---|---|
| Boys overweight | 20 | 20 | 21 | 22 | 18 | 19 |
| Boys obese |
10 | 11 | 9 | 11 | 10 | 10 |
| Girls overweight | 13 | 14 | 14 | 16 | 15 | 14 |
| Girls obese | 5 | 5 | 6 | 7 | 6 | 7 |
Source: Health Behaviour in School-aged Children (HBSC), Canada |
||||||
- Over the last six cycles of the HBSC study, students whose body mass index was categorized as overweight or obese has remained relatively stable.
- Compared to girls, boys consistently report higher proportions of body mass indexes that are categorized as overweight and obese.
“I think that there is a large problem [with healthy weights] in the cisgender boys. For them, it is stereotypical to want to have big muscles. In girls, they are always comparing their bodies and they want to be thinner which is not a good thing.”
Teased about body weight
Figure 9.3. Students who reported that they were made fun of because of their body weight more than once or twice in the last 12 months, by grade and gender (%)
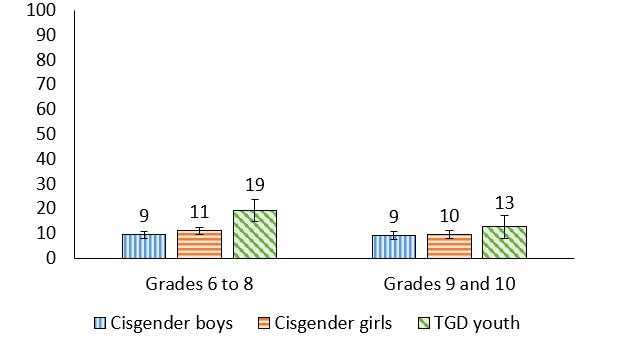
Figure 9.3: Text description
| Grade level | Cisgender boys | Cisgender girls | TGD youth |
|---|---|---|---|
| Grades 6 to 8 | 9 (8.0, 10.8) | 11 (9.7, 12.5) | 19 (14.6, 23.7) |
| Grades 9 to 10 | 9 (7.6, 10.5) | 10 (8.0, 11.0) | 13 (8.0, 17.1) |
Source: Health Behaviour in School-aged Children (HBSC), Canada, 2022 |
|||
- Between 9% and 13% of students in grades 9 and 10 reported being made fun of (i.e., teased) because of their body weight.
- In grades 6 to 8, 19% of TGD youth reported being made fun of because of their body weight, a proportion 8 percentage points higher than cisgender girls and 10 percentage points higher than cisgender boys.
“Definitely the expectation about your weight comes a lot from social media … if not it adds to the problem, and you get slammed if you don’t fill those expectations”
Body image
Figure 9.4. Students who reported that they thought their body was too thin, about the right size, or too fat, by grade and gender (%)
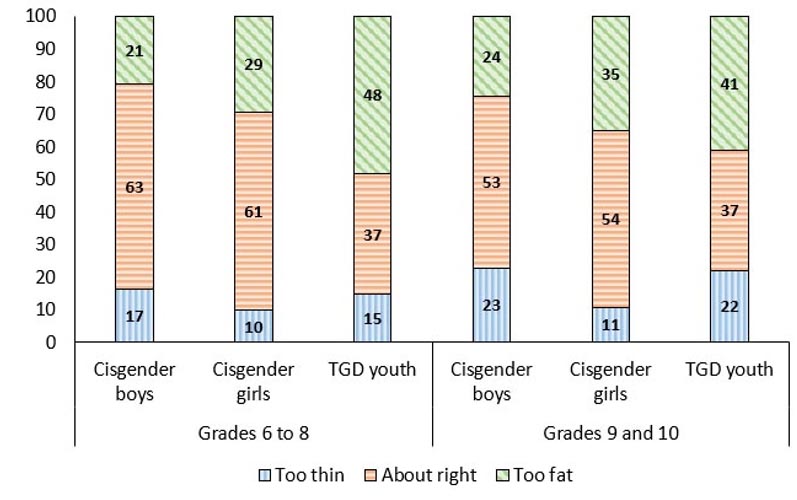
Figure 9.4: Text description
| Grade level | Gender | Too thin | About right | Too fat | |
|---|---|---|---|---|---|
| Grades 6 to 8 | Cisgender Boys | 17 | 63 | 21 | |
| Cisgender Girls | 10 | 61 | 29 | ||
| TGD Youth | 15 | 37 | 48 | ||
| Grades 9 to 10 | Cisgender Boys | 23 | 53 | 24 | |
| Cisgender Girls | 11 | 54 | 35 | ||
| TGD Youth | 22 | 37 | 41 | ||
Source: Health Behaviour in School-aged Children (HBSC), Canada, 2022 |
|||||
- Regardless of grade, when compared to cisgender students, more TGD youth reported that they thought they were too fat.
- Regardless of grade, when compared to cisgender girls and TGD youth, more cisgender boys reported they thought their body was too thin.
- Cisgender girls in grades 9 and 10 reported they thought they were too fat more than cisgender girls in grades 6 to 8 (35% vs. 29%, a 6 percentage point increase).
Body mass index by health complaints
Figure 9.5. Students reporting 2 or more of 8 subjective health complaints more than weekly by body mass index (underweight, normal weight, overweight, obese) and gender (%).
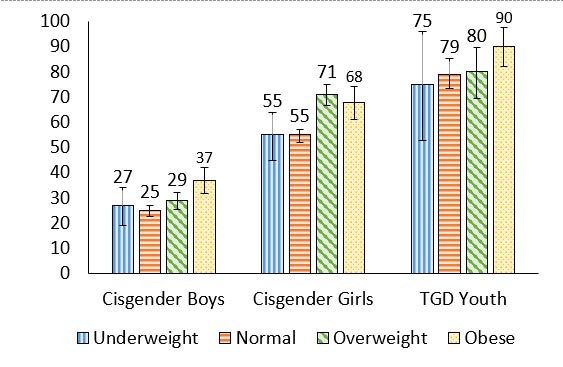
Figure 9.5: Text description
| Gender | Underweight | Normal | Overweight | Obese |
|---|---|---|---|---|
| Cisgender Boys | 27 (19.1, 34.0) | 25 (22.7, 26.9) | 29 (25.5, 32.0) | 37 (31.9, 41.9) |
| Cisgender Girls | 55 (45.0, 64.0) | 55 (52.0, 57.0) | 71 (66.6, 75.0) | 68 (61.3, 74.2) |
| TGD Youth | 75 (52.8, 96) | 79 (73.4, 85.4) | 80 (69.4, 89.6) | 90 (82.3, 97.8) |
Source: Health Behaviour in School-aged Children (HBSC), Canada, 2022 |
||||
- For all genders, overweight and obese youth reported more health complaints than youth who were underweight or normal weight.
- For cisgender girls, overweight youth reported more health complaints than normal weight cisgender girls.
Body mass index by WHO-5 well-being index
Figure 9.6. Students reporting better well-being according to the WHO-5 Well-being index by body mass index (underweight, normal weight, overweight, obese) and gender (%).

Figure 9.6: Text description
| Gender | Underweight | Normal | Overweight | Obese |
|---|---|---|---|---|
| Cisgender Boys | 80 (73.4, 85.7) | 80 (77.9, 81.8) | 74 (70.3, 77.4) | 66 (60.8, 71.2) |
| Cisgender Girls | 61 (51.3, 69.6) | 55 (52.7, 57.5) | 48 (42.3, 52.5) | 49 (42.4, 55.3) |
| TGD Youth | 25 (4.4, 44.6) | 28 (22.1, 34.3) | 25 (14.3, 35.5) | 29 (15.6, 42.1) |
Source: Health Behaviour in School-aged Children (HBSC), Canada, 2022 |
||||
- For cisgender youth, normal weight youth reported better well-being than overweight and obese youth.
- For cisgender boys, overweight youth reported better well-being than obese youth.
Body mass index by life satisfaction
Figure 9.7 Students reporting high life satisfaction (9 or greater) on a scale of 0 to 10 by body mass index (underweight, normal weight, overweight, obese) and gender (%).
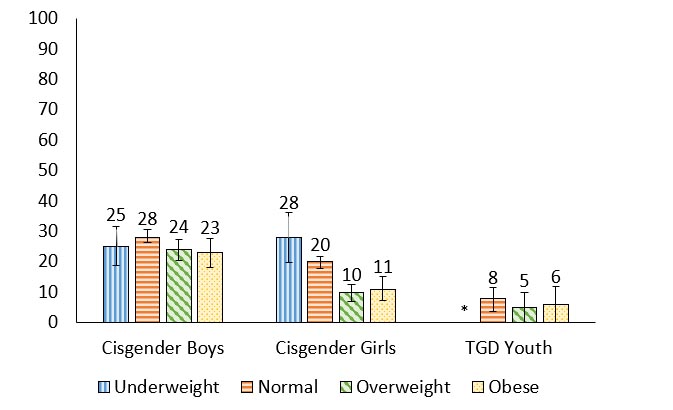
Figure 9.7: Text description
| Gender | Underweight | Normal | Overweight | Obese |
|---|---|---|---|---|
| Cisgender Boys | 25 (18.8, 31.6) | 28 (26.3, 30.5) | 24 (20.3, 27.3) | 23 (18.2, 27.6) |
| Cisgender Girls | 28 (19.8, 36.2) | 20 (17.8, 21.8) | 10 (6.8, 12.5) | 11 (7.1, 15.3) |
| TGD Youth | N/AFigure 9.7 Footnote * | 8 (3.5, 11.4) | 5 (0.0, 10) | 6 (0.0, 11.9) |
Source: Health Behaviour in School-aged Children (HBSC), Canada, 2022
|
||||
- For cisgender girls, underweight and normal weight youth reported higher life satisfaction than overweight and obese cisgender girls
- For cisgender boys, normal weight youth reported higher life satisfaction than overweight and obese cisgender boys.
Body mass index by loneliness
Figure 9.8. Students reporting that they felt lonely most of the time or always by body mass index (underweight, normal weight, overweight, obese) and gender (%).

Figure 9.8: Text description
| Gender | Underweight | Normal | Overweight | Obese |
|---|---|---|---|---|
| Cisgender Boys | 9 (5.1, 13.8) | 12 (10.1, 13.0) | 13 (10.3, 15.1) | 17 (13.5, 30.4) |
| Cisgender Girls | 27 (18.8, 34.7) | 29 (26.5, 31.3) | 34 (29.4, 38.2) | 42 (35.8, 47.8) |
| TGD Youth | 37 (15.2, 58.0) | 53 (46.3, 59.7) | 57 (43.5, 70.4) | 70 (56.4, 82.7) |
Source: Health Behaviour in School-aged Children (HBSC), Canada, 2022 |
||||
- For cisgender youth, obese youth reported more loneliness than youth who were normal weight or underweight.
Summary of findings
Encouraging findings
- The prevalence of boys and girls with a body mass index classified as overweight and obesity, while high, has not increased in recent HBSC cycles.
- Majorities of cisgender boys and cisgender girls continue to report a body mass index that was categorized as normal weight.
Areas of concern
- When compared to cisgender youth, TGD youth are more likely to report that they thought their body was too fat and be teased about their body weight.
Chapter 10: Injury and concussions
Injury remains a leading cause of death and disability in young people globally.Reference 80 Locations where injuries commonly occur among students include in the workplace due to inadequate training and hazard exposure,Reference 81 in sport participation,Reference 82 in motor vehicles or through road traffic,Reference 83 and in spaces where recreation activities occur.Reference 84
One specific type of injury of concern in adolescence is concussion injury. For young people who have experienced a concussion, various consequences are possible including missing school,Reference 85 psychological distress,Reference 86 and difficulties with cognitive tasks.Reference 87 For many, the symptoms following a concussion tend to resolve quickly. However, for those whose symptoms persist, a significant level of distress, decreased quality of life, and a loss of productivity can be experienced.
Description of items
In this report, students indicated whether they sustained an injury in the last 12 months that required medical treatment from a doctor or nurse (response options included: “I was not injured in the past 12 months”, “1 time”, “2 times”, “3 times”, “4 times or more”). Injuries that required a cast, surgery, stitches or staying in a hospital or health care centre overnight were classified as serious injuries. Information on the location where the student was when these injuries took place is also presented. Finally, students were asked to report if they were diagnosed by a medical professional with a concussion in the last 12 months (response options included: “no”, “yes, 1 time”, or “yes, more than 1 time”).
Medically treated injuries
Figure 10.1. Students who reported that they had sustained an injury requiring medical attention in the previous 12 months, by grade and gender (%)
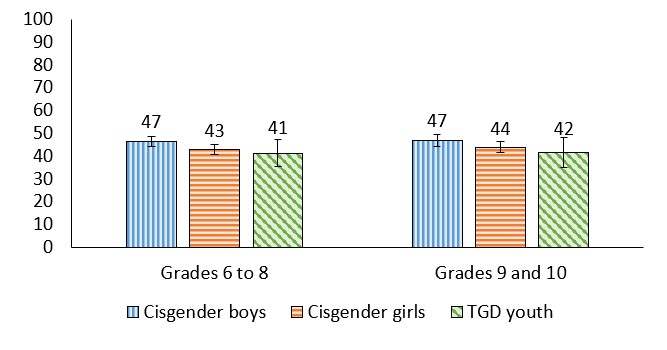
Figure 10.1: Text description
| Grade level | Cisgender boys | Cisgender girls | TGD youth |
|---|---|---|---|
| Grades 6 to 8 | 47 (44.3, 48.8) | 43 (40.8, 45.0) | 41 (35.3, 47.3) |
| Grades 9 to 10 | 47 (44.4, 49.5) | 44 (41.7, 46.2) | 42 (35.0, 48.1) |
Source: Health Behaviour in School-aged Children (HBSC), Canada, 2022 |
|||
- Between 41% and 47% of youth sustained an injury that required medical treatment in the previous 12 months. These prevalences were fairly stable across the different groups.
Trends in reporting serious injuries among boys
Figure 10.2. Boys who reported an injury in the past 12 months that required a cast, surgery, stitches or staying in a hospital or health care centre overnight, by grade and year of survey (%)
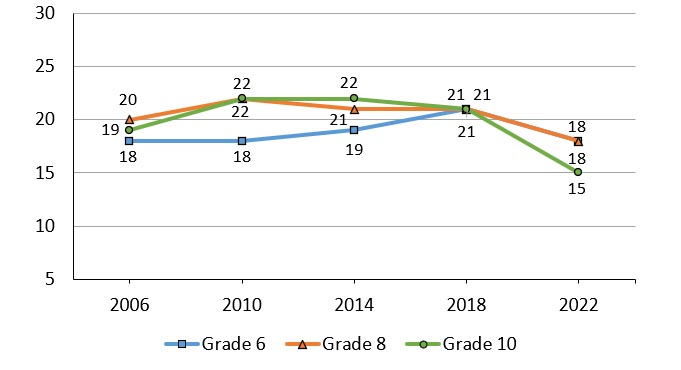
Note: When considering the above trends, estimates are provided for young people identifying as “boys” in all cycles.
Figure 10.2: Text description
| Grade level | 2006 | 2010 | 2014 | 2018 | 2022 |
|---|---|---|---|---|---|
| Grade 6 | 18 | 18 | 19 | 21 | 18 |
| Grade 8 | 20 | 22 | 21 | 21 | 21 |
| Grade 10 | 19 | 22 | 22 | 21 | 15 |
Source: Health Behaviour in School-aged Children (HBSC), Canada |
|||||
- In general, injuries among boys that were classified as serious (i.e., they required a cast, surgery, stitches, or overnight care in a health care centre) were reported less often in 2022 compared to 2018.
- In 2022, boys in grade 10 were less likely than their younger peers to report a serious injury (15% in grade 10 vs. 18% in grades 6 and 8).
Trends in reporting serious injuries among girls
Figure 10.3. Girls who reported an injury in the past 12 months that required a cast, surgery, stitches or staying in a hospital or health care centre overnight, by grade and year of survey (%)
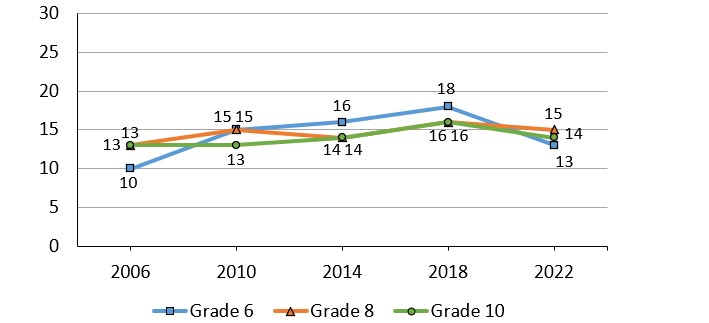
Note: When considering the above trends, estimates are provided for young people identifying as “girls” in all cycles.
Figure 10.3: Text description
| Grade level | 2006 | 2010 | 2014 | 2018 | 2022 |
|---|---|---|---|---|---|
| Grade 6 | 10 | 15 | 16 | 18 | 13 |
| Grade 8 | 13 | 13 | 14 | 16 | 14 |
| Grade 10 | 13 | 13 | 14 | 16 | 14 |
Source: Health Behaviour in School-aged Children (HBSC), Canada |
|||||
- In general, injuries among girls that were classified as serious (i.e. required a cast, surgery, stitches, or overnight care in a health care centre) were reported less often in 2022 compared to the previous cycle.
- Although girls reported fewer injuries than boys in 2022, there is less of a gender difference in 2022 than in previous HBSC cycles.
“I had a friend that was injured, and she was really loved, she had people helping her get from class to class, but it made me reflect and think that if you don’t have that support system that you may really struggle being alone while dealing with your injury.”
Location of injuries among cisgender boys
Figure 10.4. Cisgender boys who reported where their one most serious injury in the past 12 months happened, by grade (%)
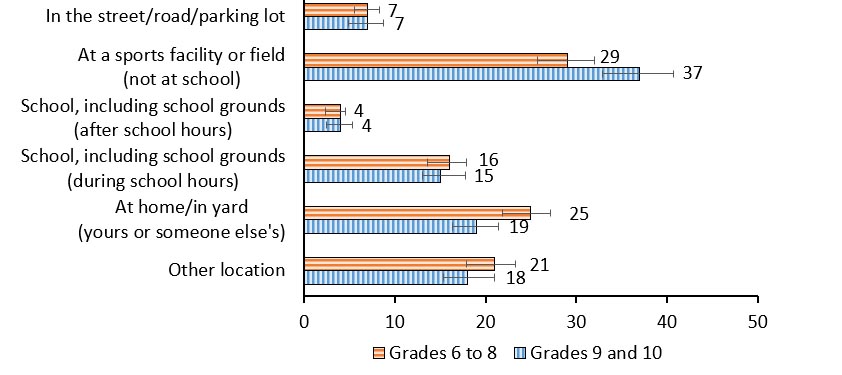
Figure 10.4: Text description
| Injury location | Grades 6 to 8 | Grades 9 to 10 |
|---|---|---|
| At a sports facility or field (not at school) | 29 | 37 |
| At home/in yard (yours or someone else’s) | 25 | 19 |
| School, including school grounds (during school hours) | 16 | 15 |
| In the street/road/parking | 7 | 7 |
| School, including school grounds (after school hours) | 4 | 4 |
| Other location | 21 | 18 |
Source: Health Behaviour in School-aged Children (HBSC), Canada, 2022 |
||
- The most prevalent location of their most serious injury for cisgender boys was at a sports facility or field (not at school) and at home/in yard.
- The least prevalent location of their most serious injury for cisgender boys was school (after school hours).
Location of injuries among cisgender girls
Figure 10.5. Cisgender girls who reported where their one most serious injury in the past 12 months happened, by grade (%)
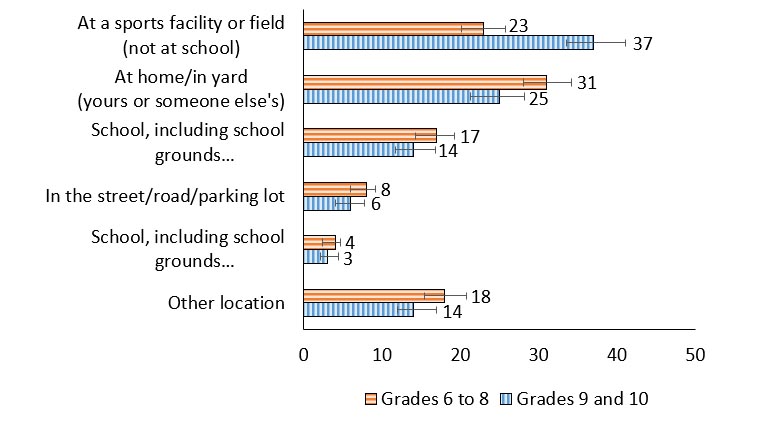
Figure 10.5: Text description
| Injury location | Grades 6-8 | Grades 9-10 |
|---|---|---|
| At a sports facility or field (not at school) | 23 | 37 |
| At home/in yard (yours or someone else’s) | 31 | 25 |
| School, including school grounds (during school hours) | 17 | 14 |
| In the street/road/parking | 8 | 6 |
| School, including school grounds (after school hours) | 4 | 3 |
| Other location | 18 | 14 |
Source: Health Behaviour in School-aged Children (HBSC), Canada, 2022 |
||
- For cisgender girls in grades 6 to 8 the most prevalent location of their most serious injury was at home/in yard.
- For cisgender girls in grades 9 and 10, a sports facility or field was the most prevalent location of their most serious injury.
- Regardless of grade, the least prevalent location of serious injury for cisgender girls was school (after school hours).
Concussion
Figure 10.6. Students reporting that they had a concussion in the last 12 months, by grade and gender (%)
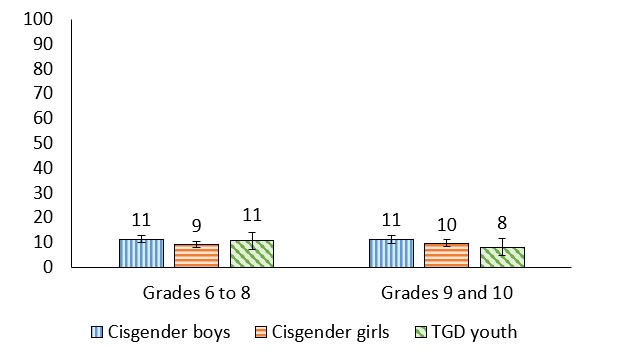
Figure 10.6: Text description
| Grade level | Cisgender boys | Cisgender girls | TGD youth |
|---|---|---|---|
| Grades 6 to 8 | 11 (10.0, 12.8) | 9 (7.7, 10.3) | 11 (7.1, 14.0) |
| Grades 9 to 10 | 11 (9.7, 12.8) | 10 (8.1, 10.9) | 8 (4.6, 11.5) |
Source: Health Behaviour in School-aged Children (HBSC), Canada, 2022 |
|||
- Between 8% and 11% of youth reported that they had had a concussion in the last 12 months.
“I had a concussion, and it was not a fun experience, I was out for a week, my sister fell off her bike and she was out too, but the big thing is the long term consequences, I’m still dealing with light sensitivity and it was a year ago.”
Any medically treated injury and mental health
| Gender | Grade | Affluence | Positive indicators | Negative indicators | ||
|---|---|---|---|---|---|---|
| Life satisfaction | WHO-5 Well-being | Lonely | Health complaints | |||
| Cisgender boys | 6 to 8 | Less | -.09 | .10 | .14 | .30 |
| More | -.06 | NS | .05 | .11 | ||
| 9 and 10 | Less | -.21 | -.18 | NS | .25 | |
| More | NS | .07 | NS | .15 | ||
| Cisgender girls | 6 to 8 | Less | -.28 | -.23 | .13 | .36 |
| More | -.10 | -.04 | .13 | .21 | ||
| 9 and 10 | Less | -.09 | NS | .17 | .20 | |
| More | -.08 | NS | .09 | .24 | ||
| TGD youth | 6 to 8 | Both affluence groups | -.14 | NS | NS | .08 |
| 9 and 10 | -.09 | -.11 | NS | .22 | ||
| Both grade groups | Less | -.25 | -.18 | NS | .37 | |
| More | NS | NS | NS | .08 | ||
| Overall | -.08 | -.01 | .07 | .16 | ||
- Overall, experiencing a medically treated injury was not strongly associated with the mental health indicators. Medically treated injury was negatively correlated with life satisfaction and positively correlated with the negative mental health indicators for all youth.
- TGD youth who are less affluent had a weak negative correlation between medically treated injury and life satisfaction and a weak positive association between medically treated injury and health complaints.
Concussion and mental health
| Gender | Grade | Affluence | Positive indicators | Negative indicators | ||
|---|---|---|---|---|---|---|
| Life satisfaction | WHO-5 Well-being | Lonely | Health complaints | |||
| Cisgender boys | 6 to 8 | Less | -.22 | NS | .12 | .26 |
| More | -.11 | -.04 | .07 | .09 | ||
| 9 and 10 | Less | -.27 | NS | .15 | .31 | |
| More | NS | NS | NS | .15 | ||
| Cisgender girls | 6 to 8 | Less | -.32 | -.22 | .18 | .18 |
| More | -.09 | .04 | .11 | .18 | ||
| 9 and 10 | Less | NS | NS | NS | .13 | |
| More | -.05 | NS | .07 | .16 | ||
| TGD youth | 6 to 8 | Both affluence groups | NS | NS | NS | .12 |
| 9 and 10 | NS | .14 | -.22 | NS | ||
| Both grade groups | Less | NS | NS | NS | NS | |
| More | NS | NS | NS | NS | ||
| Overall | -.09 | -.02 | .06 | .12 | ||
- Overall, experiencing a concussion was inconsistently associated with the mental health indicators. Concussions were negatively associated with life satisfaction and positively associated with health complaints for all youth.
- Among less affluent cisgender boys, a weak negative correlation was found between experiencing a concussion and life satisfaction, with a weak positive correlation between concussion and health complaints.
- Cisgender girls who are less affluent in grades 6 to 8 reported weak negative correlations between concussions and the positive mental health indicators.
- TGD youth who are in grades 9 and 10 reported a weak negative correlation between loneliness and concussion.
Summary of findings
Encouraging findings
- Compared to years past, reports of injuries decreased in the 2022 survey cycle.
- While any medically treated injury and concussion is concerning, there do not appear to be any differences in prevalence by grade or gender.
Areas of concern
- 1 in 10 youth experiencing concussion is concerning, due to its short-term effects on health and the ability to participate in activities, as well as their long-term effects and their known correlation with mental health outcomes.
Chapter 11: Bullying and teen dating violence
Bullying is a relationship issue that stems from power imbalances and occurs through repetitive acts and behaviours that are intended to cause harm to another individual.Reference 88 Bullying exists in various forms such as verbal, relational, physical, and through cyber platforms.Reference 89 Bullying often targets students based on perceived differences, such as through a student’s self-identified or perceived gender, sexuality, class, or ethnicity.Reference 90
Being a part of the bullying relationship, either as the victim, perpetrator, or victim/perpetrator, is associated with poor mental health outcomes such as anxiety, depression, low life satisfaction, and feeling sad or hopeless.Reference 91Reference 92Reference 93 Bullying also has negative outcomes for children in school as those who are victimized were found to have poorer school performance and school connectedness.Reference 94
Teen dating violence is harm that is intentionally caused to a dating partner either physically, emotionally, and/or virtually. In a recent national report, over one in three youth who had dated experienced and/or used such violence in the past 12 months.Reference 95 Victimization and perpetration of teen dating violence was most common among gender-diverse youth and those who experience social marginalization.Reference 95 When investigating the patterns between this violence and bullying, youth who both used and experienced violence in the context of their peers were more likely to use and experience violence in their romantic relationships.Reference 96 Teen dating violence is especially concerning as it is a predictor of intimate partner violence in adulthood.Reference 97
Description of items
In the HBSC survey students are first asked various questions pertaining to their experiences with bullying. First students are asked about victimization in terms of frequency (response options included: “I have not been bullied at school in the past couple of months”, “it has happened once or twice”, “2 or 3 times a month”, “about once a week”, or “several times a week”), how they were bullied, and reasons that they were bullied. Next students are asked about the frequency of perpetrating bullying of their peers. As adolescents spend more time on social media and the internet, questions regarding cyberbullying have been incorporated into the survey. Students were asked to report how often they have been cyberbullied in the past couple of months within the following response options: “I have not been cyberbullied in the past couple of months”, “it has happened once or twice”, “2 or 3 times a month”, “about once a week”, “or several times a week”. Finally, students in grades 9 and 10 are asked about their experiences with teen dating violence.
Experienced bullying
Figure 11.1. Students who reported being bullied at school in the past couple of months, by grade and gender (%)

Figure 11.1: Text description
| Grade level | Gender | Two or three times a month | Once a week | Several times a week |
|---|---|---|---|---|
| Grades 6 to 8 | Cisgender Boys | 10 (8.8, 11.2) | 8 (6.6, 8.7) | 14 (12.7, 16.2) |
| Cisgender Girls | 13 (11.4, 13.9) | 11 (9.4, 11.9) | 16 (14.2, 17.9) | |
| TGD Youth | 16 (7.90, 15.6) | 12 (11.8, 20.5) | 28 (22.6. 33.6) | |
| Grades 9 to 10 | Cisgender Boys | 8 (6.6, 9.7) | 7 (6.0, 8.6) | 13 (11.0, 14.6) |
| Cisgender Girls | 14 (12.1, 15.6) | 10 (8.1, 11.3) | 13 (11.1, 14.1) | |
| TGD Youth | 15 (9.9, 19.7) | 16 (11.3, 20.4) | 20 (14.8, 24.2) | |
Source: Health Behaviour in School-aged Children (HBSC), Canada, 2022 |
||||
- In grades 6 to 8, 28% of TGD youth reported being bullied at school several times a week, a proportion that was 12 percentage points higher than cisgender girls and 14 percentage points higher than cisgender boys.
How students were bullied
| Item | Grades 6 to 8 | Grades 9 and 10 | ||||
|---|---|---|---|---|---|---|
| Cisgender boys | Cisgender girls | TGD youth | Cisgender boys | Cisgender girls | TGD youth | |
| I was called mean names | 18 | 22 | 36 | 14 | 16 | 24 |
| Other students left me out | 13 | 18 | 30 | 9 | 14 | 25 |
| I was hit, kicked | 12 | 8 | 17 | 7 | 5 | 5 |
| Other students told lies | 13 | 18 | 21 | 9 | 16 | 15 |
| Other students made sexual jokes | 9 | 10 | 27 | 8 | 13 | 18 |
- The most prevalent type of bullying that youth experienced was being called mean names.
- Overall, when compared to students in grades 6 to 8, the prevalence of all types of bullying decreased in grades 9 and 10, except for cisgender girls who reported an increase in experiences involving other students making sexual jokes about them.
- TGD students, compared to cisgender students, had the highest proportions of youth being bullied in these ways.
Reasons students were bullied
| Item | Grades 6 to 8 | Grades 9 and 10 | ||||
|---|---|---|---|---|---|---|
| Cisgender boys | Cisgender girls | TGD youth | Cisgender boys | Cisgender girls | TGD youth | |
| Body weight | 9 | 11 | 19 | 9 | 9 | 13 |
| Race or skin colour | 5 | 5 | 4 | 6 | 5 | 7 |
| Religion | 4 | 4 | 4 | 5 | 3 | 6 |
| Gender identity | 3 | 3 | 28 | 2 | 2 | 28 |
| Sexual orientation | 3 | 5 | 27 | 4 | 4 | 23 |
- TGD youth were the most likely to be bullied in these manners, especially about their body weight, gender identity and sexual orientation
- The most prevalent reason for being bullied among cisgender boys and cisgender girls was body weight.
Participated in bullying others
Figure 11.2. Students who reported taking part in bullying others at least two or three times a month in the last couple of months, by grade and gender (%)

Figure 11.2: Text description
| Grade level | Cisgender boys | Cisgender girls | TGD youth |
|---|---|---|---|
| Grades 6 to 8 | 7 (5.7, 8.1) | 6 (4.5, 6.5) | 4 (1.8, 6.2) |
| Grades 9 to 10 | 9 (7.7, 11.0) | 6 (4.3, 6.7) | 4 (1.3, 6.2) |
Source: Health Behaviour in School-aged Children (HBSC), Canada, 2022 |
|||
- In both grade levels, cisgender boys reported bullying others most often, and TGD reported bullying others least often.
Trends in bullying
Figure 11.3. Students reporting if they have experienced bullying, have bullied others, or both, by year of survey (%)
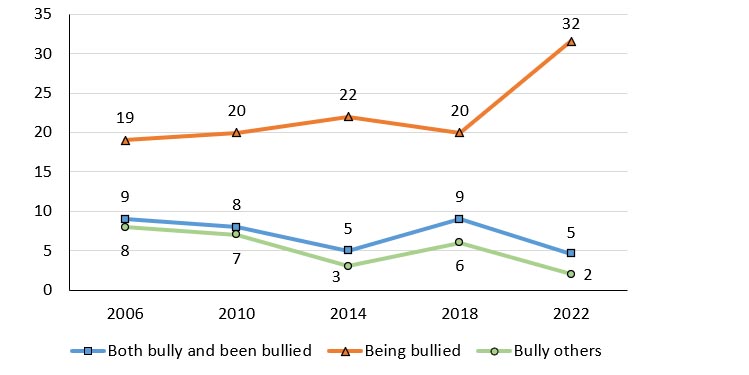
Figure 11.3: Text description
| Bullying experience | 2006 | 2010 | 2014 | 2018 | 2022 |
|---|---|---|---|---|---|
| Both bully and been bullied | 9 | 8 | 5 | 9 | 5 |
| Being bullied | 19 | 20 | 22 | 20 | 32 |
| Bully others | 8 | 7 | 3 | 6 | 2 |
Source: Health Behaviour in School-aged Children (HBSC), Canada |
|||||
- In 2022, 32% of students reported being bullied, a 12 percentage point increase from 2018. This is the highest recorded prevalence since the HBSC survey began collecting information regarding bullying in Canada.
- In 2022, there was a 4 percentage point decline in students who reported bullying others and being both bullied and bullying when compared to 2018. 5% of students reported being both bullied and bullying and 2% of students reported bullying others.
Experienced cyberbullying
Figure 11.4. Students who have been cyberbullied in the past two months, by grade and gender (%)
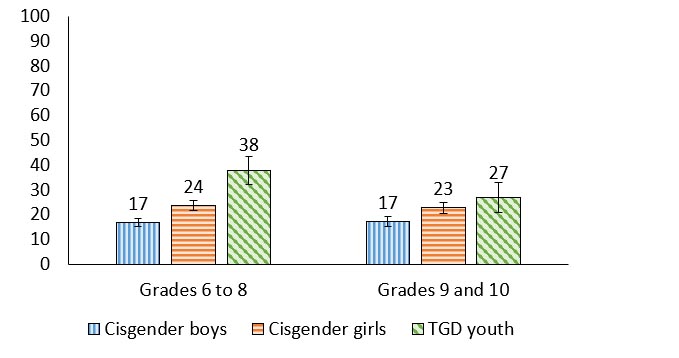
Figure 11.4: Text description
| Grade level | Cisgender boys | Cisgender girls | TGD youth |
|---|---|---|---|
| Grades 6 to 8 | 17 (15.2, 18.5) | 24 (21.5, 25.8) | 38 (32.2, 43.4) |
| Grades 9 to 10 | 17 (15.1, 19.2) | 23 (20.6, 25.0) | 27 (21.0, 33.1) |
Source: Health Behaviour in School-aged Children (HBSC), Canada, 2022 |
|||
- In grades 6 to 8, 38% of TGD youth reported being cyberbullied, a proportion that was 14 percentage points higher than cisgender girls, and 21 percentage points higher than cisgender boys.
- This pattern remained in grades 9 and 10, with 27% of TGD youth reporting being cyberbullied.
Participated in cyberbullying others
Figure 11.5. Students who have cyberbullied another student(s) in the past two months, by grade and gender (%)
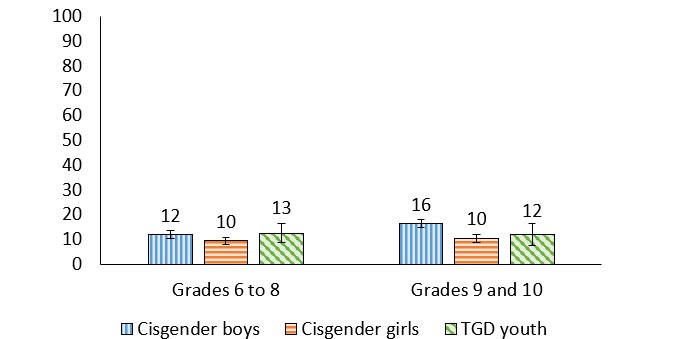
Figure 11.5: Text description
| Grade level | Cisgender boys | Cisgender girls | TGD youth |
|---|---|---|---|
| Grades 6 to 8 | 12 (10.4, 13.5) | 10 (8.0, 10.9) | 13 (8.7, 16.3) |
| Grades 9 to 10 | 16 (14.7, 18.1) | 10 (8.9, 11.9) | 12 (7.4, 16.3) |
Source: Health Behaviour in School-aged Children (HBSC), Canada, 2022 |
|||
- Between 10% and 16% of students reported cyberbullying others.
- The proportion of cisgender boys that reported cyberbullying others was higher in grades 9 and 10 compared with grades 6 to 8 (12% vs. 16%).
Teen dating violence victimization
Figure 11.6. Grade 9 and 10 students who reported they had been victims of teen dating violence in the last 12 months, by gender (%)

Figure 11.6: Text description
| Violence type | Cisgender boys | Cisgender girls | TGD youth |
|---|---|---|---|
| Physical | 5 (4.3, 6.5) | 6 (5.0, 7.5) | 13 (8.8, 16.9) |
| Control or emotional hurt | 9 (7.1, 10.1) | 18 (15.8, 20.1) | 22 (16.6, 26.7) |
| Through social media | 6 (5.0, 7.3) | 11 (9.4, 12.4) | 19 (13.7, 23.7) |
Source: Health Behaviour in School-aged Children (HBSC), Canada, 2022 |
|||
- When compared to cisgender youth, TGD youth reported the highest proportions of physical teen dating violence victimization (13% of TGD youth vs. 6% of cisgender girls vs. 5% of cisgender boys).
- When compared to cisgender girls and TGD youth, cisgender boys reported the lowest proportions of control or emotional hurt victimization (9% of cisgender boys vs. 18% of cisgender girls vs. 22% of TGD youth).
- Similarly, when compared to cisgender girls and TGD youth, cisgender boys reported the lowest proportions of social media teen dating violence victimization (6% of cisgender boys vs. 11% of cisgender girls vs. 19% of TGD youth).
- The most prevalent type of teen dating victimization among cisgender girls was control or emotional hurt.
“I would tell policy makers to examine closely teen dating violence. I have heard cases where it has gotten really extreme. I definitely do not think that the stats in grade 9 and 10 students who reported they had been victims of teen dating violence are accurate. A lot of cases aren't reported.”
Teen dating violence perpetration
Figure 11.7. Grade 9 and 10 students who reported they had been perpetrators of teen dating violence in the last 12 months, by gender (%)
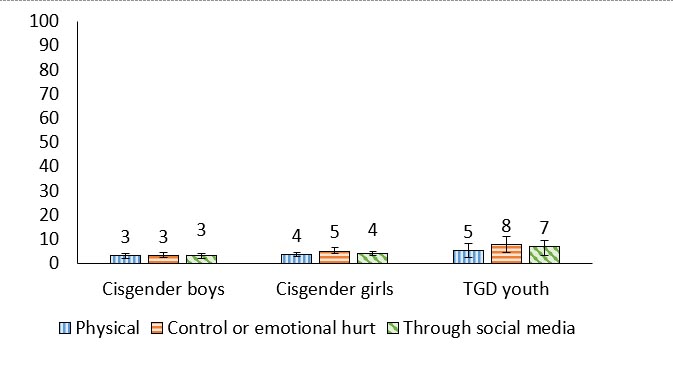
Figure 11.7: Text description
| Violence type | Cisgender boys | Cisgender girls | TGD youth |
|---|---|---|---|
| Physical | 3 (2.2, 4.1) | 4 (2.8, 4.6) | 5 (2.3, 8.3) |
| Control or emotional hurt | 3 (2.4, 4.4) | 5 (3.9, 6.4) | 8 (4.3, 11.2) |
| Through social media | 3 (2.2, 4.0) | 4 (3.1, 5.0) | 7 (3.4, 9.5) |
Source: Health Behaviour in School-aged Children (HBSC), Canada, 2022 |
|||
- Among cisgender boys and girls, similar percentages reported being perpetrators of physical, control or emotional hurt, or social media teen dating violence.
Experienced bullying and mental health
| Gender | Grade | Affluence | Positive indicators | Negative indicators | ||
|---|---|---|---|---|---|---|
| Life satisfaction | WHO-5 Well-being | Lonely | Health complaints | |||
| Cisgender boys | 6 to 8 | Less | -.29 | .13 | .38 | .44 |
| More | -.26 | -.26 | .35 | .31 | ||
| 9 and 10 | Less | -.15 | -.14 | .30 | .17 | |
| More | -.20 | -.16 | .26 | .27 | ||
| Cisgender girls | 6 to 8 | Less | -.45 | -.31 | .43 | .44 |
| More | -.31 | .28 | .42 | .38 | ||
| 9 and 10 | Less | -.32 | -.28 | .39 | .47 | |
| More | -.23 | -.17 | .32 | .33 | ||
| TGD youth | 6 to 8 | Both affluence groups | -.36 | -.29 | .37 | .34 |
| 9 and 10 | -.22 | -.21 | .29 | .28 | ||
| Both grade groups | Less | -.27 | .35 | .33 | .26 | |
| More | -.31 | -.23 | .34 | .32 | ||
| Overall | -.29 | -.25 | .37 | .35 | ||
- Overall, experiencing bullying was consistently associated with experiencing higher levels of the negative mental health indicators, and consistently associated with experiencing lower levels of the positive mental health indicators for all youth.
- Among cisgender boys, those who are less affluent in grades 6 to 8 had the strongest associations between experiencing bullying and reporting health complaints.
- Among cisgender girls, correlations between experiencing bullying and the mental health outcomes were particularly pronounced.
Experienced cyberbullying and mental health
| Gender | Grade | Affluence | Positive indicators | Negative indicators | ||
|---|---|---|---|---|---|---|
| Life satisfaction | WHO-5 Well-being | Lonely | Health complaints | |||
| Cisgender boys | 6 to 8 | Less | -.16 | NS | .23 | .42 |
| More | -.17 | -.14 | .20 | .19 | ||
| 9 and 10 | Less | -.19 | -.18 | .18 | .17 | |
| More | -.15 | -.14 | .14 | .21 | ||
| Cisgender girls | 6 to 8 | Less | -.20 | -.17 | .16 | .29 |
| More | -.27 | -.21 | .32 | .34 | ||
| 9 and 10 | Less | -.32 | -.30 | .37 | .40 | |
| More | -.24 | -.13 | .23 | .29 | ||
| TGD youth | 6 to 8 | Both affluence groups | -.25 | -.20 | .28 | .25 |
| 9 and 10 | -.17 | -.10 | .09 | .23 | ||
| Both grade groups | Less | NS | NS | .22 | .16 | |
| More | -.23 | -.15 | .21 | .24 | ||
| Overall | -.24 | -.18 | .25 | .28 | ||
- Overall, experiencing cyberbullying was negatively correlated with the positive mental health indicators and positively correlated with the negative mental health indicators for all youth.
- Experiencing cyberbullying was most strongly correlated with health complaints.
“Social media plays a role in this, as bullying is now different than the traditional sense, you don’t have to beat someone up to bully them.”
Summary of findings
Encouraging findings
- Fewer students reported bullying others or being both a perpetrator and victim of bullying when compared to 2018.
Areas of concern
- There has been a significant increase the number of students reporting being bullied by others.
- In grades 6 to 8, TGD youth reported being bullied at school several times a week more frequently than their cisgender peers
- Being bullied or cyberbullied was associated with more loneliness and health complaints and decreased well-being and life satisfaction.
- Between 5% and 22% of youth reported that they had been victims of teen dating violence.
Chapter 12: Spiritual health
Spirituality is recognized as a health asset in young people’s lives.Reference 98 Not to be confused with formal religion, the definition of spirituality can mean different things to different people. For young people in Canada, spiritual aspects of health relate to the connections within their lives that are typically defined in four domains. These have been called “connections to self”, “connections to others”, “connections to the natural environment”, and for some, “connections to the transcendent” or some greater mystery or spiritual power.Reference 99
Connections to self is measured through indicators of whether life has “meaning or purpose” and that young people experience joy in life. This domain of spirituality is centrally important to young people and their mental health.Reference 100Reference 101 Connections to others focuses on the importance of being kind to other people and being forgiving of others.Reference 100 Connections to nature encompasses the importance of feeling connected to nature and caring for the natural environment.Reference 100 Finally, connections to the transcendent describes the importance that a young person places on feeling a connection to a higher spiritual power, or taking time to mediate or pray.Reference 100
Description of items
In the HBSC survey, students are asked to rate the importance that each of the four spirituality domains (self, others, nature, and transcendent) have in their lives, using a simple scale involving 10 questions. Participants rate each item on a 5-point scale anchored at 1 (“not at all important”) and then 5 (“very important”), with scores of 4-5 categorized as “important” in subsequent analyses.Reference 99
Connections to self
Figure 12.1. Students reporting that connections to self are important, by grade and gender (%)

Figure 12.1: Text description
| Grade level | Cisgender boys | Cisgender girls | TGD youth |
|---|---|---|---|
| Grades 6 to 8 | 76 (74.1, 78.3) | 74 (72.1, 75.9) | 48 (41.4, 54.0) |
| Grades 9 to 10 | 75 (72.7, 77.6) | 78 (75.5, 79.8) | 52 (45.0, 58.9) |
Source: Health Behaviour in School-aged Children (HBSC), Canada, 2022 |
|||
- Regardless of grade, TGD youth were the least likely to highly rate the importance of connection to self in their lives (48% of TGD youth in grades 6 to 8 reported this domain as important compared with 52% of TGD youth in grades 9 and 10). These percentages were quite low compared to cisgender boys and cisgender girls, which ranged from 74% to 78%.
Connections to others
Figure 12.2. Students reporting that connections to others are important, by grade and gender (%)
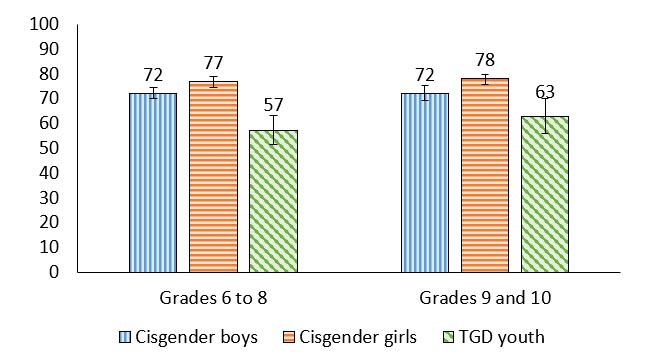
Figure 12.2: Text description
| Grade level | Cisgender boys | Cisgender girls | TGD youth |
|---|---|---|---|
| Grades 6 to 8 | 72 (70.2, 74.6) | 77 (74.5, 79.0) | 57 (51.4, 63.3) |
| Grades 9 to 10 | 72 (69.5, 75.2) | 78 (75.9, 79.9) | 63 (55.9, 70.3) |
Source: Health Behaviour in School-aged Children (HBSC), Canada, 2022 |
|||
- Regardless of grade, cisgender youth were most likely to report that connection to others was important in their lives (72% of cisgender boys in both grades 6 to 8 and 9 and 10; 77% and 78% for grades 6 to 8 and 9 and 10 cisgender girls, respectively).
Connections to nature
Figure 12.3. Students reporting that connections to nature are important, by grade and gender (%)
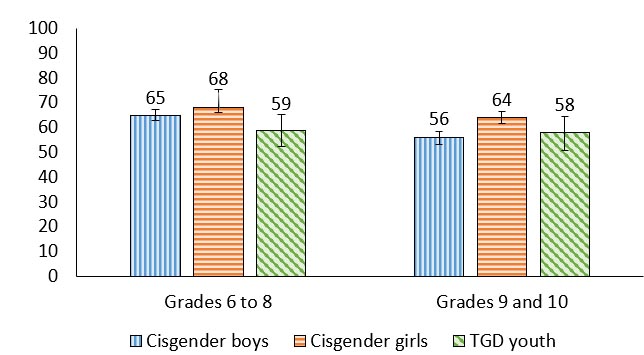
Figure 12.3: Text description
| Grade level | Cisgender boys | Cisgender girls | TGD youth |
|---|---|---|---|
| Grades 6 to 8 | 65 (62.8, 67.3) | 68 (66.1, 70.6) | 59 (52.5, 65.3) |
| Grades 9 to 10 | 56 (53.1, 58.5) | 64 (61.7, 66.5) | 58 (50.8, 64.4) |
Source: Health Behaviour in School-aged Children (HBSC), Canada, 2022 |
|||
- The proportion of youth who highly rated the importance of connection to nature was lower in grades 9 and 10 compared with grades 6 to 8 among cisgender boys (65% vs. 56%, a 9 percentage point decline), and cisgender girls (68% vs. 64%, a 4 percentage point decline).
“At my school, most people like to stay home, and not connect with nature … so the proportion reported here is surprising.”
Connections to transcendent
Figure 12.4. Students reporting that connections to the transcendent are important, by grade and gender (%)

Figure 12.4: Text description
| Grade level | Cisgender boys | Cisgender girls | TGD youth |
|---|---|---|---|
| Grades 6 to 8 | 31 (28.4, 33.1) | 30 (27.6, 32.3) | 13 (9.5, 17.2) |
| Grades 9 to 10 | 30 (27.0, 32.8) | 29 (25.9, 31.8) | 12 (8.2, 16.5) |
Source: Health Behaviour in School-aged Children (HBSC), Canada, 2022 |
|||
- In general, connections to the transcendent was rated as the least important spiritual domain among all groups of young people.
- TGD youth had the smallest proportion reporting that connection to transcendent was highly important (13% in grades 6 to 8; 12% in grades 9 and 10) compared to cisgender girls and cisgender boys.
Connections to self and mental health
| Gender | Grade | Affluence | Positive indicators | Negative indicators | ||
|---|---|---|---|---|---|---|
| Life satisfaction | WHO-5 Well-being | Lonely | Health complaints | |||
| Cisgender boys | 6 to 8 | Less | .45 | .40 | -.32 | -.50 |
| More | .37 | .40 | -.27 | -.24 | ||
| 9 and 10 | Less | .31 | .31 | -.21 | -.50 | |
| More | .27 | .31 | -.21 | -.22 | ||
| Cisgender girls | 6 to 8 | Less | .51 | .47 | -.32 | -.38 |
| More | .41 | .42 | -.31 | -.32 | ||
| 9 and 10 | Less | .35 | .48 | -.33 | -.32 | |
| More | .35 | .34 | -.24 | -.21 | ||
| TGD youth | 6 to 8 | Both affluences groups | .39 | .46 | -.28 | -.36 |
| 9 and 10 | .28 | .37 | NS | -.22 | ||
| Both grade groups | Less | .40 | .41 | NS | -.48 | |
| More | .34 | .43 | -.20 | -.27 | ||
| Overall | .38 | .39 | -.28 | -.28 | ||
- Overall, connections to self were consistently associated with more positive life satisfaction and well-being and negatively correlated with loneliness and health complaints for all students.
- Connections to self were more strongly associated with the positive mental health indicators than the negative mental health indicators.
- For less affluent youth, connections to self were moderately associated with the positive mental health indicators.
Connections to others and mental health
| Gender | Grade | Affluence | Positive indicators | Negative indicators | ||
|---|---|---|---|---|---|---|
| Life satisfaction | WHO-5 Well-being | Lonely | Health complaints | |||
| Cisgender boys | 6 to 8 | Less | .31 | .32 | -.09 | -.36 |
| More | .24 | .28 | -.14 | -.12 | ||
| 9 and 10 | Less | .30 | .29 | -.19 | -.47 | |
| More | .18 | .19 | -.07 | -.11 | ||
| Cisgender girls | 6 to 8 | Less | .47 | .46 | -.24 | -.29 |
| More | .25 | .30 | -.17 | -.20 | ||
| 9 and 10 | Less | .17 | .34 | -.12 | -.22 | |
| More | .23 | .26 | -.14 | -.13 | ||
| TGD youth | 6 to 8 | Both affluence groups | .27 | .26 | NS | -.12 |
| 9 and 10 | NS | .23 | NS | NS | ||
| Both grade groups | Less | NS | .24 | NS | -.19 | |
| More | .20 | .24 | NS | -.08 | ||
| Overall | .24 | .26 | -.12 | -.14 | ||
- Overall, connections to others were positively associated with the positive mental health indicators and negatively associated with the negative health indicators, for all students.
- Connections to others were more strongly related to the positive mental health indicators relative to the negative mental health indicators.
- Less affluent cisgender girls in grades 6 to 8 had moderate positive correlations between connections to others and the positive mental health indicators.
- For TGD youth, connections to others were most strongly correlated with well-being compared to the other mental health indicators.
Summary of findings
Encouraging findings
- 55% to 60% of cisgender youth reported that connections to self were important to them. This is encouraging considering the importance of these connections as being predictive of positive mental health indicators.
- Cisgender girls reported relatively high levels of connection to others. This is encouraging considering that connections to others are correlated with life satisfaction and well-being.
Areas of concern
- In three out of four spirituality domains (connections to self, connections to others, connections to transcendent) TGD youth were less likely than their cisgender counterparts to report that these connections were important to them.
- Cisgender students in grades 9 and 10 are less likely to report that connections to nature were important to them than cisgender students in grades 6 to 8. This is important due to the therapeutic value of being connected to nature and the environment.
Chapter 13: Substance use
Opportunities to take new risks increase during adolescence as young people transition from childhood to adulthood.Reference 102 Such behaviours can include smoking cigarettes, drinking alcohol, and the use of other substances.Reference 103 Additionally, the use of e-cigarettes or vapes has become increasingly popular amongst youth.Reference 104Reference 105 Using multiple substances at the same time is also common amongst youth in Canada.Reference 106Reference 107 Attitudes regarding substance use are informed by peer and adult behaviours, media, and public policy.Reference 103
Description of items
In the HBSC survey, substance use includes smoking cigarettes, the use of vapes (e-cigarettes), alcohol, cannabis, prescription medication for the purpose of getting high, and other controlled substances. Students in grades 6 to 10 were asked how many days they had smoked a cigarette within the last 30 days. Vaping is measured by reports of using a vape at any point in their lifetime (response options include: “never”, “1 to 2 days”, “3 to 5 days”, “6 to 9 days”, “10 to 19 days”, “20 to 29 days”, or “30 days or more”), in addition to within the last 30 days. Students are also asked to report where they get their vaping products. In this report, alcohol use is measured by the percentage of students who have been “really drunk” at least two times in their lives. Grade 9 and 10 students are also asked to report their cannabis use (response options include: “never”, “1 to 2 days”, “3 to 5 days”, “6 to 9 days”, “10 to 19 days”, “20 to 29 days”, or “30 days or more”), “harder” drug use, or medication use for the purpose of getting high over the last 12 months.
Smoking in last 30 days
Figure 13.1. Students who reported that they had smoked cigarettes in the last 30 days, by grade and gender (%)
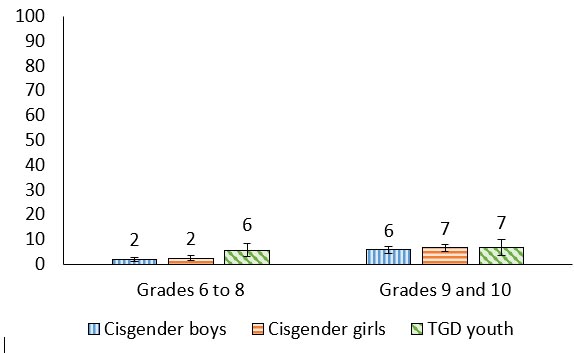
Figure 13.1: Text description
| Grade level | Cisgender boys | Cisgender girls | TGD youth |
|---|---|---|---|
| Grades 6 to 8 | 2 (1.2, 2.5) | 2 (1.6, 3.3) | 6 (2.9, 8.4) |
| Grades 9 to 10 | 6 (4.4, 7.1) | 7 (5.2, 8.0) | 7 (3.5, 10.0) |
Source: Health Behaviour in School-aged Children (HBSC), Canada, 2022 |
|||
- Smoking in the last 30 days was reported by a very small portion of the student population, ranging from 2% in cisgender boys and girls in grades 6 to 8, to 6-7% in grade 9 and 10 youth of all genders.
Vaping during lifetime
Figure 13.2. Students who reported that they have used a vape, also known as an e-cigarette, in their lifetime, by grade and gender (%)
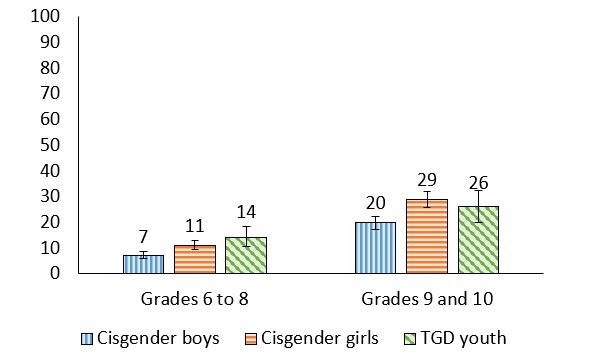
Figure 13.2: Text description
| Grade level | Cisgender boys | Cisgender girls | TGD youth |
|---|---|---|---|
| Grades 6 to 8 | 7 (5.7, 8.8) | 11 (9.3, 13.0) | 14 (10.4, 18.5) |
| Grades 9 to 10 | 20 (17.3, 22.3) | 29 (25.7, 32.1) | 26 (19.9, 32.3) |
Source: Health Behaviour in School-aged Children (HBSC), Canada, 2022 |
|||
- The proportion of students who reported vaping in their lifetime increased with grade.
- The highest levels of vaping in their lifetime were reported by cisgender girls and TGD youth in grades 9 and 10.
Vaping in the last 30 days
Figure 13.3. Students who reported that they have used a vape, also known as an e-cigarette, in the last 30 days, by grade and gender (%)
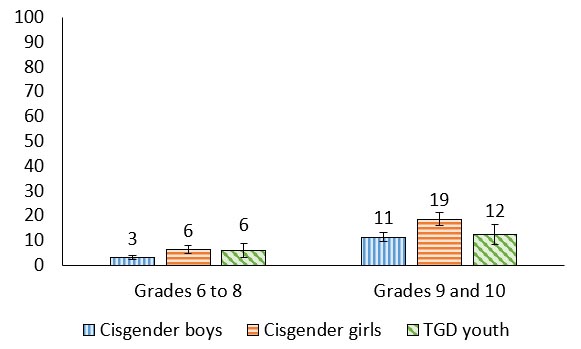
Figure 13.3: Text description
| Grade level | Cisgender boys | Cisgender girls | TGD youth |
|---|---|---|---|
| Grades 6 to 8 | 3 (2.3, 3.9) | 6 (4.6, 7.7) | 6 (3.2, 8.8) |
| Grades 9 to 10 | 11 (9.4, 13.2) | 19 (16.1, 21.1) | 12 (8.1, 16.4) |
Source: Health Behaviour in School-aged Children (HBSC), Canada, 2022 |
|||
- Vaping in the last 30 days was most commonly reported in grades 9 to 10, and especially among cisgender girls.
“I think that [the vaping patterns] are partially due to the fact that girls are easily influenced and are seeking validation …. It could be specific to the school you are going to and who is doing it … but is definitely a trend like how cigarettes were back in the day.”
Trends in lifetime vaping among boys
Figure 13.4. Boys who reported that they had ever used a vape, also known as an e-cigarette, by grade and year of survey (%)
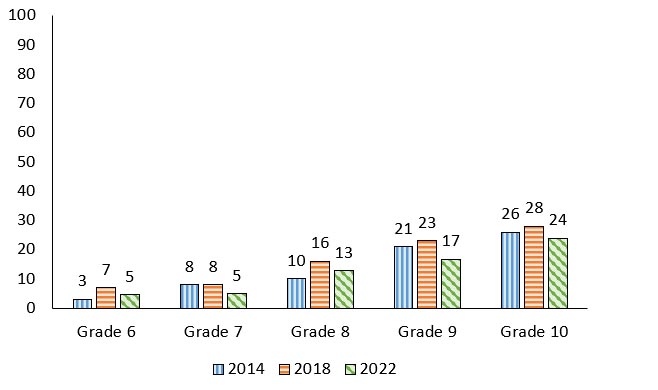
Note: When considering the above trends, estimates are provided for young people identifying as “boys” in all cycles.
Figure 13.4: Text description
| Grade level | 2014 | 2018 | 2022 |
|---|---|---|---|
| Grade 6 | 3 | 7 | 5 |
| Grade 7 | 8 | 8 | 5 |
| Grade 8 | 10 | 16 | 13 |
| Grade 9 | 21 | 23 | 17 |
| Grade 10 | 26 | 28 | 24 |
Source: Health Behaviour in School-aged Children (HBSC), Canada |
|||
- In 2022, the proportion of boys who reported they had ever used a vape declined compared with the 2018 HBSC cycle.
- Reports of lifetime vaping increased with increasing grade level among boys.
Trends in lifetime vape use among girls
Figure 13.5. Girls who reported that they had ever used a vape, also known as an e-cigarette, by grade and year of survey (%)
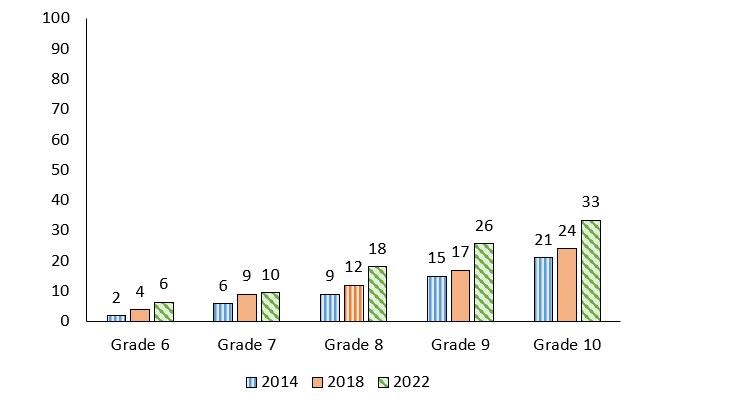
Note: When considering the above trends, estimates are provided for young people identifying as “girls” in all cycles.
Figure 13.5: Text description
| Grade level | 2014 | 2018 | 2022 |
|---|---|---|---|
| Grade 6 | 2 | 4 | 6 |
| Grade 7 | 6 | 9 | 10 |
| Grade 8 | 9 | 12 | 18 |
| Grade 9 | 15 | 17 | 26 |
| Grade 10 | 21 | 24 | 33 |
Source: Health Behaviour in School-aged Children (HBSC), Canada |
|||
- The proportion of girls who reported they had ever vaped has steadily increased over the last 3 cycles of HBSC
- The proportion of girls who reported that they had ever vaped also increased with grade.
“Every time I go to the bathroom, it’s hard to get around the girls vaping.”
Where students get vapes
| Item | Grades 9 and 10 | ||
|---|---|---|---|
| Cisgender girls | Cisgender boys | Total | |
| I buy them from a vape shop myself | 3 | 9 | 6 |
| I buy them from a store (e.g., convenience) myself | 1 | 4 | 2 |
| I buy them on the Internet (including apps) | 2 | 1 | 2 |
| I ask someone to buy them for me | 29 | 12 | 22 |
| A family member gives them to me | 6 | 7 | 6 |
| A friend gives them to me | 27 | 24 | 26 |
| Someone else gives them to me | 12 | 14 | 13 |
| I use someone’s vape without their permission | 2 | 2 | 2 |
| Other | 18 | 27 | 21 |
Note: Results from the TGD youth are not reported in table 13.1 as the cell sizes are too small.
- 54% of students got vapes from another person including family, friends, or someone else. 10% of students bought vapes themselves, either at a store or online.
- The most prevalent methods of obtaining a vape reported by cisgender girls was asking someone else to buy them or getting them from a friend.
- The most prevalent method of obtaining a vape reported by cisgender boys was getting them from a friend.
Drunkenness at least twice in lifetime
Figure 13.6. Students who reported that they had been really drunk at least twice in their lifetime, by grade and gender (%)
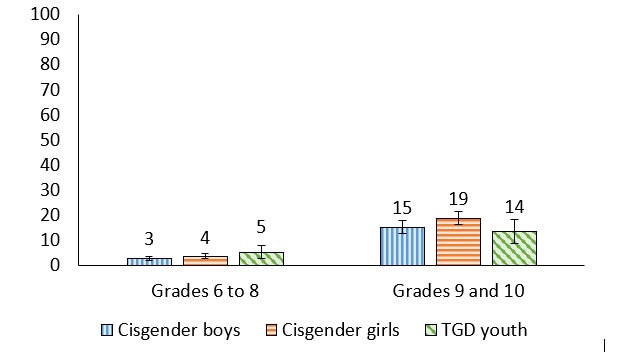
Figure 13.6: Text description
| Grade level | Cisgender boys | Cisgender girls | TGD youth |
|---|---|---|---|
| Grades 6 to 8 | 3 (2.1, 3.6) | 4 (2.6, 4.6) | 5 (2.7, 7.8) |
| Grades 9 to 10 | 15 (12.6, 17.8) | 19 (16.3, 21.5) | 14 (8.9, 18.3) |
Source: Health Behaviour in School-aged Children (HBSC), Canada, 2022 |
|||
- The percentage of youth reporting that they had been really drunk at least twice in their lifetime increased by grade. 3% of cisgender boys in grade 6 to 8 reported that they had been really drunk at least twice compared to 15% in grades 9 and 10. Similarly, 4% of cisgender girls in grades 6 to 8 reported that they had been really drunk at least twice compared to 19% in grades 9 and 10. Finally, 5% of TGD youth in grades 6 to 8 reported that they had been really drunk at least twice compared to 14% in grades 9 and 10.
Trends in cannabis use in the last 12 months
Figure 13.7. Grade 9 and 10 students who reported that they had used cannabis in the past 12 months, by gender and year of survey (%)
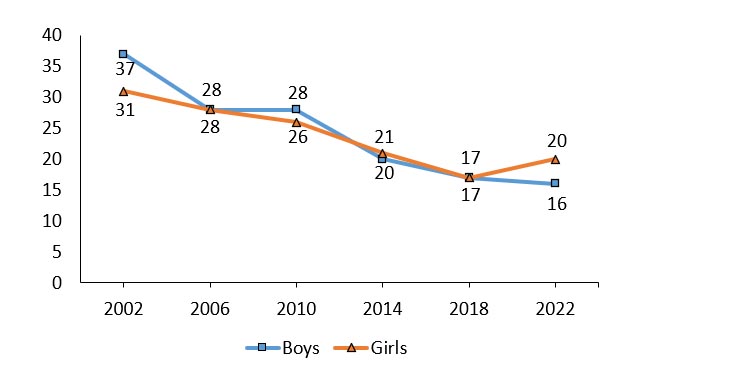
Note: When considering the above trends, estimates are provided for young people identifying as “boys” and “girls” in all cycles.
Figure 13.7: Text description
| Gender | 2002 | 2006 | 2010 | 2014 | 2018 | 2022 |
|---|---|---|---|---|---|---|
| Boys | 37 | 28 | 28 | 20 | 17 | 16 |
| Girls | 31 | 28 | 26 | 21 | 17 | 20 |
Source: Health Behaviour in School-aged Children (HBSC), Canada |
||||||
- Over time, the proportion of students reporting that they had used cannabis in the past 12 months has decreased over the last 6 cycles of the HBSC Survey. One exception in 2022 was girls, who reported a 3% increase when compared to 2018.
- In 2022, 20% of girls reported using cannabis compared to 16% of boys, a 4 percentage point difference. This is the largest gender difference reported since 2002 when 6% more boys reported using cannabis than girls.
Drug or medication use to “get high”
| Item | Grades 9 and 10 | ||
|---|---|---|---|
| Cisgender boys | Cisgender girls | TGD youth | |
| Prescription medication (e.g., Vicodin, Ritalin, Ativan) | 5 | 6 | 4 |
| Non-prescription medication (e.g., cough and cold medicines) | 9 | 10 | 10 |
| Hallucinogens (e.g., LSD, magic mushrooms, PCP) | 6 | 5 | 7 |
| Another drug (e.g., speed, crystal meth) | 2 | 2 | 3 |
| Another substance (e.g., gasoline, glue) | 3 | 1 | 6 |
Note: Results from the TGD youth are not reported in table 13.1 as the cell sizes are too small.
- Between 1% and 10% of grade 9 and 10 students reported taking one or several drug(s) and/or using medication to get high.
- Regardless of gender, the most prevalent substance used to “get high” was non-prescription medication (cough and cold medications).
Vaping during lifetime and mental health
| Gender | Grade | Affluence | Positive indicators | Negative indicators | ||
|---|---|---|---|---|---|---|
| Life satisfaction | WHO-5 Well-being | Lonely | Health complaints | |||
| Cisgender boys | 6 to 8 | Less | -.20 | -.22 | .17 | .26 |
| More | -.18 | -.14 | .13 | .15 | ||
| 9 and 10 | Less | .18 | -.16 | .22 | .36 | |
| More | .13 | -.05 | .09 | .16 | ||
| Cisgender girls | 6 to 8 | Less | -.27 | -.21 | .19 | .29 |
| More | -.25 | -.19 | .19 | .28 | ||
| 9 and 10 | Less | -.34 | -.26 | .34 | .52 | |
| More | .27 | -.19 | .25 | .34 | ||
| TGD youth | 6 to 8 | Both affluence groups | .15 | -.11 | .16 | .09 |
| 9 and 10 | -.14 | -.19 | .14 | .19 | ||
| Both grade groups | Less | NS | NS | NS | NS | |
| More | .09 | -.17 | .12 | .13 | ||
| Overall | -.24 | -.19 | .21 | .29 | ||
- Overall, vaping was associated with reduced positive levels of mental health, and higher levels of the negative mental health indicators.
- Among cisgender boys, those who are less affluent have the strongest relationships between vaping and the mental health indicators.
- Overall, cisgender girls display the strongest correlations between vaping and the mental health indicators. For less affluent girls in grade 9 and 10, there was a moderate positive correlation between vaping and health complaints.
- Interestingly, for a few groups, vaping was positively correlated with life satisfaction. Understanding this link requires more research.
Cannabis use in last 12 months and mental health
| Gender | Grade | Affluence | Positive indicators | Negative indicators | ||
|---|---|---|---|---|---|---|
| Life satisfaction | WHO-5 Well-being | Lonely | Health complaints | |||
| Cisgender boys | 9 and 10 | Less | -.32 | -.24 | .32 | .43 |
| More | -.12 | -.05 | .07 | .15 | ||
| Cisgender girls | 9 and 10 | Less | -.24 | -.21 | .24 | .38 |
| More | .26 | -.16 | .21 | .30 | ||
| TGD youth | 9 and 10 | Both affluence groups | NS | -.10 | NS | NS |
| Less | .30 | .30 | NS | -.28 | ||
| More | NS | .11 | NS | NS | ||
| Overall | -.20 | -.13 | .16 | .24 | ||
- Overall, cannabis use was inconsistently associated with the positive mental health indicators, as well as the negative mental health indicators.
- Those who are less affluent demonstrated the strongest associations between cannabis use and the mental health indicators.
- Among cisgender boys, those who are less affluent in grades 9 and 10 had a moderate positive relationship between cannabis use and health complaints.
- Among cisgender girls, those who are less affluent had a weak relationship between cannabis use and all of the mental health indicators. For cisgender girls who are more affluent, there was a positive association between cannabis use and life satisfaction. Understanding this link requires further research.
- For TGD youth who are less affluent, there was a weak positive relationship between cannabis use and the positive mental health indicators and a weak negative relationship between cannabis use and health complaints. Understanding this link requires further research.
Summary of findings
Encouraging findings
- Compared to previous years, fewer boys reported having ever used a vape.
- While any cigarette smoking is concerning, less than 8% of Canadian youth reported having smoked in the last 30 days.
Areas of concern
- More girls were reporting vaping during the last 30 days, lifetime vaping, and cannabis use – patterns that differ strikingly from boys. The increase in vaping reported by girls is very concerning.
- Vaping and cannabis use were each correlated with more negative indicators of mental health.
Chapter 14: Sexual health
During adolescence young people may begin to engage in sexual behaviour and seek out partnered relationships.Reference 108 To support youth in navigating this new aspect of their health, it is critical that supports, education, and resources are provided to young people. While sexual health education curricula vary throughout Canada, a national survey found that the majority of parents agree that sexual health education should be taught in schools and that the topic matters should be comprehensive.Reference 109 Additionally, youth themselves have expressed a desire to learn more about sexual health and relationships.Reference 110Reference 111
Previous HBSC cycles have indicated that certain contextual factors, such as disrupted family structure and low family support, are indicative of early sexual activity.Reference 112 While engaging in sexual activities is not inherently unhealthy, those who engage at younger ages have greater rates of sexually transmitted infections, a greater number of lifetime sexual partners, and increased odds of experiencing an unplanned pregnancy.Reference 113
Description of items
In the HBSC survey, grades 9 and 10 students report on their sexual health behaviours. Students report on what gender(s) they are attracted to, if they have had sexual intercourse, their use of contraception measures, and ‘sexting’. For the purposes of this survey, ‘sexting’ is defined as “sexually explicit written content, pictures and/or videos of oneself that are transmitted via technological platforms (e.g. SMS, iMessage, Snapchat, Instagram.)” One ‘sexting’ measure that is reported on is how many times students felt pressured to send ‘sexts’ during the past 12 months. Response options include: “never”, “1 to 3 times”, “4 to 10 times”, or “more than 10 times”.
Sexual intercourse trends
Figure 14.1. Grade 9 and 10 students who reported that they had had sexual intercourse, by gender and year of survey (%)
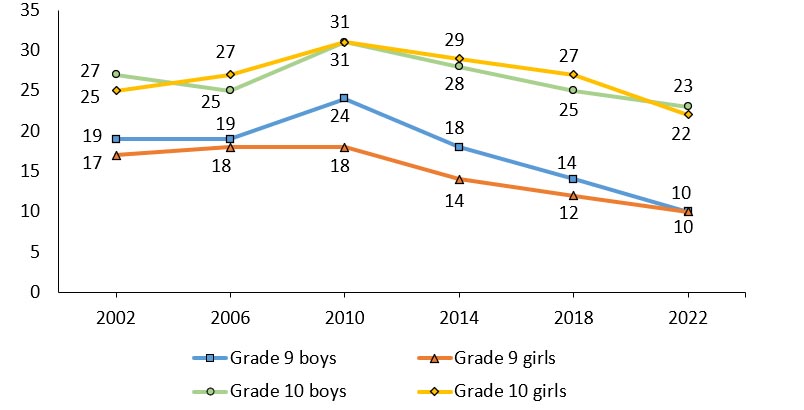
Note: When considering the above trends, estimates are provided for young people identifying as “boys” and “girls” in all cycles.
Figure 14.1: Text description
| Gender | Grade level | 2002 | 2006 | 2010 | 2014 | 2018 | 2022 |
|---|---|---|---|---|---|---|---|
| Boys | Grade 9 | 19 | 19 | 24 | 18 | 14 | 10 |
| Grade 10 | 27 | 25 | 31 | 28 | 25 | 22 | |
| Girls | Grade 9 | 17 | 18 | 18 | 14 | 12 | 10 |
| Grade 10 | 25 | 27 | 31 | 29 | 27 | 23 | |
Source: Health Behaviour in School-aged Children (HBSC), Canada |
|||||||
- Over time, less youth are reporting that they have had sexual intercourse. In 2022, 10% of youth in grade 9, 22% of girls in grade 10, and 23% of boys in grade 10 reported that they had had sexual intercourse, the lowest percentages reported since the HBSC survey began collecting data on sexual intercourse trends.
- Overall, a greater percentage of youth in grade 10 reported having had sexual intercourse compared to youth in grade 9.
Use of contraception measures
Figure 14.2. Grade 9 and 10 sexually active students who reported using contraceptive measures the last time they had intercourse, by gender (%)
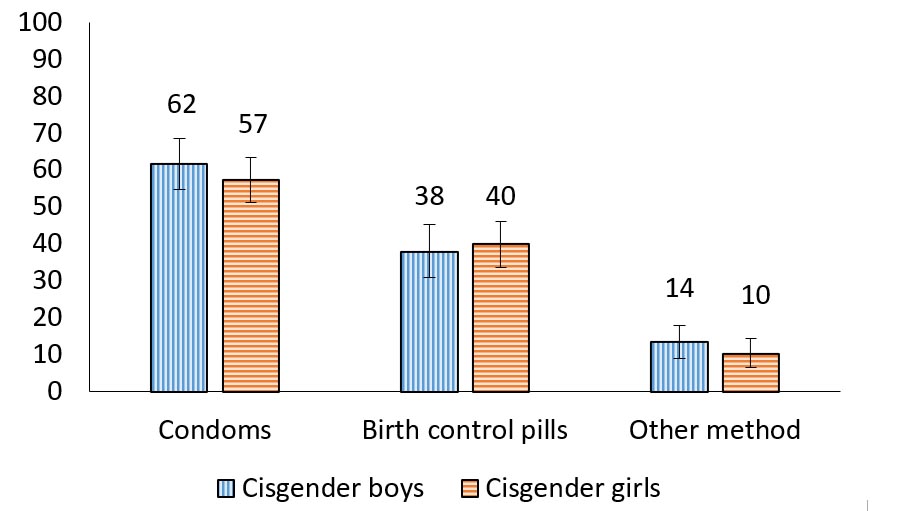
Figure 14.2: Text description
| Contraceptive method | Cisgender boys | Cisgender girls |
|---|---|---|
| Condoms | 62 (54.8, 68.6) | 57 (51.4, 63.5) |
| Birth Control Pills | 38 (31.0, 45.2) | 40 (33.7, 46.2) |
| Other method | 14 (9.0, 18.1) | 10 (6.5, 14.5) |
Source: Health Behaviour in School-aged Children (HBSC), Canada, 2022 |
||
- The most prevalent type of contraceptive measure reported by cisgender youth who are sexually active was condoms (62% of cisgender boys and 57% of cisgender girls).
- Due to the small numbers, it is not possible to report contraception measures for the TGD youth.
Who students are attracted to
| Item | Grades 9 and 10 | ||
|---|---|---|---|
| Cisgender boys | Cisgender girls | TGD youth | |
| Attracted to cisgender boys | 6 | 86 | 65 |
| Attracted to cisgender girls | 92 | 20 | 68 |
| Attracted to TGD youth | 2 | 6 | 60 |
| Not attracted to anyone | 2 | 2 | 9 |
| Unsure who they are attracted to | 3 | 9 | 13 |
Note: The categories are not mutually exclusive, youth can select as many as apply.
- The majority of cisgender boys are attracted to cisgender girls (92%) and the majority of cisgender girls are attracted to cisgender boys (86%).
- Among cisgender girls, 20% are attracted to those who share the same gender identity. Among cisgender boys, 6% are attracted to those who share the same gender identity.
- 65% of TGD youth are attracted to cisgender boys, 68% are attracted to cisgender girls, and 60% are attracted to TGD youth. TGD youth are likely selecting many options indicating who they are attracted to.
- Between 2% and 9% of youth are not attracted to anyone.
Non-consensual sending of ‘sexts’
Figure 14.3. Grade 9 and 10 students reporting on the non-consensual sending of someone else’s ‘sexts’, by gender (%)
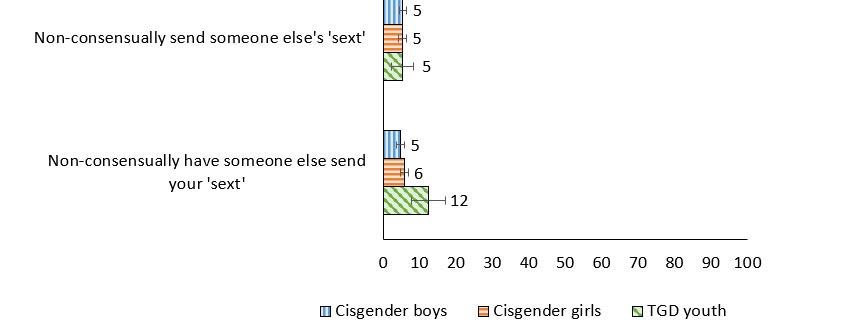
Figure 14.3: Text description
| Non-consensually ‘sexting’ experience | Cisgender boys | Cisgender girls | TGD youth |
|---|---|---|---|
| Non-consensually send someone else’s ‘sext’ | 5 (4.4, 6.5) | 5 (4.1, 6.4) | 5 (2.2, 8.2) |
| Non-consensually have someone else send your ‘sext’ | 5 (3.7, 6.0) | 6 (4.6, 6.8) | 12 (7.7, 17.1) |
Source: Health Behaviour in School-aged Children (HBSC), Canada, 2022 |
|||
- Overall, 5% of youth reported that they had sent someone else’s ‘sext’ to another person without their permission.
- 12% of TGD youth reported that someone else had sent their ‘sext’ without their permission, which was 7 percentage points higher compared with cisgender boys and 6 percentage points higher compared with cisgender girls.
Distributing and receiving ‘sexts’
Figure 14.4. Grade 9 and 10 students reporting on ‘sexting’
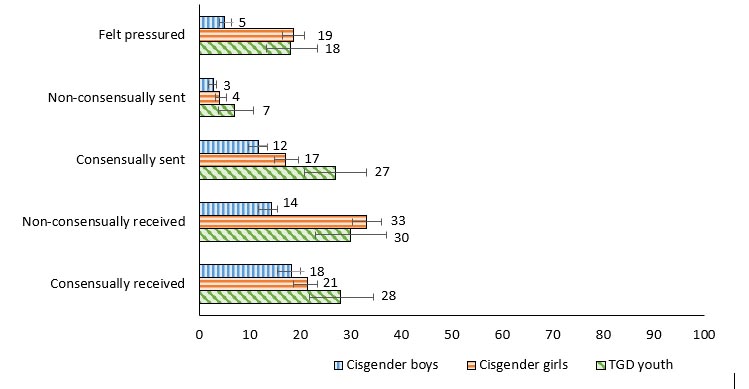
Figure 14.4: Text description
| ‘Sexting’ behaviour | Cisgender boys | Cisgender girls | TGD youth |
|---|---|---|---|
| Feel pressure to send a ‘sext’ | 5 (4.0, 6.4) | 19 (16.5, 20.1) | 18 (13.4, 23.5) |
| Non-consensually send a ‘sext’ | 3 (1.8, 3.4) | 4 (3.2, 5.3) | 7 (3.8, 10.7) |
| Consensually send a ‘sext’ | 12 (9.8, 13.5) | 17 (15.0, 19.6) | 27 (20.8, 33.2) |
| Non-consensually receive a ‘sext’ | 14 (11.7, 15.4) | 33 (30.3, 36.1) | 30 (23.0, 37.0) |
| Consensually receive a ‘sext’ | 18 (15.5, 20.1) | 21 (18.7, 23.4) | 28 (21.9, 34.6) |
Source: Health Behaviour in School-aged Children (HBSC), Canada, 2022 |
|||
- In general, cisgender girls and TGD youth are more involved in sending and receiving ‘sexts’ than cisgender boys.
- 5% of cisgender boys reported feeling pressure to send a ‘sext’ compared to 18% of TGD youth and 19% of cisgender girls.
- 7% of TGD youth reported sending an unwanted ‘sext’ to another person, a proportion 4 percentage points higher than cisgender boys.
- Between 12% and 27% of youth reported consensually sending a ‘sext.’ 27% of TGD youth reported that they had consensually sent a ‘sext’, a proportion 10 percentage points higher than cisgender girls and 15 percentage points higher than cisgender boys.
- 33% of cisgender girls reported receiving an unwanted ‘sext’ compared to 30% of TGD youth and 14% of cisgender boys.
- 28% of TGD youth reported consensually receiving a ‘sext’ compared to 21% of cisgender girls and 18% of cisgender boys.
“It wasn’t surprising to me that boys were the lowest [on the sexting items]. It makes sense with how different genders are seen by society … and girls are seen more sexually.”
Pressure to send ‘sexts’ and mental health
| Gender | Grade | Affluence | Positive indicators | Negative indicators | ||
|---|---|---|---|---|---|---|
| Life satisfaction | WHO-5 Well-being | Lonely | Health complaints | |||
| Cisgender boys | 9 and 10 | Less | -.33 | -.28 | .30 | .31 |
| More | -.10 | -.05 | .08 | .09 | ||
| Cisgender girls | 9 and 10 | Less | NS | -.13 | .18 | .38 |
| More | -.21 | -.14 | .25 | .28 | ||
| TGD youth | 9 and 10 | Both affluence groups | -.10 | -.11 | .20 | .21 |
| Less | NS | NS | .39 | .36 | ||
| More | -.17 | -.11 | .16 | .17 | ||
| Overall | -.20 | -.16 | .23 | .28 | ||
- Overall, feeling pressure to send ‘sexts’ was associated with poorer life satisfaction, lower well-being, loneliness and health complaints.
- Feeling pressure to send ‘sexts’ was more strongly related to the negative mental health indicators than the positive mental health indicators.
- Among cisgender boys, those who are less affluent had the strongest correlations between feeling pressure to send ‘sexts’ and the mental health indicators.
- The opposite was true for cisgender girls, with those who are more affluent having the strongest correlations between feeling pressure to send ‘sexts’ and the mental health indicators.
- For TGD youth, feeling pressure to send ‘sexts’ was more strongly related to loneliness and health complaints than life satisfaction and well-being.
Summary of findings
Encouraging findings
- Cisgender boys and cisgender girls reported using contraceptive measures at approximately the same rate.
Areas of concern
- Cisgender girls and TGD youth were more likely to report sending and receiving ‘sexts’ than cisgender boys.
- 5% of youth had sent someone else’s ‘sext’ without their permission.
- Between 5% and 19% of youth feel pressure to send ‘sexts.’ This is especially concerning considering the correlations to mental health.
Chapter 15: Social media use
Internet access and its frequent use have become especially common in Canadian society, with some reports indicating that nearly 100% of adolescents have used the internet in the last 3 months and 92% regularly use social media.Reference 114 Technology provides young people with many benefits such as providing them with a means to access information on health,Reference 119Reference 120Reference 121 offering a non-traditional space to find support,Reference 121 and platforms to create and foster social connections.Reference 119 Throughout the COVID-19 pandemic, youth were spending increased amounts of time on digital media including social media, video games, TV, and virtual learning.Reference 115 Higher levels of usage have been associated with higher levels of depression, anxiety, inattention, irritability, and hyperactivity.Reference 115Reference 116 In addition to psychological symptoms, those whose social media use becomes increasingly problematic have increased somatic symptoms including headaches, feeling dizzy, backaches, stomach-aches, and neck and shoulder pain, consistent with psychosomatic problems.Reference 117Reference 118 Of particular interest is the examination of youth who display patterns of problematic social media use, which is indicated by symptoms that are consistent with addiction.Reference 122 Furthermore, there also appears to be a relationship between social media use and risk-taking behaviours such as substance use and risky sexual activity.Reference 123
Description of items
In the HBSC survey, problematic social media use is measured as a continuous scale derived from 9 items with a score between 0 (low) and 9 (high). In this cycle of the survey, youth were asked to report on the number of times that social media facilitated their participation in risky behaviours. In order to determine the correlations between the contemporary risk-taking behaviours and mental health in Table 15.2, the contemporary risk-taking scale, which produces a range of values from 0 (low) to 10 (high), is used.
Problematic social media use
Figure 15.1. Students who report problematic social media use, by grade and gender (%)
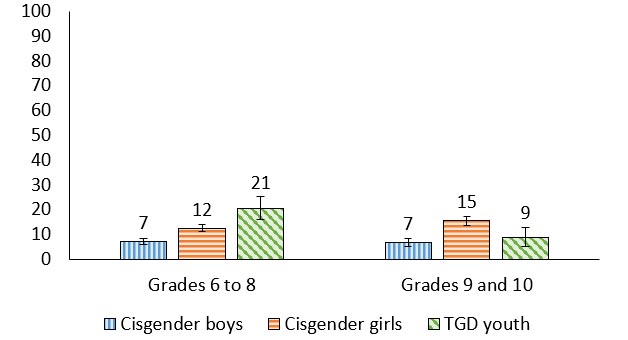
Figure 15.1: Text description
| Grade level | Cisgender boys | Cisgender girls | TGD youth |
|---|---|---|---|
| Grades 6 to 8 | 7 (6.0, 8.2) | 12 (11.0, 13.8) | 21 (16.0, 25.1) |
| Grades 9 to 10 | 7 (5.2, 8.1) | 15 (13.7, 17.2) | 9 (4.9, 12.8) |
Source: Health Behaviour in School-aged Children (HBSC), Canada, 2022 |
|||
- Problematic social media use is higher among cisgender girls than cisgender boys, across grades.
- The proportion of TGD youth reporting problematic social media use was lower in grades 9 and 10 compared to grades 6 to 8 (21% vs. 9%, a 12-percentage point decline).
- In grades 6 to 8, 21% of TGD youth reported problematic social media use, a proportion 9 percentage points higher than cisgender girls and 14 percentage points higher than cisgender boys.
“The TGD youth I think they are looking for validation online.”
Intensive social media use
Figure 15.2. Students who report intensive social media (online contact “almost all the time throughout the day”, by grade and gender (%)
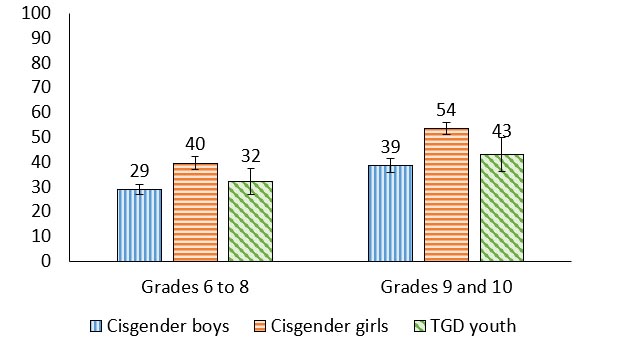
Figure 15.2: Text description
| Grade level | Cisgender boys | Cisgender girls | TGD youth |
|---|---|---|---|
| Grades 6 to 8 | 29 (26.9, 30.9) | 40 (37.1, 42.1) | 32 (27.0, 37.3) |
| Grades 9 to 10 | 39 (35.9, 41.3) | 54 (51.1, 55.9) | 43 (36.3, 49.8) |
Source: Health Behaviour in School-aged Children (HBSC), Canada, 2022 |
|||
- The proportion of youth reporting intensive social media use was higher in grades 9 and 10 compared to grades 6 to 8 for cisgender boys (29% vs. 39%, a 10 percentage point increase) and cisgender girls (40% vs. 54%, a 14 percentage point increase)
- In grades 6 to 8, 40% of cisgender girls reported intensive social media use, a proportion 11 percentage points higher than cisgender boys.
- In grades 9 and 10, 54% of cisgender girls reported intensive social media use, a proportion 15 percentage points more than cisgender boys and 11 percentage points more than TGD youth.
“Social media you’ll find most things are targeted towards women.”
Contemporary risk-taking behaviours
Figure 15.3. Engagement in contemporary risk-taking behaviours facilitated through social media at least 3-5 times during the past 12 months among grade 9 and 10 students (%)
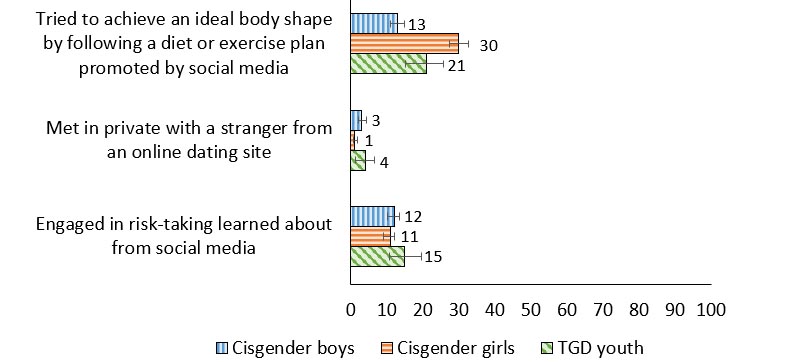
Figure 15.3: Text description
| Contemporary risk-taking behavior | Cisgender boys | Cisgender girls | TGD youth |
|---|---|---|---|
| Tried to achieve an ideal body shape by following a diet or exercise plan promoted by social media | 13 (11.0, 15.0) | 30 (27.5, 32.7) | 21 (15.2, 25.8) |
| Met in private with a stranger from an online dating site | 3 (2.2, 4.3) | 1 (0.7, 1.8) | 4 (1.2, 6.6) |
| Engaged in risk-taking learned about from social media | 12 (10.2, 13.5) | 11 (9.0, 12.2) | 15 (10.6, 19.7) |
Source: Health Behaviour in School-aged Children (HBSC), Canada, 2022 |
|||
- 30% of cisgender girls reported that they tried to achieve an ideal body shape by following a diet or exercise plan promoted by social media, compared to 21% of TGD youth and 13% of cisgender boys.
- Between 1% and 4% of youth met in private with a stranger from an online dating site.
- Between 11% and 15% of youth engaged in risk-taking that they learned about from social media.
Problematic social media use and mental health
| Gender | Grade | Affluence | Positive indicators | Negative indicators | ||
|---|---|---|---|---|---|---|
| Life satisfaction | WHO-5 Well-being | Lonely | Health complaints | |||
| Cisgender boys | 6 to 8 | Less | -.15 | .11 | .26 | .33 |
| More | -.25 | -.22 | .26 | .24 | ||
| 9 and 10 | Less | -.17 | NS | .17 | NS | |
| More | -.22 | -.24 | .21 | .27 | ||
| Cisgender girls | 6 to 8 | Less | -.40 | -.47 | .40 | .40 |
| More | -.35 | -.34 | .34 | .36 | ||
| 9 and 10 | Less | NS | -.27 | .28 | .18 | |
| More | -.21 | -.21 | .27 | .21 | ||
| TGD youth | 6 to 8 | Both affluence groups | -.25 | -.27 | .29 | .24 |
| 9 and 10 | -.19 | -.17 | .11 | .18 | ||
| Both grade groups | Less | -.25 | -.22 | .20 | .22 | |
| More | -.21 | -.25 | .22 | .21 | ||
| Overall | -.31 | -.32 | .33 | .34 | ||
- Problematic social media use was associated with poorer life satisfaction and higher levels of the negative mental health indicators, for all youth.
- Amongst cisgender boys, those who are more affluent had stronger correlations between problematic social media use and each mental health indicator when compared to less affluent cisgender boys.
- Grades 6 to 8 cisgender girls who are less affluent had moderate correlations between problematic social media use and the mental health indicators.
- TGD youth in grades 6 to 8, relative to TGD youth in grades 9 and 10, had a stronger correlation between problematic social media use and the mental health indicators.
Contemporary risk-taking behaviours and mental health
| Gender | Grade | Affluence | Positive indicators | Negative indicators | ||
|---|---|---|---|---|---|---|
| Life satisfaction | WHO-5 Well-being | Lonely | Health complaints | |||
Cisgender boys |
9 and 10 |
Less |
-.23 |
NS |
.26 |
.44 |
More |
-.14 |
-.10 |
.13 |
.17 |
||
Cisgender girls |
9 and 10 |
Less |
-.21 |
-.23 |
.36 |
.41 |
More |
-.24 |
-.18 |
.29 |
.31 |
||
TGD youth |
9 and 10 |
Both affluence groups |
-.18 |
-.10 |
NS |
.12 |
Less |
-.32 |
-.36 |
NS |
NS |
||
More |
-.12 |
NS |
NS |
NS |
||
Overall |
-.21 |
-.16 |
.23 |
.27 |
||
- Overall, contemporary risk-taking behaviours were associated with lower levels of the positive mental health indicators, and higher levels of the negative mental health indicators
- For cisgender boys and cisgender girls in grade 9 and 10 who are less affluent, there was a moderate positive relationship between contemporary risk-taking behaviours and health complaints.
- Generally, when compared to more affluent cisgender girls, those who are less affluent had stronger correlations between contemporary risk-taking behaviours and the mental health indicators.
- Similarly, for TGD youth, those who are less affluent had stronger correlations between contemporary risk-taking behaviours and the positive mental health indicators than those who are more affluent.
Summary of findings
Encouraging findings
- Cisgender boys reported the lowest levels of problematic social media use across grades 6 to 10.
Areas of concern
- Cisgender girls and TGD youth report the highest levels of problematic social media use, based on reporting patterns of use consistent with addiction. This is especially concerning for cisgender girls who are less affluent in grades 6 to 8, as they display moderate yet consistent correlations between problematic social media use and the mental health indicators.
- Cisgender students in grades 9 and 10 were more likely to report intensive social media use than their younger counterparts.
- Many young people reported engaging in a contemporary risk-taking behaviour. The most prevalent contemporary risk-taking behaviour that is facilitated through social media was trying to achieve an ideal body shape by following a diet or exercise plan promoted through social media.
Chapter 16: COVID-19 pandemic
The effects of the COVID-19 pandemic could be seen in all population groups across Canada, including our children and youth. While many adolescents were less vulnerable physiologically to contracting and experiencing serious complications from the virus, young people experienced interruptions to their routines, significant psychological distress,Reference 124 and shifting family dynamics which for some youth included increased rates of conflict or violence.Reference 125Reference 126 Facility closures, social distancing policies, and quarantine measures all invoked a loss of social connections.Reference 127 For many young people the majority of hours spent at home resulted in decreased physical activityReference 128Reference 129 and increased screen time.Reference 127Reference 129 The COVID-19 pandemic also dramatically influenced many aspects of the school environment for Canadian young people. Online learning and virtual classrooms occurred in many places, introducing challenges such as students feeling a lack of support from their school,Reference 130 not having adequate access to digital technologies,Reference 131 and disruptions to their school routines.Reference 132
Additionally, the pandemic exacerbated existing health inequities. For example, some children living in poverty experienced the deleterious effects of increased financial strain such as food insecurity.Reference 133 Those living in substandard housing conditions or experiencing homelessness were at an increased risk for contracting and transmitting the virus.Reference 134 Barriers to accessing the COVID-19 vaccine existed for many equity-deserving groups such as those who identify as BIPOC (Black, Indigenous, People of Colour) and/or sexual/gender minorities.Reference 135Reference 136 Finally, differences in material and structural opportunities, such as access to stable internet and a functional device, created inequitable education experiences.Reference 137
Description of items
In the HBSC survey, students were asked about the prevalence of testing positive for COVID-19 within their family and their vaccination status. Students also reported on the areas of their life that the pandemic impacted. In order to report on the association between reported impacts from the COVID-19 pandemic and mental health, a scale was derived from the items in Table 16.2 to create a range of values from 11 (low) to 55 (high).
Prevalence of Covid-19
| Item | Grades 6 to 8 | Grades 9 and 10 | ||||
|---|---|---|---|---|---|---|
| Cisgender boys | Cisgender girls | TGD youth | Cisgender boys | Cisgender girls | TGD youth | |
| Ever tested positive for COVID-19 | 54 | 53 | 48 | 53 | 56 | 46 |
| Anyone in close family tested positive for COVID-19 | 79 | 82 | 83 | 80 | 83 | 79 |
| If yes, any of these people treated in the hospital | 9 | 10 | 9 | 11 | 11 | 11 |
- Between 46 and 56% of youth reported that they had tested positive for COVID-19, dependent upon their grade level and gender.
- Between 79 and 83% of youth reported that anyone in their close family had tested positive for COVID-19.
- Of youth who responded that they themselves, or anyone in their close family had tested positive for COVID-19, between 9 to 11% reported that any of those people were treated in hospital.
Percent of students vaccinated
Figure 16.1. Students reporting on their COVID-19 vaccination status (%)
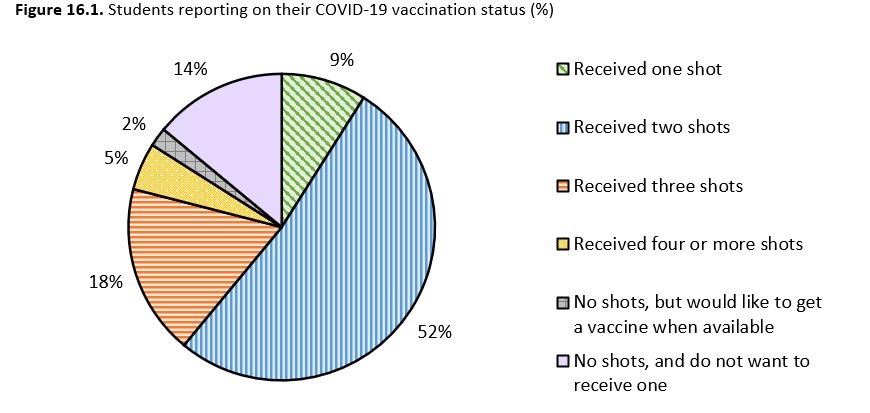
Figure 16.1: Text description
| Vaccination status | Percentage |
|---|---|
| Received one shot | 8 |
| Received two shots | 56 |
| Received three shots | 15 |
| Received four or more shots | 5 |
| No shots, but would like to get a vaccine when available | 2 |
| No shots, and do not want to receive one | 14 |
Source: Health Behaviour in School-aged Children (HBSC), Canada, 2022 |
|
- Approximately half of youth (56%) reported that they had received two COVID-19 vaccinations.
- 2% of youth had not received any COVID-19 vaccinations but reported that they would like to when the vaccine is available to them.
- 14% of youth reported that they had not received any COVID-19 vaccinations and that they did not want to receive one.
Negatively impacted by Covid-19 pandemic: “your life as a whole”
Figure 16.2. Students reporting that they were quite or very negatively impacted by the COVID-19 pandemic in the following way: “your life as a whole”, by grade and gender (%)
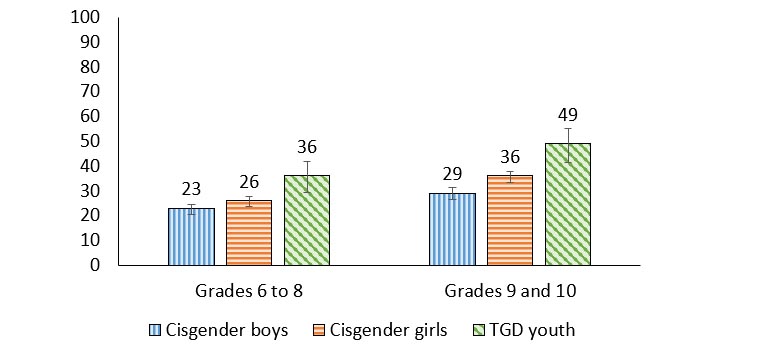
Figure 16.2: Text description
| Grade level | Cisgender boys | Cisgender girls | TGD youth |
|---|---|---|---|
| Grades 6 to 8 | 22.4 (20.6, 24.3) | 26 (23.8, 27.8) | 36 (29.3, 42.0) |
| Grades 9 to 10 | 28.9 (26.5, 31.4) | 35.5 (33.3, 37.7) | 48.6 (41.6, 55.3) |
Source: Health Behaviour in School-aged Children (HBSC), Canada, 2022 |
|||
- The proportion of students reporting that their life as a whole was negatively impacted by the COVID-19 pandemic was lower in grades 6 to 8 compared to grades 9 and 10 for cisgender boys (23% vs. 29%, a 6% difference) and cisgender girls (26% vs. 36%, a 10% difference).
- In grades 6 to 8, 36% of TGD youth reported that their life as a whole was negatively impacted by the COVID-19 pandemic, a proportion 10% higher than cisgender girls and 13% higher than cisgender boys.
- In grades 9 and 10, TGD youth reported the highest proportions of feeling that their life as a whole was negatively impacted by the COVID-19 pandemic (49%), followed by cisgender girls (36%) and cisgender boys (29%).
“Many people were negatively impacted by COVID-19. I think this because most people I talk about COVID-19 with say they were suffering from something whether temporary or still ongoing (anxiety, loneliness, playing catch up with social skills) as a result of it.”
Negatively impacted by Covid-19 pandemic: “your mental health”
Figure 16.3. Students reporting that they were quite or very negatively impacted by the COVID-19 pandemic in the following way: “your mental health (e.g., dealing with your emotions, stress, etc.)”, by grade and gender (%)
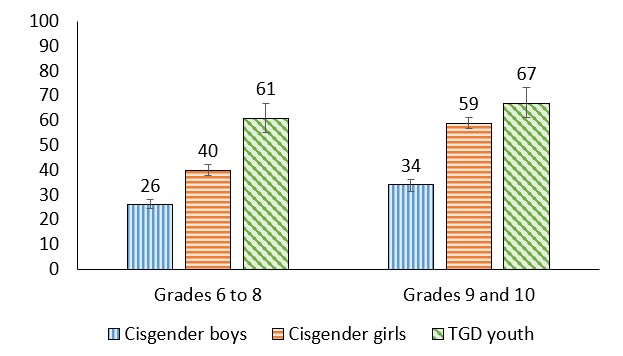
Figure 16.3: Text description
| Grade level | Cisgender boys | Cisgender girls | TGD youth |
|---|---|---|---|
| Grades 6 to 8 | 26 (24.5, 28.1) | 40 (37.7, 42.2) | 61 (55.0, 66.7) |
| Grades 9 to 10 | 34 (31.4, 36.2) | 59 (56.9, 61.4) | 67 (61.3, 73.5) |
Source: Health Behaviour in School-aged Children (HBSC), Canada, 2022 |
|||
- The proportion of students reporting that their mental health was negatively impacted by the COVID-19 pandemic was lower in grades 6 to 8 compared to grades 9 and 10 for cisgender boys (26% vs. 34%, an 8% difference) and cisgender girls (40% vs. 59%, a 19% difference).
- In general, cisgender boys reported the lowest proportions of their mental health being negatively impacted by the COVID-19 pandemic.
- In grades 6 to 8, TGD youth reported the highest proportions of feeling that their mental health was negatively impacted by the COVID-19 pandemic (61%), followed by cisgender girls (40%) and cisgender boys (26%).
- In grades 9 and 10, 34% of cisgender boys reported that their mental health was negatively impacted by the COVID-19 pandemic, a proportion 25% lower than cisgender girls and 33% lower than TGD youth.
“I am a grade 10 student. I struggled and coped with poor mental health during the COVID-19 Pandemic. And a good number of my peers struggle with their mental health. I would say 2 out of 5 people in my social circles have mental health struggles. It reflects my personal experiences.”
Negatively impacted by Covid-19 pandemic: “physical activity”
Figure 16.4. Students reporting that they were quite or very negatively impacted by the COVID-19 pandemic in the following way: “physical activity (e.g., sports, cycling, walking, etc.)”, by grade and gender (%)
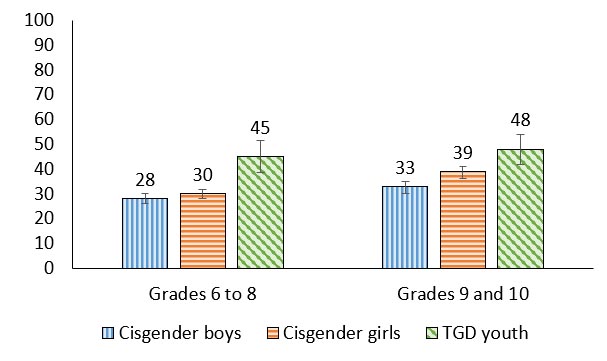
Figure 16.4: Text description
| Grade level | Cisgender boys | Cisgender girls | TGD youth |
|---|---|---|---|
| Grades 6 to 8 | 28 (26.2, 30.3) | 30 (27.9, 31.7) | 45 (38.6, 51.5) |
| Grades 9 to 10 | 33 (30.0, 35.0) | 39 (36.0, 41.0) | 48 (41.7, 54.0) |
Source: Health Behaviour in School-aged Children (HBSC), Canada, 2022 |
|||
- The proportion of cisgender girls reporting that their physical activity was negatively impacted by the COVID-19 pandemic was lower in grades 6 to 8 compared to grades 9 and 10 (30% vs. 39%, a 9% difference).
- In grades 6 to 8, 45% of TGD youth reported that their physical activity was negatively impacted by the COVID-19 pandemic, a proportion 15% greater than cisgender girls and 17% greater than cisgender boys.
- In grades 9 and 10, 48% of TGD youth reported that their physical activity was negatively impacted by the COVID-19 pandemic, a proportion 15% greater than cisgender boys and 9% greater than cisgender girls.
Negatively impacted by Covid-19 pandemic: “your sleep”
Figure 16.5. Students reporting that they were quite or very negatively impacted by the COVID-19 pandemic in the following way: “your sleep”, by grade and gender (%)
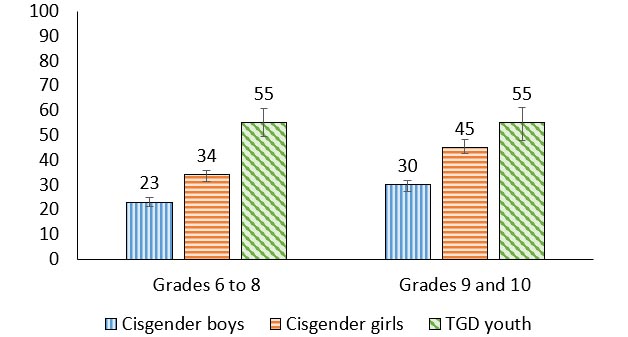
Figure 16.5: Text description
| Grade level | Cisgender boys | Cisgender girls | TGD youth |
|---|---|---|---|
| Grades 6 to 8 | 23 (21.2, 24.9) | 34 (31.5, 35.9) | 55 (49.5, 60.7) |
| Grades 9 to 10 | 30 (27.4, 31.8) | 45 (42.7, 48.1) | 55 (48.0, 61.1) |
Source: Health Behaviour in School-aged Children (HBSC), Canada, 2022 |
|||
- In general, cisgender boys reported the lowest proportions of the COVID-19 pandemic negatively impacting their sleep.
- The proportion of students reporting that their sleep was negatively impacted by the COVID-19 pandemic was lower in grades 6 to 8 compared to grades 9 and 10 for cisgender boys (23% vs. 30%, a 7% difference) and cisgender girls (34% vs. 45%, an 11% difference).
- In grades 6 to 8, TGD youth reported the largest proportion of feeling that their sleep was negatively impacted by the COVID-19 pandemic (55%), followed by cisgender girls (34%) and cisgender boys (23%).
- In grades 9 and 10, 30% of cisgender boys reported that their sleep was negatively impacted by the COVID-19 pandemic, a proportion 15% lower than cisgender girls and 25% lower than TGD youth.
“I believe that the accurate number of cisgender boys who were negatively impacted by COVID-19 would be about 60% whether that's socially (making friends, hanging out) or mentally (loneliness, anxiety, isolation, etc.).”
Negative impact of Covid-19 pandemic
| Item | Grades 6 to 8 | Grades 9 and 10 | ||||
|---|---|---|---|---|---|---|
| Cisgender boys | Cisgender girls | TGD youth | Cisgender boys | Cisgender girls | TGD youth | |
| Your health | 20 | 23 | 31 | 24 | 32 | 44 |
| Relationships with your family | 14 | 19 | 29 | 14 | 21 | 33 |
| Relationships with your friends | 21 | 22 | 30 | 22 | 29 | 29 |
| Your school performance | 24 | 27 | 43 | 39 | 43 | 50 |
| What you ate or drank | 17 | 23 | 33 | 23 | 36 | 43 |
| Your future expectations (e.g., exams, jobs, etc.) | 16 | 19 | 28 | 19 | 27 | 35 |
| Your family's financial situation | 16 | 20 | 23 | 18 | 24 | 30 |
- Among students in grades 6 to 8, of the options presented, school performance was the most commonly reported facet of life that was negatively impacted by the COVID-19 pandemic (24% of cisgender boys; 27% of cisgender girls; 43% of TGD youth).
- Similarly, among students in grades 9 and 10, of the options presented, school performance was the most commonly reported facet of life that was negatively impacted by the COVID-19 pandemic (39% of cisgender boys; 43% of cisgender girls; 50% of TGD youth).
- Overall, TGD youth were more likely than cisgender youth to report any area of their life was negatively impacted by the pandemic.
Covid-19 pandemic negatively impacted “your life as a whole” and mental health
| Gender | Grade | Affluence | Positive indicators | Negative indicators | ||
|---|---|---|---|---|---|---|
| Life satisfaction | WHO-5 Well-being | Lonely | Health complaints | |||
| Cisgender boys | 6 to 8 | Less | -.10 | NS | NS | .19 |
| More | -.16 | -.18 | .14 | .11 | ||
| 9 and 10 | Less | -.32 | -.24 | .20 | .18 | |
| More | -.31 | -.31 | .21 | .20 | ||
| Cisgender girls | 6 to 8 | Less | -.18 | -.14 | .18 | .16 |
| More | -.24 | -.27 | .24 | .22 | ||
| 9 and 10 | Less | -.16 | -.28 | .36 | .27 | |
| More | -.21 | -.23 | .20 | .21 | ||
| TGD youth | 6 to 8 | Both affluence groups | -.11 | -.20 | .19 | .19 |
| 9 and 10 | -.28 | -.21 | .20 | .25 | ||
| Both grade groups | Less | -.42 | -.40 | .46 | .31 | |
| More | -.15 | -.18 | .15 | .21 | ||
| Overall | -.24 | -.25 | .23 | .22 | ||
- Overall, COVID-19’s negative impact on students’ life as a whole was negatively associated with the positive mental health indicators and positively associated with the negative mental health indicators.
- Among cisgender boys, those who are older had the strongest correlations between COVID-19’s negative impact on students’ life as a whole and the mental health indicators.
- Among cisgender girls in grades 6 to 8, when compared to those who are less affluent, those who are more affluent had stronger correlations between COVID-19’s negative impact on students’ life as a whole and the mental health indicators.
- Overall, TGD youth who are less affluent had the strongest correlations between COVID-19’s negative impact on students’ life as a whole and the mental health indicators.
Summary of findings
Encouraging findings
- Approximately half of youth (56%) reported that they had received two COVID-19 vaccinations and 20% of youth reported that they had received more than two COVID-19 vaccinations.
Areas of concern
- In general, TGD youth were most likely to report that aspects of their life had been negatively impacted by the COVID-19 pandemic when compared to cisgender students.
- Among cisgender students, those in grades 9 and 10 were more likely than their counterparts in grades 6 to 8 to report that the COVID-19 pandemic negatively impacted their life as a whole, their mental health, and their sleep.
Chapter 17: Youth perspective and priorities
In this report, the HBSC investigators were intentional about seeking the views of young people. This is important in order to ground its findings in the lived experiences of young people who come from a range of backgrounds and contexts.
The HBSC Youth Advisors are a team of 12 young people from across Canada. This panel was established in order to gain youth insights at key development and interpretive stages of the HBSC study in Canada. This include providing insight on the importance of new items to be included in the survey questionnaire, focus group testing of specific items for clarity and understanding, and interpretation of the study findings as well as provision of advice for ongoing research. As part of this process, these advisors were asked to review each chapter and offer their perspective on its content. As part of this they provided reflective quotes in order for the reader to “hear their voice” when considering the survey results.
In a final summative focus group meeting, the youth advisors were also asked to consider the survey results as a whole, and then rank the most important issues that affect the health and well-being of young people in Canada but from their perspective. What follows is a brief summary of their insights, organized conceptually according to the most important themes and ideas that emerged from our discussions.
- Mental health remains a major priority for young people, especially in the aftermath of the COVID-19 pandemic. This is especially true for Canada’s cisgender girls and TGD youth. Overall, youth express a need for more supports and services at school and in the community to address their mental health issues.
“I am a cisgender girl. I feel like the findings correlate with my experiences but do not represent them fully. I am more lonely, less supported, less accepted, and I don't enjoy school as much because I cannot explore my interests fully. However, I am also less nervous and more confident in myself because I accept myself more.”
- Gendered expectations were a leading issue raised by many HBSC youth advisors. These expectations prescribe and surround the social norms associated with being a cisgender boy, cisgender girl, or a TGD youth in Canadian society. Many felt pressured to live according to stereotypical gendered roles that determine how they should behave, and these pressures were felt to have a negative effect on their health.
“I expected that less cisgender boys would report being lonely compared to their cisgender girl peers. I expected this because boys typically don't share their emotions as much and as a result are more likely to lie about them. I believe the cisgender boys did actually feel as much loneliness as cisgender girls but didn't want to admit it.”
- TGD youth report health disadvantages in many different ways. Many TGD youth lack strong positive relationships in the home, with their friends, and at school, and they also tend to feel unsafe in their communities. For the majority of health behaviours, TGD youth are experiencing the most problems, but (in the views of the HBSC youth advisors) are least likely to be recognized and supported as they deal with these problems on an ongoing basis.
“The gender issue is very confusing, depending on how you have been raised, and trying to figure out where you fit. And when you figure out your limited options when you don’t think you are a boy or girl, that can be really confusing. It can be overwhelming mentally and emotionally. Trying to find people who understand you can also be a challenge.”
“Don't ignore transgender and genderqueer youth, and uplift their voices! Sincerely, a genderqueer teen from Québec.”
- Social media is influencing a lot of health behaviours and experiences for youth. Some youth indicated that this issue became even more prominent during the pandemic.
“Social media has a very big impact on all of these themes. For example, diet, how we dress, how we look – social media might influence all of these things. Social media has an impact on almost all of the health topics.”
- Young people hope for more supports and connections in schools, in communities, and from the adults that surround them. Youth truly value their relationships with peers, parents, and teachers, and acknowledge that they play a central role in their behavioural choices. Young Canadians want adults to provide more support, and they want their school and communities to be safe places for them. They felt that the school system and related government authorities could be doing more to support them.
“I would say to school principals and government leaders that the youths need to be more taken care of, from vaping as little as grade 6 to not feeling safe in neighbourhood is not okay. As leaders they need to be taking actions, not just posting a poster about it in the hall but actually working with students and coming up with a plan on how to overcome these problems.”
- Risk-taking continues to evolve, with new expressions of behaviour replacing old (e.g., vaping replacing smoking, cyber-bullying replacing face-to-face bullying), and newer online expressions of risk-taking emerging as virtual communications become normative.
“Every time I go to the bathroom, it is hard to get around all of the girls vaping.”
Chapter 18: Key messages and themes
The HBSC survey provides an opportunity to understand the health and well-being of youth in grades 6 to 10 in Canada, with the goal of informing health policy, and health promotion programs. In this national report, we reported on the key findings for the 2022/23 survey.
The 2022 cycle of the HBSC study was unique as it was conducted after the COVID-19 pandemic and, consequently, allowed us to provide data on how youth were doing before and after the pandemic. A second novel feature in this report is that it is the first time that we can report on the health experiences of transgender and gender diverse (TGD) youth. In this chapter, we highlight the key findings from this report, as well as discuss the major themes that emerged when the results were considered as a whole.
Mental health
Compared with cisgender girls and TGD youth, cisgender boys reported relatively high levels of positive mental health indicators (i.e., life satisfaction, self-confidence) and relatively low levels of measures indicative of poor mental health (i.e., feeling nervous, loneliness, etc.). A concerning number of cisgender girls and TGD youth are reporting feeling “sad and hopeless”, “being lonely”, experiencing health complaints consistent with poor mental health, and low self-confidence. However, TGD youth are most likely to report these mental health concerns. In general, when contrasting the current survey results with past cycles of HBSC, girls and boys are reporting worse mental health outcomes over time.
Home and family
Most cisgender boys (e.g., 85% in grades 6 to 8) and cisgender girls (e.g., 74% in grades 6 to 8) reported having a happy home life. In contrast, TGD youth report having a more challenging and less supportive home life, with under half of TGD youth reporting ease of communication with their parents and over half of TGD youth in grades 9 and 10 reporting wanting to leave home. Having a happy home life and associated family support are each associated with positive mental health for all youth, but particularly among those who are less affluent.
Friends
Less than half of the youth reported having highly supportive friendships; however, more positively, the majority of young people reported that they found it easy to talk to their best friend. Communicating with friends online was more common among cisgender girls than cisgender boys and TGD youth. Friend support was associated with positive mental health status, particularly among cisgender girls.
School
Most youth reported liking school and being supported by teachers, although these feelings were lower for TGD youth. Only one-quarter of TGD youth reported being accepted by other students in their school. For both boys and girls, over time, a higher proportion of students have reported pressure due to schoolwork, with the proportions highest in girls. Positive school climates and caring teachers were associated with positive mental health for all youth.
Community
For girls, over time, there has been an increase in neighbourhood distrust. TGD youth were less likely to agree that they could trust people in their neighbourhood than cisgender girls who in turn were less likely to agree than cisgender boys. Community support was positively associated with higher life satisfaction and well-being for all youth. For less affluent TGD youth and less affluent cisgender girls in grades 6 to 8, these relationships were particularly strong.
Physical activity, screen time and sleep
Most cisgender boys reported high levels of physical activity, and the majority of cisgender youth met recommended sleep guidelines. Cisgender girls and TGD youth reported concerningly lower levels of physical activity, and TGD youth reported high levels of sleep difficulties (i.e., trouble falling asleep or staying asleep; daytime sleepiness). The vast majority of youth (89%-96%) did not meet recommended levels of daily screen time.
Healthy eating
Optimistically, the majority of youth reported that they had not experienced food insecurity. When considering a standard food security index, 34% of students reported low food security and 9% reported very low food security. As cisgender youth grew older, they were less likely to report health promoting practices like eating breakfast and also meals with family. Fruit and vegetable consumption declined from levels reported in past survey cycles, while the consumption of sweets and sugary soft drinks appears to be increasing. Overall, TGD youth reported the lowest levels of health promoting eating behaviours.
Healthy weights
The prevalence of youth with a body mass index classified as overweight or obese was high (e.g. , 22% for Grade 9 and 10 cisgender boys and 30% for Grade 9 and 10 cisgender girls). Over the last six cycles of the HBSC study the majority of boys and girls were categorized as being normal weight and the proportion of students reporting body mass indexes that were categorized as overweight or obese has remained relatively stable. TGD youth are more likely than cisgender youth to report that they feel their body is “too fat” and that they are teased about their body weight.
Injury and concussion
The proportion of students who reported experiencing a medically treated injury in the last 12 months declined from historical levels, perhaps influenced by the COVID-19 pandemic. One in ten young people reported experiencing a concussion, which is concerning due to both the short- and long-term effects on health and wellness of head injuries.
Bullying and teen dating violence
While fewer students reported bullying others since 2018, the proportion of youth who reported being bullied increased by 12%. TGD youth were the most likely to report being victimized by all forms of bullying. Reports of bullying are concerning as it was consistently associated with poorer mental health outcomes.
Between 5% and 22% of youth reported they had been victims of teen dating violence. Cisgender girls and TGD youth were more likely than cisgender boys to be victimized by their romantic partner through various forms of teen dating violence (i.e., control or emotional hurt; violence perpetrated through social media, etc.).
Spiritual health
Most cisgender youth reported that connections to self were important to them. This is encouraging as higher level of connections to self are predictive of positive mental health status. Cisgender girls reported relatively high levels of connections to others, which also strongly related to positive mental health. TGD youth, when compared to their cisgender peers, were least likely to place importance on connections to themselves, others, and the transcendent. A larger proportion of students in grades 6 to 8 than students in grades 9 and 10 reported that connections to nature were important to them.
Substance use
A very small proportion of youth report smoking cigarettes. However, vaping is common among all youth, with up to one in four students reporting having vaped by the time they reach grade 10. Rates of vaping are of particular concern in girls, with striking increases observed since 2018. Similarly, more girls are reporting having ever used cannabis. Increased vaping and cannabis use were also associated with negative mental health indicators.
Sexual health
Among young people who had engaged in sexual intercourse, similar proportions of cisgender boys and cisgender girls reported the use of contraceptives (mainly condoms). Cisgender girls and TGD youth in grades 9 and 10 were more likely than cisgender boys to report sexting behaviours. The 5% of youth who reported non-consensually sending someone else’s ‘sext’ was concerning.
Social media use
Cisgender girls and TGD youth report the highest proportions of problematic social media use and trying to achieve an ideal body shape in ways that were promoted on social media. Problematic social media use was associated with increased likelihoods of reporting loneliness and health complaints and also was associated with lower levels of life satisfaction and well-being. These relationships were particularly strong for less affluent cisgender girls.
Covid-19 and health
Overall, the COVID-19 pandemic had a negative impact on youth reports of life satisfaction and well-being and was also associated with increased loneliness and health complaints. While the extent of this impact seemed to be modest among most survey participants, it did have a pronounced negative impact on the lives of some groups of young people, especially TGD youth who were less affluent.
Emergent themes from the survey findings
- For the first time, the HBSC study has been able to document the health and health behaviour experiences of TGD youth. Findings are concerning, as TGD youth report worse states of health and more health risk behaviours for almost all of the available indicators in the survey.
- Developmental patterns remain an important concern. As young people of all genders age into grades 9 and 10, they are reporting higher levels for almost all negative health indicators, especially those pertaining to their mental health.
- The health of cisgender girls remains a concern, due to their reports of experiencing significant health problems in many domains.
- Relationships matter. Students who report strong relationships with their parents, families, friends and within their schools are much more likely to report better mental health and higher levels of well-being.
- Young people who face adversity can be empowered by positive environments at school, among peer groups, in the community, and especially at home. Among students who report the lowest levels of affluence, the number of health resources they have in their lives has a strong relationship with many positive health outcomes, including physical, social, emotional, and spiritual health.
- The COVID-19 pandemic had a negative impact on the lives of most young people, but the extent of this impact was modest among most survey participants. These findings suggest that perhaps young people are more resilient than they are given credit for.
References
- Reference 1
-
N.d. Health behaviour in school-aged children. https://hbsc.org
- Reference 2
-
Government of Canada. (2022, January 6). The health behaviour in school-aged children (HBSC) study in Canada. School health. https://www.canada.ca/en/public-health/services/child-infant-health/school-health/health-behaviour-school-aged-children.html
- Reference 3
-
N.d. About. Health behaviour in school-aged children. https://hbsc.org/about/
- Reference 4
-
Glatzer, W., & Gulyas, J. (2014) Cantril self-anchoring striving scale. In A. C. Michalos (Eds.),Encyclopedia of quality of life and well-being research. Springer. https://doi.org/10.1007/978-94-007-0753-5_259
- Reference 5
-
Topp, C. W., Østergaard, S. D., Søndergaard, S., & Bech, P. (2015). The Who-5 Well-Being Index: A systematic review of the literature. Psychotherapy and psychosomatics, 84(3), 167-176. https://doi.org/10.1159/000376585
- Reference 6
-
World Health Organization. (1998). Wellbeing measures in primary health care/The Depcare Project. https://iris.who.int/bitstream/handle/10665/349766/WHO-EURO-1998-4234-43993-62027-eng.pdf?sequence=1&isAllowed=y
- Reference 7
-
Crenshaw, K. (1991). Mapping the margins: Intersectionality, identity politics, and violence against women of color. Standford Law Review, 43(6), 1241-1299. https://doi.org/10.2307/1229039
- Reference 8
-
World Health Organization. (2022, June 17). Mental health. https://www.who.int/news-room/fact-sheets/detail/mental-health-strengthening-our-response
- Reference 9
-
Canadian Institute for Health Information. (2022). Children and youth mental health in Canada. https://www.cihi.ca/en/children-and-youth-mental-health-in-canada#:~:text=In%202020%2C%2058%25%20of%20hospitalizations,as%20males%20the%20same%20age
- Reference 10
-
Weins, K., Bhattarai, A., Pedram, A., Williams, D. J., Bulloch, A., & Patten, S. (2020). A growing need for youth mental health services in Canada: Examining trends in youth mental health from 2011 to 2018. Epidemiology and Psychiatric Sciences, 29, e115. https://doi.org/10.1017/S2045796020000281
- Reference 11
-
Agostino, H., Burstein, B., & Moubayed, D. (2021). Trends in the incidence of new-onset anorexia nervosa and atypical anorexia nervosa among youth during the COVID-19 pandemic in Canada. JAMA Network Open, 4(12), e2137395. doi:10.1001/jamanetworkopen.2021.37395
- Reference 12
-
Cost, K. T., Crosbie, J., Anagnostou, E., Birken, C. S., Charach, A., Monga, S., Kelley, E., Nicolson, R., Maguire, J. L., Burton, C. L., Schachar, R. J., Arnold, P. D., & Korczak, D. J. (2022). Mostly worse, occasionally better: Impact of COVID-19 pandemic on the mental health of Canadian children and adolescents. European Child & Adolescent Psychiatry, 31(4), 671-684. https://doi.org/10.1007/s00787-021-01744-3
- Reference 13
-
Craig, S. G., Ames, M. E., Bondi, B. C., & Pepler, D. J. (2023). Canadian adolescents’ mental health and substance use during the COVID-19 pandemic: Associations with COVID-19 stressors. Canadian Journal of Behavioural Science/Revue Canadienne des sciences du comportement, 55(1), 46-55. https://doi.org/10.1037/cbs0000305
- Reference 14
-
Hawke, L. D., Hayes, E., Darnay, K., & Henderson, J. (2021). Mental health among transgender and gender diverse youth: An exploration of effects during the COVID-19 pandemic. Psychology of Sexual Orientation and Gender Diversity, 8(2), 180-187. https://doi.org/10.1037/sgd0000467
- Reference 15
-
Gislason, M. K., Kennedy, A. M., & Witham, S. M. (2021). The interplay between social and ecological determinants of mental health and youth in the climate crisis. International Journal of Environmental Research and Public Health, 18(9), 4573. https://doi.org/10.3390/ijerph18094573
- Reference 16
-
Hrabok, M., Delorme, A., & Agyapong, V. I. O. (2020). Threats to mental health and well-being associated with climate change. Journal of Anxiety Disorders, 76, https://doi.org/10.1016/j.janxdis.2020.102295
- Reference 17
-
Fante-Coleman, T., & Jackson-Best, F. (2020). Barriers and facilitators to accessing mental healthcare in Canada for Black youth: A scoping review. Adolescent Research Review, 5,115-136. https://doi.org/10.1007/s40894-020-00133-2
- Reference 18
-
Richards, D., Gateri, H., & Massaquoi, N. (2018). The effects of intersectional stigma and discrimination on the mental well-being of Black, LBQ, female youth 18-25 years old. In S. Pashang, N. Khanlou, & J. Clarke (Eds.), Today’s youth and mental health(pp. 119-133).
- Reference 19
-
Abi-Jaoude, E., Naylor, K. T., & Pignatiello, A. (2020). Smartphones, social media use and youth mental health. CMAJ, 192(6), E136-E141. https://doi.org/10.1503/cmaj.190434
- Reference 20
-
Craig, W., Gariepy, G., Mayne, K., Atallah, R., & Georgiades, K. (2021). Mental health and problematic social media use in Canadian adolescents: Findings from the 2018 Health Behaviour of School-aged Children (HBSC) Study. Public Health Agency of Canada. https://www.canada.ca/content/dam/phac-aspc/documents/services/publications/science-research-data/mental-health-problematic-social-media-use-canadian-adolescents/mental-health-social-media-use-canadian-adolescents.pdf
- Reference 21
-
Statistics Canada. (2020). Canadian health survey on children and youth, 2019. https://www150.statcan.gc.ca/n1/en/daily-quotidien/200723/dq200723a-eng.pdf?st=wxUH4bcv
- Reference 22
-
Statistics Canada. (2022). Youth mental health in the spotlight again, as pandemic drags on. https://www.statcan.gc.ca/o1/en/plus/907-youth-mental-health-spotlight-again-pandemic-drags
- Reference 23
-
Topp, C. W., Østergaard, S. D., Søndergaard, S., & Bech, P. (2015). The Who-5 Well-Being Index: A systematic review of the literature. Psychotherapy and psychosomatics, 84(3), 167-176. https://doi.org/10.1159/000376585
- Reference 24
-
World Health Organization. (1998). Wellbeing measures in primary health care/The Depcare Project. https://iris.who.int/bitstream/handle/10665/349766/WHO-EURO-1998-4234-43993-62027-eng.pdf?sequence=1&isAllowed=y
- Reference 25
-
Berger, L. M., & Font, S. A. (2015). The role of the family and family-centered programs and policies. The Future of Children, 25(1), 155-176.
- Reference 26
-
Umberson, D., Williams, K., Thomas, P. A., Liu, H., & Thomeer, M. B. (2014). Race, gender, and chains of disadvantage: Childhood adversity, social relationships, and health. Journal of Health and Social Behavior, 55(1), 20-38. https://doi.org/10.1177/0022146514521426
- Reference 27
-
Umberson, D., & Thomeer, M. B. (2020). Family matters: Research on family ties and health, 2010-2020. Journal of Marriage and Family, 82(1), 404-419. https://doi.org/10.1111/jomf.12640
- Reference 28
-
Pyper, E., Harrington, D., & Manson, H. (2016). The impact of different types of parental support behaviors on child physical activity, healthy eating, and screen time: A cross-sectional study. BMC Public Health, 16(1). https://doi.org/10.1186/s12889-016-3245-0
- Reference 29
-
Widman, L., Choukas-Bradley, S., Noar, S. M., Nesi, J., & Garrett, K. (2016). Parent-adolescent sexual communication and adolescent safer sex behavior: A meta-analysis. JAMA Pediatrics, 170(1), 52-61. https://doi.org/10.1001/jamapediatrics.2015.2731
- Reference 30
-
Wang, C., La Salle, T. P., Do, K. A., Wu, C., & Sullivan, K. E. (2019). Does parental involvement matter for students’ mental health in middle school? School Psychology, 34(2), 222-232. https://doi.org/10.1037/spq0000300
- Reference 31
-
Simons, L., Schrager, S. M., Clark, L. F., Belzer, M., & Olson, J. (2013). Parental support and mental health among transgender adolescents. Journal of Adolescent Health, 53(6), 791-793. https://doi.org/10.1016/j.jadohealth.2013.07.019
- Reference 32
-
Bukowski, W. M., Simard, M., Dubois, M. E., & Lopez, L. A. (2011). Representations, process, and development: A new look at friendship in early adolescence. In E. Amsel & J. Smetana (Eds.), Adolescent vulnerabilities and opportunities(pp. 159-181). Cambridge University Press.
- Reference 33
-
Glaser, B., Shelton, K. H., & van den Bree, M. B. M. (2010). The moderating role of close friends in the relationship between conduct problems and adolescent substance use. Journal of Adolescent Health, 47(1), 35-42. https://doi.org/10.1016/j.jadohealth.2009.12.022
- Reference 34
-
Tomé, G., Gaspar de Matos, M., Simões, C., Camacho, I., & Alves Diniz, J. (2012). How can peer group influence behaviour of adolescents: Explanatory model. Global Journal of Health Science, 4(2), 26-35. https://doi.org/10.5539/gjhs.v4n2p26
- Reference 35
-
Eisenberg, D., Golberstein, E., & Whitlock, J. L. (2014). Peer effects on risky behaviors: New evidence from college roommate assignments. Journal of Health Economics, 33,126-138. https://doi.org/10.1016/j.jhealeco.2013.11.006
- Reference 36
-
Branstetter, S. A., Low, S., & Furman, W. (2010). The influence of parents and friends on adolescent substance use: A multidimensional approach. Journal of Substance Use, 16(2), 150-160. https://doi.org/10.3109/14659891.2010.519421
- Reference 37
-
Delgado, M. Y., Nair, R. L., Updegraff, K. A., & Umaña-Taylor, A. J. (2019). Discrimination, parent-adolescent conflict, and peer intimacy: Examining risk and resilience in Mexican-origin youths’ adjustment trajectories. Child Development, 90(3), 894-910. https://doi.org/10.1111/cdev.12969
- Reference 38
-
Erath, S. A., Flanagan, K. S., Bierman, K. L., & Tu, K. M. (2010). Friendships moderate psychosocial maladjustment in social anxious early adolescents. Journal of Applied Developmental Psychology, 31(1), 15-26. https://doi.org/10.1016/j.appdev.2009.05.005
- Reference 39
-
Holt-Lunstad, J. (2017). Friendship and health. In M. Hojjat & A. Moyer (Eds.), The psychology of friendship(pp. 233-244). Oxford University Press.
- Reference 40
-
Wang, M.-T., & Degol, J. L. (2016). School climate: A review of the construct, measurement, and impact on student outcomes. Educational Psychology Review, 28, 315-352. https://doi.org/10.1007/s10648-015-9319-1
- Reference 41
-
Aldridge, J. M., & McChesney, K. (2018). The relationships between school climate and adolescent mental health and well-being: A systematic literature review. International Journal of Educational Research, 88,121-145. https://doi.org/10.1016/j.ijer.2018.01.012
- Reference 42
-
Joyce, H. D., & Early, T. J. (2014). The impact of school connectedness and teacher support on depressive symptoms in adolescents: A multilevel analysis. Children and Youth Services Review, 39,101-107. https://doi.org/10.1016/j.childyouth.2014.02.005
- Reference 43
-
Harding, S., Morris, R., Gunnell, D., Ford, T., Hollingworth, W., Tilling, K., Evans, R., Bell, S., Grey, J., Brockman, R., Campbell, R., Araya, R., Murphy, S., & Kidger, J. (2019). Is teachers’ mental health and well-being associated with students’ mental health and well-being? Journal of Affective Disorders, 242,180-187. https://doi.org/10.1016/j.jad.2018.08.080
- Reference 44
-
Athanases, S. Z., & De Oliveira, L. C. (2022). Advocacy for equity in classrooms and beyond: New teachers’ challenges and responses. Teachers College Record, 110(1), 64-104. https://doi.org/10.1177/016146810811000101
- Reference 45
-
Roberts, J. L., & Siegle, D. (2012). Teachers as advocates: If not you-who? Gifted Child Today, 35(1), 58-61. https://doi.org/10.1177/1076217511427432
- Reference 46
-
Pulimeno, M., Piscitelli, P., Miani, A., Colao, A., & Colazzo, S. (2020). Training teachers as health promoters. Journal of Interdisciplinary Research Applied to Medicine, 4(1), 37-46.
- Reference 47
-
Holland, J., Reynolds, T., & Weller, S. (2007). Transitions, networks, and communities: The significance of social capital in the lives of children and young people. Journal of Youth Studies, 10(1), 97-116. https://doi.org/10.1080/13676260600881474
- Reference 48
-
Cicognani, E., Mazzoni, D., Albanesi, C., & Zani, B. (2014). Sense of community and empowerment among young people: Understanding pathways from civic participation to social well-being. Voluntas: International Journal of Voluntary and Nonprofit Organizations, 26,24-44. https://doi.org/10.1007/s11266-014-9481-y
- Reference 49
-
Ballard, P. J. (2014). What motivates youth civic involvement? Journal of Adolescent Research, 29(4), 439-463. https://doi.org/10.1177/0743558413520224
- Reference 50
-
Outley, C., Bocarro, J. N., & Boleman, C. T. (2011). Recreation as a component of the community youth development system. New Directions for Youth Development, 2011(130), 59-72. https://doi.org/10.1002/yd.397
- Reference 51
-
Perkins, D. F., Borden, L. M., Villarruel, F. A., Carlton-Hug, A., Stone, M. R., & Keith, J. G. (2007). Participation in structured youth programs: Why ethnic minority urban youth choose to participate—or not to participate. Youth and Society, 38(4), 420-442. https://doi.org/10.1177/0044118X06295051
- Reference 52
-
Brooks, F. M., Magnusson, J., Spencer, N., & Morgan, A. (2012). Adolescent multiple risk behavior: An asset approach to the role of family, school and community. Journal of Public Health, 34(1), i48-i56. https://doi.org/10.1093/pubmed/fds001
- Reference 53
-
Ivert, A.-K., & Levander, M. T. (2013). Adolescents’ perceptions of neighbourhood social characteristics—Is there a correlation with mental health? Child Indicators Research, 7,177-192. https://doi.org/10.1007/s12187-013-9210-x
- Reference 54
-
Kingsbury, M., Clayborne, Z., Colman, I., & Kirkbride, J. B. (2020). The protective effect of neighbourhood social cohesion on adolescent mental health following stressful life events. Psychological Medicine, 50(8), 1292-1299. https://doi.org/10.1017/S0033291719001235
- Reference 55
-
World Health Organization. (2022). Physical activity. https://www.who.int/news-room/fact-sheets/detail/physical-activity
- Reference 56
-
Canadian Society for Exercise Physiology. (2021). Children (5-11 years) and youth (12-17 years). 24-Hour movement guidelines. https://csepguidelines.ca/guidelines/children-youth/
- Reference 57
-
Biddle, S. J. H., Ciaccioni, S., Thomas, G., & Vergeer, I. (2019). Physical activity and mental health in children and adolescents: An updated review of reviews and an analysis of causality. Psychology of Sport and Exercise, 42,146-155. https://doi.org/10.1016/j.psychsport.2018.08.011
- Reference 58
-
Valkenborghs, S. R., Noetel, M., Hillman, C. H., Nilsson, M., Smith, J. J., Ortega, F. B., & Lubans, D. R. (2019). The impact of physical activity on brain structure and function in youth: A systematic review. Pediatrics, 144(4), e20184032. https://doi.org/10.1542/peds.2018-4032
- Reference 59
-
Anderson, E., & Durstine, J. L. (2019). Physical activity, exercise, and chronic disease: A brief review. Sports Medicine and Health Science, 1(1),3-10. https://doi.org/10.1016/j.smhs.2019.08.006
- Reference 60
-
Government of Canada. (2016, April 26). Sedentary behaviour in children and youth: A new health risk. Government of Canada. https://health-infobase.canada.ca/datalab/sedentary-blog.html
- Reference 61
-
Pate, R. R., Mitchell, J. A., Byun, W., & Dowda, M. (2011). Sedentary behaviour in youth. British Journal of Sports Medicine, 45(11), 906-913. https://doi.org/10.1136/bjsports-2011-090192
- Reference 62
-
Uddin, R., Burton, N. W., Maple, M., Khan, S. R., Tremblay, M. S., & Khan, A. (2020). Low physical activity and high sedentary behaviours are associated with adolescents’ suicidal vulnerability: Evidence from 52 low- and middle-income countries. Acta Paediatrica, 109(6),1252-1259. https://doi.org/10.1111/apa.15079
- Reference 63
-
Doggett, A., Qian, W., Godin, K., De Groh, M., & Leatherdale, S. T. (2019). Examining the association between exposure to various screen time sedentary behaviours and cannabis use among youth in the COMPASS study. SSM-Population Health, 9, https://doi.org/10.1016/j.ssmph.2019.100487
- Reference 64
-
Štefan, L., Horvatin, M., & Baić, M. (2019). Are sedentary behaviours associated with sleep duration? A cross-sectional case from Croatia. International Journal of Environmental Research and Public Health, 16(2), 200. https://doi.org/10.3390/ijerph16020200
- Reference 65
-
Tarokh, L., Saletin, J. M., & Carskadon, M. A. (2016). Sleep in adolescence: Physiology, cognition and mental health. Neuroscience & Biobehavioral Reviews, 70, 182-188. https://doi.org/10.1016/j.neubiorev.2016.08.008
- Reference 66
-
Shochat, T., Cohen-Zion, M., & Tzischinsky, O. (2014). Functional consequences of inadequate sleep in adolescents: A systematic review. Sleep Medicine Reviews, 18(1), 75-87. https://doi.org/10.1016/j.smrv.2013.03.005
- Reference 67
-
Wang, C., Dopko, R. L., Clayborne, Z. M., Capaldi, C. A., Roberts, K. C., & Betancourt, M. T. (2022). Investigating the association between sleep and aspects of mental health in children: Findings from the Canadian Health Survey on Children and Youth. Health Promotion & Chronic Disease Prevention in Canada, https://doi.org/10.24095/hpcdp.42.11/12.02
- Reference 68
-
Health Canada. (2019). Canada’s Food Guide: Healthy eating recommendations. https://food-guide.canada.ca/en/healthy-eating-recommendations/
- Reference 69
-
Doggui, R., Ward, S., Johnson, C., & Bélanger, M. (2021). Trajectories of eating behavior changes during adolescence. Nutrients, 13(4), 1313. https://doi.org/10.3390/nu13041313
- Reference 70
-
Marcone, M. F., Madan, P., & Grodzinski, B. (2020). An overview of the sociological and environmental factors influencing eating food behavior in Canada. Frontiers in Nutrition, 7, 77. https://doi.org/10.3389/fnut.2020.00077
- Reference 71
-
Kansra, A. R., Lakkunarajah, S., & Jay, M. S. (2021). Childhood and adolescent obesity: A review. Frontiers in Pediatrics, 8, https://doi.org/10.3389/fped.2020.581461
- Reference 72
-
Haqq, A. M., Kebbe, M., Tan, Q., Manco, M., & Salas, X. R. (2021). Complexity and stigma of pediatric obesity. Childhood Obesity, 17(4), 229-240. https://doi.org/10.1089/chi.2021.0003
- Reference 73
-
Rao, D. P., Kropac, E., Do, M. T., Roberts, K. C., & Jayaraman, G. C. (2016). Childhood overweight and obesity trends in Canada. Health Promotion and Chronic Disease Prevention Canada, 36(9), 194-198. https://doi.org/10.24095/hpcdp.36.9.03
- Reference 74
-
Brooks, S. J., Feldman, I., Schiöth, H. B., & Titova, O. E. (2021). Important gender differences in psychosomatic and school-related complaints in relation to adolescent weight status. Scientific Reports, 11(14147). https://doi.org/10.1038/s41598-021-93761-0
- Reference 75
-
Bartlett, S., Bataineh, J., Thompson, W., & Pickett, W. (2023). Correlations between weight perception and overt risk-taking among Canadian adolescents. Canadian Journal of Public Health, 114(6), 1019-1028. https://doi.org/10.17269/s41997-023-00778-1
- Reference 76
-
Onis, M. D., Onyango, A. W., Borghi, E., Siyam, A., Nishida, C., & Siekmann, J. (2007). Development of a WHO growth reference for school-aged children and adolescents. Bulletin of the World Health Organization, 85(9), 660-667. https://doi.org/10.2471/blt.07.043497
- Reference 77
-
Statistics Canada. (2023). Body mass index, overweight or obese, self-reported, youth (12-17 years old) [Data set]. from https://www150.statcan.gc.ca/t1/tbl1/en/tv.action?pid=1310009621
- Reference 78
-
Dzielska, A., & Woynarowska, M. (2022). Psychosocial predictors of body weight congruence in adolescents aged 15 and 17 years in Poland: Findings from the Health Behaviour in School-Aged Children (HBSC) Study. International Journal of Environmental Research and Public Health, 19(4), 2342. https://doi.org/10.3390/ijerph19042342
- Reference 79
-
Geraets, A. F. J., Cosma, A., Fismen, A.-S., Ojala, K., Pierannunzio, D., Kelly, C., Melkumova, M., Vassallo, C., Rakic, J. G., & Heinz, A. (2023). Cross-national time trends in adolescent body weight perception and the explanatory role of overweight/obesity prevalence. Child and Adolescent Obesity, 6(1). https://doi.org/10.1080/2574254X.2023.2218148
- Reference 80
-
Sleet, D. A. (2018). The global challenge of child injury prevention. International Journal of Environmental Research and Public Health, 15(9), 1921. https://doi.org/10.3390/ijerph15091921
- Reference 81
-
Pratt, B., Cheesman, J., Breslin, C., & Do, M. T. (2016). Occupational injuries in Canadian youth: An analysis of 22 years of surveillance data collected from the Canadian hospitals injury reporting and prevention program. Health Promotion and Chronic Disease Prevention in Canada, 36(5), 89-98. https://doi.org/10.24095/hpcdp.36.5.01
- Reference 82
-
Black, A. M., Meeuwisse, D. W., Eliason, P. H., Hagel, B. E., & Emery, C. A. (2021). Sport participation and injury rates in high school students: A Canadian survey of 2029 adolescents. Journal of Safety Research, 78,314-321. https://doi.org/10.1016/j.jsr.2021.06.008
- Reference 83
-
Fridman, L., Fraser-Thomas, J. L., Pike, I., & Macpherson, A. K. (2018). Childhood road traffic injuries in Canada-a provincial comparison of transport injury rates over time. BMC Public Health, 18, https://doi.org/10.1186/s12889-018-6269-9
- Reference 84
-
Keays, G., Friedman, D., & Gagnon, I. (2020). Original quantitative research-Pediatric injuries in the time of COVID-19. Health Promotion and Chronic Disease Prevention in Canada, 40(11-12), 336-341. https://doi.org/10.24095/hpcdp.40.11/12.02
- Reference 85
-
Russell, K., Selci, E., Black, B., Cochrane, K., & Ellis, M. (2019). Academic outcomes following adolescent sport-related concussion or fracture injury: A prospective cohort study. PLoS ONE, 14(4), e0215900. https://doi.org/10.1371/journal.pone.0215900
- Reference 86
-
Daley, M. M., Shoop, J., & Meehan III, W. P. (2023). Psychological consequences of concussion. In M. A. Christino, E. I. Pluhar, & L. J. Micheli (Eds.), Psychological considerations in the young athlete(pp. 117-134).
- Reference 87
-
Choudhury, R., Kolstad, A., Prajapati, V., Samuel, G., & Yeates, K. O. (2020). Loss and recovery after concussion: Adolescent patients give voice to their concussion experience. Health Expectations, 23(6), 1533-1542. https://doi.org/10.1111/hex.13138
- Reference 88
-
Hellström, L., Thornberg, R., & Espelage, D. L. (2021). Definitions of Bullying. In P. K. Smith & J. O. Norman (Eds.), The Wiley blackwell handbook of bullying: A comprehensive and international review of research and intervention. John Wiley & Sons.
- Reference 89
-
Coyle, S., Cipra, A., & Rueger, S. Y. (2021). Bullying types and roles in early adolescence: Latent classes of perpetrators and victims. Journal of School Psychology, 89,51-71. https://doi.org/10.1016/j.jsp.2021.09.003
- Reference 90
-
Mishna, F., Sanders, J. E., McNeil, S., Fearing, G., & Kalenteridis, K. (2020). "If somebody is different": A critical analysis of parent, teacher, and student perspectives on bullying and cyberbullying. Children and Youth Services Review, 118, https://doi.org/10.1016/j.childyouth.2020.105366
- Reference 91
-
Romano, I., Butler, A., Patte, K. A., Ferro, M. A., & Leatherdale, S. T. (2019). High school bullying and mental disorder: An examination of the association with flourishing and emotional regulation. International Journal of Bullying Prevention, 2,241-252. https://doi.org/10.1007/s42380-019-00035-5
- Reference 92
-
Yokoji, K., Hammami, N., & Elgar, F. J. (2023). Socioeconomic differences in the association between bullying behaviors and mental health in Canadian adolescents. Journal of School Health, 93(5), 420-427. https://doi.org/10.1111/josh.13300
- Reference 93
-
Stewart-Tufescu, A., Salmon, S., Taillieu, T., Fortier, J., & Afifi, T. O. (2019). Victimization experiences and mental health outcomes among grades 7 to 12 students in Manitoba, Canada. International Journal of Bullying Prevention, 3(1),1-12. https://doi.org/10.1007/s42380-019-00056-0
- Reference 94
-
Halliday, S., Gregory, T., Taylor, A., Digenis, C., & Turnbull, D. (2021). The impact of bullying victimization in early adolescence on subsequent psychosocial and academic outcomes across the adolescent period: A systematic review. Journal of School Violence, 20(3), 351-373. https://doi.org/10.1080/15388220.2021.1913598
- Reference 95
-
Exner-Cortens, D., Baker, E., & Craig, W. (2021). The national prevalence of adolescent dating violence in Canada. Journal of Adolescent Health, 69(3), 495-502. https://doi.org/10.1016/j.jadohealth.2021.01.032
- Reference 96
-
Exner-Cortens, D., Baker, E., & Craig, W. (2023). Canadian adolescents’ experiences of dating violence: Associations with social power imbalances. Journal of Interpersonal Violence, 38(1-2). https://doi.org/10.1177/08862605221092072
- Reference 97
-
Taquette, S. R., & Monteiro, D. L. M. (2019). Causes and consequences of adolescent dating violence: A systematic review. Journal of Injury and Violence Research, 11(2), 137-147. https://doi.org/10.5249/jivr.v11i2.1061
- Reference 98
-
Scales, P. C., Syversten, A. K., Benson, P. L., Roehlkepartain, E. C., & Sesma, A. (2014). Relation of spiritual development to youth health and well-being: Evidence from a global study. In A. Ben-Arieh, F. Casas, I. Frønes, & J. E. Korbin (Eds.), Handbook of Child Well-being: Theories, methods & policies in global perspective (Vol. 2). Springer. https://doi.org/10.1007/978-90-481-9063-8_41
- Reference 99
-
Michaelson, V. (2020). Developing a definition of spiritual health for Canadian young people: A qualitative study. International Journal of Children’s Spirituality, 26(1-2), 67-85. https://doi.org/10.1080/1364436X.2020.1856048
- Reference 100
-
Michaelson, V., Šmigelskas, K., King, N., Inchley, J., Malinowska-Cieślik, M., & Pickett, W. (2023). Domains of spirituality and their importance to the health of 75,533 adolescents in 12 countries. Health Promotion International, 38(3), daab185. https://doi.org/10.1093/heapro/daab185
- Reference 101
-
Michaelson, V., King, N., Inchley, J., Currie, D., Brooks, F., & Pickett, W. (2019). Domains of spirituality and their associations with positive mental health: A study of adolescents in Canada, England, and Scotland. Preventive Medicine, 125, 12-18. https://doi.org/10.1016/j.ypmed.2019.04.018
- Reference 102
-
Ciranka, S., & van den Bos, W. (2021). Adolescent risk-taking in the context of exploration and social influence. Developmental Review, 61. https://doi.org/10.1016/j.dr.2021.100979
- Reference 103
-
Gray, K. M., & Squeglia, L. M. (2018). Research review: What have we learned about adolescent substance use? Journal of Child Psychology and Psychiatry, 59(6), 618-627. https://doi.org/10.1111/jcpp.12783
- Reference 104
-
Wiley, E. R., & Seabrook, J. A. (2023). Nicotine and nicotine-free vaping behavior among a sample of Canadian high school students: A cross-sectional study. Children, 10(2), 368. https://doi.org/10.3390/children10020368
- Reference 105
-
East, K. A., Reid, J. L., & Hammond, D. (2023). Smoking and vaping among Canadian youth and adults in 2017 and 2019. Tobacco Control, 32(2), 259-262. https://doi.org/10.1136/tobaccocontrol-2021-056605
- Reference 106
-
Leatherdale, S. T., & Burkhalter, R. (2012). The substance use profile of Canadian youth: Exploring the prevalence of alcohol, drug, and tobacco use by gender and grade. Addictive Behaviors, 37(3), 318-322. https://doi.org/10.1016/j.addbeh.2011.10.007
- Reference 107
-
Zuckermann, A. M. E., Williams, G. C., Battista, K., Jiang, Y., de Groh, M., & Leatherdale, S. T. (2020). Prevalence and correlates of youth poly-substance use in the COMPASS study. Addictive Behaviors, 107. https://doi.org/10.1016/j.addbeh.2020.106400
- Reference 108
-
Olmstead, S. B. (2020). A decade review of sex and partnering in adolescence and young adulthood. Journal of Marriage and Family, 82(2), 769-795. https://doi.org/10.1111/jomf.12670
- Reference 109
-
Wood, J., McKay, A., Wentland, J., & Byers, S. E. (2021). Attitudes towards sexual health education in schools: A national survey of parents in Canada. The Canadian Journal of Human Sexuality, 30(1), 39-55. https://doi.org/10.3138/cjhs.2020-0049
- Reference 110
-
Laverty, E. K., Noble, S. M., Pucci, A., & MacLean, R. E. D. (2021). Let’s talk about sexual health education: Youth perspectives on their learning experiences in Canada. The Canadian Journal of Human Sexuality, 30(1), 26-38. https://doi.org/10.3138/cjhs.2020-0051
- Reference 111
-
Ketting, E., Brockschmidt, L., & Ivanova, O. (2021). Investigating the ‘C’ in CSE: Implementation and effectiveness of comprehensive sexuality education in the WHO European region. Sex Education, 21(2), 133-147. https://doi.org/10.1080/14681811.2020.1766435
- Reference 112
-
Gazendam, N., Cleverley, K., King, N., Pickett, W., & Phillips, S. P. (2020). Individual and social determinants of early sexual activity: A study of gender-based differences using the 2018 Canadian Health Behaviour in School-aged Children Study (HBSC). PLoS ONE, 15(9), e0238515. https://doi.org/10.1371/journal.pone.0238515
- Reference 113
-
Kahn, N. F., & Halpern, C. T. (2018). Associations between patterns of sexual initiation, sexual partnering, and sexual health outcomes from adolescence to early adulthood. Archives of Sexual Behavior, 47(6), 1791-1810. https://doi.org/10.1007/s10508-018-1176-9
- Reference 114
-
Schimmele, C., Fonberg, J., & Schellenberg, G. (2021). Canadians’ assessments of social media in their lives. Economic and Social Reports, 1(3). https://doi.org/10.25318/36280001202100300004-eng
- Reference 115
-
Li, X., Vanderloo, L. M., Keown-Stoneman, C. D. G., Cost, K. T., Charach, A., Maguire, J. L., Monga, S., Crosbie, J., Burton, C., Anagnostou, E., Georgiades, S., Nicolson, R., Kelley, E., Ayub, M., Korczak, D. J., & Birken, C. S. (2021). Screen use and mental health symptoms in Canadian children and youth during the COVID-19 pandemic. JAMA Network Open, 4(12), e2140875. doi:10.1001/jamanetworkopen.2021.40875
- Reference 116
-
Kim, S., Belfry, K. D., Crawford, J., MacDougall, A., & Kolla, N. J. (2023). COVID-19 related anxiety and the role of social media among Canadian youth. Frontiers in Psychiatry, 14, 1029082. https://doi.org/10.3389/fpsyt.2023.1029082
- Reference 117
-
Marino, C., Lenzi, M., Canale, N., Pierannunzio, D., Dalmasso, P., Borraccino, A., Cappello, N., Lemma, P., Vieno, A., & the 2018 HBSC-Italia Group. (2020). Problematic social media use: Associations with health complaints among adolescents. Annali dell'Istituto Superiore di Sanità, 56(4), 514-521. https://doi.org/10.4415/ANN_20_04_16
- Reference 118
-
Paakkari, L., Tynjälä, J., Lahti, H., Ojala, K., & Lyyra, N. (2021). Problematic social media use and health among adolescents. International Journal of Environmental Research and Public Health, 18(4), 1885. https://doi.org/10.3390/ijerph18041885
- Reference 119
-
Plaisime, M., Robertson-James, C., Mejia, L., Núñez, A., Wolf, J., & Reels, S. (2020). Social media and teens: A needs assessment exploring the potential role of social media in promoting health. Social Media + Society, 6(1). https://doi.org/10.1177/2056305119886025
- Reference 120
-
Rideout, V., & Fox, S. (2018). Digital health practices, social media use, and mental well-being among teens and young adults in the U.S. Providence St. Joseph Health Digital Commons Articles, Abstracts, and Reports, 1093.
- Reference 121
-
Pretorius, C., Chambers, D., & Coyle, D. (2019). Young people’s online help-seeking and mental health difficulties: Systematic narrative review. Journal of Medical Internet Research, 21(11), e13873. https://doi.org/10.2196/13873
- Reference 122
-
Nagata, J. M. (2020). New findings from the health behaviour in school-aged children (HBSC) survey: Social media, social determinants, and mental health. Journal of Adolescent Health, 66(6S), S1-S2. https://doi.org/10.1016/j.jadohealth.2020.03.024
- Reference 123
-
Vannucci, A., Simpson, E. G., Gagnon, S., & Ohannessian, C. M. (2020). Social media use and risky behaviours in adolescents: A meta-analysis. Journal of Adolescence, 79,258-274. https://doi.org/10.1016/j.adolescence.2020.01.014
- Reference 124
-
Craig, S. G., Ames, M. E., Bondi, B. C., & Pepler, D. J. (2023). Canadian adolescents’ mental health and substance use during the COVID-19 pandemic: Associations with COVID-19 stressors. Canadian Journal of Behavioural Science/Revue Canadienne des sciences du comportement, 55(1), 46-55. https://doi.org/10.1037/cbs0000305
- Reference 125
-
Cassinat, J. R., Whiteman, S. D., Serang, S., Dotterer, A. M., Mustillo, S. A., Maggs, J. L., & Kelly, B. C. (2021). Changes in family chaos and family relationships during the COVID-19 pandemic: Evidence from a longitudinal study. Developmental Psychology, 57(10), 1597-1610. https://doi.org/10.1037/dev0001217
- Reference 126
-
Sinko, L., He, Y., Kishton, R., Ortiz, R., Jacobs, L., & Fingerman, M. (2022). “The stay at home order is causing things to get heated up”: Family conflict dynamics during COVID-19 from the perspectives of youth calling a national child abuse hotline. Journal of Family Violence, 37(5),837-846. https://doi.org/10.1007/s10896-021-00290-5
- Reference 127
-
Ashwin, A., Cherukuri, S. D., & Rammohan, A. (2022). Negative effects of COVID-19 pandemic on adolescent health: Insights, perspectives, and recommendations. Journal of Global Health, 12, https://doi.org/10.7189/jogh.12.03009
- Reference 128
-
Moore, S. A., Faulkner, G., Rhodes, R. E., Brussoni, M., Chulak-Bozzer, T., Ferguson, L. J., Mitra, R., O’Reilly, N., Spence, J. C., Vanderloo, L. M., & Tremblay, M. S. (2020). Impact of the COVID-19 virus outbreak on movement and play behaviours of Canadian children and youth: A national survey. International Journal of Behavioral Nutrition and Physical Activity, 17. https://doi.org/10.1186/s12966-020-00987-8
- Reference 129
-
Duncan, M. J., Riazi, N. A., Faulkner, G., Gilchrist, J. D., Leatherdale, S. T., & Patte, K. A. (2022). Changes in Canadian adolescent time use and movement guidelines during the early COVID-19 outbreak: A longitudinal prospective natural experiment design. Journal of Physical Activity and Health, 19(8),566-577. https://doi.org/10.1123/jpah.2021-0691
- Reference 130
-
Nandlall, N., Hawke, L. D., Hayes, E., Darnay, K., Daley, M., Relihan, J., & Henderson, J. (2022). Learning through a pandemic: Youth experiences with remote learning during the COVID-19 pandemic. SAGE Open, 12(3). https://doi.org/10.1177/21582440221124122
- Reference 131
-
Whitley, J., Beauchamp, M. H., & Brown, C. (2021). The impact of COVID-19 on the learning and achievement of vulnerable Canadian children and youth. FACETS, 6,1693-1713. https://doi.org/10.1139/facets-2021-0096
- Reference 132
-
Segre, G., Campi, R., Scarpellini, F., Clavenna, A., Zanetti, M., Cartabia, M., & Bonati, M. (2021). Interviewing children: The impact of the COVID-19 quarantine on children’s perceived psychological distress and changes in routine. BMC Pediatrics, 21(231). https://doi.org/10.1186/s12887-021-02704-1
- Reference 133
-
Suleman, S., Ratnani, Y., Stockley, K., Jetty, R., Smart, K., Bennett, S., Gander, S., & Loock, C. (2020). Supporting children and youth during the COVID-19 pandemic and beyond: A rights-centred approach. Paediatrics & Child Health, 25(6), 333-336. https://doi.org/10.1093/pch/pxaa086
- Reference 134
-
Coughlin, C. G., Sandel, M., & Stewart, A. M. (2020). Homelessness, children, and COVID-19: A looming crisis. Pediatrics, 146(2). https://doi.org/10.1542/peds.2020-1408
- Reference 135
-
Aylsworth, L., Manca, T., Dubé, È., Labbé, F., Driedger, S. M., Benzies, K., Macdonald, N., Graham, J., & MacDonald, S. E. (2022). A qualitative investigation of the facilitators and barriers to accessing COVID-19 vaccines among Racialized and Indigenous Peoples in Canada. Human Vaccines & Immunotherapeutics, 18(6), 1585-1592. https://doi.org/10.1080/21645515.2022.2129827
- Reference 136
-
Garg, I., Hanif, H., Javed, N., Abbas, R., Mirza, S., Javaid, M. A., Pal, S., Shekhar, R., & Sheikh, A. B. (2021). COVID-19 vaccine hesitancy in the LGBTQ+ population: A systematic review. Infectious Disease Reports, 13(4),872-887. https://doi.org/10.3390/idr13040079
- Reference 137
-
Frohlich, K. L., Thomson, J. A., Fraser, S. L., Dupéré, V., & Beauregard, N. (2022). "It reflects the society in which we live, except now everything is accentuated": Youth, social inequities, and the COVID-19 pandemic. Canadian Journal of Public Health, 113(6), 795-805. https://doi.org/10.17269/s41997-022-00703-y