Antibiotic purchasing by Canadian hospitals: 2007–2011

 Download this article as a PDF (735 KB - 6 pages)
 Published by: The Public Health Agency of Canada
Issue: Volume 40 S-2: Antimicrobial resistance
Date published: November 7, 2014
ISSN: 1481-8531
Submit a manuscript
About CCDR
Browse
Volume 40 S-2, November 7, 2014: Antimicrobial resistance
Surveillance
Antibiotic purchasing by Canadian hospitals, 2007–2011
Finley R1*
Affiliation
1 Centre for Food-borne, Environmental and Zoonotic Infectious Diseases, Public Health Agency of Canada, Guelph, ON
Correspondence
DOI
https://doi.org/10.14745/ccdr.v40is2a04
Abstract
Objective: To describe patterns of antibiotic purchasing by Canadian hospitals from five regions in Canada between 2007 and 2011.
Methods: The Canadian Drugstore and Hospital Purchases Audit (CDH) dataset measures the dollar value and unit volume of pharmaceutical products from over 700 hospitals and is extrapolated to represent purchases by more than 800 hospitals in Canada. General population information was used for developing the rates of purchasing with a primary focus on unit volume.
Results: In 2011, there was a 7% increase in total antibiotics purchased by Canadian hospitals compared to 2010, with slight increases in the purchasing levels for oral (8% increase) and parenteral (3% increase) antibiotics. Antibiotics considered of very high importance to human medicine (Category I) continued to represent a high proportion of the total antibiotics used in hospitals in 2011. Overall, consumption of antibiotics was highest in Manitoba at 2.61 doses per 1,000 inhabitants per day (DID), while Ontario had the lowest levels of consumption (1.26 DID). New Brunswick had the highest proportion of Category I consumption (43%, 0.62/1.43 DID) for 2011, driven by higher levels of fluoroquinolones consumed in that province.
Conclusion: Canadian hospitals have purchased an increasing number of antibiotics and are consuming slightly more oral and parenteral antibiotics. Overall, consumption was highest in Manitoba and total cost was highest in British Columbia. Ontario had the lowest level of consumption of anitbiotics and the lowest overall cost.
Introduction
The Canadian Integrated Program for Antimicrobial Resistance Surveillance (CIPARS) monitors trends in antimicrobial use and antimicrobial resistance in selected bacterial organisms from human, animal, and food sources across Canada. The Program is based on several representative and methodologically unified surveillance components that can be linked to examine the relationship between antibiotics used in food animals and humans, and the associated health impacts. This information supports: (i) the creation of evidence-based policies to control antimicrobial use in hospital, community, and agricultural settings, and thus prolong the effectiveness of these drugs; and (ii) the identification of appropriate measures to contain the emergence and spread of resistant bacteria between animals, food, and people in Canada.
The human antimicrobial use surveillance reports are published on a regular basis to provide a national overview of current antibiotic use practices in Canada annually, to enable comparisons and to support formulary and stewardship development. The objective this paper is to describe patterns of antibiotic purchasing by Canadian hospitals from five regions in Canada between 2007 and 2011. This information is based on the most recent CIPARS Report which is available online Footnote 1.
Methods
The Canadian Drugstore and Hospital Purchases Audit (CDH) dataset is purchased by the Public Health Agency of Canada from IMS Health Canada Inc. This dataset measures the dollar value and unit volume of pharmaceutical products purchased by nearly all Canadian hospitals excluding those in the Yukon, Northwest Territories, and Nunavut. Information was collected from over 700 hospitals and extrapolated to represent purchases by more than 800 hospitals in Canada. The provinces of Prince Edward Island, and Newfoundland and Labrador were grouped due to the small volume of hospital purchases within each province. Hospital patient days and number of hospital beds were not available for this data; general population information was used for developing the rates of purchasing. In this paper, the term "consumption" is used to reflect hospital purchases.
Results
In 2011, there was a 27% increase in the total mass of antibiotics purchased compared to 2001 (34,958.30 kg purchased in 2001 versus 44,406.35 kg in 2011). However, the total number of defined daily doses per 1,000 inhabitant-days (DID) have remained fairly stable for both oral and parenteral antibiotics since 2001 (Table 1 and Table 2). Slight increases were observed among the oral (8%) and parenteral (3%) antibiotics in 2011 compared to 2010, driven by slight increases among the tetracyclines (25%), combinations of penicillins, including β-lactamase inhibitors (25%), and macrolides (8%) (Table 1).
| ATC Class Table 1 - Footnote 1 and antimicrobial | DDDs Table 1 - Footnote 2/1,000 inhabitant-days | |||||||||||
|---|---|---|---|---|---|---|---|---|---|---|---|---|
| 2001 | 2002 | 2003 | 2004 | 2005 | 2006 | 2007 | 2008 | 2009 | 2010 | 2011 | ||
| I Table 1 - Footnote 3 | Combinations of penicillins, including β-lactamase inhibitors (J01CR) | |||||||||||
| Amoxicillin and enzyme inhibitor | 0.02 | 0.02 | 0.03 | 0.03 | 0.04 | 0.04 | 0.03 | 0.03 | 0.04 | 0.04 | 0.05 | |
| Third-generation cephalosporins (J01DD) | ||||||||||||
| Cefixime | 0.01 | 0.01 | 0.01 | 0.01 | 0.01 | 0.01 | 0.01 | 0.01 | 0.01 | 0.01 | 0.01 | |
| Fluoroquinolones (J01MA) | ||||||||||||
| Ofloxacin, ciprofloxacin, norfloxacin, levofloxacin, moxifloxacin, gatifloxacin, gemifloxacin | 0.22 | 0.22 | 0.24 | 0.24 | 0.23 | 0.23 | 0.23 | 0.22 | 0.23 | 0.20 | 0.20 | |
| Imidazole (J01XD) | ||||||||||||
| Metronidazole | 0.04 | 0.03 | 0.04 | 0.04 | 0.04 | 0.04 | 0.04 | 0.04 | 0.03 | 0.03 | 0.03 | |
| II | Penicillins with extended spectrum (J01CA) | |||||||||||
| Ampicillin, amoxicillin, pivampicillin, bacampicillin, pivmecillinam | 0.11 | 0.11 | 0.10 | 0.09 | 0.10 | 0.09 | 0.08 | 0.08 | 0.08 | 0.09 | 0.09 | |
| β-lactamase sensitive penicillins (J01CE) | ||||||||||||
| Penicillin G, penicillin V | 0.02 | 0.03 | 0.03 | 0.02 | 0.02 | 0.02 | 0.01 | 0.01 | 0.01 | 0.01 | 0.02 | |
| β-lactamase resistant penicillins (J01CF) | ||||||||||||
| Cloxacillin | 0.03 | 0.02 | 0.02 | 0.02 | 0.02 | 0.02 | 0.01 | 0.01 | 0.01 | 0.01 | 0.01 | |
| First-generation cephalosporins (J01DB) | ||||||||||||
| Cephalexin, cefadroxil | 0.05 | 0.05 | 0.05 | 0.05 | 0.06 | 0.07 | 0.05 | 0.05 | 0.05 | 0.04 | 0.05 | |
| Second-generation cephalosporins (J01DC) | ||||||||||||
| Cefaclor, cefprozil, cefuroxime axetil | 0.07 | 0.05 | 0.05 | 0.05 | 0.04 | 0.04 | 0.04 | 0.04 | 0.04 | 0.03 | 0.04 | |
| Combinations of sulfonamides and trimethoprim, including derivatives (J01EE) | ||||||||||||
| Sulfamethoxazole and trimethoprim, sulfadiazine and trimethoprim | 0.09 | 0.07 | 0.08 | 0.07 | 0.07 | 0.07 | 0.07 | 0.06 | 0.06 | 0.06 | 0.06 | |
| Macrolides (J01FA) | ||||||||||||
| Azithromycin, clarithromycin, erythromycin, spiramycin, telithromycin | 0.13 | 0.13 | 0.14 | 0.12 | 0.13 | 0.12 | 0.13 | 0.13 | 0.14 | 0.12 | 0.13 | |
| Lincosamides (J01FF) | ||||||||||||
| Clindamycin | 0.01 | 0.01 | 0.01 | 0.01 | 0.01 | 0.01 | 0.02 | 0.02 | 0.02 | 0.01 | 0.01 | |
| III | Tetracyclines (J01AA) | |||||||||||
| Doxycycline, minocycline, tetracycline, demeclocycline | 0.06 | 0.05 | 0.05 | 0.06 | 0.05 | 0.06 | 0.08 | 0.12 | 0.08 | 0.08 | 0.10 | |
| Nitrofuran derivatives (J01XE) | ||||||||||||
| Nitrofurantoin | 0.02 | 0.03 | 0.03 | 0.03 | 0.03 | 0.03 | 0.03 | 0.03 | 0.03 | 0.03 | 0.03 | |
| Total (J01) | 0.88 | 0.84 | 0.87 | 0.86 | 0.86 | 0.86 | 0.83 | 0.85 | 0.84 | 0.78 | 0.84 | |
Antibiotics considered of very high importance to human medicine (Category I) represent 35% and 34% of the total DID of oral and parenteral antibiotics purchased by hospitals in 2011, respectively (Table 1 and Table 2). This is an increase since 2001, when these antibiotics among the oral form represented 33% and parenteral drugs represented 28% of purchases.
Similarly, increased consumption of parenteral drugs was mainly due to increases in combinations of penicillins, including β-lactamase inhibitors (20%) and third generation cephalosporins (14%) (Table 2).
| ATC Class Table 2 - Footnote 1 and antimicrobial | DDDs Table 2 - Footnote 2/1,000 inhabitant-days | |||||||||||
|---|---|---|---|---|---|---|---|---|---|---|---|---|
| 2001 | 2002 | 2003 | 2004 | 2005 | 2006 | 2007 | 2008 | 2009 | 2010 | 2011 | ||
| I Table 2 - Footnote 3 | Combinations of penicillins, including β-lactamase inhibitors (J01CR) | |||||||||||
| Piperacillin and enzyme inhibitor, ticarcillin and enzyme inhibitor | 0.02 | 0.02 | 0.03 | 0.02 | 0.03 | 0.03 | 0.04 | 0.04 | 0.05 | 0.05 | 0.06 | |
| Third-generation cephalosporins (J01DD) | ||||||||||||
| Cefotaxime, ceftazidime, ceftizoxime, ceftriaxone | 0.03 | 0.05 | 0.06 | 0.06 | 0.07 | 0.07 | 0.06 | 0.07 | 0.08 | 0.07 | 0.08 | |
| Fourth-generation cephalosporins (J01DE) | ||||||||||||
| Cefepime, ceftobiprole | < 0.01 | < 0.01 | 0.01 | 0.03 | 0.02 | 0.01 | 0.01 | < 0.01 | < 0.01 | < 0.01 | < 0.01 | |
| Carbapenems (J01DH) | ||||||||||||
| Doripenem, ertapenem, imipenem, meropenem | 0.01 | 0.03 | 0.03 | 0.02 | 0.02 | 0.02 | 0.03 | 0.03 | 0.03 | 0.03 | 0.04 | |
| Fluoroquinolones (J01MA) | ||||||||||||
| Ofloxacin, ciprofloxacin, norfloxacin, levofloxacin, moxifloxacin | 0.05 | 0.06 | 0.06 | 0.07 | 0.07 | 0.08 | 0.06 | 0.06 | 0.06 | 0.05 | 0.05 | |
| Glycopeptides (J01XA) | ||||||||||||
| Vancomycin | 0.04 | 0.04 | 0.02 | 0.02 | 0.02 | 0.01 | 0.01 | 0.01 | 0.01 | 0.02 | 0.02 | |
| Imidazole (J01XD) | ||||||||||||
| Metronidazole | 0.06 | 0.02 | 0.01 | 0.01 | 0.01 | 0.01 | 0.01 | 0.01 | 0.01 | 0.01 | 0.01 | |
| II | Penicillins with extended spectrum (J01CA) | |||||||||||
| Ampicillin, pivampicillin | 0.07 | 0.06 | 0.05 | 0.05 | 0.05 | 0.05 | 0.05 | 0.05 | 0.04 | 0.04 | 0.04 | |
| β-lactamase sensitive penicillins (J01CE) | ||||||||||||
| Penicillin G | 0.21 | 0.19 | 0.22 | 0.27 | 0.28 | 0.28 | 0.26 | 0.27 | 0.26 | 0.25 | 0.25 | |
| β-lactamase resistant penicillins (J01CF) | ||||||||||||
| Cloxacillin | 0.05 | 0.04 | 0.05 | 0.04 | 0.04 | 0.04 | 0.04 | 0.04 | 0.05 | 0.04 | 0.04 | |
| First-generation cephalosporins (J01DB) | ||||||||||||
| Cefazolin, cephalothin | 0.12 | 0.12 | 0.12 | 0.12 | 0.12 | 0.11 | 0.12 | 0.12 | 0.13 | 0.12 | 0.12 | |
| Second-generation cephalosporins (J01DC) | ||||||||||||
| Cefotetan, cefoxitin, cefuroxime | 0.04 | 0.04 | 0.03 | 0.02 | 0.01 | 0.01 | 0.01 | 0.01 | 0.01 | < 0.01 | < 0.01 | |
| Macrolides (J01FA) | ||||||||||||
| Azithromycin, erythromycin | 0.01 | 0.01 | 0.01 | 0.01 | 0.01 | 0.01 | 0.01 | 0.01 | 0.01 | 0.01 | 0.01 | |
| Lincosamides (J01FF) | ||||||||||||
| Clindamycin | 0.02 | 0.02 | 0.02 | 0.02 | 0.02 | 0.03 | 0.03 | 0.03 | 0.03 | 0.03 | 0.03 | |
| Aminoglycosides (J01GB) | ||||||||||||
| Amikacin, gentamicin, netilmicin, tobramycin | 0.06 | 0.05 | 0.03 | 0.02 | 0.03 | 0.05 | 0.05 | 0.04 | 0.04 | 0.04 | 0.03 | |
| Total (J01) | 0.78 | 0.76 | 0.76 | 0.77 | 0.79 | 0.83 | 0.80 | 0.79 | 0.82 | 0.77 | 0.79 | |
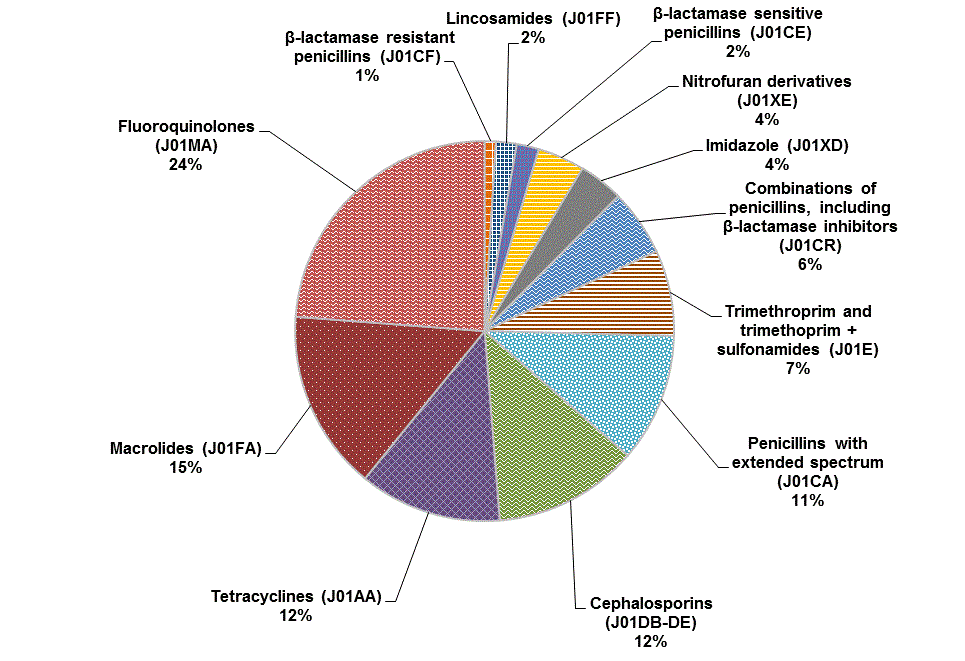
Fluoroquinolones represent the largest group of oral antibiotic agents consumed (24%), followed by macrolides (15%), tetracyclines (12%), cephalosporins (12%), and penicillins with extended spectrum (11%) (Figure 1).
Figure 1. Percentages of total number of defined daily doses per 1,000 inhabitant-days for oral antibiotics purchased by hospitals in Canada, 2011

Text equivalent - Figure 1
This figure is a pie chart showing the percentages of total number of defined daily doses per 1,000 inhabitant-days for oral antibiotics purchased by hospitals in Canada, 2011. The largest percentage was Fluoroquinolones at 24%, followed by Macrolides at 15%, Tetracyclines and Cephalosporins at 12% each, Penicillins with extended spectrum at 11%, Trimethoprim with or without sulfonamides at 7%, a combination of penicillins including Beta-lactamase inhibitors at 6%, Imidazole and Nitrofuran derivatives at 4% each, Beta-lactamase sensitive penicillins at 2%, Lincosamides at 2%, and Beta-lactamase resistant penicillins at 1%.
Note: Alphanumeric codes in parentheses represent Anatomical Therapeutic Chemical classes of antibiotics.
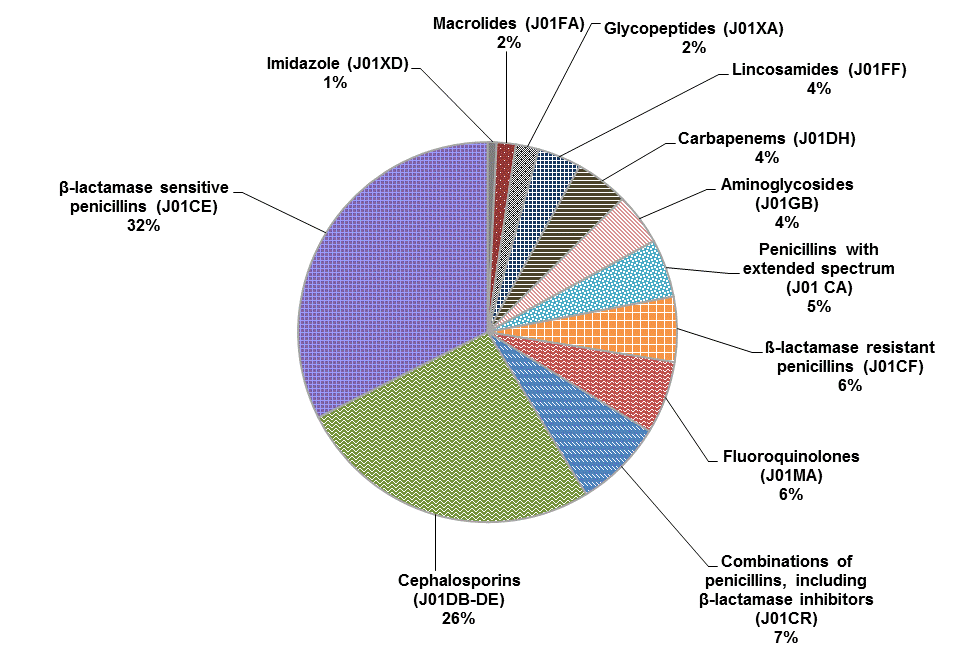
β-lactamase sensitive penicillins (penicillin G and penicillin V) (32%) and cephalosporins (26%) are the largest groups of parenteral antibiotics purchased by Canadian hospitals (Figure 2).
Figure 2. Percentages of total number of defined daily doses per 1,000 inhabitant-days for parenteral antibiotics purchased by hospitals in Canada, 2011

Text equivalent - Figure 2
This figure is a pie chart showing the percentages of total number of defined daily doses per 1,000 inhabitant-days for parenteral antibiotics purchased by hospitals in Canada, 2011. The largest percentage was Beta-lactamase sensitive penicillins at 32%, followed by Cephalosporins at 26%, combinations of penicillins including Beta-lactamase inhibitors at 7%, Fluoroquinolones at 6%, Beta-lactamase resistant penicillins at 6%, Penicillins with extended spectrum at 5%, Aminoglycosides, Carbapenams and Lincosamides at 4% each, Gylcopeptides and Macrolides at 2% each, and Imidazole at 1%.
Note: Alphanumeric codes in parentheses represent Anatomical Therapeutic Chemical classes of antibiotics.
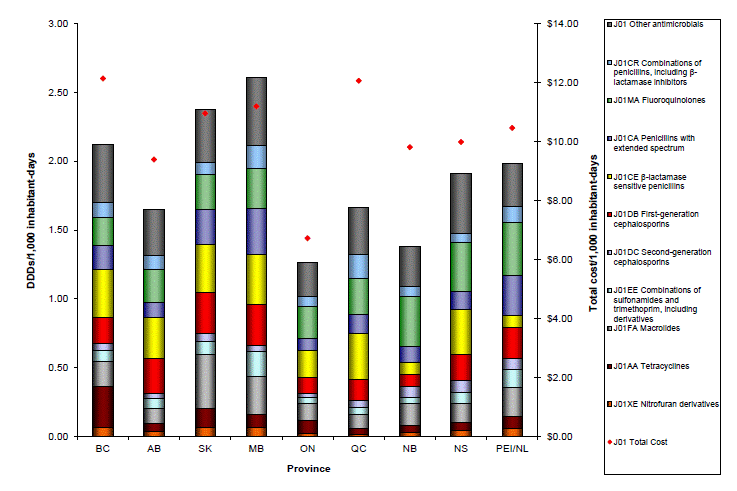
In 2011, differences in total consumption and total cost in dollars (per 1,000 inhabitant-days) for antibiotic purchases by Canadian hospitals were observed across Canada. Overall, consumption of antibiotics was highest in Manitoba (2.61 DID), whereas Ontario had the lowest levels reported (1.26 DID) (Figure 3). Total cost associated with antimicrobial purchases for hospital use was highest in British Columbia ($12.13 per 1,000 inhabitant-days), while the lowest levels were observed in Ontario ($6.72 per 1,000 inhabitant-days) (Figure 3).
Figure 3. Total consumption (DDDs/1,000 inhabitant-days) and total cost of oral and parenteral antibiotics purchased by hospitals in Canadian provinces, 2011

Text equivalent - Figure 3
This figure is a histogram showing total consumption of defined daily doses per 1,000 inhabitant-days and total cost of oral and parenteral antibiotics purchased by hospitals in Canadian provinces, 2011. There are two y axis. The y axis on the left is defined daily doses per 1,000 inhabitants and ranges from zero at unity to 3.0 at the top. The y axis on the left is defined as total cost per 1,000 inhabitant days and ranges from 0 at the x axis to $14 at the top. The x axis shows data from 8 provinces separately plus Prince Edward Island and Newfoundland combined. The number of defined daily doses varied from a low of less than 1.5 in Ontario to a high of over 2.50 in Manitoba. Cost varied from less than $7.00 in Ontario to over $12.00 in Quebec. The bars were color coded according to antibiotic class and proportionately showed variations from province to province.
Note: Alphanumeric codes in parentheses represent Anatomical Therapeutic Chemical classes of antibiotics.
DDDs = defined daily doses
Discussion
In 2011, there was a 27% (9,448.05 kg) increase in total antibiotics purchased by Canadian hospitals compared to 2001, with slight increases in the levels of consumption for oral (8% increase) and parenteral (3% increase) antibiotics. Antibiotics considered of very high importance to human medicine (Category I) continued to represent a high proportion (0.56/1.62 DID) of the total antibiotics used in hospitals in 2011.
Overall, consumption (DID) of antibiotics was highest in Manitoba (2.61 DID), while total cost in dollars (per 1,000 inhabitant-days) was highest in British Columbia ($12.13 per 1,000 inhabitant-days). Ontario on the other hand had the lowest levels of consumption (1.26 DID) and the lowest overall cost ($6.72 per 1,000 inhabitant-days). New Brunswick had the highest proportion of Category I consumption (43%, 0.62/1.43 DID) for 2011, driven by higher levels of fluoroquinolones consumed in that province.
There are several limitations and caveats within the CDH dataset. The data are estimated and are not census data; also, there is limited tracking of specific niche markets (due to low volume and/or unique distribution). In addition, a small number of products may be excluded due to confidentiality (e.g., if they are sold only in one outlet). Some data may be excluded to reflect true market trends (i.e., large stockpiling transactions that occur prior to a potential epidemic) and direct sales for a specific manufacturer may not be available leading to underestimation of a product (higher incidence in hospital than in drug store purchases).
The provinces of Prince Edward Island, and Newfoundland and Labrador were grouped due to the small volume of purchases within each province. Changes made to the databases are made to the last 72 months only; outside the six-year period it is considered a closed dataset as updates cannot be made. Hospital patient days and number of hospital beds were not available for this data; general population information was used for developing rates of purchasing.
Antimicrobial resistance will continue to challenge the health of Canadians and of people around the world for some time to come. Surveillance of antibiotic use will help document the progress we continue to make in curbing it.
Acknowledgements
The author would like to acknowledge the external reviewers of the Human Antimicrobial Use Report: Dr. John Conly, Dr. Jim Hutchinson, Dr. Warren McIsaac, Dr. David Patrick, Dr. Lynora Saxinger, Dr. Daniel Thirion, and Dr. Karl Weiss. Without their close collaboration and participation, the analysis and reporting of this data would not have been possible.
Conflict of interest
None.
Funding
This work was supported by the Public Health Agency of Canada.
Disclaimer
This article was prepared using data from IMS Health Canada Inc. The analyses, conclusions, opinions, and statements expressed are those of the author and not those of IMS Health Canada Inc.
Page details
- Date modified: