
Archived - AMU and AMR in Canada: 2014

 Download this article as a PDF (509 KB - 5 pages)
Published by: The Public Health Agency of Canada
Issue: Volume 42-11: Antimicrobial Resistance (AMR)
Date published: November 3, 2016
ISSN: 1481-8531
Submit a manuscript
About CCDR
Browse
Volume 42-11, November 3, 2016: Antimicrobial Resistance (AMR)
Surveillance
Antimicrobial use and antimicrobial resistance trends in Canada: 2014
Ebrahim M1, Gravel D1*, Thabet C1, Abdesselam K1, Paramalingam S1, Hyson C1
Affiliation
1 Centre for Communicable Diseases and Infection Control, Public Health Agency of Canada, Ottawa, ON
Correspondence
Suggested citation
Ebrahim M, Gravel D, Thabet C, Abdesselam K, Paramalingam S, Hyson C. Antimicrobial use and antimicrobial resistance trends in Canada: 2014. Can Comm Dis Rep 2016;42(11):227-31. https://doi.org/10.14745/ccdr.v42i11a02
Abstract
Background: There is a global concern that the emergence of antimicrobial resistance (AMR) threatens our ability to treat infectious diseases. The Canadian Antimicrobial Resistance Surveillance System (CARSS) was created in response to the Government of Canada’s commitment to addressing AMR. CARSS integrates information from nine different national surveillance systems for tracking antimicrobial use (AMU) and AMR in both humans and animals to inform AMU/AMR research and policy.
Objective: To provide highlights of CARSS data on antimicrobial use in humans and animals, AMR trends in human infections in both hospital and community settings and AMR bacteria found in food production animals.
Methods: Information on AMU in animals and humans is purchased and additional information on AMU in animals is collected through the Canadian Integrated Program for Antimicrobial Resistance Surveillance (CIPARS). AMR data in humans focuses on first priority organisms. Data on priority organisms for hospital-based AMR is collected through Canadian Nosocomial Infection Surveillance Program (CNISP), Canadian Tuberculosis Laboratory Surveillance System (CTBLSS), Canadian Tuberculosis Laboratory Surveillance System (CTBRS), Canadian Tuberculosis Reporting System (CTBRS) and CIPARS. Data on community‑based AMR is collected through CTBLSS, CTBRS, CIPARS, the Antimicrobial‑resistant Neisseria gonorrhoeae Surveillance System (ARNGSS) and the National Surveillance of Invasive Streptococcal Disease (NSISD). AMR data on animals is collected through CIPARS.
Results: In terms of antibiotic usage in 2014, approximately 82% of antimicrobials were directed to food production animals, 18% to humans and less than one percent each to companion animals (e.g., pets) and crops. Over the past five years, 73% of antimicrobials distributed to food production animals belonged to the same classes as those used in human medicine. Antibiotic usage in humans has remained relatively stable. Trends in 2014 for AMR in hospitals include declining rates of hospital‑acquired Clostridium difficile to 3.4 cases per 1,000 patient admissions, methicillin‑resistant Staphylococcus aureus (MRSA) infections to 2.89 cases per 10,000 patient days and vancomycin‑resistant Enterococci (VRE) to 0.45 cases per 10,000 patient days. Resistance to a number of antimicrobials used to treat Streptococcus pneumoniae has decreased since the introduction of pneumococcal vaccine in 2010. In contrast, trends in 2014 for AMR in the community included increasing rates of community‑acquired N. gonorrhoeae ‑ 52.4% of isolates were resistant to at least one antibiotic. Trends for carbapenem‑resistant Enterobacteriaceae (CRE) were stable at 0.22 cases per 10,000 patient days. Also, between 2004 and 2014, nine percent of tuberculosis (TB) culture positive cases were resistant to at least one first line anti‑tuberculosis drug and this has remained relatively stable over that time. Trends in 2014 for AMR in food production animals showed decreasing resistance of Escherichia coli and Salmonella species to third‑generation cephalosporins (ceftriaxone) in poultry associated with a decrease in cephalosporin use on chicken farms, but resistance to ciprofloxacin in Campylobacter species in chicken and cattle has been increasing.
Conclusion: Overall, antibiotic use in humans has not declined despite concerns about overuse. Although resistance rates of C. difficile, VRE, MRSA and AMR S. pneumoniae have been gradually decreasing and drug‑resistant tuberculosis and CRE have remained stable, community‑associated drug‑resistant N. gonorrhoeae has been increasing. Although efforts to decrease antibiotic use in animals have been met with some success, AMR continues to occur in fairly high levels in food production animals.
Introduction
The extent of antimicrobial use (AMU) and antimicrobial resistance (AMR) are global concerns due to increased resistance levels detected in some pathogenic microbes and the selective pressure resulting from antimicrobial use in both animals and humansFootnote 1. The damaging effects of AMR are already manifesting themselves across the world with antimicrobial resistant infections currently claiming at least 50,000 lives each year across Europe and the US alone, with many hundreds of thousands more dying in other areas of the worldFootnote 2. In order to monitor AMU/AMR in Canada, the Canadian Antimicrobial Resistance Surveillance System (CARSS) was created. Through collaboration with internal and external stakeholders, CARSS integrates several sources of AMU/AMR surveillance information to provide a unified national picture of AMU and AMR in humans and animals in Canada. Data on both humans and animals is included because inappropriate antimicrobial use in food production animals is a public health concern as it contributes to the emergence of resistant bacteria in animals that can be transmitted to humans through the food supplyFootnote 3. The first CARSS Report, issued in March 2015, provided information on AMU/AMR in Canada until 2013Footnote 4.
The objective of this summary is to highlight the key findings of the CARSS second report summarizing surveillance data up to 2014. The full Report is available onlineFootnote 5.
Methods
Information is collected in four key areas: AMU in humans, AMU in animals, AMR in humans in health care and community settings and AMR in food production animals.
Antimicrobial usage in humans and animals
CARSS purchases human AMU data from IMS Health Canada Inc., a global company that collects information on hospital antibiotic purchases and prescriptions dispensed by retail pharmacies in the community as well as antimicrobials prescribed by physicians. CARSS obtains animal AMU data from the Canadian Animal Health Institute (CAHI) which collects data on over 90% of all sales of licensed animal pharmaceutical products in Canada. The Public Health Agency of Canada (PHAC) collects additional AMU information from sentinel farms through the Canadian Integrated Program for Antimicrobial Resistance Surveillance (CIPARS). CIPARS monitors trends in AMU and AMR in selected bacterial organisms from human, animal and food sources across CanadaFootnote 6.
AMR in humans
Health care settings
CARRS collects data concerning AMR in priority organisms transmitted in health care settings through a number of different surveillance systems. The Canadian Nosocomial Infection Surveillance Program (CNISP) tracks C. difficile, carbapenemase producing organisms (CPO) and carbapenem-resistant Enterobacteriaceae (CRE), methicillin-resistant S. aureus (MRSA) and vancomycin-resistant Enterococci (VRE)Footnote 7. Human Salmonella isolates in hospitals are captured through CIPARSFootnote 8.Data on hospital tuberculosis (TB) cases are provided through the Canadian Tuberculosis Laboratory Surveillance System (CTBLSS) and the Canadian Tuberculosis Reporting System (CTBRS)Footnote 9.
Community settings
AMR is monitored for the following priority organisms primarily transmitted in community settings: Streptococcus pneumoniae, Group A Streptococcus, Neisseria gonorrhoeae and Mycobacterium tuberculosis. Provincial public health laboratories submit isolates to the National Microbiology Laboratory (NML) for serotyping for Streptococcus and Neisseria gonorrhoeae. AMR data concerning Mycobacterium tuberculosis is forwarded to PHAC through the CTBLSS and CTBRSFootnote 9.
AMR in food production animals
CIPARS includes susceptibility testing for the following priority bacteria transmitted to humans through food production animals: generic Escherichia coli, Campylobacter and Salmonella speciesFootnote 8. E. coli samples are collected at three different spots along the food chain (farms, slaughter houses and retail stores) for chicken and swine and from slaughter houses or retail stores for cattle. Campylobacter samples are collected across the food chain for chicken and are collected only from slaughter houses for swine and cattle; Salmonella species samples are collected along at farms and slaughter houses for chickensFootnote 5.
A summary of all the data collected by CARSS on AMR on priority organisms for both humans and animals is summarized in Table 1.
Analysis
Due to the nature of the method used to collect the data from the established surveillance systems, statistical analysis is descriptive. Numerous years of data facilitated the establishment of benchmarks and the analysis of trends over time.
Results
Antimicrobial use
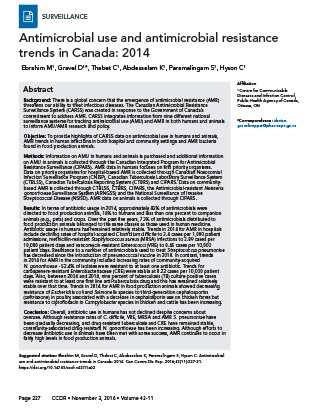
Approximately 1.4 million kilograms (kg) of medically important antimicrobials were distributed and/or sold in 2014. Approximately 82% were used in food production animals, 18% for humans and less than one percent for both companion animals and crops. In humans, the predominant classes of antimicrobials sold were ß-lactams, cephalosporins and fluoroquinolones. In animals, the predominant classes were tetracyclines, ß-lactams and "other" antimicrobials (Figure 1).
Figure 1: Kilograms of antimicrobials distributed and/or sold for use in animals and humans by antimicrobial class, 2014
Text description: Figure 1
Figure 1: Kilograms of antimicrobials distributed and/or sold for use in animals and humans by antimicrobial class, 2014
Stacked column graph showing the total kilograms of active ingredient of antimicrobials sold or distributed for use in humans or animals by antimicrobial class in Canada for 2014. The horizontal axis represents the kilogram of active ingredient distributed or purchased for use and the vertical axis represents the antimicrobial class.
| Antimicrobial class | Kilogram active ingredient distributed or purchased for use | |
|---|---|---|
| Total Human data | Animal Distribution Data | |
| Fluoroquinolones and quinolones | 19,895 | 533 |
| Cephalosporins (1st generation, 2nd generation, others) | 48,427 | 2,714 |
| Aminoglycosides | 128 | 13,276 |
| Lincosamides | 7,056 | 60,006 |
| Trimethoprim and sulfas (including all sulfas) | 18,362 | 68,762 |
| Macrolides | 18,447 | 112,340 |
| Others | 24,446 | 125,230 |
| Beta-lactams/penicillins | 96,479 | 148,187 |
| Tetracyclines | 7,698 | 599,540 |
Over the past five years (2010 to 2014) 73% of antimicrobials distributed to food production animals belonged to the same classes as those used in human medicine, with 1.5 million kg of antimicrobial active ingredients distributed for use in animals in 2014. This is a 5.0% increase from 2013.
Usage in humans
AMU in humans has remained relatively stable in Canada over the last 13 years. In 2014, compared to 2013, there was little change in the total number of antimicrobials dispensed by community pharmacies whereas hospital purchases decreased by 4.0%. Antimicrobials dispensed by community pharmacies accounted for 93% of all antimicrobial use. Between 2010 and 2014, prescribing rates for antimicrobials declined among children (0-14 years) by 8.0%, and among adults (15-59 years) by 3.0%, but decreases were not observed among seniors (60+ years).
In 2014, 38,340 kg of antimicrobials were purchased by hospitals across Canada at a cost of $104 million. Ciprofloxacin was the antimicrobial most commonly purchased in 2014, followed by amoxicillin, azithromycin, ceftriaxone and doxycycline. Purchases of ceftriaxone and doxycycline have had the highest increase from 2002 to 2014.
The majority of antimicrobials used in the Canadian outpatient population in 2014 were drugs for oral administration. Compared to 2013, parenteral (intravenous) antimicrobials dispensed at higher levels in 2014 included daptomycin, ticarcillin and clavulanic acid, fosfomycin, imipenem and cilastatin, ceftazidime, ceftriaxone and colistin. A steady increase has been noted over the last five years in dispensing of parenteral antimicrobials.
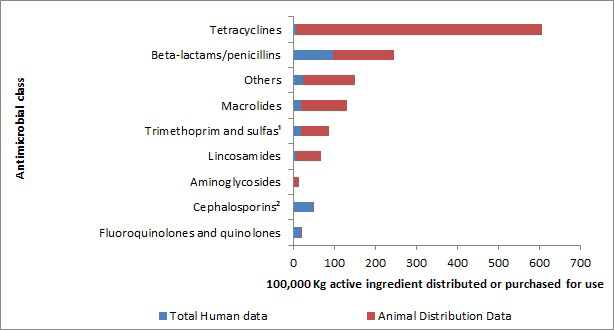
In 2014, antimicrobials were the recommended treatment in eight percent of all diagnoses. The majority of recommendations were for the treatment of respiratory infections including upper respiratory tract infections, bronchitis and acute sinusitis (Figure 2). This a concerning trend because antibiotics are not recommended as a first line of treatment in acute bronchitis or acute sinusitisFootnote 10Footnote 11. Generally, the percentage of diagnoses for which an antimicrobial was recommended remained stable.
Figure 2: Number of specific diagnoses per person and the percentage of those diagnoses with recommendations for an antimicrobial in Canada, 2014
Text description: Figure 2
Figure 2: Number of specific diagnoses per person and the percentage of those diagnoses with recommendations for an antimicrobial in Canada, 2014
A bar graph showing the total number of diagnoses for each diagnostic class per person and boxes showing the percentage of each diagnosis that resulted with an antimicrobial recommendation in Canada during 2014. The horizontal axis represents the diagnostic class. The left vertical axis represents the number of diagnoses per person while the right vertical axis represents the percentage of diagnoses with an antimicrobial recommendation.
| Diagnostic class | Number of diagnoses per person | % diagnoses with antimicrobial recommendation |
|---|---|---|
| Acute bronchitis | 0.07 | 76.79 |
| Acute sinusitis | 0.05 | 82.35 |
| Disease of the ear | 0.25 | 25.12 |
| Lower urinary tract infection or cystitis | 0.14 | 67.65 |
| Pneumonia | 0.03 | 73.62 |
| Soft skin and tissue infections | 0.08 | 63.32 |
| Upper respiratory tract infection | 0.30 | 33.19 |
Usage in food production in animals
Fluoroquinolones are classified as of "very high importance to human medicine" by Health Canada's Veterinary Drugs Directorate. Since 2010 there has been a 40% increase in the quantity of fluoroquinolones distributed for use in animals, likely due in part to the approval of a new indication for fluoroquinolone use. Between 2013 and 2014, the quantity increased by 14%. Third-generation cephalosporins are also highly important to human medicine because they are a last line of defence. CAHI data show a 60% decline in the quantity of cephalosporins distributed for use in animals from 2011 to 2014.
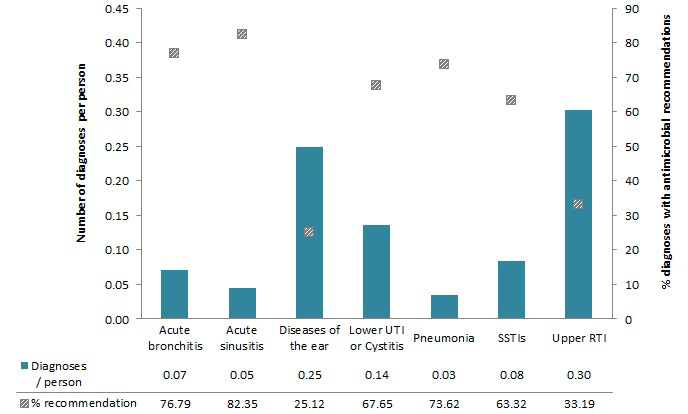
As shown in Figure 3, after adjusting for animal population numbers and weight (green line), the overall quantity of antimicrobials distributed has remained relatively stable over time with a 3.0% increase since 2006 and a 1.0% increase since 2013. Over the past five years (2010-2014), this amount has increased by 16%.
Figure 3: Medically-important antimicrobials distributed for use in animals over time; measured as kilograms active ingredient and milligrams active ingredient, adjusted for populations and weights, 2006 to 2014
Text description: Figure 3
Figure 3: Medically-important antimicrobials distributed for use in animals over time; measured as kilograms active ingredient and milligrams active ingredient, adjusted for populations and weights, 2006 to 2014
Line graph showing two lines with one representing the total milligrams of antimicrobials distributed for use in animals adjusted for population and weights and a second line representing total kilograms of antimicrobials distributed for use in animals in Canada from 2006 to 2014. The horizontal axis represents the year. The left vertical axis represents the total kilograms of active ingredient while the right vertical axis represents the milligrams of active ingredient adjusted for population and weights.
| Year | Total (kg) | Total (mg/Population corrected unit - European weights) |
|---|---|---|
| 2006 | 1,310,373 | 159 |
| 2007 | 1,171,796 | 143 |
| 2008 | 1,143,187 | 140 |
| 2009 | 1,141,213 | 151 |
| 2010 | 1,037,313 | 141 |
| 2011 | 1,121,831 | 160 |
| 2012* | 1,117,457 | 161 |
| 2013* | 1,112,738 | 162 |
| 2014* | 1,121,297 | 162 |
AMR in Humans
Health care settings
In health care settings AMR trends are tracked for first priority organisms (those identified as of highest concern) (Table 2).
| Priority organismTable 2 footnote 1 | Antimicrobial resistance trends |
|---|---|
| Healthcare acquired Clostridium difficile (HA-CDI) | The overall HA-CDI infection rates peaked in 2008 at 5.8 HA-CDI infections per 1,000 patient admissions then declined slowly to approximately 3.4 HA-CDI infections per 1,000 admissions in 2014. |
| Carbapenem-resistant Enterobacteriaceae (CRE) | CRE rates remained relatively stable from 2010 to 2014. In 2014, rates were of 0.22 per 10,000 patient days compared to 0.19 per 10,000 patient days in 2010. |
| Enterococcus species | VRE infection rates increased sharply from 0.1 cases per 10,000 patient days in 2007 to 0.61 cases per 10,000 patient days in 2012 before decreasing to 0.45 cases per 10,000 patient days in 2014. |
| Methicillin-resistant Staphylococcus aureus (MRSA) | MRSA infections have decreased approximately 25% since 2008 with infection rates decreasing from 2.92 per 1,000 patient admissions in 2008 to 2.12 per 1,000 patient admissions in 2016. |
Community settings
Trends in AMR for first priority organisms in community settings are outlined in the 2016 CARSS Report (Table 3).
| Priority organismTable 3 footnote 1 | Antimicrobial resistance trends |
|---|---|
| Neisseria gonorrhoeae | In 2014, a total of 1,995 N. gonorrhoeae samples (52.4%) were found to be resistant to one or more antibiotic, representing an increase in AMR since 2009, especially to azithromycin, ciprofloxacin, erythromycin, penicillin and tetracycline. |
| Streptococcus pyogenes & S. pneumoniae | Resistance to a number of antimicrobials used to treat S. pneumoniae has decreased since 2010 following the introduction of a pneumococcal vaccine. For example, resistance to penicillin declined from 12% in 2011 to 9% in 2014. In 2014, all samples of Streptococcus pyogenes were sensitive to first line antimicrobials while resistance to second line drugs were unchanged or declined since 2010. |
| Mycobacterium tuberculosis | Between 2004 and 2014, 9% of culture positive cases were found to be resistant to at least one first line anti-tuberculosis drugs. Isoniazid resistance was the most common pattern of resistance reported. Also, for the same time period, 8% of the culture positive cases were monoresistant, 0.5% were polyresistant and 1% were multiresistant tuberculosis (MDR-TB). Also, the proportion of cases with MDR-TB remained relatively stable ranging between 1% and 2%. |
| Salmonella species | 82% of typhoidal isolates were resistant to nalidixic acid. Ciprofloxacin resistance increased from 2003 to 2014 from 0% to 14%. Over time, resistance in non-typhoidal isolates has decreased since 2004 with the exception of nalidixic acid which has almost doubled between 2013 (5%) and 2014 (9%). |
AMR in food production animals
PHAC monitors AMR in select bacterial organisms in a number of food production animals across Canada. The 2014 data regarding AMR in food production animals is presented in Table 4.
| Priority organismTable 4 footnote 1 | Antimicrobial resistance trends |
|---|---|
| Escherichia coli | In 2014, 96% of chicken, 55% of swine and 56% of cattle samples were positive for generic E. coli. Following a ban of preventive use of antimicrobials in 2014, resistance to third-generation cephalosporins in E. coli from chicken samples across the food chain decreased. In 2014 only 21% of isolates were resistant to third-generation cephalosporins compared to 28% in 2013. |
| Campylobacter species | Chicken:44% of isolates were resistant to tetracycline. Resistance to ciprofloxacin increased from 4% to 11% between 2004 and 2014. Swine: High resistance rates to tetracycline (78%), azithromycin (53%), telithromycin (43%) were noted in 2014; resistance rates to ciprofloxacin were stable at 11%. Cattle:Resistance is mainly to tetracycline, with 54% of isolates resistant in 2014. Resistance to ciprofloxacin has increased between 2008 and 2014 from 2% to 7%. |
| Salmonella species | In chicken, resistance to Salmonella spp. for ceftriaxone decreased from 24% in 2013 to 17% in 2014 and no resistance was found to ciprofloxacin. In swine, resistance to Salmonella spp. for ceftriaxone has remained stable and low at 4%. |
Discussion
The CARSS 2016 Report identified that in 2014, more than 80% of antimicrobials distributed in Canada were directed to food production animals. Antimicrobial use in humans and animals has remained relatively stable over the past few years. Healthcare-associated C. difficile infection, VRE and MRSA, have decreased, whereas, CRE remained relatively stable. In the community, resistant S. pneumoniae has gradually decreased; drug‑resistant N. gonorrhoea has increased, while drug-resistant TB has remained stable. In food production animals, resistance to third‑generation cephalosporins in generic E. col and Salmonella species has decreased in chicken while resistance to ciprofloxacin in Campylobacter species has increased in chicken and cattle.
With the implementation of CARSS, PHAC has improved the coordination of surveillance for AMU/AMR to assist stakeholders with the integrated data they need to inform further progress in reducing the threat of AMR and preserving the efficacy of today's antimicrobials.
Despite these advances in our surveillance capacity, gaps still exist. There is a need for more data on a number of priority pathogens (e.g., E. coli, Neisseria gonorrhoea and Shigella) and there is limited data on AMR in smaller, non‑academic hospitals, including those in rural and northern health care settings and First Nations communities. Overall, there is limited data on AMR in the community, outpatient clinics, long-term care facilities and physicians' and dentists' offices. Data on AMU in animals is also limited. For example, data concerning the amounts of over‑the‑counter antimicrobials sold without veterinary prescription or the amounts imported as active pharmaceutical ingredients for compounding by veterinarians and/or used in food production animals is limited. Even with all the data we do have, we still do not completely understand the link between AMU and the emerging patterns of AMR in Canada.
PHAC is committed to addressing these surveillance gaps by working with provincial and territorial partners and other stakeholders to expand surveillance activities to collect quality data regarding health professional prescribing practices, infection rates and resistance patterns for key priority organisms, particularly in community settings. PHAC is also working with the World Health Organization to develop common indicators for AMR resistant pathogens.
Acknowledgements
The authors thank all members of The Canadian Nosocomial Infection Surveillance Program, The Canadian Integrated Program for Antimicrobial Resistance Surveillance, The Canadian Tuberculosis Laboratory Surveillance System, The Canadian Tuberculosis Reporting System, The Antimicrobial resistant Neisseria gonorrhoeae Surveillance System, The National Surveillance of Invasive Streptococcal Disease, The Canadian HIV Strain and Drug Resistance Surveillance System and The National Microbiology Laboratory. The authors would also like to acknowledge with thanks the Canadian Antimicrobial Resistance Surveillance System (CARSS) team for the creation of materials and Figures used in this summary.
Conflict of interest
None.
Funding
This work was supported by the Public Health Agency of Canada.