
Archived - AIDS in Canada: 2016

 Download this article as a PDF (516 KB - 5 pages)
 Published by: The Public Health Agency of Canada
Issue: Volume 43-12: Can we eliminate HIV?
Date published: December 7, 2017
ISSN: 1481-8531
Submit a manuscript
About CCDR
Browse
Volume 43-12, December 7, 2017: Can we eliminate HIV?
Surveillance
AIDS in Canada—Surveillance Report, 2016
L Jonah1, AC Bourgeois1, M Edmunds1, A Awan1, O Varsaneux1, W Siu1
Affiliation
1 Centre for Communicable Diseases and Infection Control, Public Health Agency of Canada, Ottawa, ON
Correspondence
Suggested citation
Jonah L, Bourgeois AC, Edmunds M, Awan A, Varsaneux O, Siu W. AIDS in Canada—Surveillance Report, 2016. Can Commun Dis Rep. 2017;43(12):257-61. https://doi.org/10.14745/ccdr.v43i12a02
Abstract
Background: Although there continues to be a global epidemic of people living with human immunodeficiency virus (HIV) there has been a decrease in the number of people dying of acquired immunodeficiency syndrome (AIDS), largely due to successful treatment with antiretroviral therapy.
Objective: To provide a descriptive overview of the reported cases of AIDS in Canada by identifying trends by geographic location, sex, age group and mortality. While the descriptive analysis focuses on the year 2016, results are presented for reported cases from the beginning of national AIDS surveillance in 1979.
Methods: The Public Health Agency of Canada (PHAC) monitors AIDS in Canada through the national HIV/AIDS Surveillance System (HASS) and Statistics Canada. HASS is a passive, case-based surveillance system that maintains non-nominal data on cases of HIV and AIDS provided voluntarily by the Canadian provinces and territories. Of note, AIDS is no longer a reportable disease in Newfoundland and Labrador (as of 2009) and in Prince Edward Island (as of 2012). Data were also retrieved on annual deaths attributed to HIV/AIDS from Statistics Canada. Data were collated, tables and figures were prepared, then descriptive statistics were applied by PHAC and validated by each province and territory.
Results: A total of 114 AIDS cases were reported in 2016, with a cumulative total of 24,179 since 1979. These numbers represent a steady decline in the number of reported AIDS cases per year of diagnosis in Canada since 1993. Of reporting provinces, the greatest numbers of cases in 2016 were reported by Ontario, Saskatchewan and Alberta. Males accounted for 72.8% of reported AIDS cases and adults aged 50 years and older accounted for the greatest proportion by age group (36.0%). For all reporting years combined, the age distribution of AIDS cases is similar by sex, though a larger proportion of female cases were under the age of 30 years old. Limited data were reported for ethnicity and risk factors. The numbers of annual deaths attributed to AIDS infection have been declining since 1995. There were a record low of 241 AIDS-related deaths reported in 2013—the most recent year for which data were available. The number of AIDS-related deaths in Canada has declined 86.2% since 1995.
Conclusion: The number of AIDS cases reported by participating provinces and territories and the number of AIDS-related deaths reported by Statistics Canada has declined. While this represents a promising trend, the data should be interpreted with caution given the limitations of the dataset which could lead to an underestimate of the magnitude of the disease.
Introduction
Human immunodeficiency virus (HIV) and acquired immunodeficiency syndrome (AIDS) are a continuing international epidemic. There has been tremendous progress in international efforts to end the HIV/AIDS epidemic over the last 15 years Footnote 1 and the Joint United Nations Programme on HIV/AIDS (UNAIDS) has set a global commitment to ending the AIDS epidemic by 2030 Footnote 2. Since treatment targets were set in 2003, global annual AIDS-related deaths have decreased by 43%. While internationally an estimated one million people died from AIDS-related deaths in 2016, in high-income countries, the number of people living with AIDS and dying from AIDS-related deaths is markedly lower Footnote 3. Due in part to declining numbers of AIDS cases, some countries (for example, Australia) have ceased to include data on AIDS in their annual surveillance reports Footnote 4 Footnote 5.
The Public Health Agency of Canada (PHAC) works in partnership with other federal agencies, provincial and territorial governments, and other non-governmental organizations to address HIV and AIDS in Canada. This surveillance report is based on case reports of new diagnoses of AIDS submitted to PHAC by all participating provinces and territories, and also presents data received from Statistics Canada Footnote 6. The annual publication of AIDS data is part of PHAC's mandate to collect, analyze and report on surveillance data at the national level.
The objective of this report is to provide a descriptive overview of the reported cases of AIDS from participating provinces by identifying trends by geographic location, sex, age group and mortality. Previously, AIDS data were published annually, in combination with HIV data, in a stand-alone document entitled HIV/AIDS in Canada: Surveillance Report. This is the first iteration of this report to be published under a new title, AIDS in Canada—Surveillance Report, 2016 in the Canada Communicable Disease Report (CCDR). Note that a separate surveillance report for HIV cases, entitled HIV in Canada—Surveillance Report, 2016 also appears in this issue of CCDR Footnote 7.
Methods
This report presents data from two different sources relating to HIV and AIDS: the national HIV/AIDS Surveillance System (HASS) and Statistics Canada's Vital Statistics Death Database. HASS is a passive, case-based surveillance system that collates and maintains data voluntarily submitted to PHAC from all provincial and territorial public health authorities. Details regarding data collection, data management, data quality and population group classification have been previously described Footnote 8. In short, the HASS database captures non-nominal data on people diagnosed with AIDS and includes, but is not limited to, reporting province or territory, year of test, age group, sex, risk factors (also known as exposure category) and race/ethnicity. In this surveillance report, the term "cases" or "reported cases" refers to individuals diagnosed by a province or territory in a given year and reported to PHAC. AIDS cases are counted by the date that the reporting jurisdiction confirmed the diagnosis of AIDS.
Reported AIDS cases must meet the Canadian surveillance case definition as described in PHAC's CCDR publication Case definitions for communicable diseases under national surveillance Footnote 9. Provinces and territories that provide the data to HASS do so through the National Case Reporting Form Footnote 8 or through a secure electronic dataset transmission. All raw data (paper forms and electronic datasets) are retained in compliance with the Directive for the collection, use and dissemination of information relating to public health (Public Health Agency of Canada, 2013, unpublished document). Details regarding the HIV/AIDS exposure categories are available in the Web Exclusive of this issue Footnote 10.
AIDS data and the completeness of epidemiological information collected and submitted to PHAC vary by jurisdiction. With respect to AIDS reporting, there have been some changes that have occurred over time that affect the completeness of AIDS surveillance data. Ontario data on exposure category and race/ethnicity were not available after 2004 and Quebec AIDS data were not available after June 30, 2003. AIDS is no longer a reportable disease in Newfoundland and Labrador (as of 2009) and in Prince Edward Island (as of 2012). Due to expected delays associated with reporting of AIDS cases from British Columbia, there is a one-year lag in publication of AIDS data (e.g., 2015 AIDS data were published in the 2016 surveillance report). British Columbia race/ethnicity information for HIV/AIDS cases has been suppressed for all years while a review of this information is being undertaken by the province.
The data presented represent reported AIDS cases by participating jurisdictions diagnosed on or before December 31, 2016, that were submitted to PHAC by June 7, 2017. The data were extracted from the HASS database later in June 2017. Standardized data recoding procedures were applied to all submitted provincial and territorial datasets to create a national dataset for analysis. The descriptive and comparative analyses focus on the year 2016; however, data from 2015 are also highlighted since, due to infrastructure improvements to the HASS database, jurisdictions had not been previously asked to submit AIDS data for 2015. Data on cases reported since the beginning of AIDS surveillance in 1979 are also presented.
The complete data regarding annual deaths attributed to HIV/AIDS are available from Statistics Canada Footnote 6.
Microsoft Excel 2010 and SAS Enterprise Guide (SAS EG) v5.1 software were used for data cleaning and analysis. No statistical procedures were used for comparative analyses, nor were any statistical techniques applied to account for missing data.
With the exception of cases where data suppression was requested by the province or territory, data in tables with small cell sizes (n≤5) were not suppressed, since disclosure was not deemed to pose any risk of identifying individual cases. These procedures are in line with PHAC's Directive for the collection, use and dissemination of information relating to public health (unpublished document). The data were verified by the provinces and territories to ensure accuracy. Supplementary information, including data tables can be found in the Web Exclusive Footnote 10.
Results
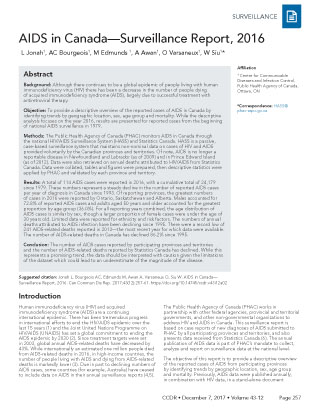
The number of reported AIDS cases per year of diagnosis in Canada has decreased steadily since the mid-1990s (Figure 1). In 2016, there were 114 AIDS cases reported to PHAC; down from 190 reported in 2015. It is, however, important to note that Quebec, Newfoundland and Prince Edward Island no longer report AIDS, and the number of new AIDS cases in 2016 in BC was not yet available at the time of publication of this report. This number of reported AIDS cases per year represents an 87.2% decrease relative to 1993, when the highest number of cases for these provinces and territories that have continuously reported AIDS was reported (n=892). From 1979 to the end of 2016, a total of 24,179 AIDS cases were reported to PHAC.
Figure 1: Number of reported AIDS cases by year of diagnosis—Canada, 1979–2016
Abbreviation: P/T, province or territory
Legend: The upper section of the figure represents the cases reported by any P/T that has stopped reporting AIDS over time, or did not report in 2016 (QC (2003), NL (2009), PE (2012), and BC (2016). The lower portion of each bar represents the cases reported by provinces that have consistently reported AIDS cases to PHAC since 1979
Figure 1 - Text Equivalent
| Year | Consistently reporting P/T's | Total number reported | |
|---|---|---|---|
| 1979 | 0 | 2 | 2 |
| 1980 | 0 | 5 | 5 |
| 1981 | 2 | 8 | 10 |
| 1982 | 7 | 19 | 26 |
| 1983 | 24 | 40 | 64 |
| 1984 | 72 | 90 | 162 |
| 1985 | 213 | 191 | 404 |
| 1986 | 373 | 322 | 695 |
| 1987 | 552 | 463 | 1015 |
| 1988 | 590 | 592 | 1182 |
| 1989 | 707 | 708 | 1415 |
| 1990 | 789 | 698 | 1487 |
| 1991 | 732 | 816 | 1548 |
| 1992 | 878 | 873 | 1751 |
| 1993 | 892 | 950 | 1842 |
| 1994 | 844 | 960 | 1804 |
| 1995 | 768 | 902 | 1670 |
| 1996 | 525 | 682 | 1207 |
| 1997 | 333 | 416 | 749 |
| 1998 | 283 | 386 | 669 |
| 1999 | 270 | 313 | 583 |
| 2000 | 235 | 311 | 546 |
| 2001 | 239 | 214 | 453 |
| 2002 | 205 | 251 | 456 |
| 2003 | 227 | 201 | 428 |
| 2004 | 209 | 150 | 359 |
| 2005 | 287 | 179 | 466 |
| 2006 | 254 | 168 | 422 |
| 2007 | 253 | 141 | 394 |
| 2008 | 268 | 147 | 415 |
| 2009 | 187 | 125 | 312 |
| 2010 | 199 | 116 | 315 |
| 2011 | 187 | 98 | 285 |
| 2012 | 169 | 84 | 253 |
| 2013 | 169 | 82 | 251 |
| 2014 | 144 | 86 | 230 |
| 2015 | 117 | 73 | 190 |
| 2016 | 114 | 0 | 114 |
Geographic distribution
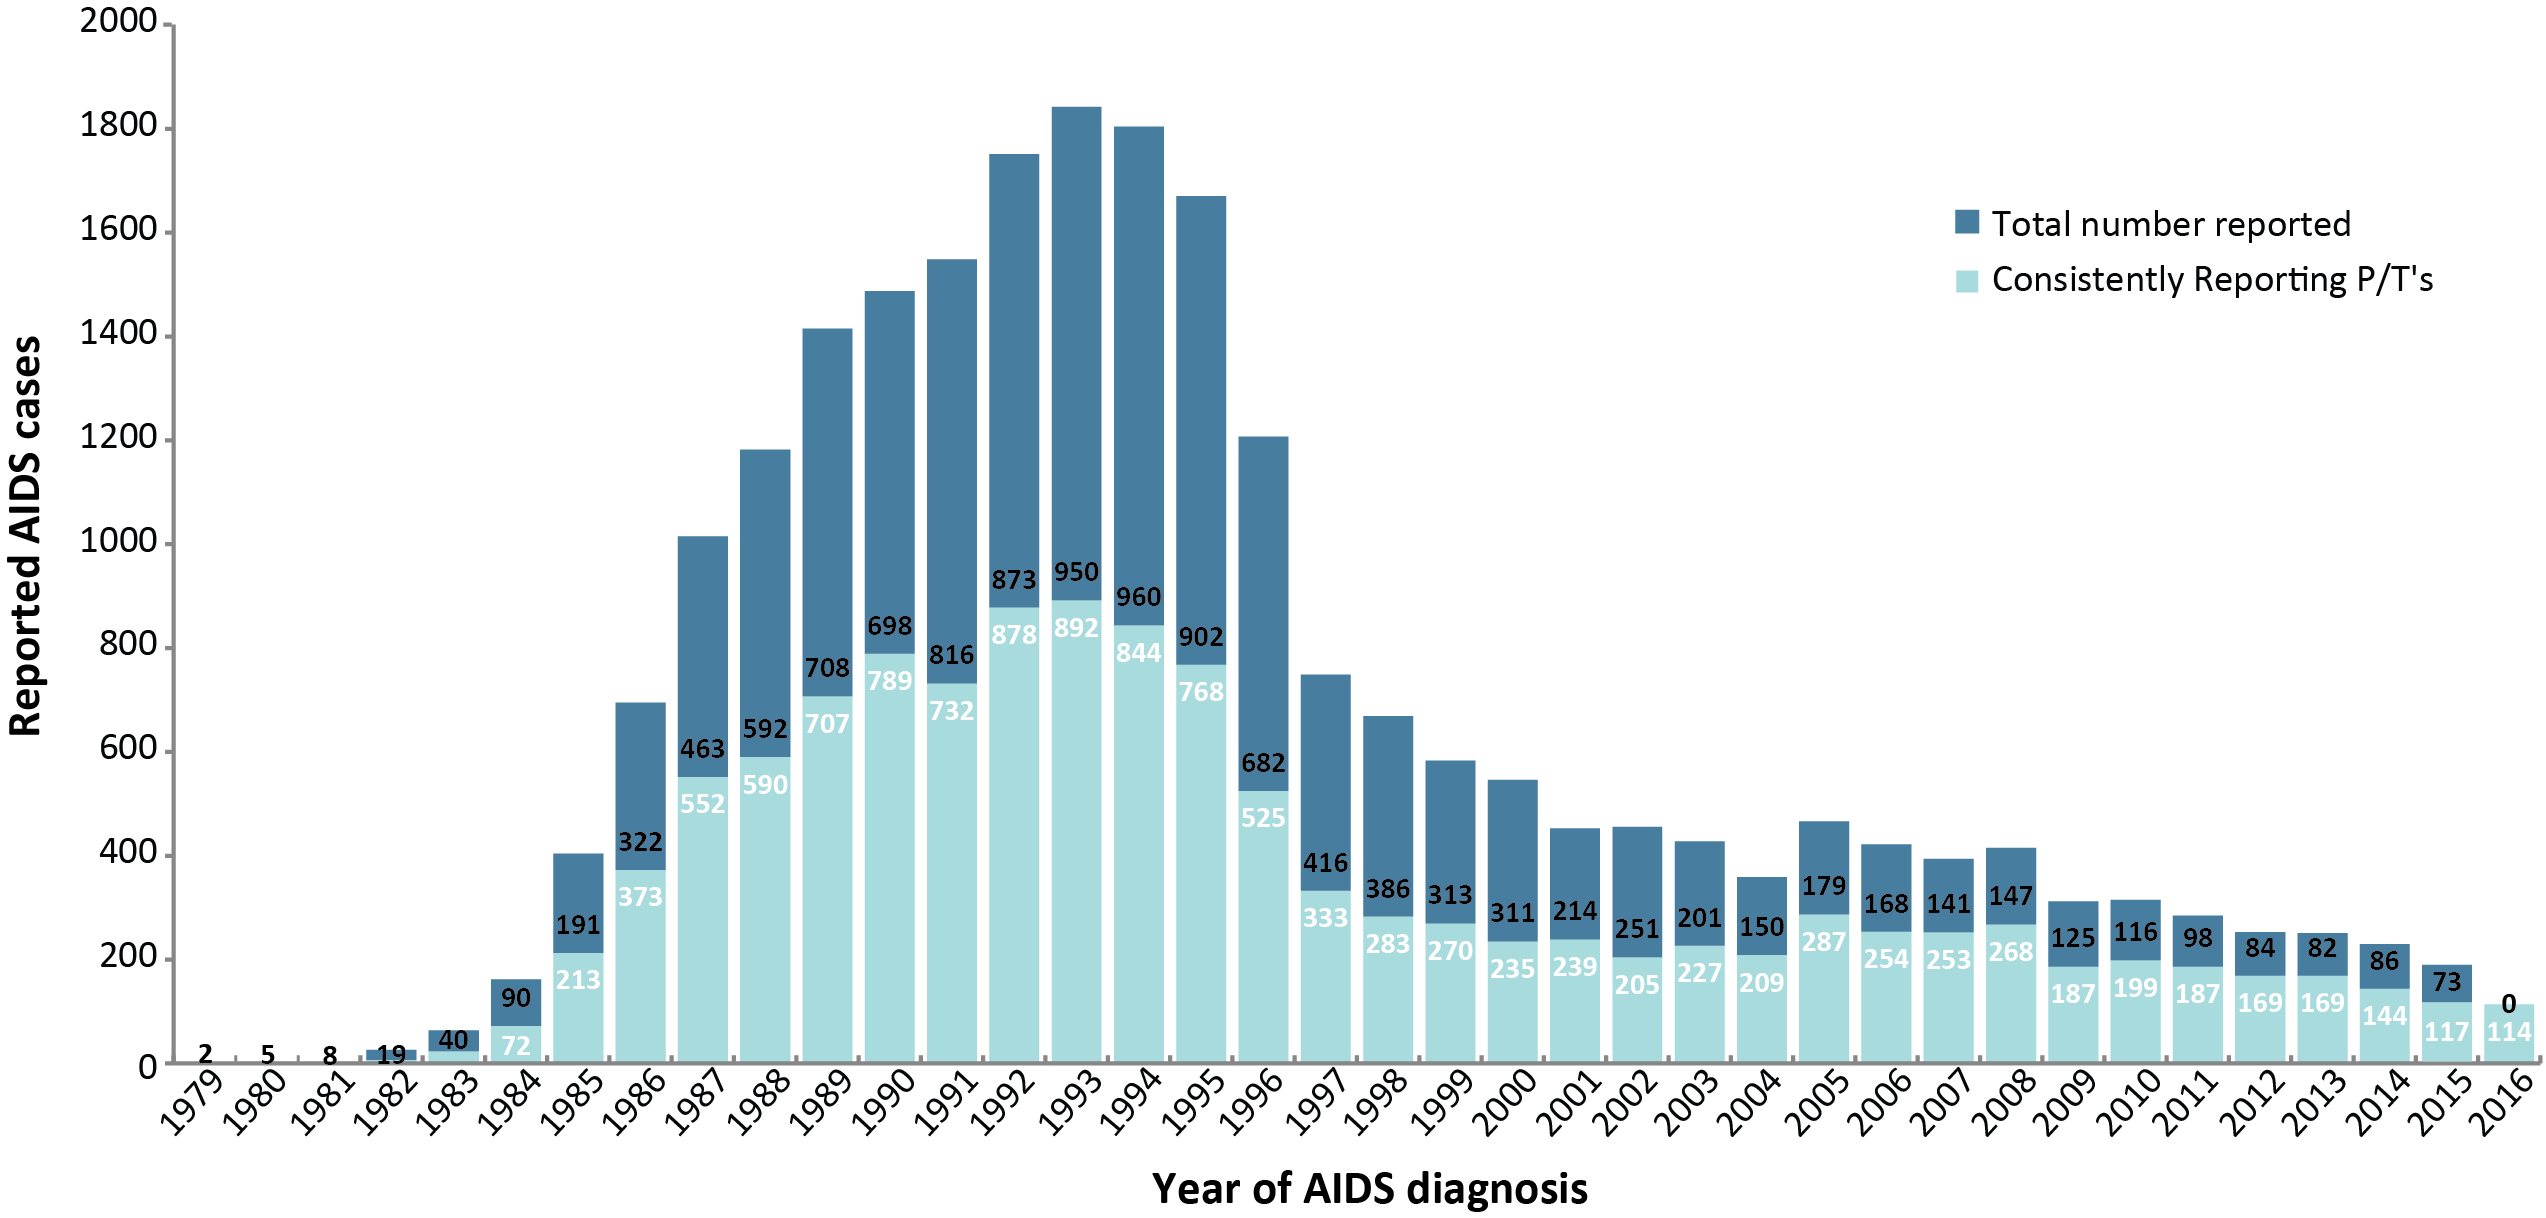
Among the provinces and territories reporting AIDS cases in 2016, the largest numbers of cases reported were in Ontario (n=66), Saskatchewan (n=22) and Alberta (n=19). In 2015 the largest numbers of AIDS cases were reported in British Columbia (n=73), followed by Ontario (n=63) and Saskatchewan (n=29) (Figure 2; Supplementary Table 1)Footnote 10.
Figure 2: Number of reported AIDS cases diagnosed by province/territory in 2015 and 2016
Abbreviation: NR, not reported
Figure 2 - Text Equivalent
| Province/territory | Number of reported AIDS cases diagnosed | |
|---|---|---|
| 2015 | 2106 | |
| British Columbia | 73 | NR |
| Yukon | 1 | 1 |
| Alberta | 16 | 19 |
| Northwest Territories | 0 | 0 |
| Nunavut | 0 | 0 |
| Saskatchewan | 29 | 22 |
| Manitoba | 4 | 1 |
| Ontario | 63 | 66 |
| Quebec | 0 | 0 |
| New Brunswick | 1 | 4 |
| Nova Scotia | 3 | 1 |
| Prince Edward Island | 0 | 0 |
| Newfoundland and Labrador | 0 | 0 |
| Total | 190 | 114 |
|
Abbreviation: NR, not reported |
||
Age and sex distribution
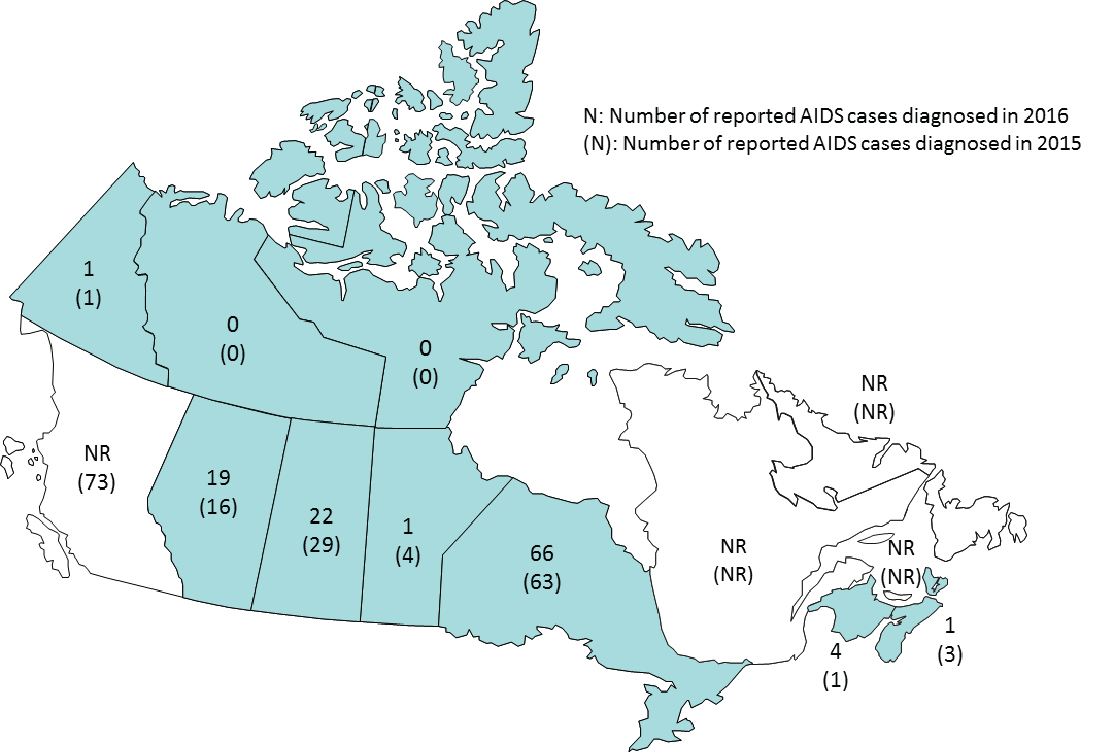
Data on age group and sex were available for all reported AIDS cases in 2016; the greatest proportion of cases was among those 50 years and older (36.0%), followed by cases aged 30 to 39 years old and 40 to 49 years old (each 23.7%) (Figure 3) One AIDS case was reported in a child less than one year old.
Figure 3: Proportion of AIDS diagnoses by age group, by year—Canada, 2007–2016
Note: Quebec AIDS data have not been available since June 30, 2003. British Columbia AIDS data were not available for 2016. AIDS is no longer a reportable disease in Newfoundland and Labrador as of 2009 and in Prince Edward Island as of 2012. This also excludes AIDS cases for which age was not reported
Figure 3 - Text Equivalent
| Age group | Year of diagnosis | |||||||||
|---|---|---|---|---|---|---|---|---|---|---|
| 2007 | 2008 | 2009 | 2010 | 2011 | 2012 | 2013 | 2014 | 2015 | 2016 | |
| Under 15 years | 0.5 % | 0.7 % | 0.6 % | 0.6 % | 0.0 % | 0.4 % | 0.4 % | 0.4 % | 0.0 % | 0.9 % |
| 15 to 19 years | 0.3 % | 0.2 % | 1.0 % | 0.6 % | 1.4 % | 0.8 % | 0.8 % | 0.4 % | 1.1 % | 2.6 % |
| 20 to 29 years | 6.1 % | 7.5 % | 8.0 % | 7.3 % | 6.7 % | 5.5 % | 9.2 % | 8.3 % | 9.5 % | 13.2 % |
| 30 to 39 years | 26.7 % | 27.7 % | 26.0 % | 21.3 % | 23.5 % | 24.5 % | 20.7 % | 24.0 % | 22.1 % | 23.7 % |
| 40 to 49 years | 42.2 % | 38.8 % | 41.3 % | 37.1 % | 41.1 % | 35.6 % | 33.1 % | 31.9 % | 33.2 % | 23.7 % |
| Over 50 years | 24.2 % | 25.1 % | 23.1 % | 33.0 % | 27.4 % | 33.2 % | 35.9 % | 34.9 % | 34.2 % | 36.0 % |
In 2016, the majority of reported AIDS cases were male (72.8%). Over all reporting years (1979-2016) the age distribution of AIDS cases is somewhat similar by sex, though a larger proportion of female cases were under the age of 30 (Figure 4; Supplementary Table 1, Supplementary Table 2, Supplementary Table 3, Supplementary Table 4, Supplementary Table 5, Supplementary Table 6)Footnote 10.
Figure 4: Number of reported AIDS diagnoses by sex — Canada, 2007–2016
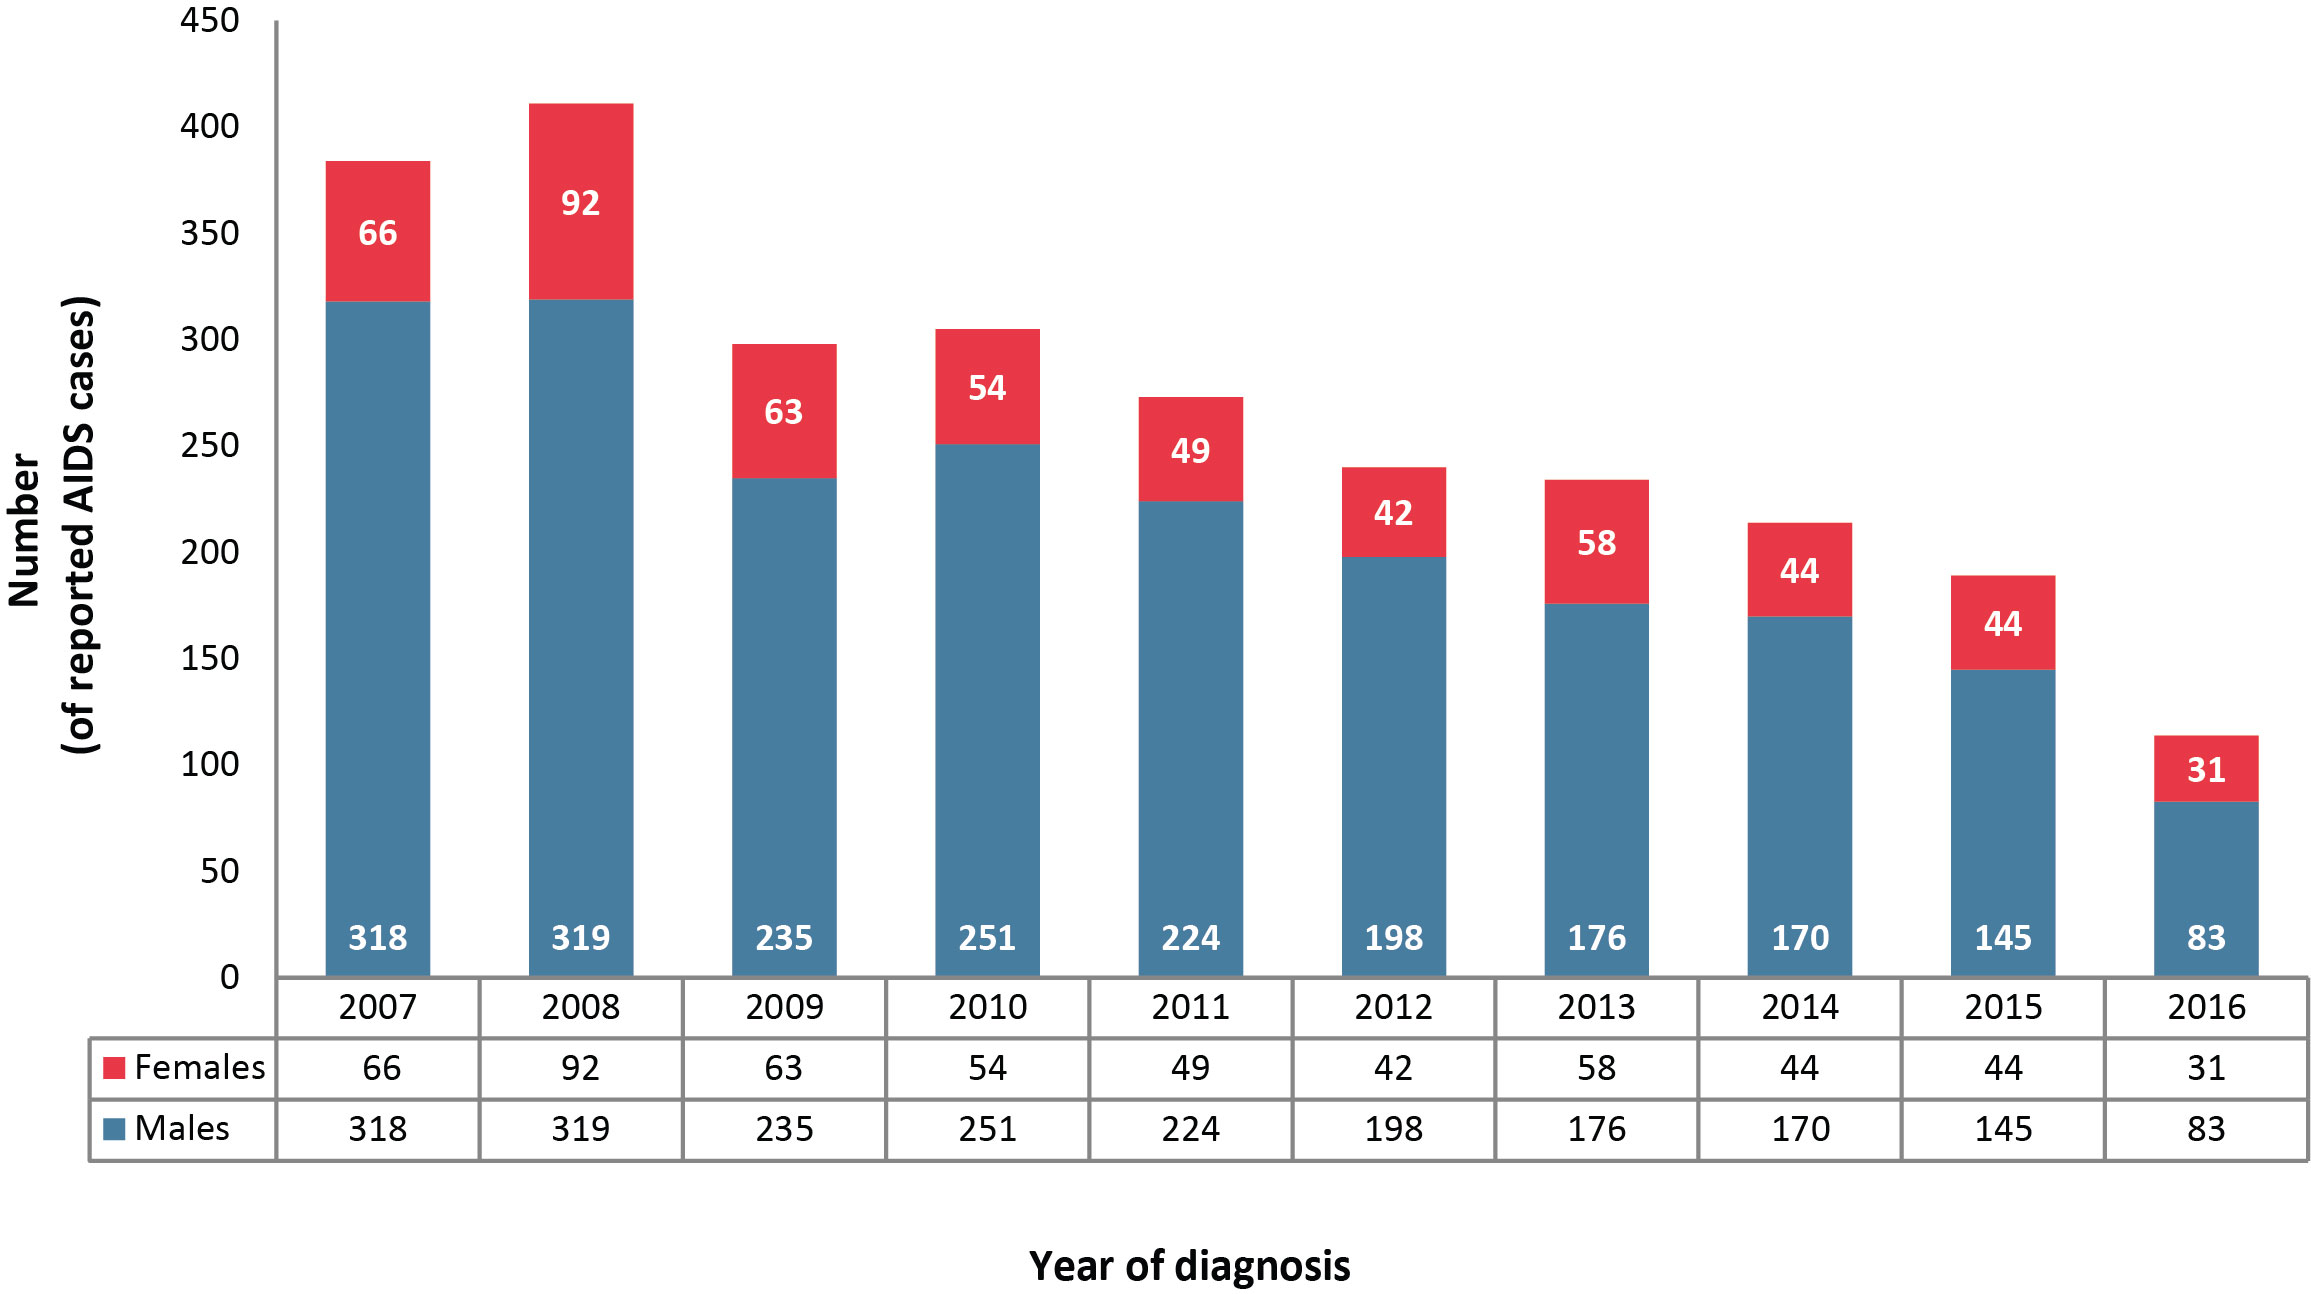
Note: Quebec AIDS data have not been available since June 30, 2003. British Columbia AIDS data were not available for 2016. AIDS is no longer a reportable disease in Newfoundland and Labrador as of 2009 and in Prince Edward Island as of 2012. This also excludes AIDS cases for which sex was not reported or was reported as transsexual or transgender
Figure 4 - Text Equivalent
| Year of diagnosis | Number of reported AIDS cases diagnoses by sex | |
|---|---|---|
| Males | Females | |
| 2007 | 318 | 66 |
| 2008 | 319 | 92 |
| 2009 | 235 | 63 |
| 2010 | 251 | 54 |
| 2011 | 224 | 49 |
| 2012 | 198 | 42 |
| 2013 | 176 | 58 |
| 2014 | 170 | 44 |
| 2015 | 145 | 44 |
| 2016 | 83 | 31 |
| Total | 21,359 | 2,617 |
Exposure category
In 2016, 37.7% of reported AIDS cases had information on exposure category. Of the available 2016 data (from Yukon, Northwest Territories, Alberta, Saskatchewan, Manitoba, Nova Scotia, and New Brunswick), the largest proportions of exposure categories reported, among adults, were injection drug use (IDU) (35.0%) and sexual contact with a person at risk (20.0%). This differs from 2015 (which includes British Columbia data), where proportions for the "men who have sex with men" and IDU exposure categories were similar at 23.7% and 27.8% respectively (Supplementary Table 7, Supplementary Table 8, Supplementary Table 9, Supplementary Table 10, Supplementary Table 11)Footnote 10.
Race/ethnicity
In 2016, 38.6% of reported AIDS cases had information on race/ethnicity. Of the available 2016 data (from Yukon, Northwest Territories, Alberta, Saskatchewan, Manitoba, Nova Scotia and New Brunswick), the largest proportions of races/ethnicities reported, for all age groups, were Indigenous (50.0%), White (29.5%) and Black (13.6%) (Supplementary Table 12)Footnote 10.
AIDS mortality
Data from the Vital Statistics Death Database show that the numbers of annual deaths attributed to HIV infection have been declining since 1995 (Figure 5). The lowest recorded number of deaths attributed to HIV infection (n=241) was reported in 2013, the most recent year for which data were available. Of these reported AIDS-related deaths, there were more males than females (Supplementary Table 13, Supplementary Table 14, Supplementary Table 15)Footnote 10.
Figure 5: Number of deaths attributed to HIV infection among adults (≥15 years old) by year of death and sex—Canada, 1987–2013
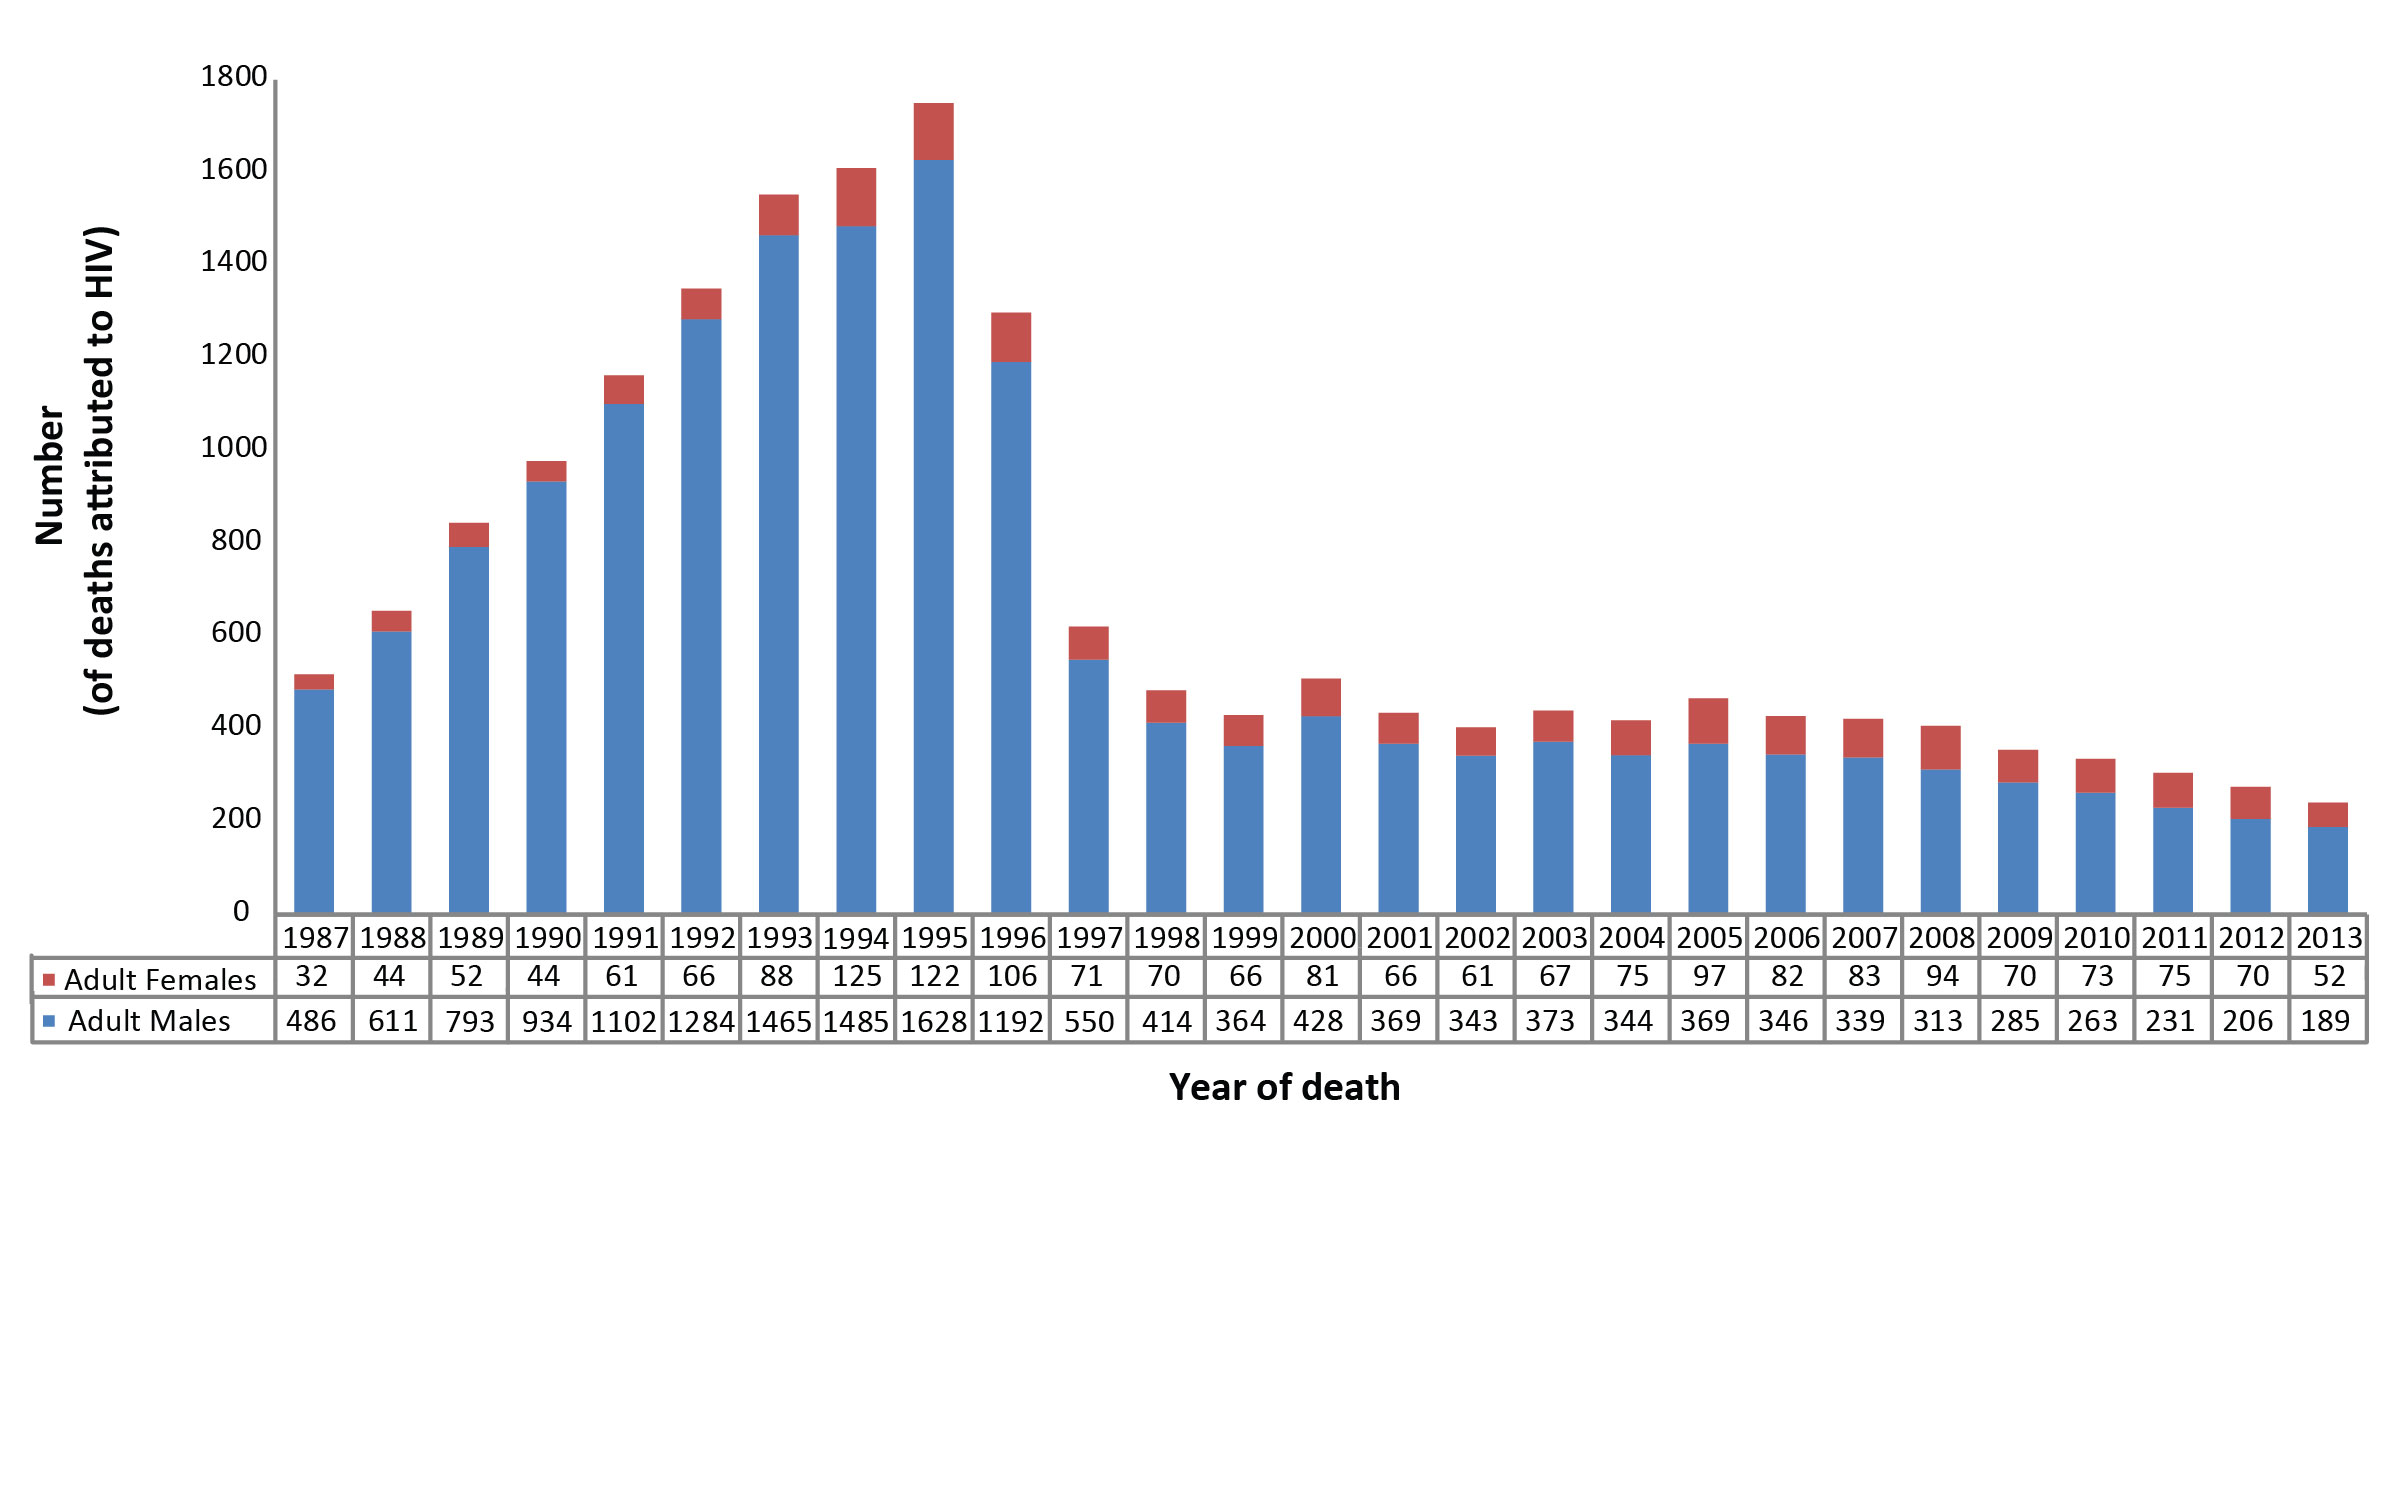
Note: From Statistics Canada. Canadian Vital Statistics, Birth and Death DatabasesFootnote 8
Figure 5 - Text Equivalent
| Year of death | Adult males | Adults females | Total |
|---|---|---|---|
| 1987 | 486 | 32 | 518 |
| 1988 | 611 | 44 | 655 |
| 1989 | 793 | 52 | 845 |
| 1990 | 934 | 44 | 978 |
| 1991 | 1,102 | 61 | 1,163 |
| 1992 | 1,284 | 66 | 1,350 |
| 1993 | 1,465 | 88 | 1,553 |
| 1994 | 1,485 | 125 | 1,610 |
| 1995 | 1,628 | 122 | 1,750 |
| 1996 | 1,192 | 106 | 1,298 |
| 1997 | 550 | 71 | 621 |
| 1998 | 414 | 70 | 484 |
| 1999 | 364 | 66 | 430 |
| 2000 | 428 | 81 | 509 |
| 2001 | 369 | 66 | 435 |
| 2002 | 343 | 61 | 404 |
| 2003 | 373 | 67 | 440 |
| 2004 | 344 | 75 | 419 |
| 2005 | 369 | 97 | 466 |
| 2006 | 346 | 82 | 428 |
| 2007 | 339 | 83 | 422 |
| 2008 | 313 | 94 | 407 |
| 2009 | 285 | 70 | 355 |
| 2010 | 263 | 73 | 336 |
| 2011 | 231 | 75 | 306 |
| 2012 | 206 | 70 | 276 |
| 2013 | 189 | 52 | 241 |
| Total | 16,706 | 1,993 | 18,699 |
|
Note: From Statistics Canada. Canadian Vital Statistics, Birth and Death Databases |
|||
Discussion
The number of reported AIDS cases in Canada has experienced an overall decline since the mid-1990s, with a total of 114 AIDS cases reported from participating provinces and territories in 2016. This is the lowest number of AIDS cases reported in one year since 1985Footnote 10. Of provinces reporting in 2016, the highest count of AIDS cases were attributed to Ontario (n=66). Injection drug use (35.0%) and the over 50 year old age group (36.0%) continued to be the exposure category and age group with the largest proportion of new cases. In 2016, AIDS cases were most common in men (72.8%) and those reported as being of Indigenous race/ethnicity (50.0%). It is important to note that the total AIDS case counts across all reporting years tend to overstate the decrease from the highest year (1993) to 2016 due to a number of provinces removing AIDS as a reportable disease since 2003. Still, when examining only the provinces who submitted 2016 AIDS data, there remains an 87.2% decrease in AIDS cases from 1993 to 2016.
With the exclusion of British Columbia (n=73), the highest counts of AIDS cases in 2015 were attributed to Ontario (n=63), Saskatchewan (n=29) and Alberta (n=16). No changes to this trend were noted in 2016, with the highest AIDS case counts found in Ontario (n=66), Saskatchewan (n=22) and Alberta (n=19). Of the reported cases in 2016, adults aged 50 years and older accounted for the largest proportion of AIDS cases (36.0%) with the increase over the past five years in proportion to newly diagnosed HIV cases in this age groupFootnote 11. Over all reporting years, when comparing males to females, there was a greater proportion of AIDS cases in the older age groups (30-50+ years old) for males than females, while females made up a greater proportion of cases in the younger age groups (0-29 years old). This is consistent with the proportions of age groups in cumulative HIV cases across all reporting years; however, it is possible that the distribution of female AIDS cases will shift to older age groups over time, as a similar trend has been noted in HIV cases in recent yearsFootnote 11.
Based on the most comprehensive dataset from Statistics Canada, the number of annual deaths attributed to HIV infection in Canada has been declining since 1995, with the most recent data showing 241 deaths in 2013—the lowest number yet. Of these, 78.4% were adult males and 21.6% were adult females, with no reported deaths in children (<15 years).
Limitations and data quality
The data in this report are deemed provisional and may be subject to change in future iterations of the AIDS in Canada surveillance report. Differences between the data published in this report and the data published in previous national, provincial and territorial surveillance reports may be due to reporting delays or differences in when the data were extracted from the various surveillance databases. Where such differences are noted, it is recommended that data from the most recent provincial and territorial reports be used.
Several limitations need to be considered. First HASS is a passive, case-based surveillance system, so it is not possible to ascertain whether all individuals with AIDS infection are being identified and reported from participating provinces. AIDS cases may be underreported for a number of reasons. Since AIDS results from an advanced HIV infection and since HIV is a chronic infection with a long latency period, many individuals who are newly infected in a given year may not receive a diagnosis of HIV for months or yearsFootnote 12. Additionally, not all jurisdictions report AIDS cases to PHAC, and many physicians fail to report AIDS-defining illness for those patients already living with HIV. A second limitation is that three provinces no longer report AIDS cases. Third, reporting is not always complete; for example, exposure category or ethnicity data are submitted for fewer than 40% of cases. Fourth, data on deaths attributed to HIV infection are available only from 1987 onward and most recent available data are from 2013. Finally, the identification and removal of duplicates is difficult due to the non-nominal nature of HIV reporting in some jurisdictions. Where possible, provinces and territories review and assess the inclusion of duplicate reports in order to provide as accurate a picture as possible. Further details regarding data limitations have been published previouslyFootnote 3.
Conclusion
Canada has seen consistent reductions in reported AIDS cases and AIDS-related deaths, with 2016 representing the lowest annual counts to date for both. While this represents a promising trend, the data should be interpreted with caution given the limitations of the dataset, which could lead to an underestimation of the magnitude of the disease. As the primary source of national data on AIDS cases, the data within this report provide information for public health action and allow for the monitoring of Canadian and global efforts to end the AIDS epidemic by 2030.
Authors' statement
LJ—conceptualization, software, validation, visualization, writing—original draft, review and editing
ACB—writing—review and editing, supervision
ME—methodology, software, validation, data curation, visualization, writing—original draft, review and editing
AA—visualization, writing—original draft, review and editing
OV—visualization, writing—review and editing
WS—writing—review and editing, project administration, supervision
Conflict of Interest
None.
Acknowledgements
The Public Health Agency of Canada would like to acknowledge the following individuals from the provincial and territorial HIV/AIDS programs for their contribution and participation:
Sumina Fathima, Alberta Health
Rosa Maheden, Alberta Health
Mariam Osman, Alberta Health
Clinical Prevention Service, Surveillance and Epidemiology, BC Centre for Disease Control
Carla Loeppky, Manitoba Health
Rita RaaFat Gad, New Brunswick Department of Health
Shelley Landsburg, New Brunswick Department of Health
Sophie Wertz, New Brunswick Department of Health
Susan Earles, Health and Community Services, Population Health Branch, Newfoundland and Labrador
Jennifer Phillips, Health and Community Services, Population Health Branch, Newfoundland and Labrador
Heather Hannah, Department of Health and Social Services, Northwest Territories
Angela Fitzgerald, Nova Scotia Department of Health and Wellness
Angie Mullen, Nunavut Department of Health
Elaine Randell, Nunavut Department of Health
Abigail Kroch, Ontario Treatment Network
Juan Liu, Public Health Ontario
Alex Marchand-Austin, Public Health Ontario
Doug Sider, Public Health Ontario
Michael Whelan, Public Health Ontario
Marguerite Cameron, Prince Edward Island Department of Health and Wellness
Stacey Burns, Prince Edward Island Department of Health and Wellness
Raphaël Bitera, Direction des risques biologiques et de la santé au travail, Institut national de santé publique du Québec
Micheline Fauvel, Laboratoire de santé publique du Québec, Institut national de santé publique du Québec
Maureen Hastie, Laboratoire de santé publique du Québec, Institut national de santé publique du Québec
Raymond Parent, Direction des risques biologiques et de la santé au travail, Institut national de santé publique du Québec
Diane Sylvain, Laboratoire de santé publique du Québec, Institut national de santé publique du Québec
Helen Bangura, Saskatchewan Ministry of Health
John Manalo, Saskatchewan Ministry of Health
Lori Strudwick, Yukon Communicable Disease Control
Rachelle Wallace, Yukon Communicable Disease Control
Sabrina Plitt, Public Health Agency of Canada (Alberta)
Elsie Wong, Public Health Agency of Canada (British Columbia)
Suresh Khatkar, Public Health Agency of Canada (Manitoba)
Marie LaFreniere, Public Health Agency of Canada (Nova Scotia)
Ashleigh Sullivan, Public Health Agency of Canada (Ontario)