Tuberculosis in Canada - 2015

 Download this article as a PDF (1373 KB - 6 pages)
 Published by: The Public Health Agency of Canada
Issue: Volume 43-3/4: Tuberculosis (TB)
Date published: March 2, 2017
ISSN: 1481-8531
Submit a manuscript
About CCDR
Browse
Volume 43-3/4, March 2, 2017: Tuberculosis (TB)
Surveillance report
Tuberculosis in Canada - Summary 2015
V Gallant1*, V Duvvuri1, M McGuire1
Affiliation
1 Centre for Communicable Diseases and Infection Control, Public Health Agency of Canada, Ottawa, ON
Correspondence
Suggested citation
Gallant V, Duvvuri V, McGuire M. Tuberculosis in Canada - Summary 2015. Can Commun Dis Rep. 2017;43(3):77-82. https://doi.org/10.14745/ccdr.v43i34a04
Abstract
Background: Tuberculosis (TB) is a global health problem that affects an estimated 10 million people each year. In Canada, the Public Health Agency of Canada (PHAC) monitors active TB disease through the Canadian Tuberculosis Reporting System (CTBRS).
Objective: To report on and analyze the number of new and re-treatment cases of TB cases in Canada reported for 2015. Results are discussed in the context of previous year's data. Treatment outcomes for cases diagnosed in 2014 are also presented.
Methods: The CTBRS is a case-based surveillance system that maintains non-nominal data on active cases of TB. Data are collected and analyzed by PHAC and validated by each province and territory; no statistical tests were used.
Results: A total of 1,639 cases of active TB disease were reported in 2015, representing a slight increase from the number of cases reported in 2014 (1,614) and a corresponding increase in the incidence rate from 4.5 per 100,000 to 4.6 per 100,000 population. Although the incidence rate of TB remained highest in Nunavut at 119.2 per 100,000 population in 2015, it was nearly half of what it was in 2014. An outbreak in Newfoundland and Labrador resulted in a notable increase in the number of reported cases and incidence rate in this province. In 2015, males accounted for just over half of the reported cases at 53% and older Canadians carried the highest burden of TB with an incidence rate of 10.3 per 100,000 population. Foreign-born individuals continued to account for the majority of reported cases at 71%, but the incidence rate remained highest among Canadian-born Indigenous people at 17.1 per 100,000 population and in particular within the Inuit population at 166.2 per 100,000. Pulmonary TB remained the most commonly reported site of disease. Treatment outcome data for cases reported in 2014 indicated that 85% of cases had been cured or had completed treatment.
Conclusion: Tuberculosis rates in Canada have changed little over the last decade and overall, remain stable and low in the global context. However, foreign-born individuals and Indigenous Canadians continued to be disproportionately represented among reported cases of TB in 2015. As the primary source of national data on TB cases, the data within this report provide timely information for public health action, as well as policy and program development and assessment.
Introduction
Tuberculosis (TB) is a major global health problem. In 2015 there were an estimated 10.4 million new (incident) cases, for an overall global rate of 142 cases per 100,000 population Footnote 1. Although the incidence rate of active TB disease in Canada has been decreasing over time and is among the lowest in the world, high rates persist among Indigenous peoples and among foreign-born individuals Footnote 2Footnote 3.
The federal health portfolio, in partnership with provincial and territorial governments and other federal departments and agencies, works to address TB in Canada. The Public Health Agency of Canada (PHAC) monitors national active TB disease through the Canadian Tuberculosis Reporting System (CTBRS) which is a collaborative effort with provincial and territorial ministries of health. PHAC uses TB surveillance data to monitor progress toward Canada's goal of preventing and controlling the transmission of TB, as outlined in Tuberculosis Prevention and Control in Canada: A Federal Framework for Action Footnote 4.
This summary presents a descriptive overview of all reported cases of TB (new and re-treatment) in Canada in 2015 by geographic distribution, age, sex, origin and diagnostic classification. Results are discussed in the context of data from previous years. Treatment outcomes for cases diagnosed in 2014 are also reported.
Previously, these data were published annually in a stand-alone document entitled Tuberculosis in Canada: Pre-release. This is the first iteration of this report to be published under a new title, Tuberculosis in Canada: 2015 Summary, in the Canada Communicable Disease Report (CCDR). Supplementary data are available online Footnote 5.
Methods
The CTBRS is a case-based surveillance system that maintains non-nominal data on people diagnosed with active TB disease in Canada. Details on the CTBRS's methods, including data collection processes, data management, data quality control, analysis, and the classification and categorization of population subgroups have already been described Footnote 2. In short, provincial and territorial public health authorities voluntarily submit data on all new and re-treatment cases of active TB disease that meet the Canadian case definition for national surveillance Footnote 5. Treatment outcome data are submitted between 12 and 18 months following the submission of the initial case report. If treatment is ongoing at the time of data submission to PHAC, the reporting jurisdiction submits an interim report followed by subsequent annual updates until the case file is closed.
Data are submitted to PHAC either through manual completion of a standard reporting form or by electronic transmission. All raw data (paper forms and electronic datasets) are retained in compliance with the Directive for the collection, use and dissemination of information relating to public health (Public Health Agency of Canada. 2013 [unpublished document]).
The "incidence rate" refers to the number of individuals diagnosed with active TB disease (new and re-treatment) per 100,000 population in each reporting year. Population denominators used to calculate rates are derived from several sources. Rates for the total Canadian and provincial/territorial population counts by age and by sex are based on mid-year estimations from 2011 census data are produced by the Demography Division of Statistics Canada (unpublished data). The foreign-born population counts are estimated from the 2011 household survey Footnote 6. For Indigenous population groups, First Nations, Inuit and Métis, rates are also based on data from the 2011 National Household Survey Footnote 7. Finally, the rates for First Nations with status, on and off-reserve, were calculated using population projections produced by Indigenous and Northern Affairs Canada (unpublished data).
Microsoft Excel 2010 and SAS Enterprise Guide (SAS EG) v5.1 software were used for data cleaning and analysis. No statistical procedures were used for comparative analyses, nor were any statistical techniques applied to account for missing data. Except for risk factor data, data collected through this system are very complete. Data in tables with small cell sizes (n=<5) were not suppressed, since disclosure is not deemed to pose any risk of identifying individual cases. These procedures are in line with the PHAC's Directive for the collection, use and dissemination of information relating to public health (unpublished document). The data were vetted by the provinces and territories to ensure accuracy.
Data for this report were extracted from the CTBRS in August of 2016. Tuberculosis cases are counted by the date that the reporting jurisdiction confirmed the individual had TB. Because data at the national level are submitted annually, any updates are typically submitted 12 months following the initial annual submission.
Results
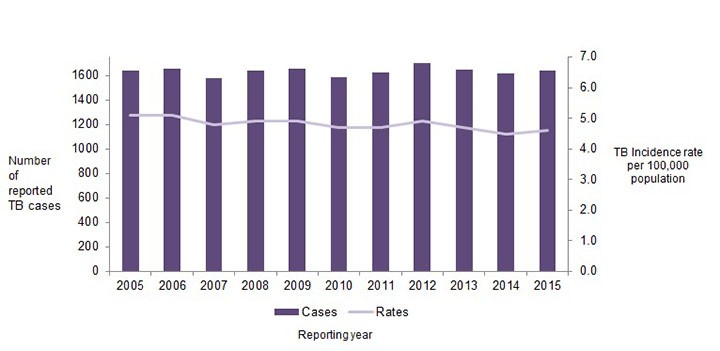
In Canada, 1,639 cases of active TB disease were reported in 2015, representing a slight increase from the number of cases reported in 2014 (1,614) and a corresponding increase in the incidence rate from 4.5 per 100,000 to 4.6 per 100,000 population (Figure 1, Supplementary Table 1A Footnote 5). Of the cases reported in 2015, 92% (1,509) were identified as new cases. Six percent (101) of the cases were reported as re-treatment cases and previous history of TB disease was unknown for two percent (29) of reported cases (data not shown).
Figure 1: Number of reported active tuberculosis cases (new and re-treatment) and incidence rate per 100,000 population in Canada, 2005 to 2015
Text description: Figure 1
Figure 1: Number of reported active tuberculosis cases (new and re-treatment) and incidence rate per 100,000 population in Canada, 2005 to 2015
| Years | Cases | Rates |
|---|---|---|
| 2005 | 1640 | 5.1 |
| 2006 | 1653 | 5.1 |
| 2007 | 1575 | 4.8 |
| 2008 | 1642 | 4.9 |
| 2009 | 1654 | 4.9 |
| 2010 | 1586 | 4.7 |
| 2011 | 1621 | 4.7 |
| 2012 | 1700 | 4.9 |
| 2013 | 1651 | 4.7 |
| 2014 | 1614 | 4.5 |
| 2015 | 1639 | 4.6 |
Geographical distribution
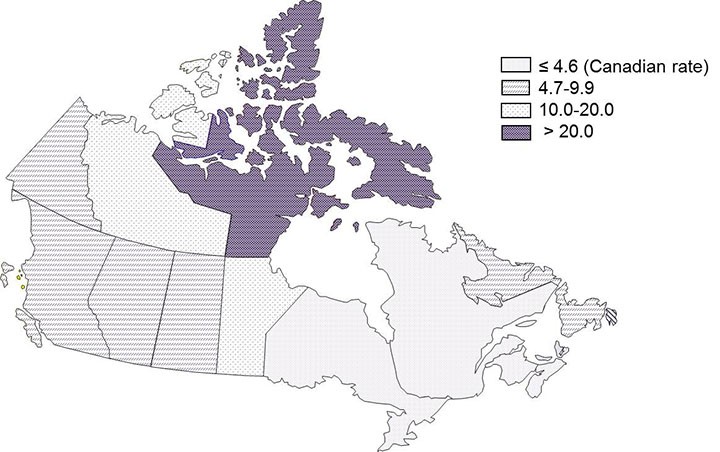
In 2015, the TB incidence rates in the Maritime provinces (New Brunswick, Nova Scotia and Prince Edward Island), Ontario and Quebec were equal to or below the Canadian rate of 4.6 per 100,000 population (Figure 2). The incidence rates in all other provinces and territories were higher than the Canadian rate.
Figure 2: Tuberculosis incidence rate per 100,000 population by province/territory in Canada, 2015
Text description: Figure 2
Figure 2: Tuberculosis incidence rate per 100,000 population by province/territory in Canada, 2015
| Measure | Canada | N.L. | P.E.I. | N.S. | N.B. | Que. | Ont. | Man. | Sask. | Alta. | B.C. | Y.T. | N.W.T. | Nvt. |
|---|---|---|---|---|---|---|---|---|---|---|---|---|---|---|
| Rate | 4.6 | 6.3 | 2.0 | 0.6 | 0.8 | 3.0 | 4.3 | 12.2 | 6.1 | 5.0 | 5.6 | 8.0 | 11.3 | 119.2 |
Nunavut continued to have the highest incidence rate of TB at 119.2 per 100,000 population, a rate which was 26 times higher than the overall Canadian rate. However, this incidence rate was nearly half of what it was in 2014 at 232.8 per 100,000 population. Because of a TB outbreak, the number of cases reported in Newfoundland and Labrador rose from seven in 2014 to 33 in 2015, resulting in a fivefold increase in the incidence rate of TB in this province (6.3 vs. 1.3 cases per 100,000 population). Additional data are available in Supplementary Table 1A Footnote 5.
Sex and age distribution
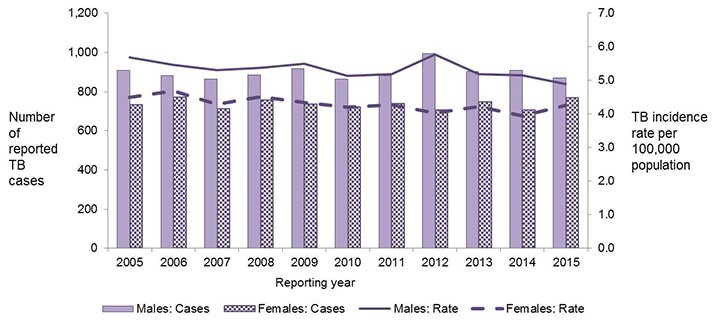
In Canada, between 2005 and 2015, males have consistently accounted for a larger percentage of reported cases than females with correspondingly higher incidence rates (Figure 3). In 2015, males accounted for 53% (871) of reported cases, corresponding to an incidence rate of 4.9 per 100,000 population. In comparison, females accounted for 47% (768) of all reported cases for an incidence rate of 4.2 per 100,000 population (Supplementary Tables 1B and 1C Footnote 5).
Figure 3: Number of reported active tuberculosis cases (new and re-treatment) and incidence rates per 100,000 population by sex in Canada, 2005 to 2015
Text description: Figure 3
Figure 3: Number of reported active tuberculosis cases (new and re-treatment) and incidence rates per 100,000 population by sex in Canada, 2005 to 2015
| Year | Males | Females | ||
|---|---|---|---|---|
| Cases | Rate | Cases | Rate | |
| 2005 | 908 | 5.7 | 732 | 4.5 |
| 2006 | 882 | 5.5 | 771 | 4.7 |
| 2007 | 864 | 5.3 | 711 | 4.3 |
| 2008 | 886 | 5.4 | 756 | 4.5 |
| 2009 | 917 | 5.5 | 737 | 4.3 |
| 2010 | 865 | 5.1 | 721 | 4.2 |
| 2011 | 882 | 5.2 | 739 | 4.3 |
| 2012 | 994 | 5.8 | 706 | 4.0 |
| 2013 | 903 | 5.2 | 748 | 4.2 |
| 2014 | 907 | 5.1 | 706 | 3.9 |
| 2015 | 871 | 4.9 | 768 | 4.2 |
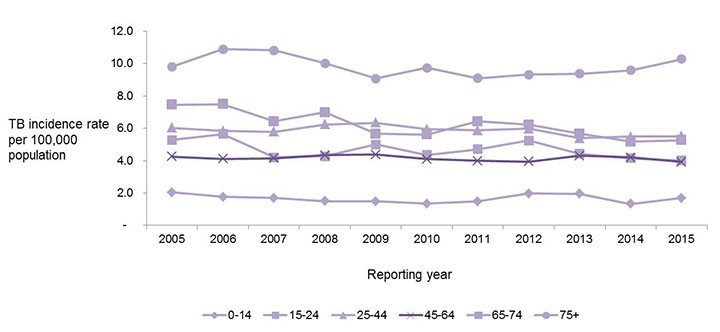
Between 2005 and 2015, TB incidence rates have remained stable or have declined slightly across all age groups (Supplementary Table 2 Footnote 5; Figure 4). The most noticeable decrease in incidence rates has been in individuals 65 to 74 years of age, ranging from a high of 7.5 per 100,000 population in 2005 to a low of 5.2 per 100,000 population in 2014. As in previous years, in 2015, older adults (75 years and over), carried the highest disease burden with an incidence rate of 10.3 per 100,000 population. See additional data in Supplementary Table 2 Footnote 5.
Figure 4: Tuberculosis incidence rates per 100,000 population by age group in Canada, 2005 to 2015
Text description: Figure 4
Figure 4: Tuberculosis incidence rates per 100,000 population by age group in Canada, 2005 to 2015
| Reporting Year | Age | |||||
|---|---|---|---|---|---|---|
| 0-14 | 15-24 | 25-44 | 45-64 | 65-74 | 75+ | |
| 2005 | 2.0 | 5.3 | 6.0 | 4.3 | 7.5 | 9.8 |
| 2006 | 1.8 | 5.6 | 5.8 | 4.1 | 7.5 | 10.9 |
| 2007 | 1.7 | 4.2 | 5.8 | 4.2 | 6.4 | 10.8 |
| 2008 | 1.5 | 4.3 | 6.2 | 4.3 | 7.0 | 10.0 |
| 2009 | 1.5 | 5.0 | 6.4 | 4.4 | 5.7 | 9.1 |
| 2010 | 1.4 | 4.4 | 5.9 | 4.1 | 5.6 | 9.7 |
| 2011 | 1.5 | 4.7 | 5.9 | 4.0 | 6.4 | 9.1 |
| 2012 | 2.0 | 5.2 | 6.0 | 3.9 | 6.2 | 9.3 |
| 2013 | 2.0 | 4.4 | 5.4 | 4.3 | 5.7 | 9.4 |
| 2014 | 1.3 | 4.1 | 5.5 | 4.2 | 5.2 | 9.6 |
| 2015 | 1.7 | 4.0 | 5.5 | 3.9 | 5.3 | 10.3 |
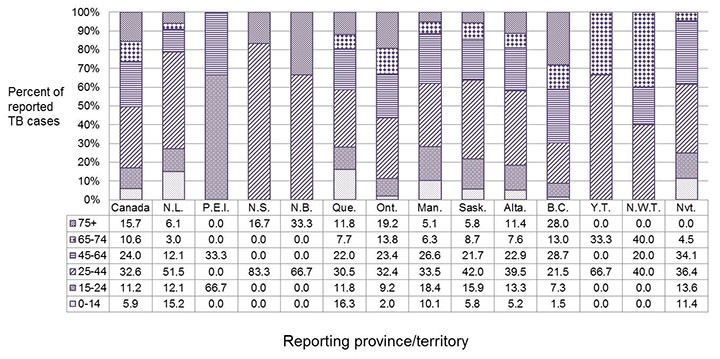
In 2015, individuals aged 25 to 44 years continued to represent the largest percentage of reported cases at 33% (535) (Figure 5) and six percent of all reported cases (97) were in children under 15 years of age. Tuberculosis disease in very young children often indicates recent transmission Footnote 8 (Figure 5). In Manitoba, Nunavut, Newfoundland and Labrador, and Quebec, over 10% of reported cases were children less than 15 years of age (Figure 5, Supplementary Table 3 Footnote 5).
Figure 5: Distribution of active tuberculosis cases (new and re-treatment) by age group and province/territory and Canada overall, 2015
Text description: Figure 5
Figure 5: Distribution of active tuberculosis cases (new and re-treatment) by age group and province/territory and Canada overall, 2015
| Age | Canada | N.L. | P.E.I. | N.S. | N.B. | Que. | Ont. | Man. | Sask. | Alta. | B.C. | Y.T. | N.W.T. | Nvt. |
|---|---|---|---|---|---|---|---|---|---|---|---|---|---|---|
| 0-14 | 5.9 | 15.2 | 0.0 | 0.0 | 0.0 | 16.3 | 2.0 | 10.1 | 5.8 | 5.2 | 1.5 | 0.0 | 0.0 | 11.4 |
| 15-24 | 11.2 | 12.1 | 66.7 | 0.0 | 0.0 | 11.8 | 9.2 | 18.4 | 15.9 | 13.3 | 7.3 | 0.0 | 0.0 | 13.6 |
| 25-44 | 32.6 | 51.5 | 0.0 | 83.3 | 66.7 | 30.5 | 32.4 | 33.5 | 42.0 | 39.5 | 21.5 | 66.7 | 40.0 | 36.4 |
| 45-64 | 24.0 | 12.1 | 33.3 | 0.0 | 0.0 | 22.0 | 23.4 | 26.6 | 21.7 | 22.9 | 28.7 | 0.0 | 20.0 | 34.1 |
| 65-74 | 10.6 | 3.0 | 0.0 | 0.0 | 0.0 | 7.7 | 13.8 | 6.3 | 8.7 | 7.6 | 13.0 | 33.3 | 40.0 | 4.5 |
| 75+ | 15.7 | 6.1 | 0.0 | 16.7 | 33.3 | 11.8 | 19.2 | 5.1 | 5.8 | 11.4 | 28.0 | 0.0 | 0.0 | 0.0 |
Distribution by origin
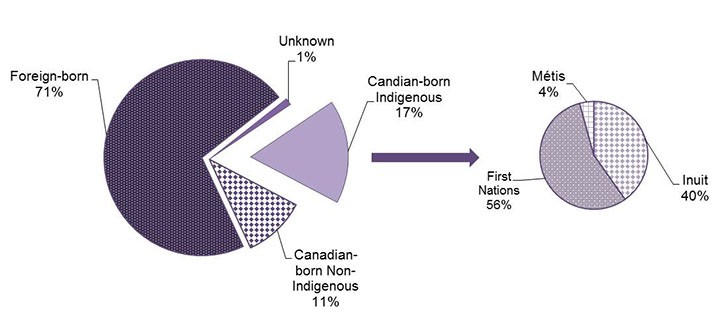
Foreign-born individuals and Canadian-born Indigenous people continued to be disproportionately represented among reported cases of TB in 2015 (Figure 6). The foreign-born population, which represented approximately 22% of the total Canadian population in 2015, accounted for 71% (1,169/1,639) of all reported cases corresponding to an incidence rate of 14.8 per 100,000 population. Canadian-born Indigenous people made up approximately five percent of the total Canadian population in 2015 but accounted for 17% (281/1,639) of all reported cases, with a corresponding incidence rate of 17.1 per 100,000 population. Canadian-born non-Indigenous people accounted for the lowest percentage of reported cases at 11% (170/1,639), for an incidence rate of 0.6 per 100,000 population. Origin was unknown for 1% (19/1,639) of reported cases (Figure 6, Supplementary Table 4 Footnote 5).
The distribution of TB cases across origin groups varied by province and territory. In Manitoba, Newfoundland and Labrador, the north (Northwest Territories, Nunavut and Yukon) and Saskatchewan, most cases were Canadian-born Indigenous people. In Alberta, British Columbia, the Maritime provinces (New Brunswick, Nova Scotia and Prince Edward Island), Ontario and Quebec, most reported cases were foreign-born. In New Brunswick and Quebec, approximately 30% of reported cases were Canadian-born non-Indigenous people. For the remainder of the provinces and territories, Canadian-born non-Indigenous cases represented fewer than 10% of reported cases (Supplementary Table 4 Footnote 5).
Figure 6: Distribution of active tuberculosis cases (new and re-treatment) by origin, Canada, 2015
Text description: Figure 6
Figure 6: Distribution of active tuberculosis cases (new and re-treatment) by origin, Canada, 2015
| Category | TB Cases (n) |
|---|---|
| Canadian-born Indigenous | 281 |
| Canadian-born Non-Indigenous | 170 |
| Foreign-born | 1169 |
| Unknown | 19 |
| Inuit | 113 |
| First Nations | 156 |
| Métis | 12 |
Indigenous peoples
Canadian-born Indigenous people comprise three distinct populations: First Nations, Inuit and Métis. In 2015, of the 281 reported Canadian-born Indigenous cases, 56% (156) were First Nations, 40% (113) were Inuit and four percent (12) were Métis (Figure 6).
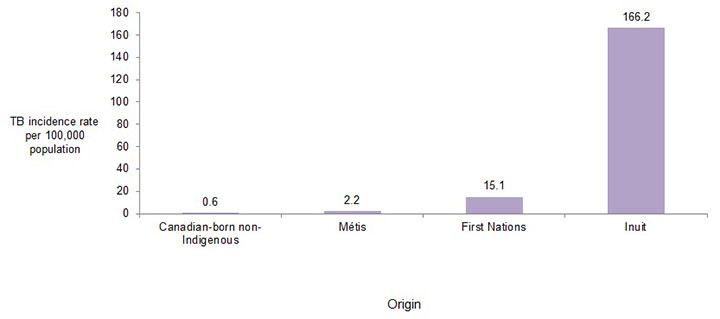
In 2015, compared to the incidence rate of 0.6 per 100,000 population in the Canadian-born non-Indigenous population, the incidence rate among the Métis (2.2 per 100,000 population) was almost four times higher and the incidence rate among First Nations (15.1 per 100,000 population) was 25 times higher. The highest incidence rate across all origin groups was among the Inuit at 166.2 per 100,000 population, a rate which was over 270 times higher than the rate in the Canadian-born non-Indigenous population (Figure 7).
Figure 7: Tuberculosis incidence rate per 100,000 population by origin, Canada, 2015
Text description: Figure 7
Figure 7: Tuberculosis incidence rate per 100,000 population by origin, Canada, 2015
| Origin | Rate per 100,000 population |
|---|---|
| Canadian-born non-Indigenous | 0.6 |
| Métis | 2.2 |
| First Nations | 15.1 |
| Inuit | 166.2 |
Foreign-born cases by region and country of birth
In 2015, there were 1,169 foreign-born cases of TB reported in Canada which represents an incidence rate of 14.8 per 100,000, nine times higher than the rate in the Canadian-born population (1.6 per 100,000 population).
Based on their country of birth, foreign-born cases were grouped into one of nine epidemiological regions as defined by the STOP TB Partnership/World Health Organization Footnote 9. Of the 1,169 foreign-born TB cases in 2015, 42% (495) were born in the Western Pacific Region and 26% (303) were born in south-east regions of Asia. Most foreign-born cases diagnosed in Canada are in people whose birth country is considered by the World Health Organization to be a high-burden TB country. Approximately 60% of all foreign-born cases were born in the Philippines, India, China, Vietnam and Pakistan (data not shown). In 2015, the highest incidence rate at 41.5 per 100,000 population was among individuals born in the region of Africa with a high HIV prevalence (Supplementary Table 4 Footnote 5).
Diagnostic classification
Active TB disease is classified as either respiratory or non-respiratory. Respiratory TB includes pulmonary TB, TB of the pleura and TB of the intrathoracic or mediastinal lymph nodes, larynx, nasopharynx, nose and sinuses. Primary disease, a disease state characterized by pleuritis and pleural effusion (usually in an adolescent or young adult, but possibly in any age group, due to recent [within preceding 24 months] infection with M. tuberculosis complex) is also captured under the respiratory classification. Non-respiratory TB refers to all other disease sites.
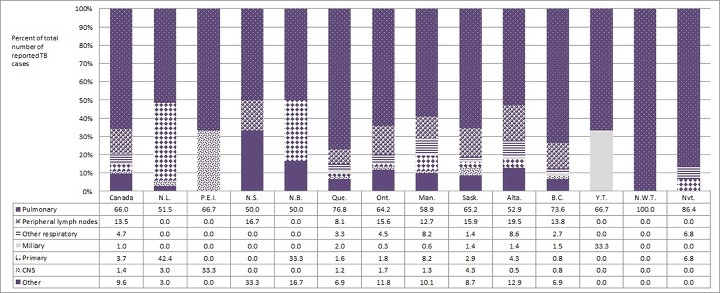
Between 2005 and 2015, respiratory disease accounted for 76% (13,745/17,975) of all diagnosed TB cases in Canada (Supplementary Table 5 Footnote 5). In 2015, 66% of reported cases were diagnosed with pulmonary TB. Pulmonary disease was the most frequently reported diagnostic classification in all provinces and territories. Peripheral lymph node TB remained the second most frequently reported diagnostic site. Overall, four percent (60) of reported cases were diagnosed with primary TB. However, 42% (1433) of the cases reported from Newfoundland and Labrador were diagnosed with primary TB (Figure 8). See additional data in Supplementary Table 6 Footnote 5.
Figure 8: Distribution of reported tuberculosis cases by main diagnostic classification: Canada, provinces and territories, 2015
Text description: Figure 8
Figure 8: Distribution of reported tuberculosis cases by main diagnostic classification: Canada, provinces and territories, 2015
| Diagnostic classification | Canada | N.L. | P.E.I. | N.S. | N.B. | Que. | Ont. | Man. | Sask. | Alta. | B.C. | Y.T. | N.W.T. | Nvt. | |
|---|---|---|---|---|---|---|---|---|---|---|---|---|---|---|---|
| Respiratory | Other | 9.6 | 3.0 | 0.0 | 33.3 | 16.7 | 6.9 | 11.8 | 10.1 | 8.7 | 12.9 | 6.9 | 0.0 | 0.0 | 0.0 |
| CNS | 1.4 | 3.0 | 33.3 | 0.0 | 0.0 | 1.2 | 1.7 | 1.3 | 4.3 | 0.5 | 0.8 | 0.0 | 0.0 | 0.0 | |
| Primary | 3.7 | 42.4 | 0.0 | 0.0 | 33.3 | 1.6 | 1.8 | 8.2 | 2.9 | 4.3 | 0.8 | 0.0 | 0.0 | 6.8 | |
| Non-Respiratory | Miliary | 1.0 | 0.0 | 0.0 | 0.0 | 0.0 | 2.0 | 0.3 | 0.6 | 1.4 | 1.4 | 1.5 | 33.3 | 0.0 | 0.0 |
| Other respiratory | 4.7 | 0.0 | 0.0 | 0.0 | 0.0 | 3.3 | 4.5 | 8.2 | 1.4 | 8.6 | 2.7 | 0.0 | 0.0 | 6.8 | |
| Peripheral lymph nodes | 13.5 | 0.0 | 0.0 | 16.7 | 0.0 | 8.1 | 15.6 | 12.7 | 15.9 | 19.5 | 13.8 | 0.0 | 0.0 | 0.0 | |
| Pulmonary | 66.0 | 51.5 | 66.7 | 50.0 | 50.0 | 76.8 | 64.2 | 58.9 | 65.2 | 52.9 | 73.6 | 66.7 | 100.0 | 86.4 | |
Treatment outcomes for 2014
Details on treatment outcome were available for 97% (1,562/1,614) of all reported cases of active TB disease in 2014 (Supplementary Table 7 Footnote 5). Of the cases for which treatment outcome data were available:
- 85% (1,328) were cured or had completed treatment;
- eight percent (119) died before or during treatment;
- two percent (28) had moved outside of the reporting jurisdiction before completing treatment;
- less than one percent (11) were reported as other (four were non-compliant, three refused treatment, one discontinued due to pregnancy and for the remaining three, "other outcome" was not specified);
- less than one percent (13) were lost to follow-up;
- less than one percent (nine) stopped treatment due to an adverse reaction; and
- three percent (54) were reported as treatment ongoing.
Discussion
The number of TB cases reported annually in Canada has remained relatively stable since 2005, averaging approximately 1,630 cases per year. In 2015, 1,639 cases of active TB disease were reported, representing a slight increase from the number of cases reported in 2014 (1,614) and a corresponding increase in the incidence rate from 4.5 per 100,000 to 4.6 per 100,000 population. Although the incidence rate of TB remains highest in Nunavut, 2015 saw a noticeable decrease in both the number of reported cases and the overall incidence rate. On the other hand, Newfoundland and Labrador experienced a significant outbreak of TB in 2015, resulting in an increase in the reported number of TB cases and a corresponding increase in the overall incidence rate. Continuous monitoring is needed to determine if these changes indicate ongoing trends.
Overall, no changes were noted in the distribution of cases by age group, sex or diagnostic site of disease. In 2015, foreign-born individuals continued to account for most reported TB cases, but the incidence rate remained highest among Canadian-born Indigenous people and in particular within the Inuit population. Pulmonary TB remained the most commonly reported site of disease in 2015 and available treatment outcome data for cases reported in 2014 indicated that 85% of cases had been cured or had completed treatment.
The data in this report are considered provisional and subject to change in future iterations of Tuberculosis in Canada surveillance reports. Differences between the data published in this report and the data published in previous national, provincial and territorial surveillance reports may be due to reporting delays or differences in when the data were extracted from the various surveillance databases. The reporting province or territory may update its published data on a more regular basis. Should differences exist between this report and provincial or territorial reports, readers are encouraged to contact the provincial/territorial jurisdiction for clarification.
A few limitations should be considered. Because the CTBRS is a passive surveillance system, it relies on data collected retrospectively from medical and laboratory records as opposed to active case solicitation. As a result, it is difficult to ascertain whether all people with active TB disease are being identified and reported. The World Health Organization estimates, however, that Canada's surveillance system has a case detection rate of 90% with a range of uncertainty of 78% to 100% Footnote 1. The accuracy of the data is partially a function of timely reporting and updates to PHAC from the provinces and territories. Some degree of lag does occur (i.e. creating a reporting delay). Like all surveillance data, the data in this report may be subject to occasional coding, reporting and processing errors. Over 95% of data elements are complete for most demographic and clinic data.
Compared with other G7 countries (France, Germany, Great Britain, Italy, Japan and the United States of America) Canada has the second lowest TB rate after the United States of America Footnote 1. Annual updates on the number of cases of active TB in Canada and corresponding incidence rates are important in monitoring progress toward the goal of reducing the burden of TB in Canada. As the primary source of national data on TB cases, the data within this report provides timely information for public health action, as well as policy and program development and assessment.
Acknowledgements
The Public Health Agency of Canada would like to acknowledge the following individuals from the provincial and territorial TB programs for their contribution to and participation in the CTBRS:
- Brenda P. Earles, Health and Community Services, Population Health Branch, Newfoundland and Labrador
- Jennifer Phillips, Health and Community Services, Population Health Branch, Newfoundland and Labrador
- Carolyn Sandford, Prince Edward Island Department of Health and Wellness
- Stacey Burns, Prince Edward Island Department of Health and Wellness
- Beverly A. Billard, Nova Scotia Department of Health and Wellness
- Suzanne Savoie, New Brunswick Department of Health
- Hanan Smadi, New Brunswick Department of Health
- Paul Rivest, Direction régionale de santé publique de Montréal, Quebec
- Maria-Constanza Street, Direction régionale de santé publique de Montréal, Quebec
- Michael Whelan, Public Health Ontario
- Cecilia Fung, Public Health Ontario
- Robert Wang, Manitoba Health
- Sharon Fletcher, Manitoba Health
- Helen Bangura, Saskatchewan Ministry of Health
- Valerie Mann, Saskatchewan Ministry of Health
- Assaad Al-Azem, TB Prevention and Control Saskatchewan
- Rosa Maheden, Alberta Health
- Celine O'Brien, Alberta Health
- Myrna Fleischauer, Alberta Health Services
- Faye Hutton, British Columbia Centre for Disease Control
- Gloria Mui, British Columbia Centre for Disease Control
- David Roth, British Columbia Centre for Disease Control
- Beth Roberts, Yukon Communicable Disease Control
- Lori Strudwick, Yukon Communicable Disease Control
- Caroline NewBerry, Department of Health and Social Services, Northwest Territories
- Karen Hollett, Department of Health and Social Services, Northwest Territories
- Elaine Randell, Nunavut Department of Health
Conflict of interest
None.
Funding
This work was supported by the Public Health Agency of Canada as part of its core mandate.